1. Introduction
Polymer electrolyte membrane (PEM) fuel cells certainly are a viable way towards clean and efficient energy conversion, in particular, when hydrogen from renewable sources is utilized. With numerous prospective stationary, mobile and portable applications, their broad commercialization, however, has not yet taken place. This is mainly due to their high cost and limited durability. Corrosion of the carbonaceous support materials is a severe drawback, since it will lead to the loss of electrode porosity and eventually of Pt nanoparticles and thus catalytically active surface. That is why the search for novel and more durable support materials as an alternative to the currently-applied high-surface area carbons is a very active field of research.
Both electron conducting polymers and oxides have been proposed in the literature, such as polyaniline [
1,
2,
3,
4], doped titanium oxides [
5,
6,
7,
8] and doped tin oxides [
9,
10]. But while these materials often show promising stabilities, their electron conductivities are comparatively low. And because of their low surface area, they cannot easily be manufactured into porous electrodes [
11]. Ways to prevent these drawbacks are the fabrication of composite electrodes, as shown exemplary by Ma
et al. [
12], Kakaei [
13], and Lee
et al. [
14], or the use of advanced fabrication techniques adapted to the specifics of the new materials, such as electrospinning of polymer-oxide mixtures [
15].
Non-oxide ceramics are another group of materials, which seem fit to replace the commonly applied carbonaceous supports. Important compounds of this group, which show both electrical conductivity and high chemical and thermal stability, are tungsten carbide, titanium nitride and titanium diboride [
16,
17,
18,
19]. Decorated with Pt nanoparticles, all of them have demonstrated sufficient catalytic activity for the relevant electrochemical oxygen reduction reaction (ORR) at the fuel cell cathode. Moreover, their stability at high potentials significantly surpassed the stability of carbon-supported nanoparticles.
However, one general shortcoming in the investigation of novel materials for fuel cell cathodes is that the tailored catalysts are often only tested in an aqueous electrochemical cell in acidic media. While this set-up allows for well-defined testing conditions with the catalyst’s situation largely comparable to real-life studies, effects induced by subjecting the electrocatalyst to an oxygen atmosphere at the cathode side may be missed. The same is true for changes introduced by the flow of current between the electrodes [
20].
In 2010, Mu
et al. [
21] described the application of TiB
2 as a possible support material for stable fuel cell catalysts for the first time. In their paper, they presented remarkable stability data in an accelerated stress test (AST). After 6000 cycles between 0 V and 1.2 V
vs. reversible hydrogen electrode (RHE) the loss of electrochemically active surface was four times less than for the standard Pt/C catalyst, although the dispersion of the Pt nanoparticles on the support grains required improvement. In 2011, the same group presented a more successful synthesis pathway for Pt nanoparticles on TiB
2 using Nafion™ ionomer as both surfactant and stabilizer for an improved dispersion [
19]. The results by Yin
et al. [
19] demonstrated an enhanced interaction between the Nafion-stabilized Pt nanoparticles and the non-oxide ceramic support. In addition to the catalyst’s excellent thermal stability and electrical conductivity, the ORR activity was comparable to the state-of-the-art Pt on carbon fuel cell catalyst.
In the present work, TiB
2-supported Pt nanoparticles for application at the cathode side of H
2/O
2 PEM fuel cells were synthesized using the method by Yin
et al. [
19]. Since the primary particle size of the TiB
2 is of importance for the final electrode fabrication and structuring, the TiB
2 synthesis route was modified to obtain support grains with sizes in the 0.1–10 μm range. This is not an easy task, as small particles are easily inflammable. X-ray diffraction (XRD) and transmission electron microscopy (TEM) were applied to reveal crystalline phases, platinum particle size and dispersion. X-ray diffraction was also used to follow changes in the crystalline part of the support material during electrode preparation and fuel cell testing. To determine the catalyst’s activity and stability cyclic voltammetry (CV) tests in an aqueous electrochemical cell were applied. Furthermore, the catalyst powders were prepared into inks, airbrushed onto a Nafion™ membrane and tested in a realistic PEM fuel cell environment. The latter was done to show that CV tests in aqueous electrochemical cells are not sufficient to indicate the stability of a novel material for fuel cell applications. Though time-consuming and tedious, it is required to also investigate the material’s behavior in a realistic fuel cell under operating conditions.
2.1. TiB2 Support Materials
Synthesis of the TiB2 powder was done by carbothermal reduction of titanium dioxide powder (TiO2—anatas structure, D50 = 0.68 μm) using boron carbide powder (B4C, D50 = 5.83 μm) and carbon (C—Carbon Black, D50 = 3.14 μm). A variation of the synthesis parameters, such as composition and furnace parameters, was necessary in order to produce support particles with reduced sizes. The goal was to be comparable with the standard carbon support material.
The carbothermal reduction reaction is a two-step process, as was confirmed by X-ray diffraction and previously described by Baca
et al. [
22]:
TiO2 (63.2 wt%) was mixed in ethanol with 22.3 wt % B4C and 14.5% C. The powder mixture was stirred and ultrasonicated to achieve good homogeneity. After drying at 75 °C for 8 h the mixture was heat-treated in a graphite furnace. The furnace was heated with constant power of 5 kW until 1050 °C, followed by a 200 K/h ramp up to 1400 °C and a holding time of one hour. The powder was jet milled (Noll GmbH, Bobingen, Germany) with a sifter cut off grain size of 6 μm (maximum particle size). Particle size distributions for raw as well as final powder were measured using a Mastersizer 2000 (Malvern Instruments Ltd., Malvern, Worcestershire, UK). The final TiB2 powder has a D50 size fraction with a particle size of 1.5 μm.
3. Results and Discussion
Nafion™-stabilized Pt nanoparticles on TiB
2 were synthesized by Yin
et al. [
19] synthesis and their structure investigated using XRD and TEM.
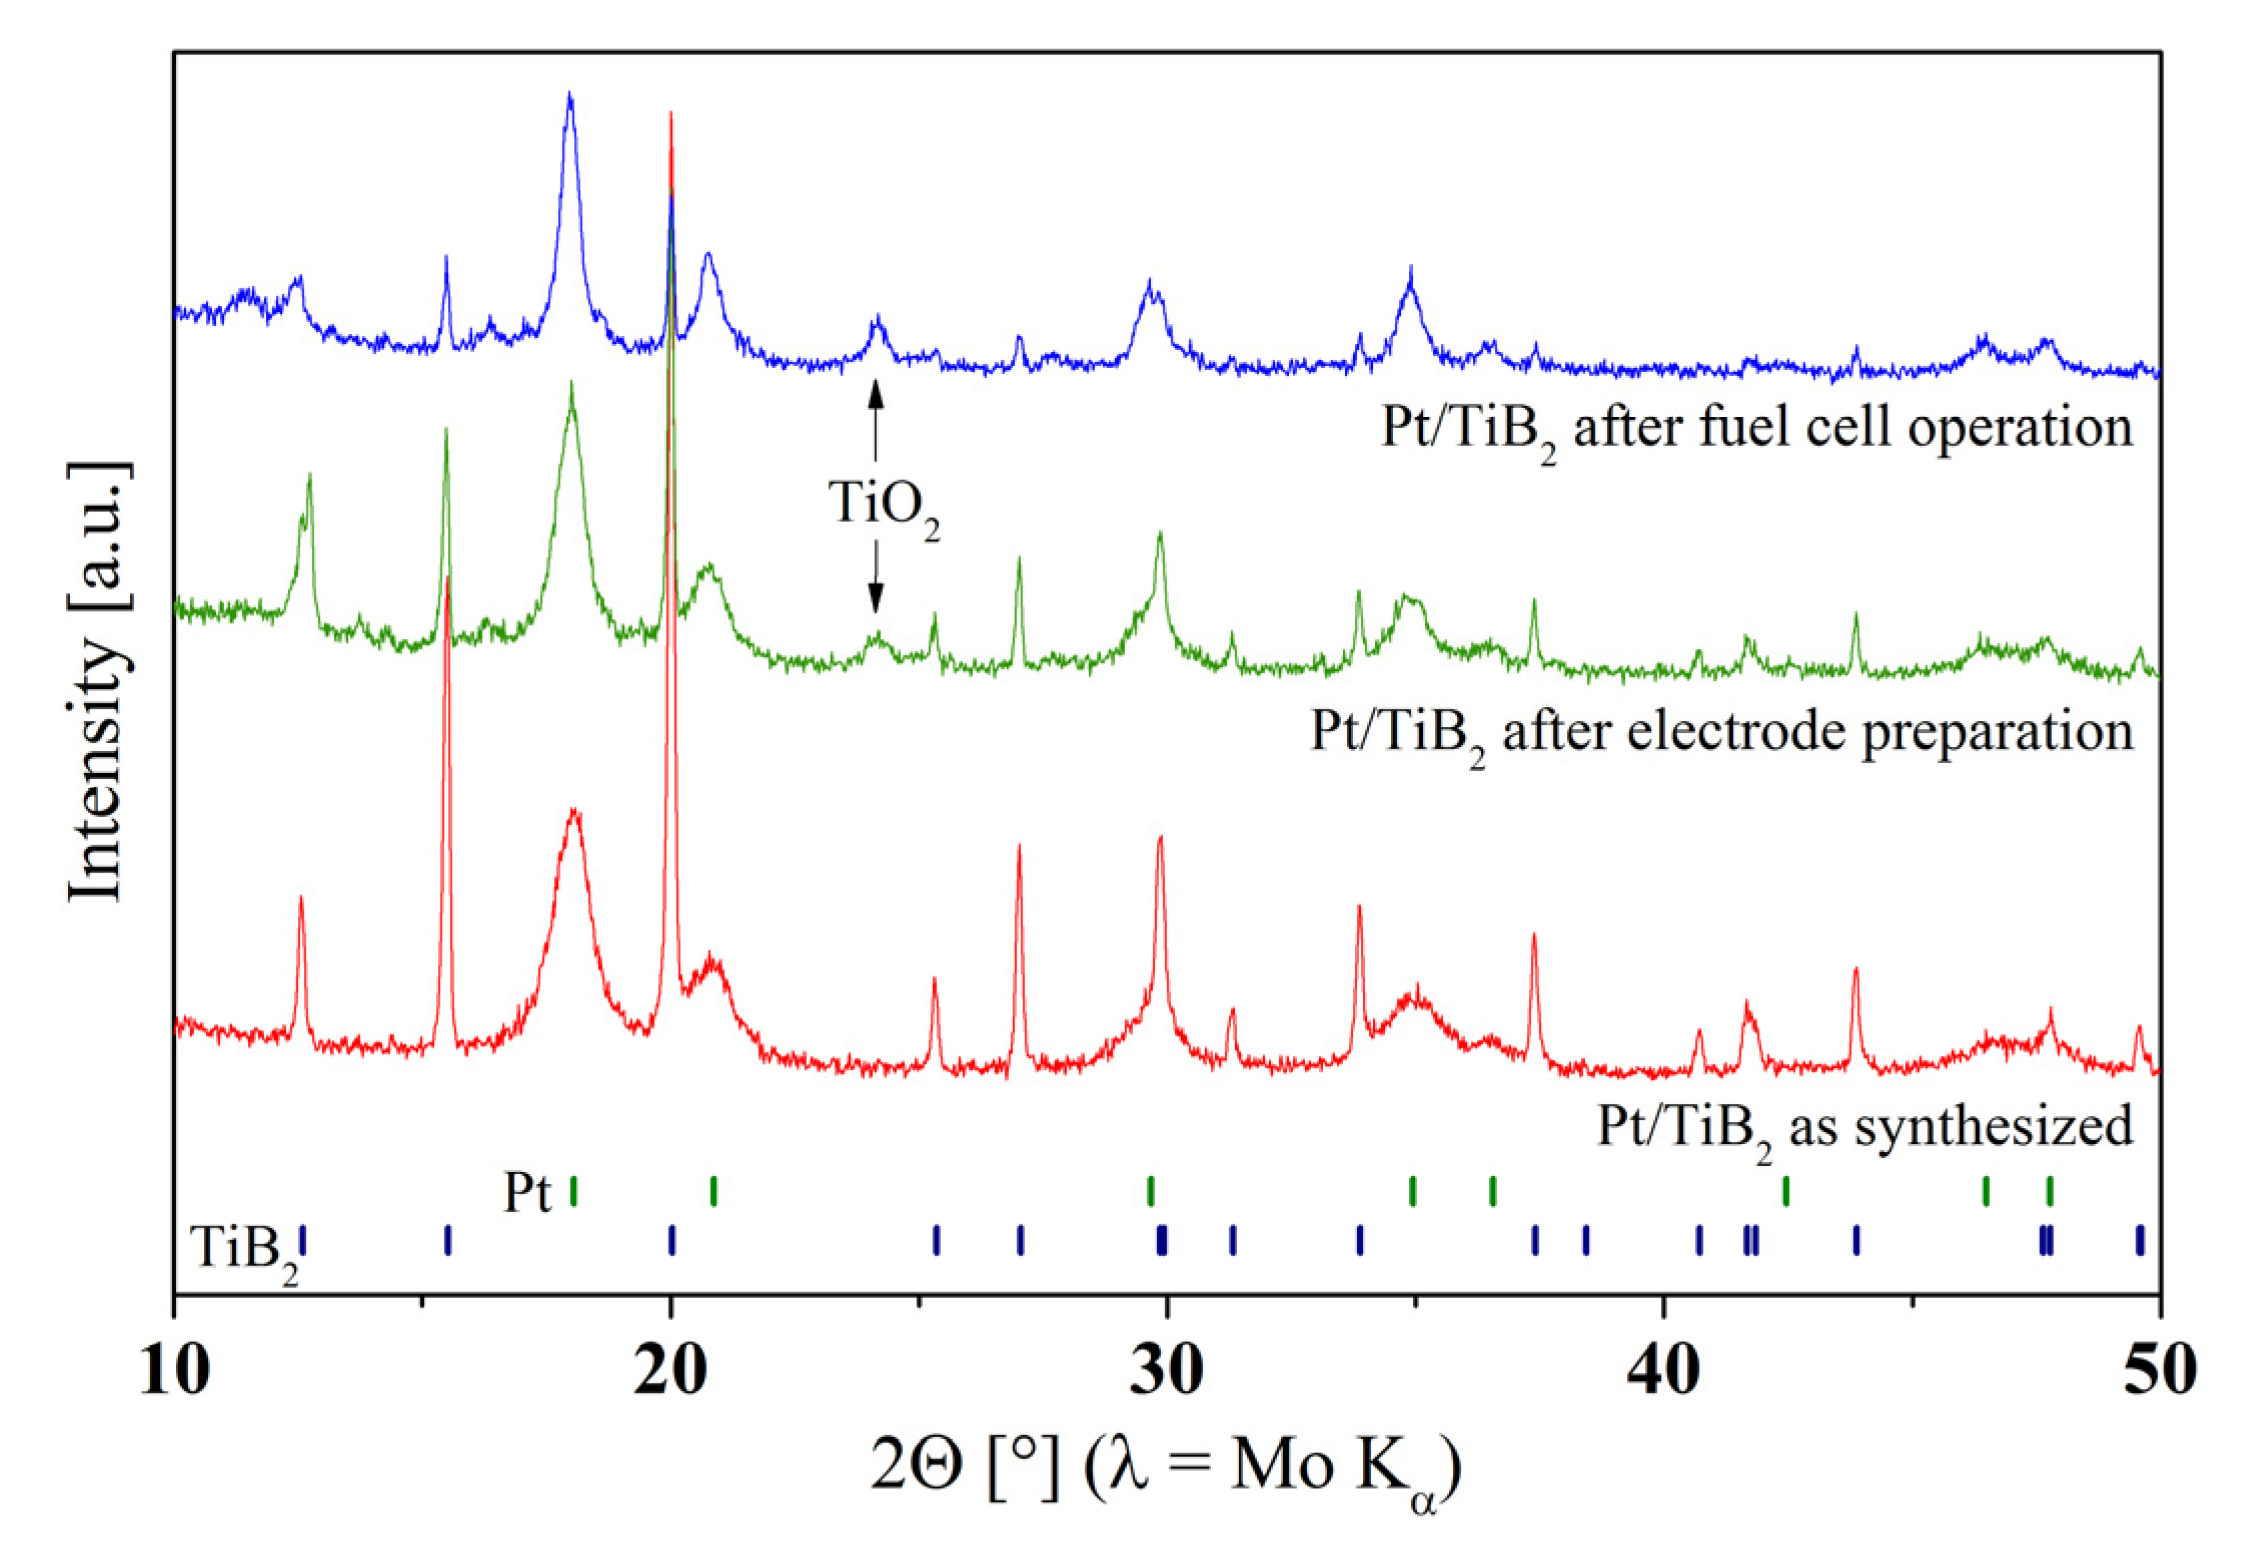
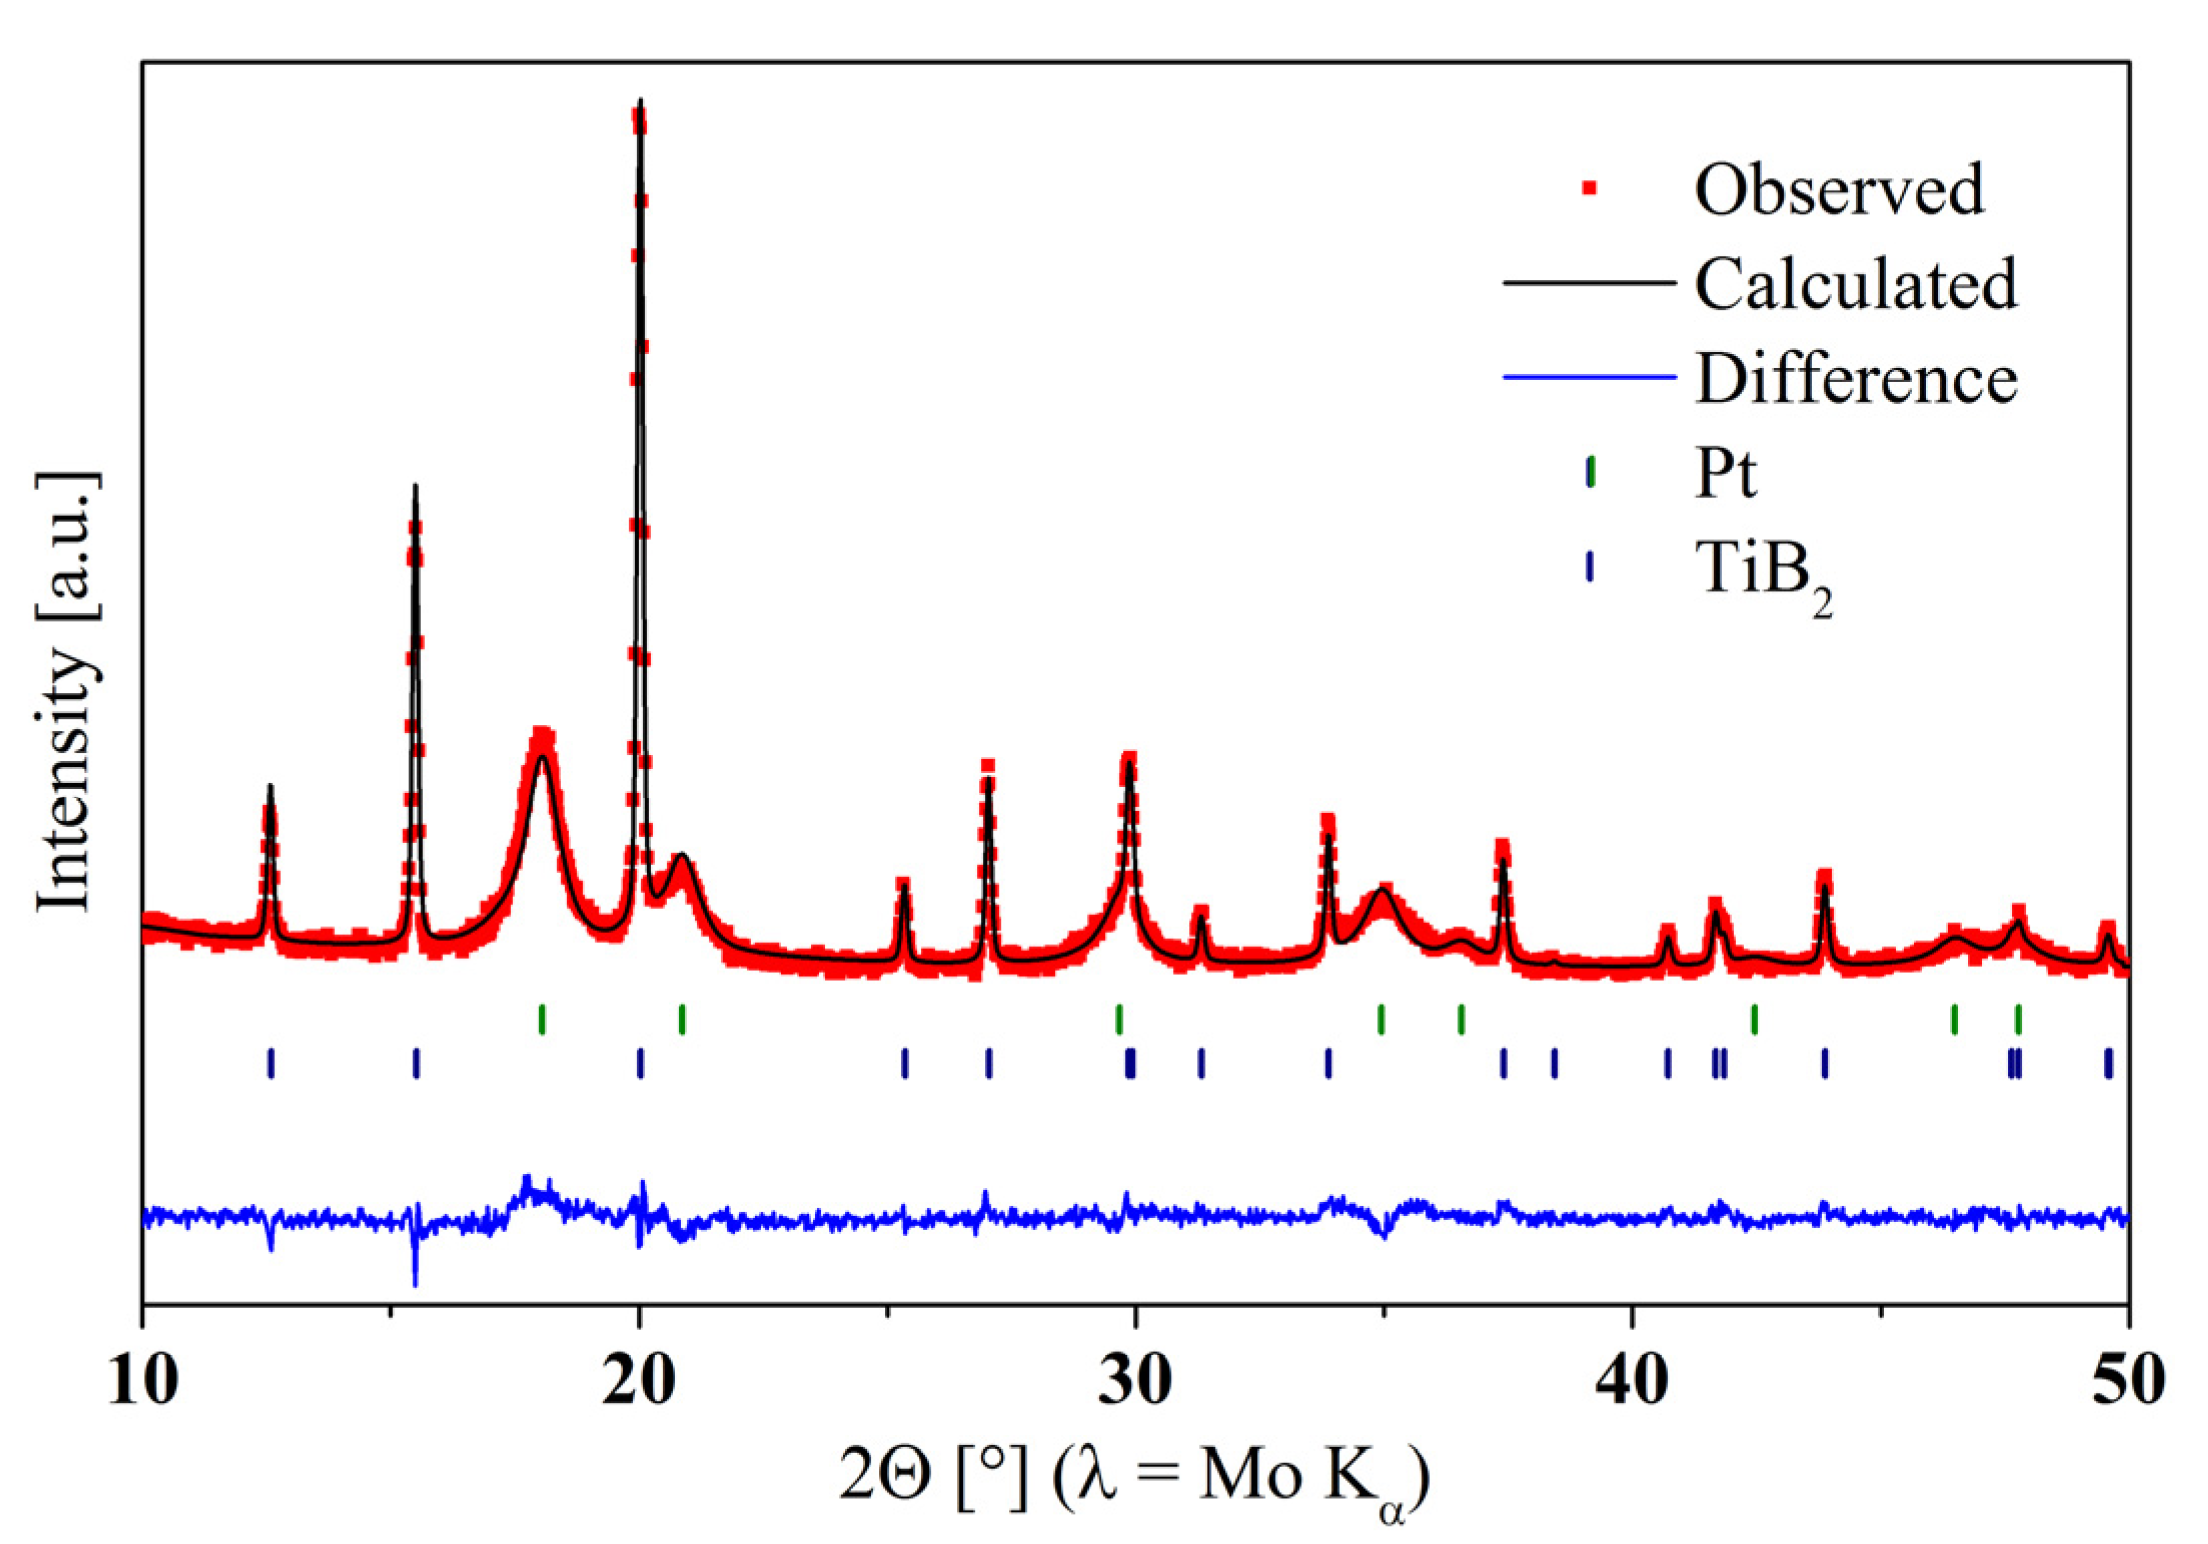
Figure 1 shows the diffraction pattern of the Pt nanoparticle decorated catalyst. The typical pattern of hexagonal titanium diboride is observed with sharp reflections in good agreement with grain sizes in the μm-range. After Pt nanoparticle decoration additional broad reflections typical of nm-sized fcc Pt appear. Rietveld refinement estimates an average Pt nanoparticle size of ≈5 nm.
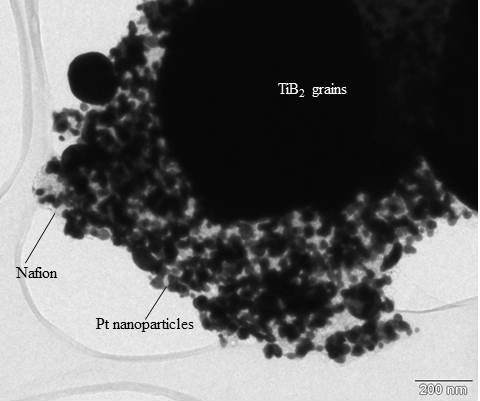
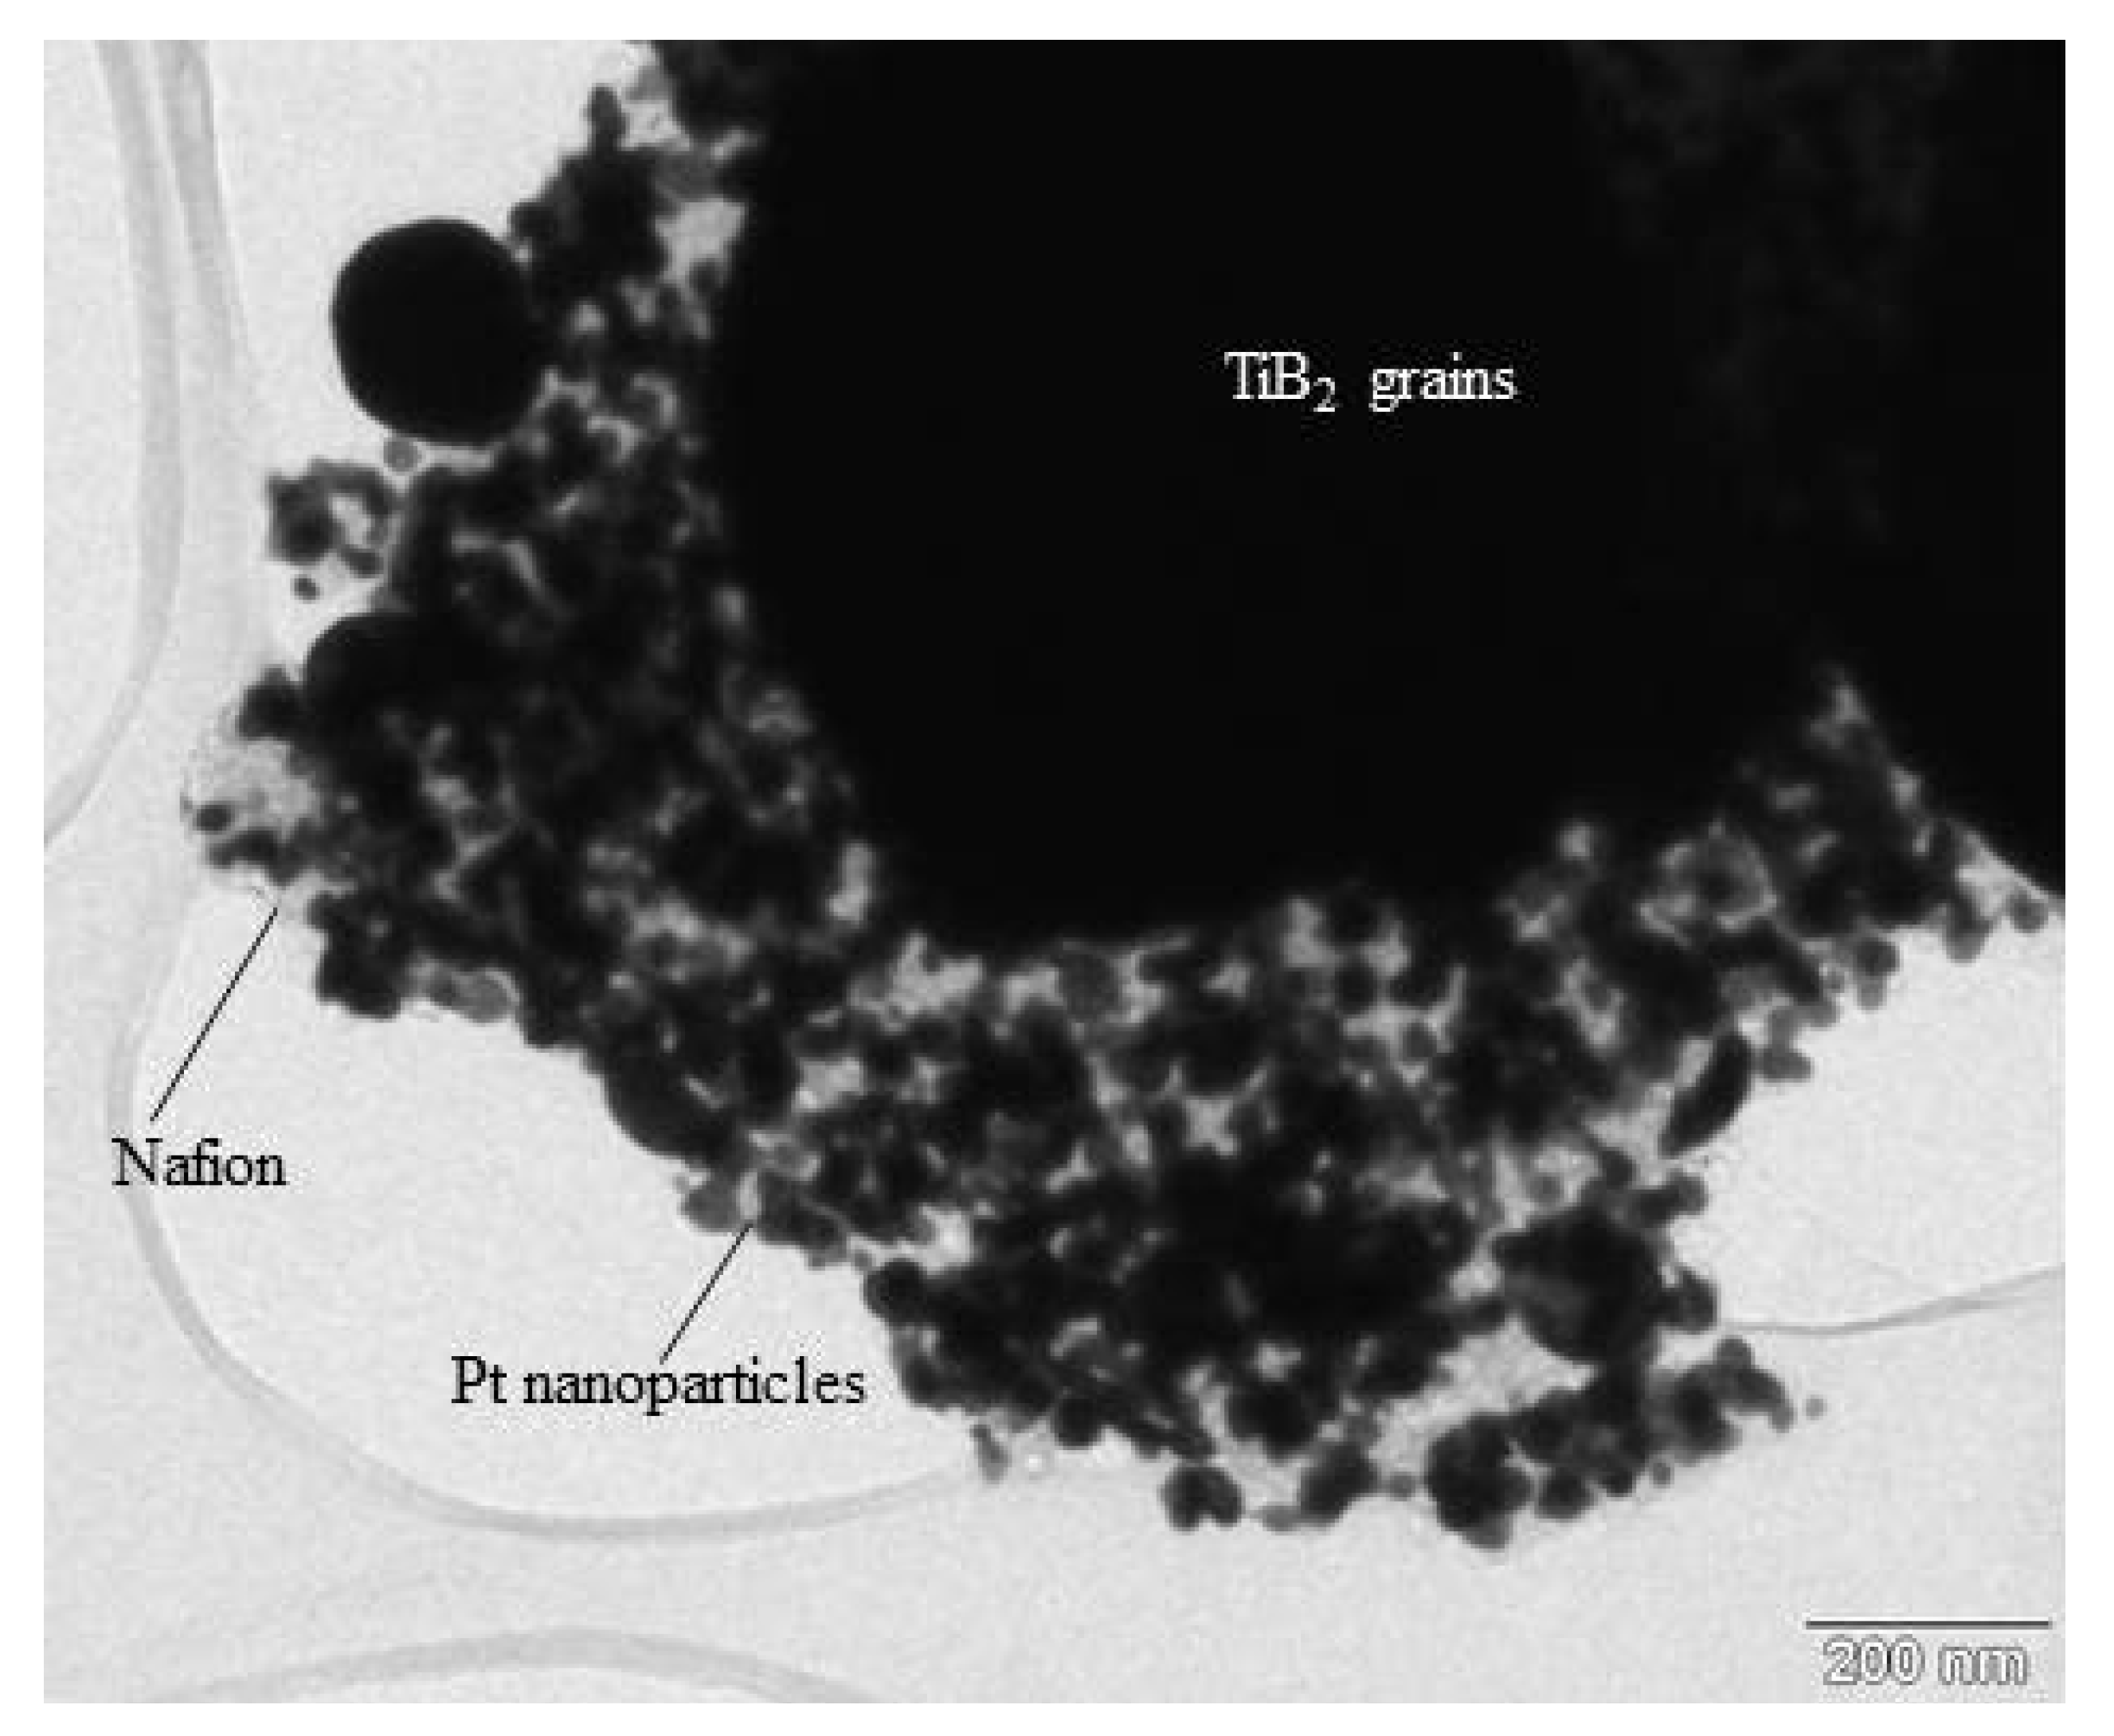
Figure 2 shows a transmission electron micrograph of the Pt-decorated titanium diboride support material. Nafion™-stabilized Pt nanoparticles can only be imaged at the edges of the μm-sized TiB
2 support grains. The support appears dark, as the electrons cannot penetrate through the thick material in the grain center. In higher resolution, the nanoparticles appear to be coated with a polymer film. The observed size of the Pt particles is in good agreement with the estimated value from X-ray diffraction measurements.
Figure 1.
X-ray diffraction pattern of Pt nanoparticles supported on TiB2. Both measured data and Rietveld refinement are shown. Sharp reflections belong to the support material, broad reflections can be attributed to the Pt nanoparticles. The Pt nanoparticle size is ≈5 nm.
Figure 1.
X-ray diffraction pattern of Pt nanoparticles supported on TiB2. Both measured data and Rietveld refinement are shown. Sharp reflections belong to the support material, broad reflections can be attributed to the Pt nanoparticles. The Pt nanoparticle size is ≈5 nm.
Figure 2.
Transmission electron micrograph of Pt/TiB2. Nafion™-stabilized Pt nanoparticles can only be imaged in thinner edge regions, as the μm-sized TiB2 grains are too thick to let electrons pass through the grain center. The average Pt particle size as ca. 5 nm embedded in a Nafion™ ionomer film.
As in previous works by Yin
et al. [
19] cyclic voltammetry was applied to assess the electrocatalytic activity and stability of the catalysts.
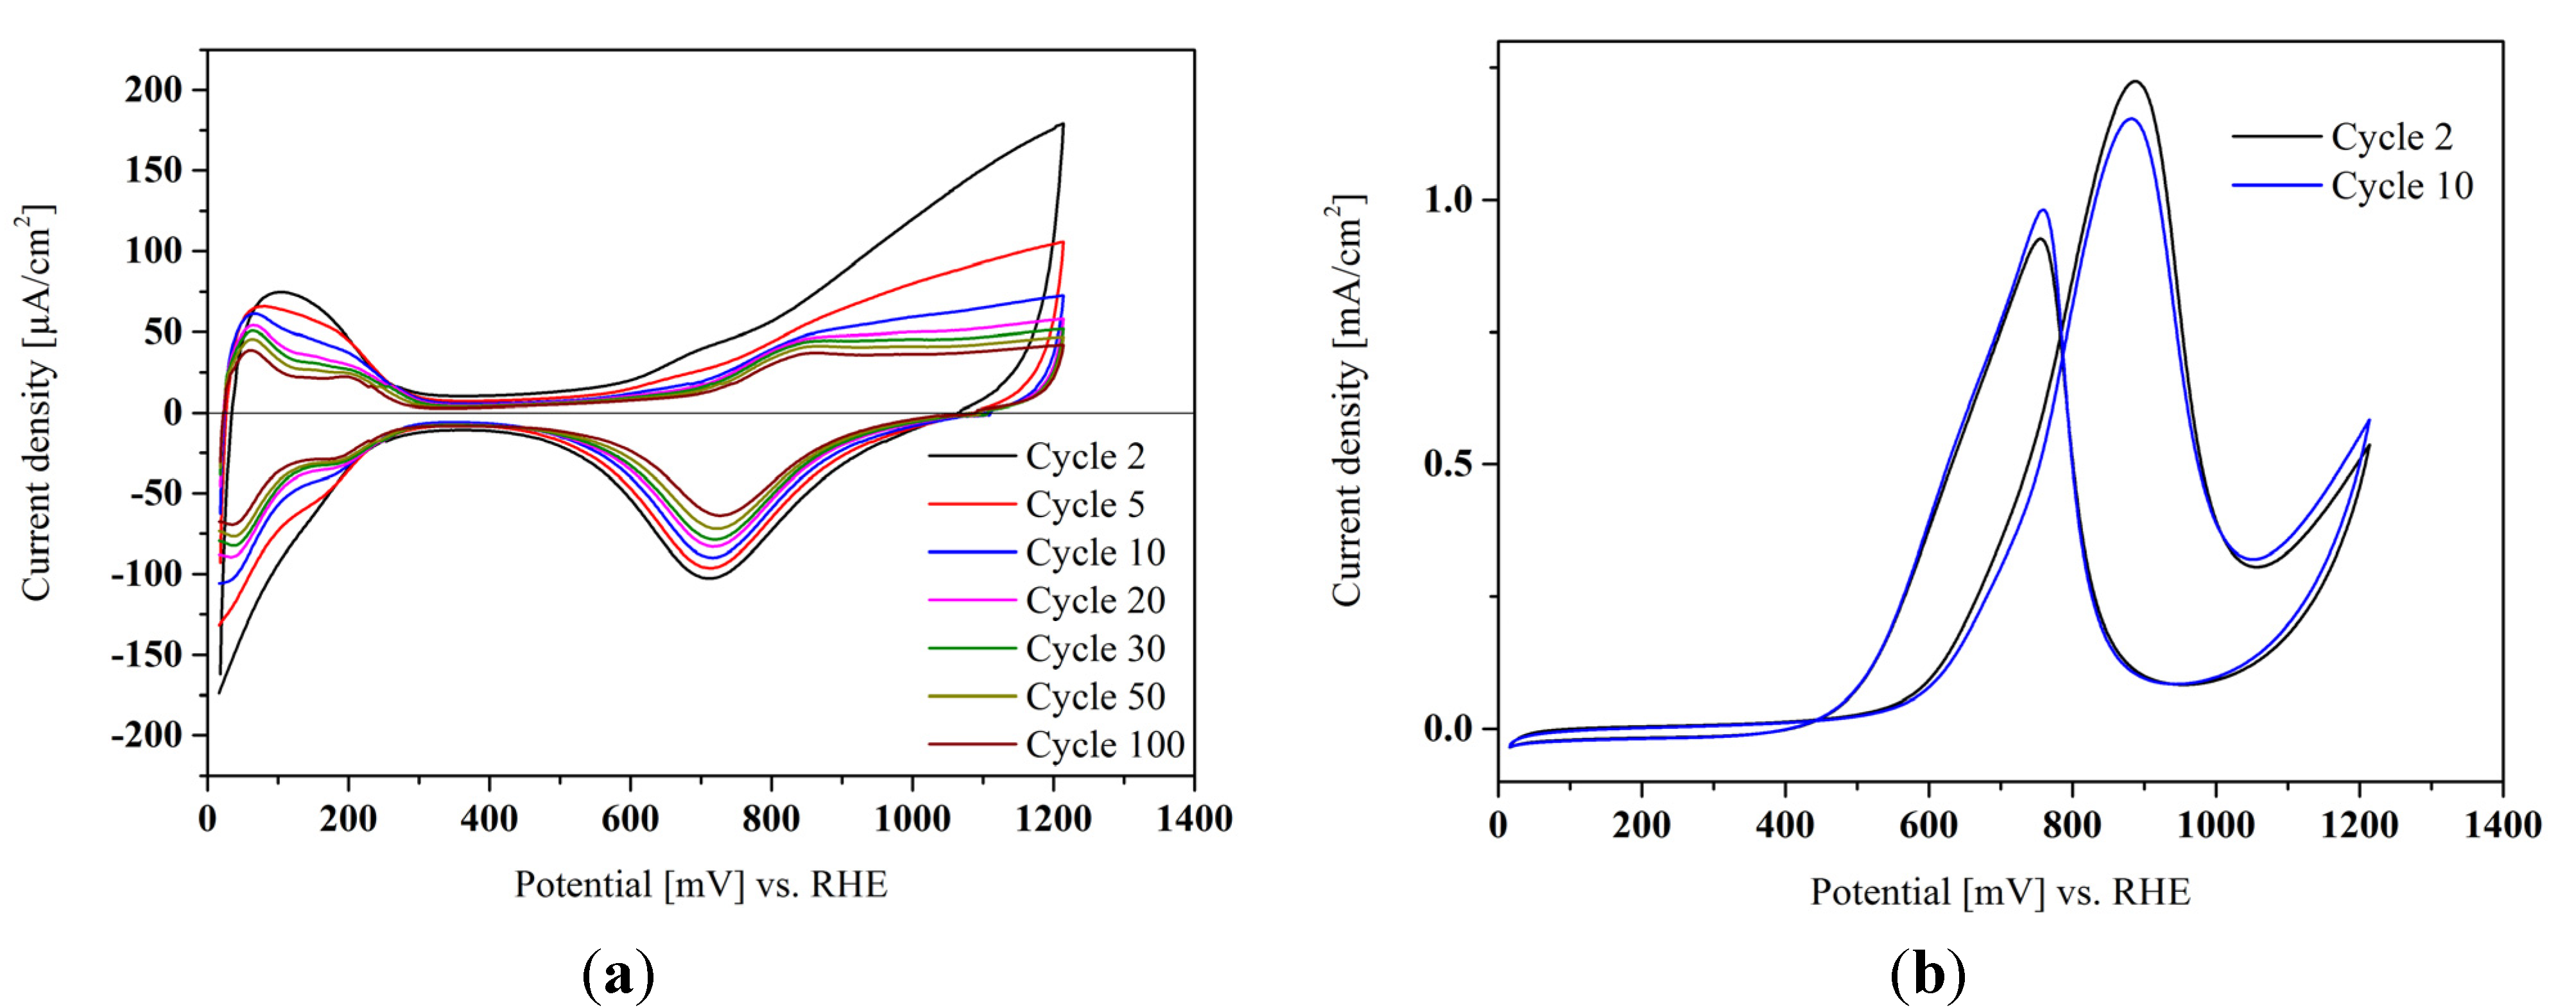
Figure 3a shows a base voltammogram of Pt/TiB
2 with the characteristic hydrogen and oxygen adsorption regions, which can be used to estimate the electrochemically active surface area (ECSA). In
Figure 3b, the activity of the Pt nanoparticles for methanol oxidation is demonstrated, indicating that the active Pt surface is not covered by strongly adsorbed impurities from the synthesis procedure and can be accessed sufficiently by reactants. Methanol was used as a probe molecule, as in contrast to the (for a cathode catalyst) more appropriate oxygen reduction reaction the electrode porosity only plays a minor role. Accelerated stress tests in an electrochemical cell (not shown) were in good agreement with literature data. Carbon-supported Pt loses ≈ 50% of its electrochemically active surface area (ECSA) during the stress test, whereas the ECSA of Pt/TiB
2 is only reduced by 1/3. However, a direct comparison is not easily possible, as the ECSA of the titanium boride-supported sample is much lower already at the beginning.
Figure 3.
(a) Base voltammogram of a Pt/TiB2 catalyst in 0.1 M perchloric acid showing the prominent Pt characteristics. Different sweeps are presented showing the loss of ECSA with extended cycling up to 100 cycles; (b) cyclic voltammogram of the same Pt/TiB2 catalyst in 1 M methanol solution as a reliable activity probe (black—second cycle, blue—10th cycle).
As pointed out in the Introduction section, though helpful for a first assessment of catalytic activity and stability, cyclic voltammetry and accelerated stress tests in an aqueous environment do not take into account the presence of oxygen at the cathode side and also not the elevated temperatures of 80 °C instead of room temperature. That is why we fabricated the Pt/TiB
2 electrocatalyst powder into an ink and sprayed porous electrodes for fuel cell tests in a more realistic environment. In
Figure 4, X-ray diffraction patterns of the as-synthesized Pt/TiB
2 powder (
Figure 4, bottom), of the powder scratched off directly after electrode preparation and no fuel cell test (
Figure 4, middle) and of the electrocatalyst scratched off from the electrode after extended fuel cell testing (
Figure 4, top) are compared. While the pattern of the as-synthesized powder can be fitted by plain TiB
2, in the other two data sets additional reflections appear. A particularly dominant peak is attributed to the (211) reflection of TiO
2 in its rutile structure. Part of the non-oxide support is already converted into a titanium oxide by the spraying process, before it is even tested in a fuel cell. Surface oxidation may take place due to the contact with Nafion™ at elevated temperatures. Compared to the standard Pt/C cathode catalyst, the novel Pt/TiB
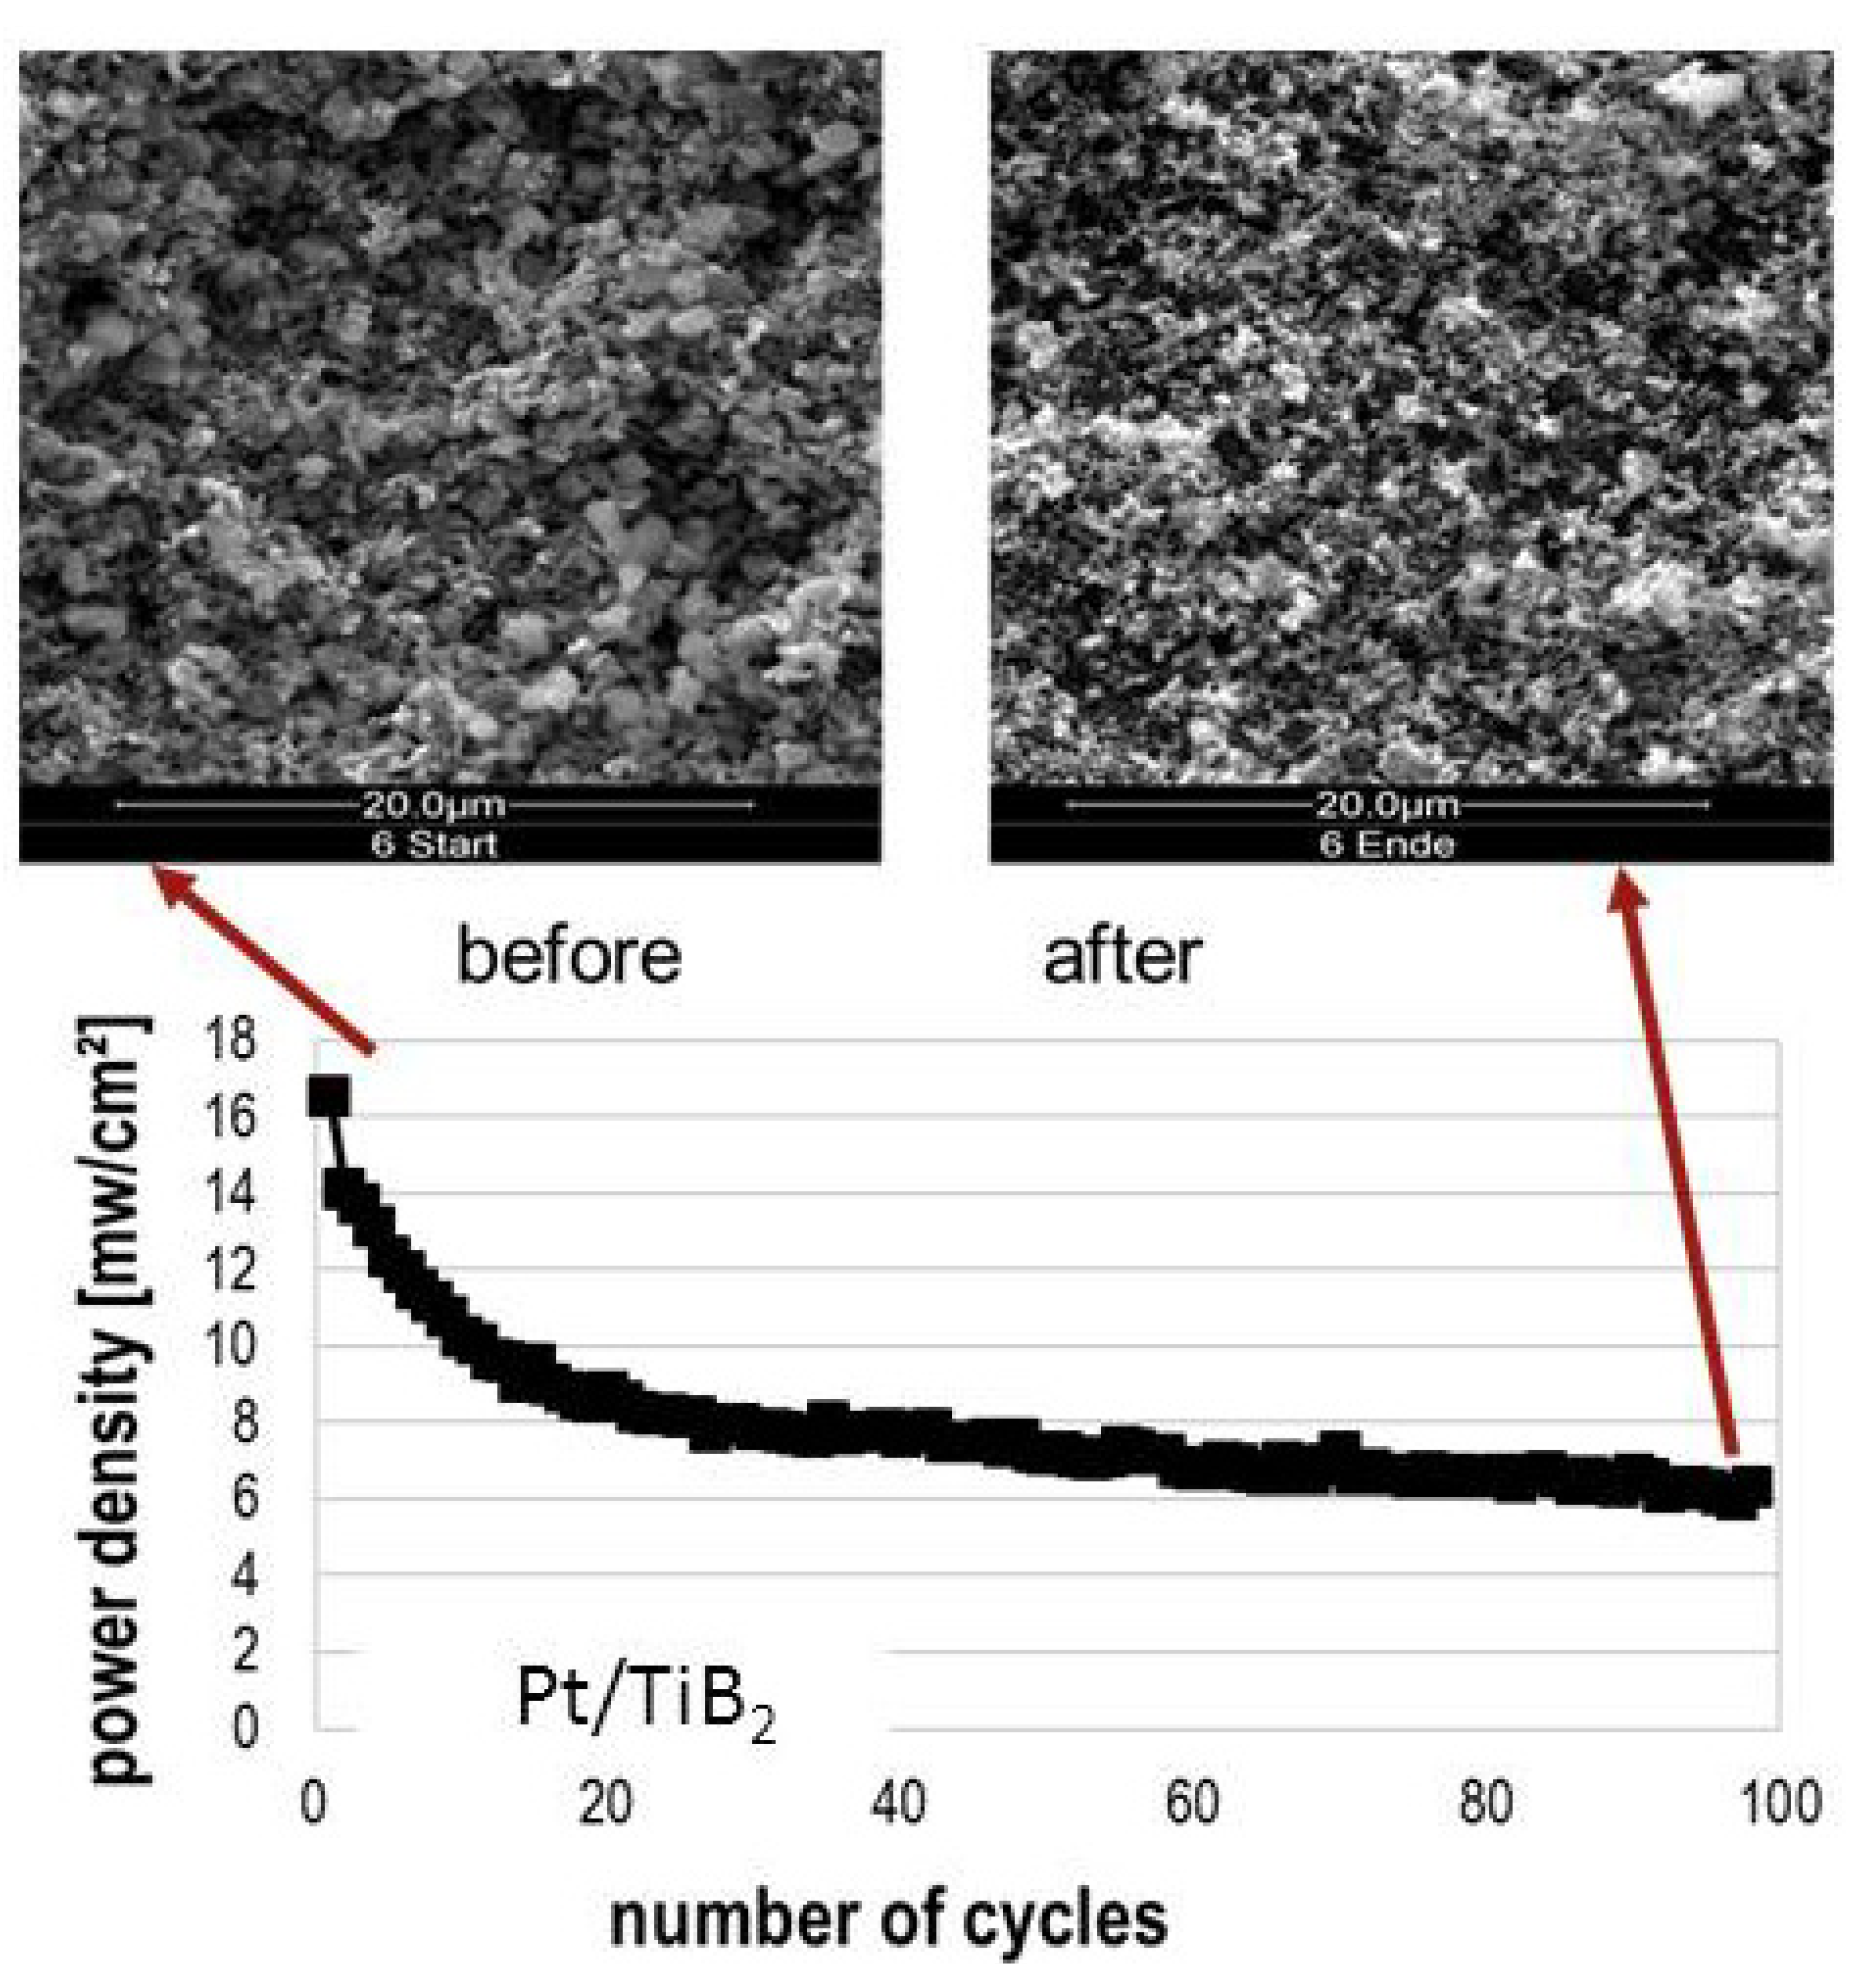
2 catalyst does not perform well in fuel cell tests. This could be due to an excess of Nafion™ ionomer from the catalyst synthesis, but also to the not-yet optimized fuel cell testing conditions. Current-voltage characteristics show a power maximum of max. 40 mW·cm
−2, in contrast to 160 mW·cm
−2 for the Pt-on-carbon reference measurement. After a short conditioning period, where the current increases, probably due to an increased hydration and thus improved proton conduction of the membrane, the cell’s power output declines steadily (
Figure 5). This may be correlated with the structural changes in the electrode, such as the oxidation of the support, which can also be seen in scanning electron micrographs before and after operation (
Figure 5). In particular, the electron conductivity of titanium sub-oxides may be significantly lowered as compared to TiB
2.
Figure 4.
Diffraction patterns of Pt/TiB2 powder as-synthesized (bottom), after preparation into a porous electrode with no fuel cell operation (middle), after fuel cell operation (top). While the as-synthesized support can be described by pure TiB2, the other diffraction patterns display an additional peak of the TiO2 rutile phase. TiB2 already starts to oxidize during the electrode fabrication step.
Figure 5.
Decline of power output during fuel cell operation and comparison of the corresponding SEM images before and after operation.
Figure 5.
Decline of power output during fuel cell operation and comparison of the corresponding SEM images before and after operation.
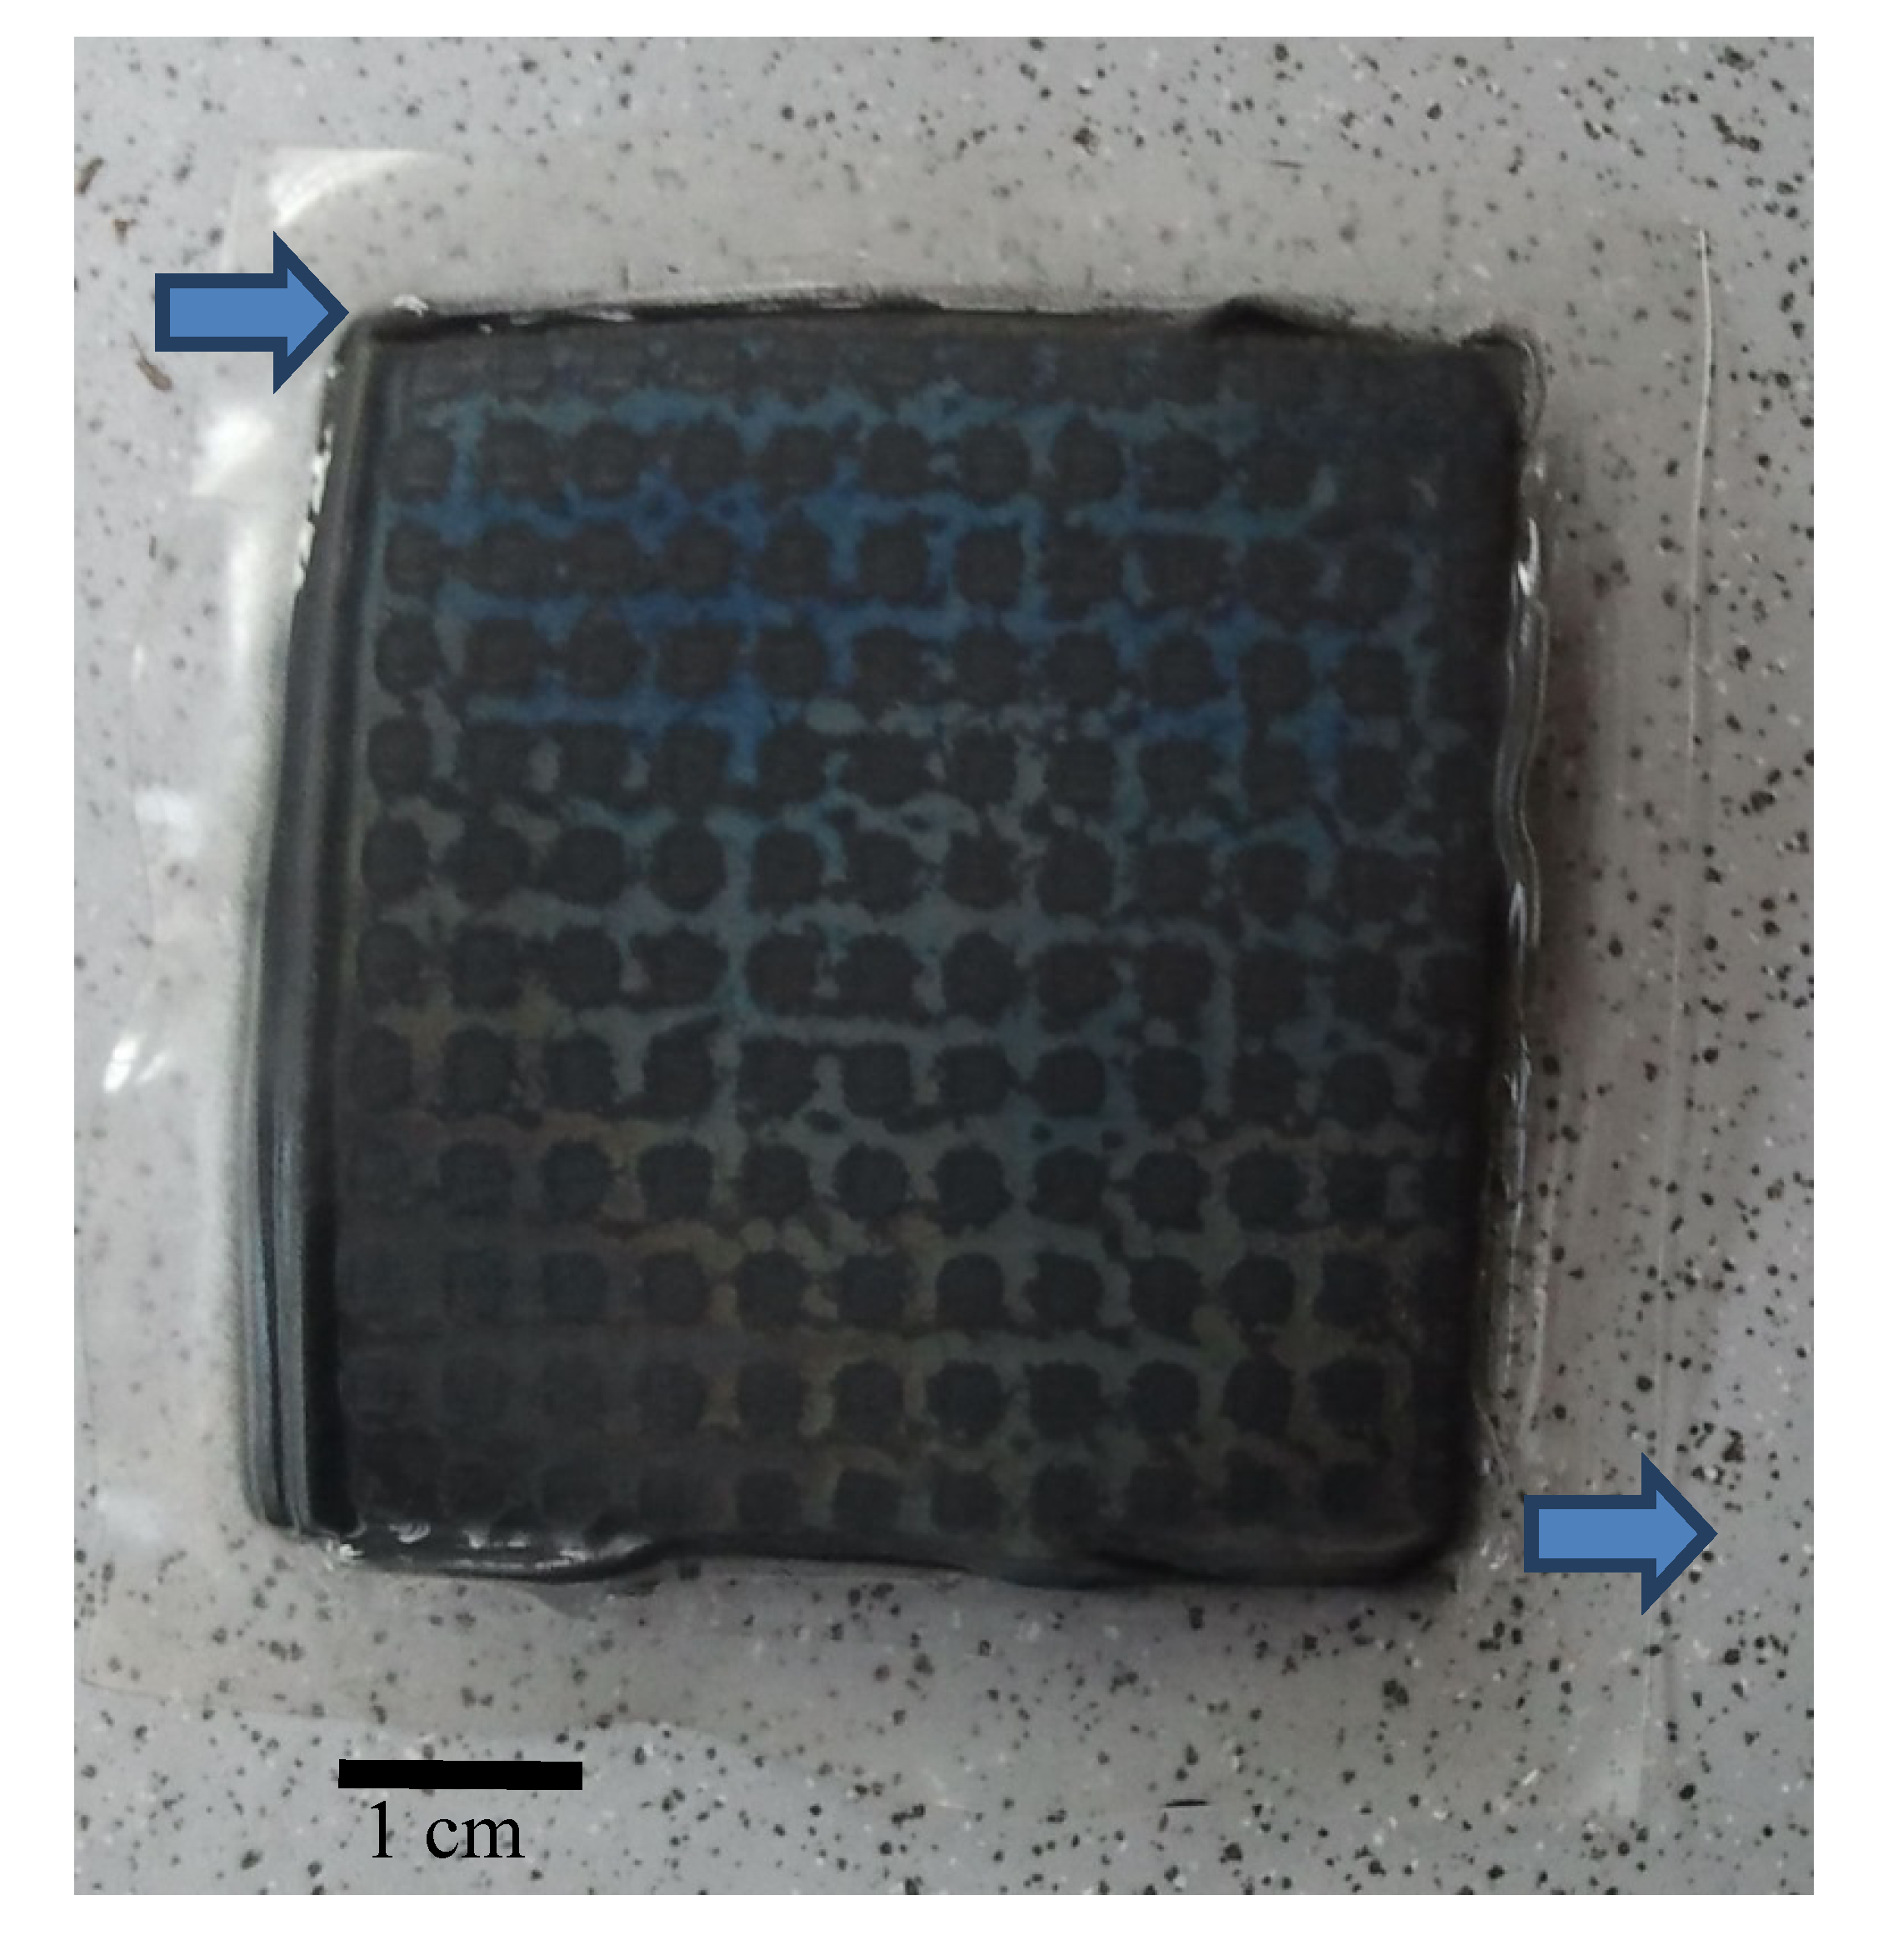
After operation in a fuel cell for at least 3 days and repeatedly taking E-i curves, the MEA was recovered and analyzed. Significant coloring of the previously black electrode can be observed already with the naked eye (
Figure 6). Lustrous blue, green and orange colors appear across the electrode indicating the formation of titanium oxides, either different phases or thicknesses. The most intense blue color can be seen close to the oxygen inlet, while the color changes to orange closer to the oxygen outlet. Obviously, most of the titanium diboride support has been transformed into titanium oxides in the presence of oxygen and high potentials at the cathode side. And the different colouring may also trace the cathode flow field and indicate oxygen starvation along the way.
Figure 6.
Photograph of TiB2 electrode after fuel cell test. Iridescent blue regions close to the oxygen inlet (top left) indicate where titanium diboride has been transformed into titanium oxide. At the oxygen outlet (bottom right), orange colors dominate.
Figure 6.
Photograph of TiB2 electrode after fuel cell test. Iridescent blue regions close to the oxygen inlet (top left) indicate where titanium diboride has been transformed into titanium oxide. At the oxygen outlet (bottom right), orange colors dominate.
