1. Introduction
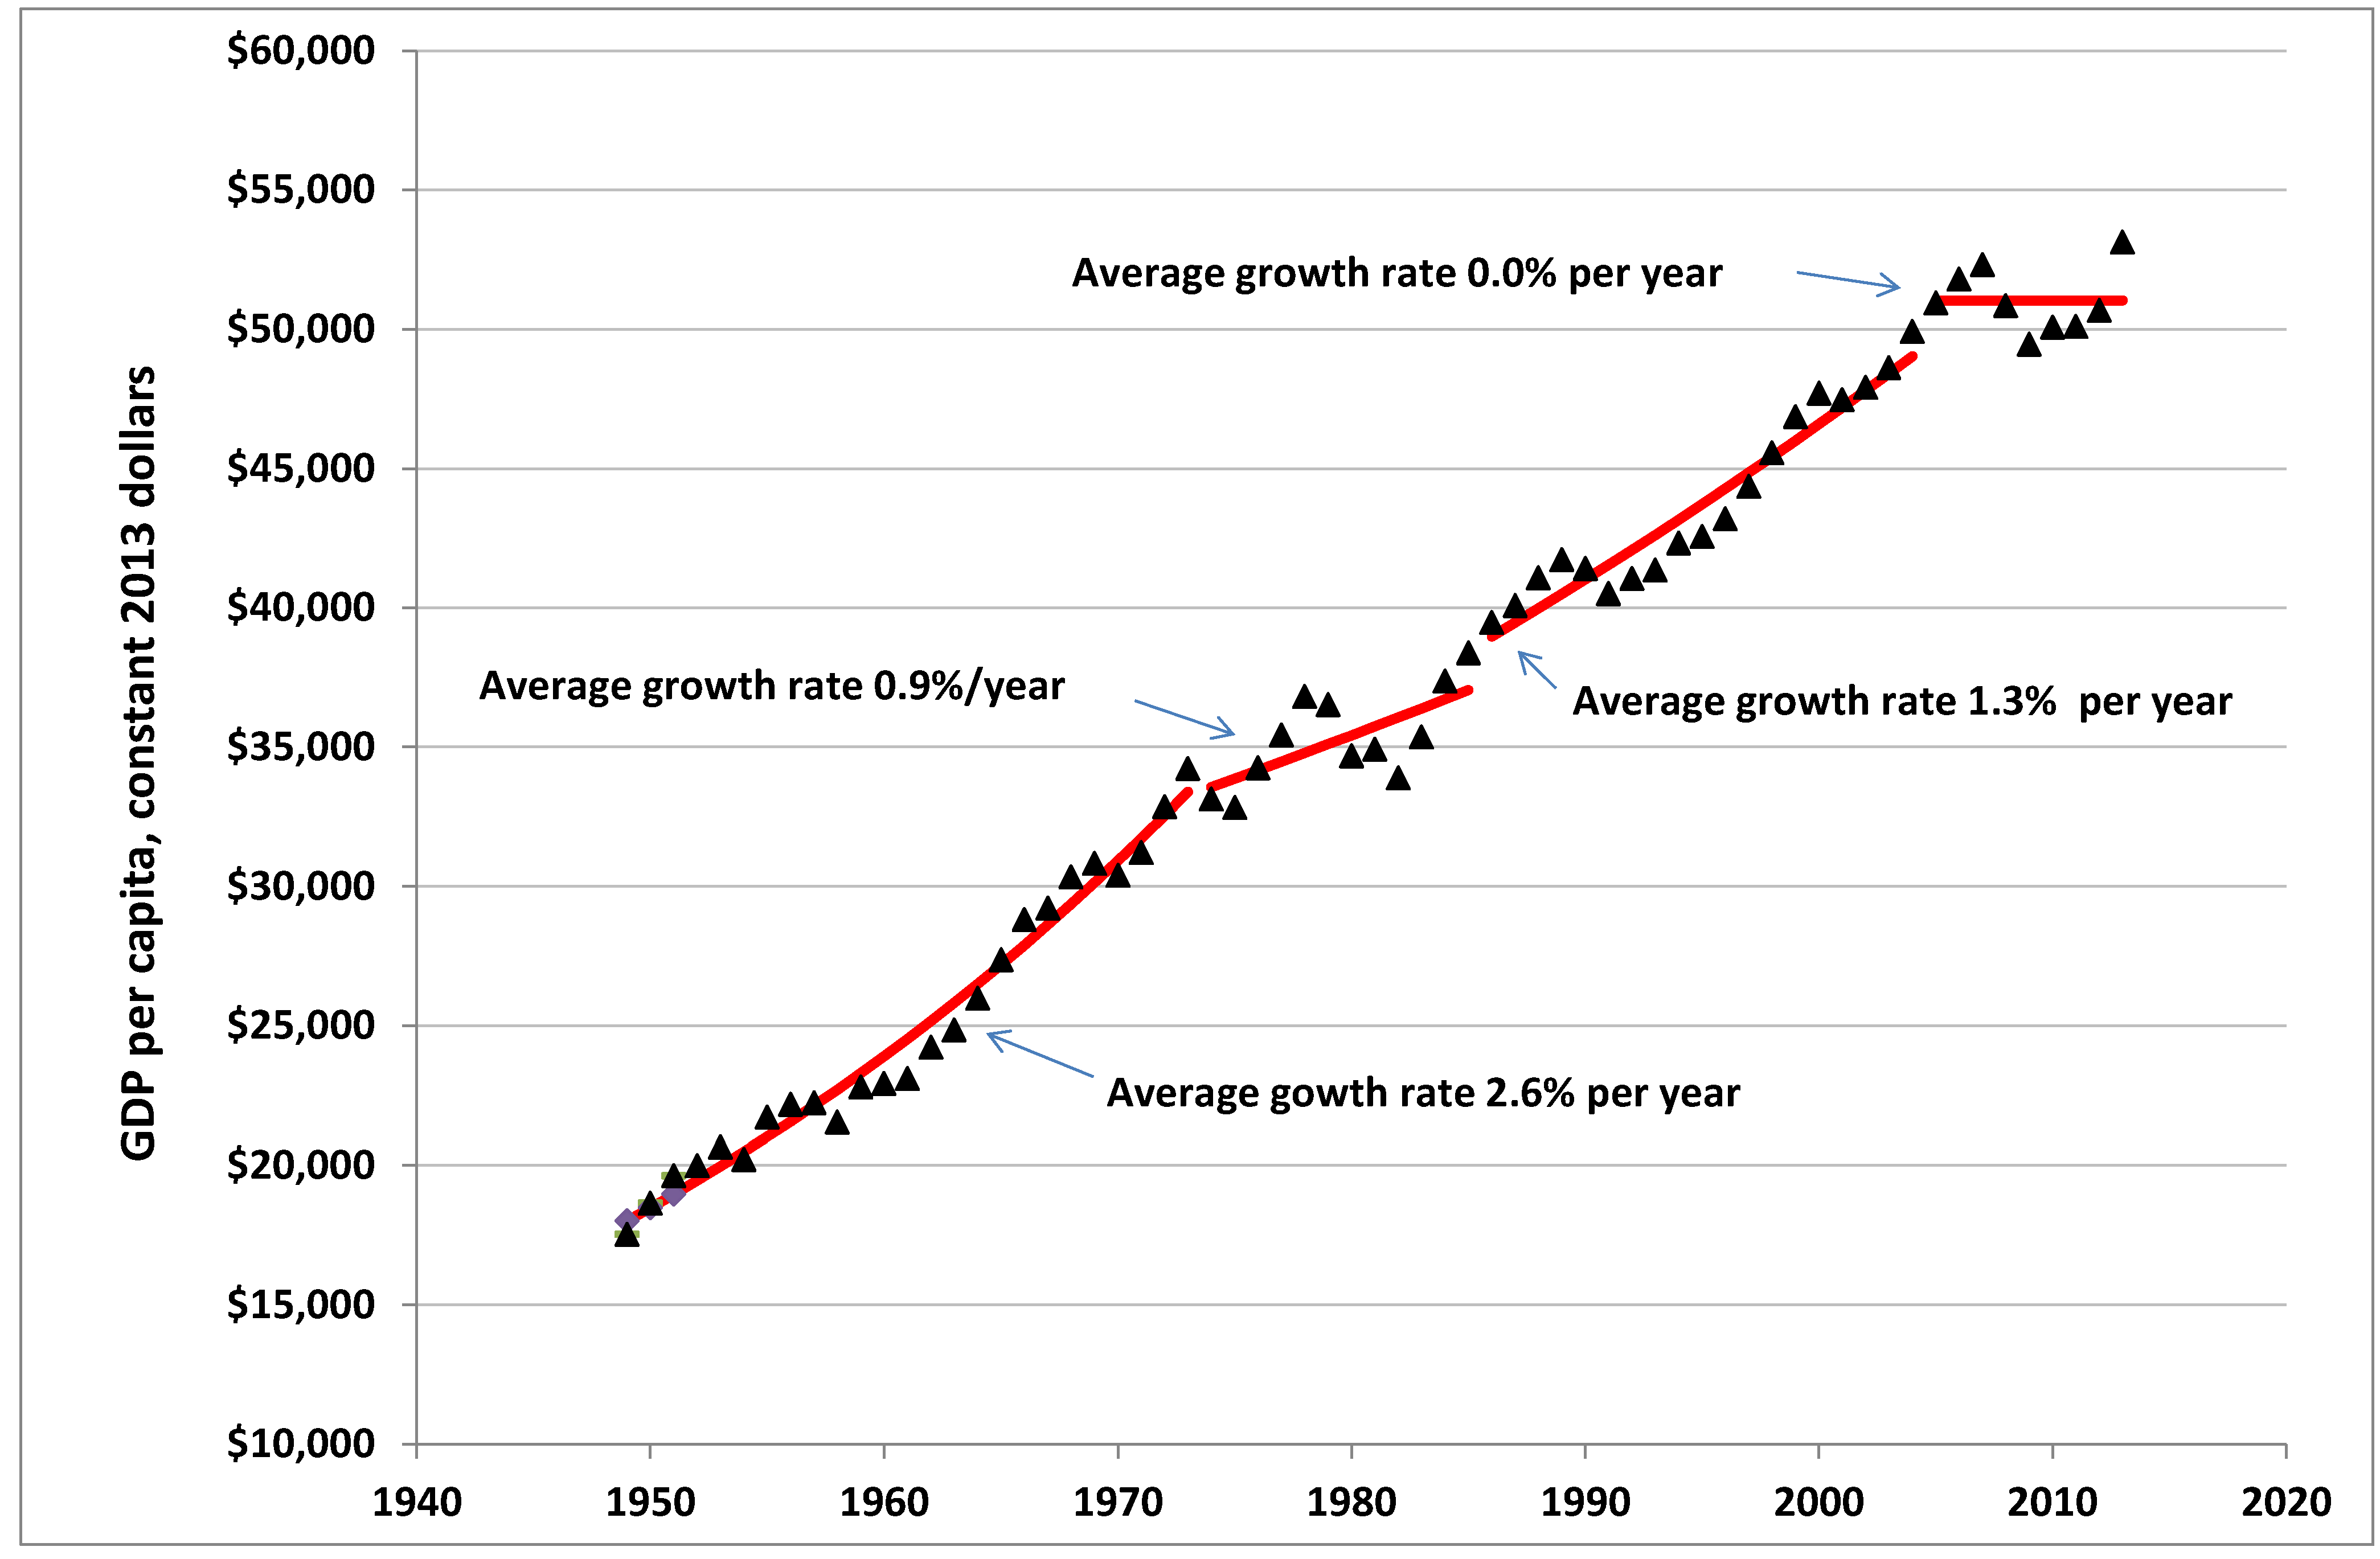
Recently, most of the OECD countries (essentially North America, Europe and Japan) have been in what many refer to as a state of economic malaise, in that unemployment remains relatively high, and yearly growth in per capita gross domestic product (GDP) has been below the historical growth rate. For example, in the U.S., this yearly growth rate, which averaged 2.6% per year from 1949 through 1973, has been nearly zero since 2005 [
1,
2,
3] (
Figure 1). Closer examination of the U.S. trend indicates that two periods since 1949 have had lower than average growth, the period from 1974 through 1985 and the period from 2005 through 2013. Both periods were characterized by a higher percentage of GDP that was spent for fossil fuels;
i.e., the energy cost share was greater. In both cases, this percentage, or energy cost share, was above 3.3%, whereas in the other two periods, this percentage was consistently below that level. Although the correlation between the relatively higher percent of GDP spent on fossil fuels and lower than average GDP growth rates suggests there may be a causal connection, the cause of the recent slowness and even decline of growth continues to be a puzzle to many economists. They have identified a variety of possible causes, chiefly from factors internal to the economy. These include: weak demand, rising inequality, Chinese competition, over-regulation, inadequate infrastructure, exhaustion of new technological ideas [
4], unmet need for structural reform, persistent global imbalances, and a financial system more attuned to speculating than making job-creating investments [
5].
Figure 1.
Growth of U.S. economy, 1949 through 2013; GDP per capita and best-fitting exponential trend lines, four periods.
Figure 1.
Growth of U.S. economy, 1949 through 2013; GDP per capita and best-fitting exponential trend lines, four periods.
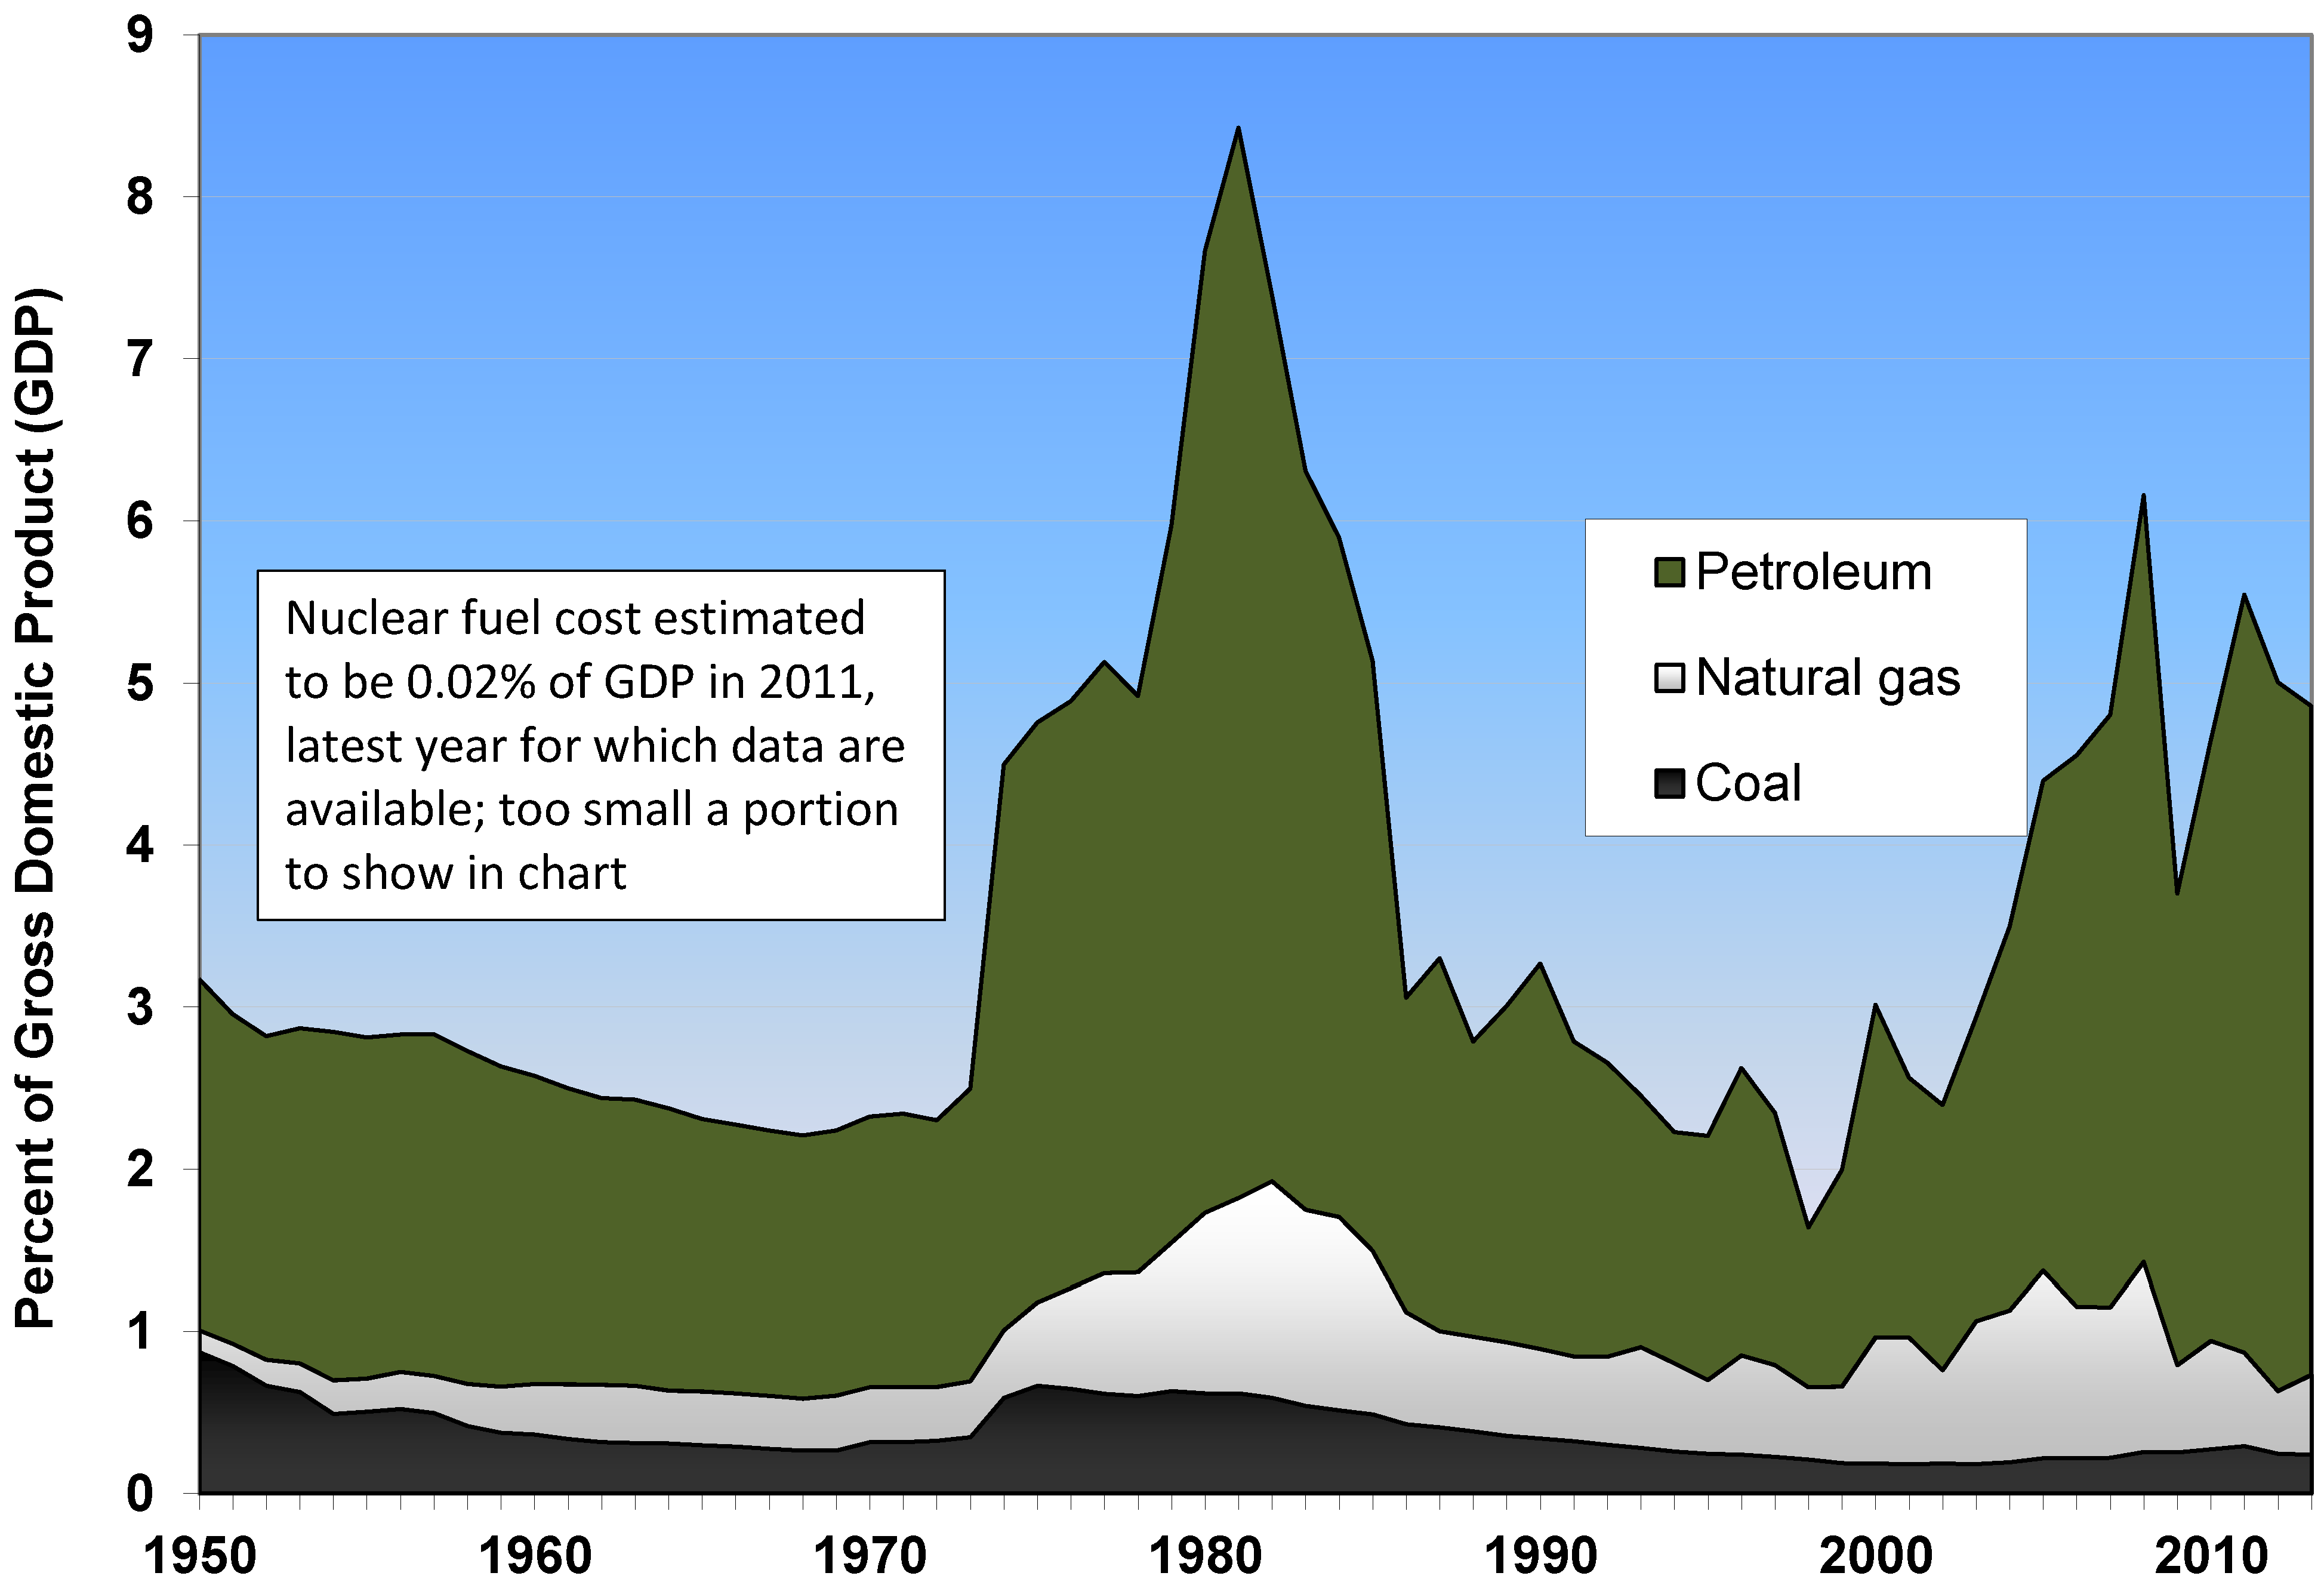
In general, economists do not take seriously the idea that a drain on the economy caused by high energy prices, especially the historically high real prices for liquid fuels, could be contributing, perhaps significantly, to the current malaise. Certainly total energy prices have been higher recently than in most periods of recent history as is obvious when we plotted the dollars spent on fossil fuels, including petroleum, natural gas, and coal, as a percent of GDP (
i.e., the energy cost share of GDP), hence obviating the need for inflation corrections (
Figure 2) [
1,
6] Oil is by far the largest contributor to the total cost of fuels. Despite recent increases in U.S. production, the price remains in the range of $90 to $100 per barrel, far above historical levels. In 2013, $693 billion was spent to purchase petroleum by U.S. refineries, representing approximately 85% of the total U.S. fuel cost and about 4% of the U.S. GDP of $16.8 trillion. Comparing a fuel’s energy content (in units of BTUs) with its cost reveals major differences. Coal and gas have significantly lower cost per energy unit. The two together contributed, in 2012, about 46% of the U.S. energy use total, while their combined cost as a percent of GDP was less than 1%. Nuclear power is by far the cheapest on a fuel cost basis; in 2012 it provided about 8% of U.S. energy use, but its fuel cost was about 0.02% of GDP. In 2012 hydropower contributed 2.8%, wind 1.4%, solar 0.25%, and geothermal 0.24% of the total U.S. energy use.
Figure 2.
U.S. fuel expenditures as percent of GDP (energy cost share), 1950 through 2013.
Figure 2.
U.S. fuel expenditures as percent of GDP (energy cost share), 1950 through 2013.
It is not surprising to many natural scientists that most of the activity of an industrial society should be closely linked to the availability of, and use of, energy, although most economists seem impervious to that concept. Some, taking a broad view, argue that the current age, the Anthropocene, began when humans first harnessed fossil fuels, initially coal, to gain an inexpensive, reproducible, intense, energy source capable of providing continuous power over long periods [
7]. Clearly, since the early 1700s when fossil fuels began to come into wide use, the correlation between energy use and economic activity has been high [
8,
9,
10].
More generally, economists have argued that because the cost of energy is only 3%–4% of the economy it is not important. However, it may be, on the contrary, that it was cheap energy that led to robust growth and made industrial economies rich. In our view it has been a serious failure on the part of traditional economics to consider the importance of energy only as related to its cost share rather than its absolute necessity, growth in use, and power to create the infrastructure and activities that support and drive industrial economies. In our view, the physical importance of energy makes it different from other commodities; the role of energy cannot be adequately equated strictly to traditional financial factors.
This correlation between economic growth and energy use might be of little more than academic interest if not for the possibility that the net useful energy available to the global economy appears to be nearing a maximum. There are two reasons for this: peak oil and declining EROI. First, peak oil refers to the time when oil production of a field, country or the world reaches its maximum after a long period of increase. This has happened for the majority of oil-producing nations and, arguably, for the world as a whole [
11]. Second, a number of studies indicate that the overall energy return on energy invested (EROI) for petroleum, at least, has declined in recent years [
8,
12]. Other recent studies have indicated that there is a minimum EROI below which modern industrial society cannot function [
13]. Although the total global “oil” supply reached a new high in 2013 of 90.3 million barrels per day [
14], a growing share of this supply is not relatively energy-dense crude oil but less energy-dense unconventional liquids, including natural gas liquids, biofuels, refinery gains (caused by the expansion of petrol stock during refining, adding volume but not changing energy), and oil from relatively marginal sources including tar sands. Unconventional plays, such as light tight oil, are heavily dependent on continuous investment and drilling to prevent the large initial decline rates for individual wells to be translated into rapid field-level declines [
15]. The growing presence of unconventional, relatively expensive components of the total oil supply, many of which are more energy-intensive to exploit, lends credence to the notion that EROI is decreasing and hence the total net energy supply is not increasing as much as even the small official figures indicate.
The continued high price of crude oil, which has been in the range of $100 per barrel since 2011, argues that the new sources of oil, such as light tight oil from shale plays in the U.S., are not sufficient in quantity or low enough in price to lower the price below this historically relatively high level. While energy price and EROI are not necessarily directly correlated, due to subsidies and other mechanisms that can distort markets, empirically EROI and the price of a fuel are inversely and moderately strongly related [
16,
17]. Certainly, a declining EROI must eventually translate to a higher price, and conversely, a continued high price suggests a relatively low EROI.
And clearly, the quantity of energy used and energy price are inversely related, at least to a degree. Thresholds also must exist; if the price exceeds a certain level, few potential customers can purchase energy. The recent relatively high prices of energy along with the low growth rate of Western economies compared to historical levels raise the question of whether segments of the U.S. and related economies are currently affected negatively by energy prices. Some analysts, including some economists, have argued that the recent U.S. recession and recessions in general have been materially affected by oil prices [
18,
19]. In particular, Hamilton has argued that the run-up of oil prices in 2007 to 2008, as well as earlier relatively abrupt increases in the price of oil, led to drops in consumption spending, especially for motor vehicles and parts. These changes in spending in turn were associated with the onset of recessions that took place from 1974 to 1975, 1979 to 1980, 1981 to 1982, and 1990 to 1991; without the oil price shocks these recessions would probably not have occurred [
19]. Additionally, when the price of oil increases sharply, there is also a lagged, non-linear response of GDP contraction, which seems to have happened during the last ten out of eleven recessionary periods for most of the Western economies [
20,
21].
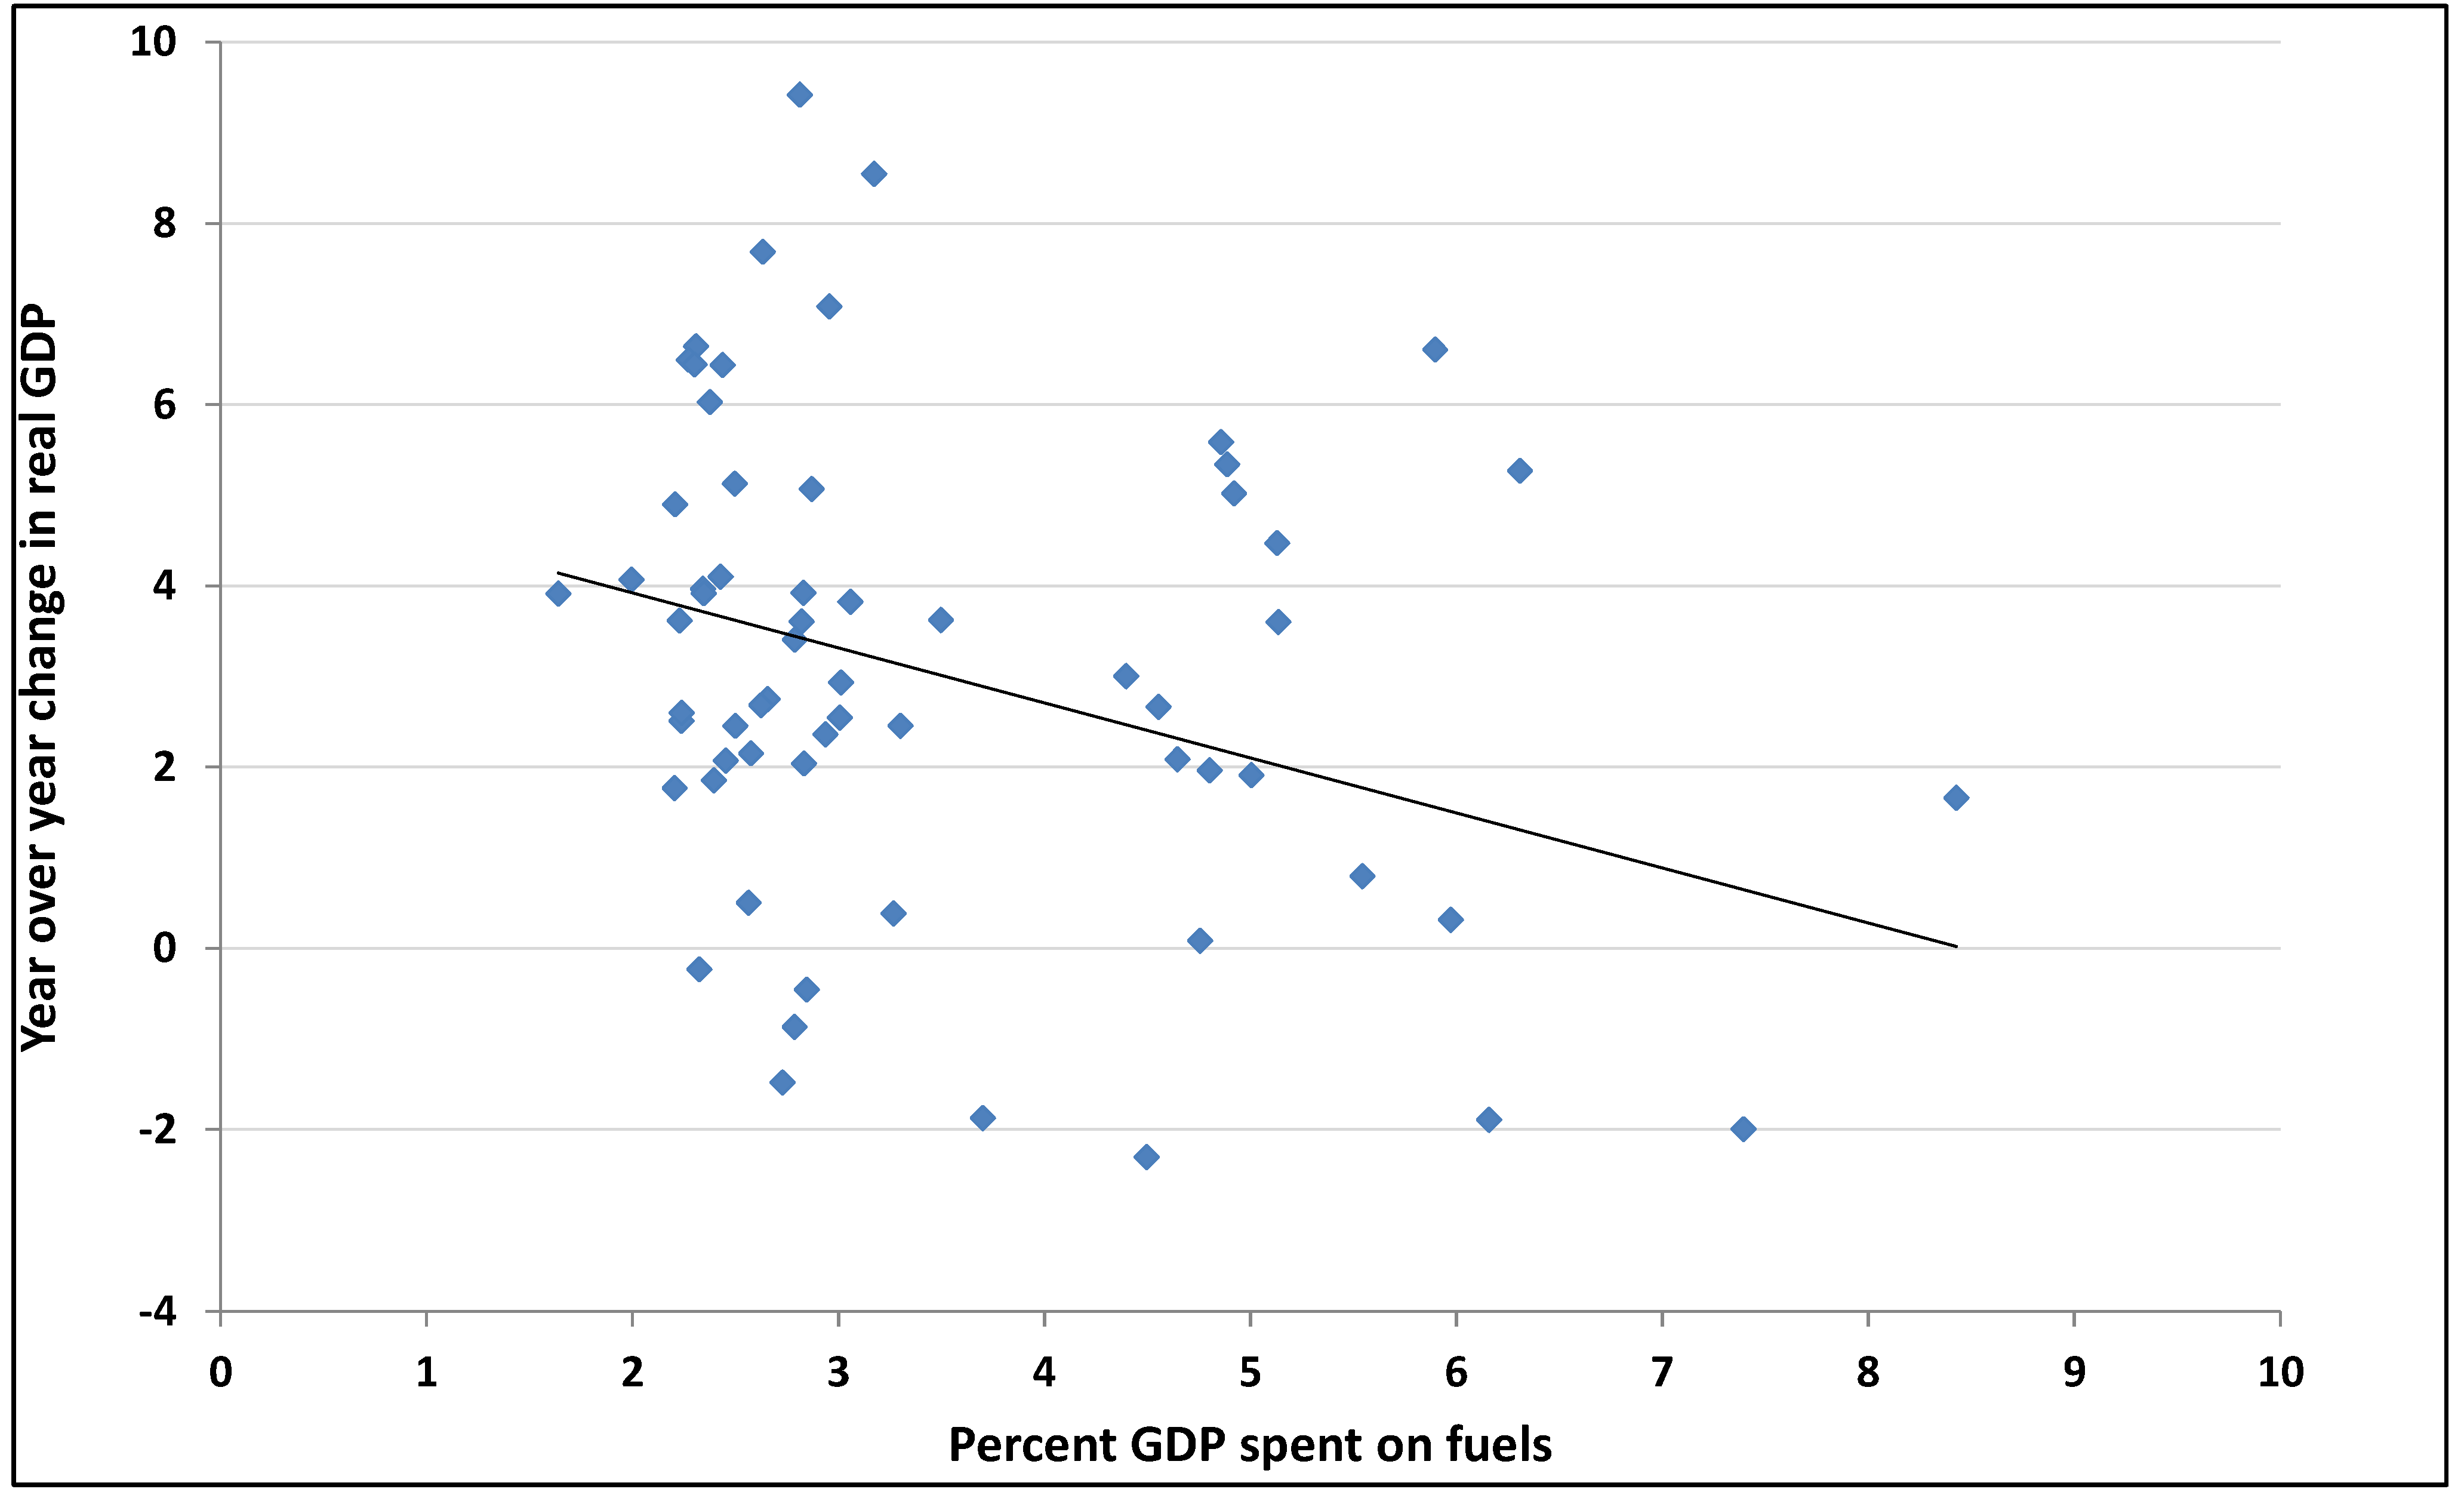
In this paper we explore this relation further by comparing the year-to-year changes in macroeconomic variables over a relatively long time-frame. We develop time series for GDP, along with a measure of overall energy costs, expressed in terms of percent of GDP spent to purchase fuels (energy cost share). By examining the relation year by year we avoid the need for, and difficulties associated with, corrections for inflation. Rather than focusing specifically on the onsets of recessions, like Hamilton, we explore the relation of energy costs to economic performance. If energy costs are not a significant driver of economic performance, then economic downturns should be associated with lower energy prices, because less economic activity should lead to less demand for all products, including fuels. On the other hand, if energy costs are drivers of economic activity, then periods with rising energy costs should be associated with worse economic performance during those periods.
To carry out our comparison, we obtained annual data on energy use and costs [
6] and GDP and price data [
1] from 1949 through 2013. Then we plotted percent of GDP spent on fuels each year
vs. year-over-year (YoY) change, in percent, of GDP, expressed in constant dollars, for all years from 1950 through 2013 (
Figure 3). See
Section 3 for a discussion of methods.
Figure 3.
Percent GDP spent on fuels vs. year-over-year GDP change; and best-fitting linear relationship.
Figure 3.
Percent GDP spent on fuels vs. year-over-year GDP change; and best-fitting linear relationship.
2. Results, Discussion, and Implications
2.1. Results
There is considerable variation in the data, and the best-fitting straight line has a relatively low R2 value of 0.1138. It is not surprising that there is scatter in the data, given the many influences on economic performance. Nevertheless, statistical tests show a clear correlation between the percent of GDP spent on fuels (energy cost share) and the year-over-year growth in GDP. Specifically, the Spearman r correlation, which does not assume normally distributed data, found an approximate P value of 0.0342, considered “significant”. The Pearson r correlation, which assumes that the data are normally distributed, shows a two-tailed P value of 0.0064, which is considered “very significant.” The best-fitting straight line, pictured, has a slope that is significantly different from zero, with a P value 0.0064. The 95% confidence interval of the slope is from −0.3203 to −0.05473, and the 95% confidence interval of the intercept is from 3.568 to 4.645. (Slipping the correlation by one year, so that YoY GDP of one year is paired with % GDP spent on fuel of the previous year, makes the correlation weaker; the Pearson r correlation changes to a P value of 0.0075, while the Spearman r correlation changes to a P value of 0.0512.).
While there is uncertainty associated with the straight line that best fits these data, it appears that a threshold exists in the range of 4% of GDP spent on fuels. When the percentage is higher than this, economic performance, as evidenced by YoY GDP change, dips into the negative. (Note that other analyses, e.g., Bashmakov [
22] have found a threshold at a higher percentage than this. We believe the difference is due, at least in part, to the use in these other analyses of final costs of fuels to consumers rather than costs when fuels first enter the economy as used herein. See methods discussion below for details).
2.2. Discussion
Our results are similar to what Hamilton found when looking at particular events. Both analyses indicate that energy costs are correlated significantly with economic performance. This correlation does not imply that other factors are not also important. However, energy costs, as discussed above, probably reflect to a large degree the EROI of the energy source [
16] and thus, unlike other costs such as labor, represent sunk costs; money spent that is unlikely to be recycled into increased spending elsewhere. For example, if the cost of labor should rise, much of the money paid to workers would reappear elsewhere in the economy, as workers spend at least some of their increased pay. But if the cost of energy should rise because wells must be drilled deeper or drilled in more inhospitable locations, a good portion of the increased cost is lost to the economic system. Most explicitly this occurs when the energy is imported. But in general, as EROI declines, the productive part of the economy must spend more for the same input energy; this is analogous to an increase in taxes with no increased services.
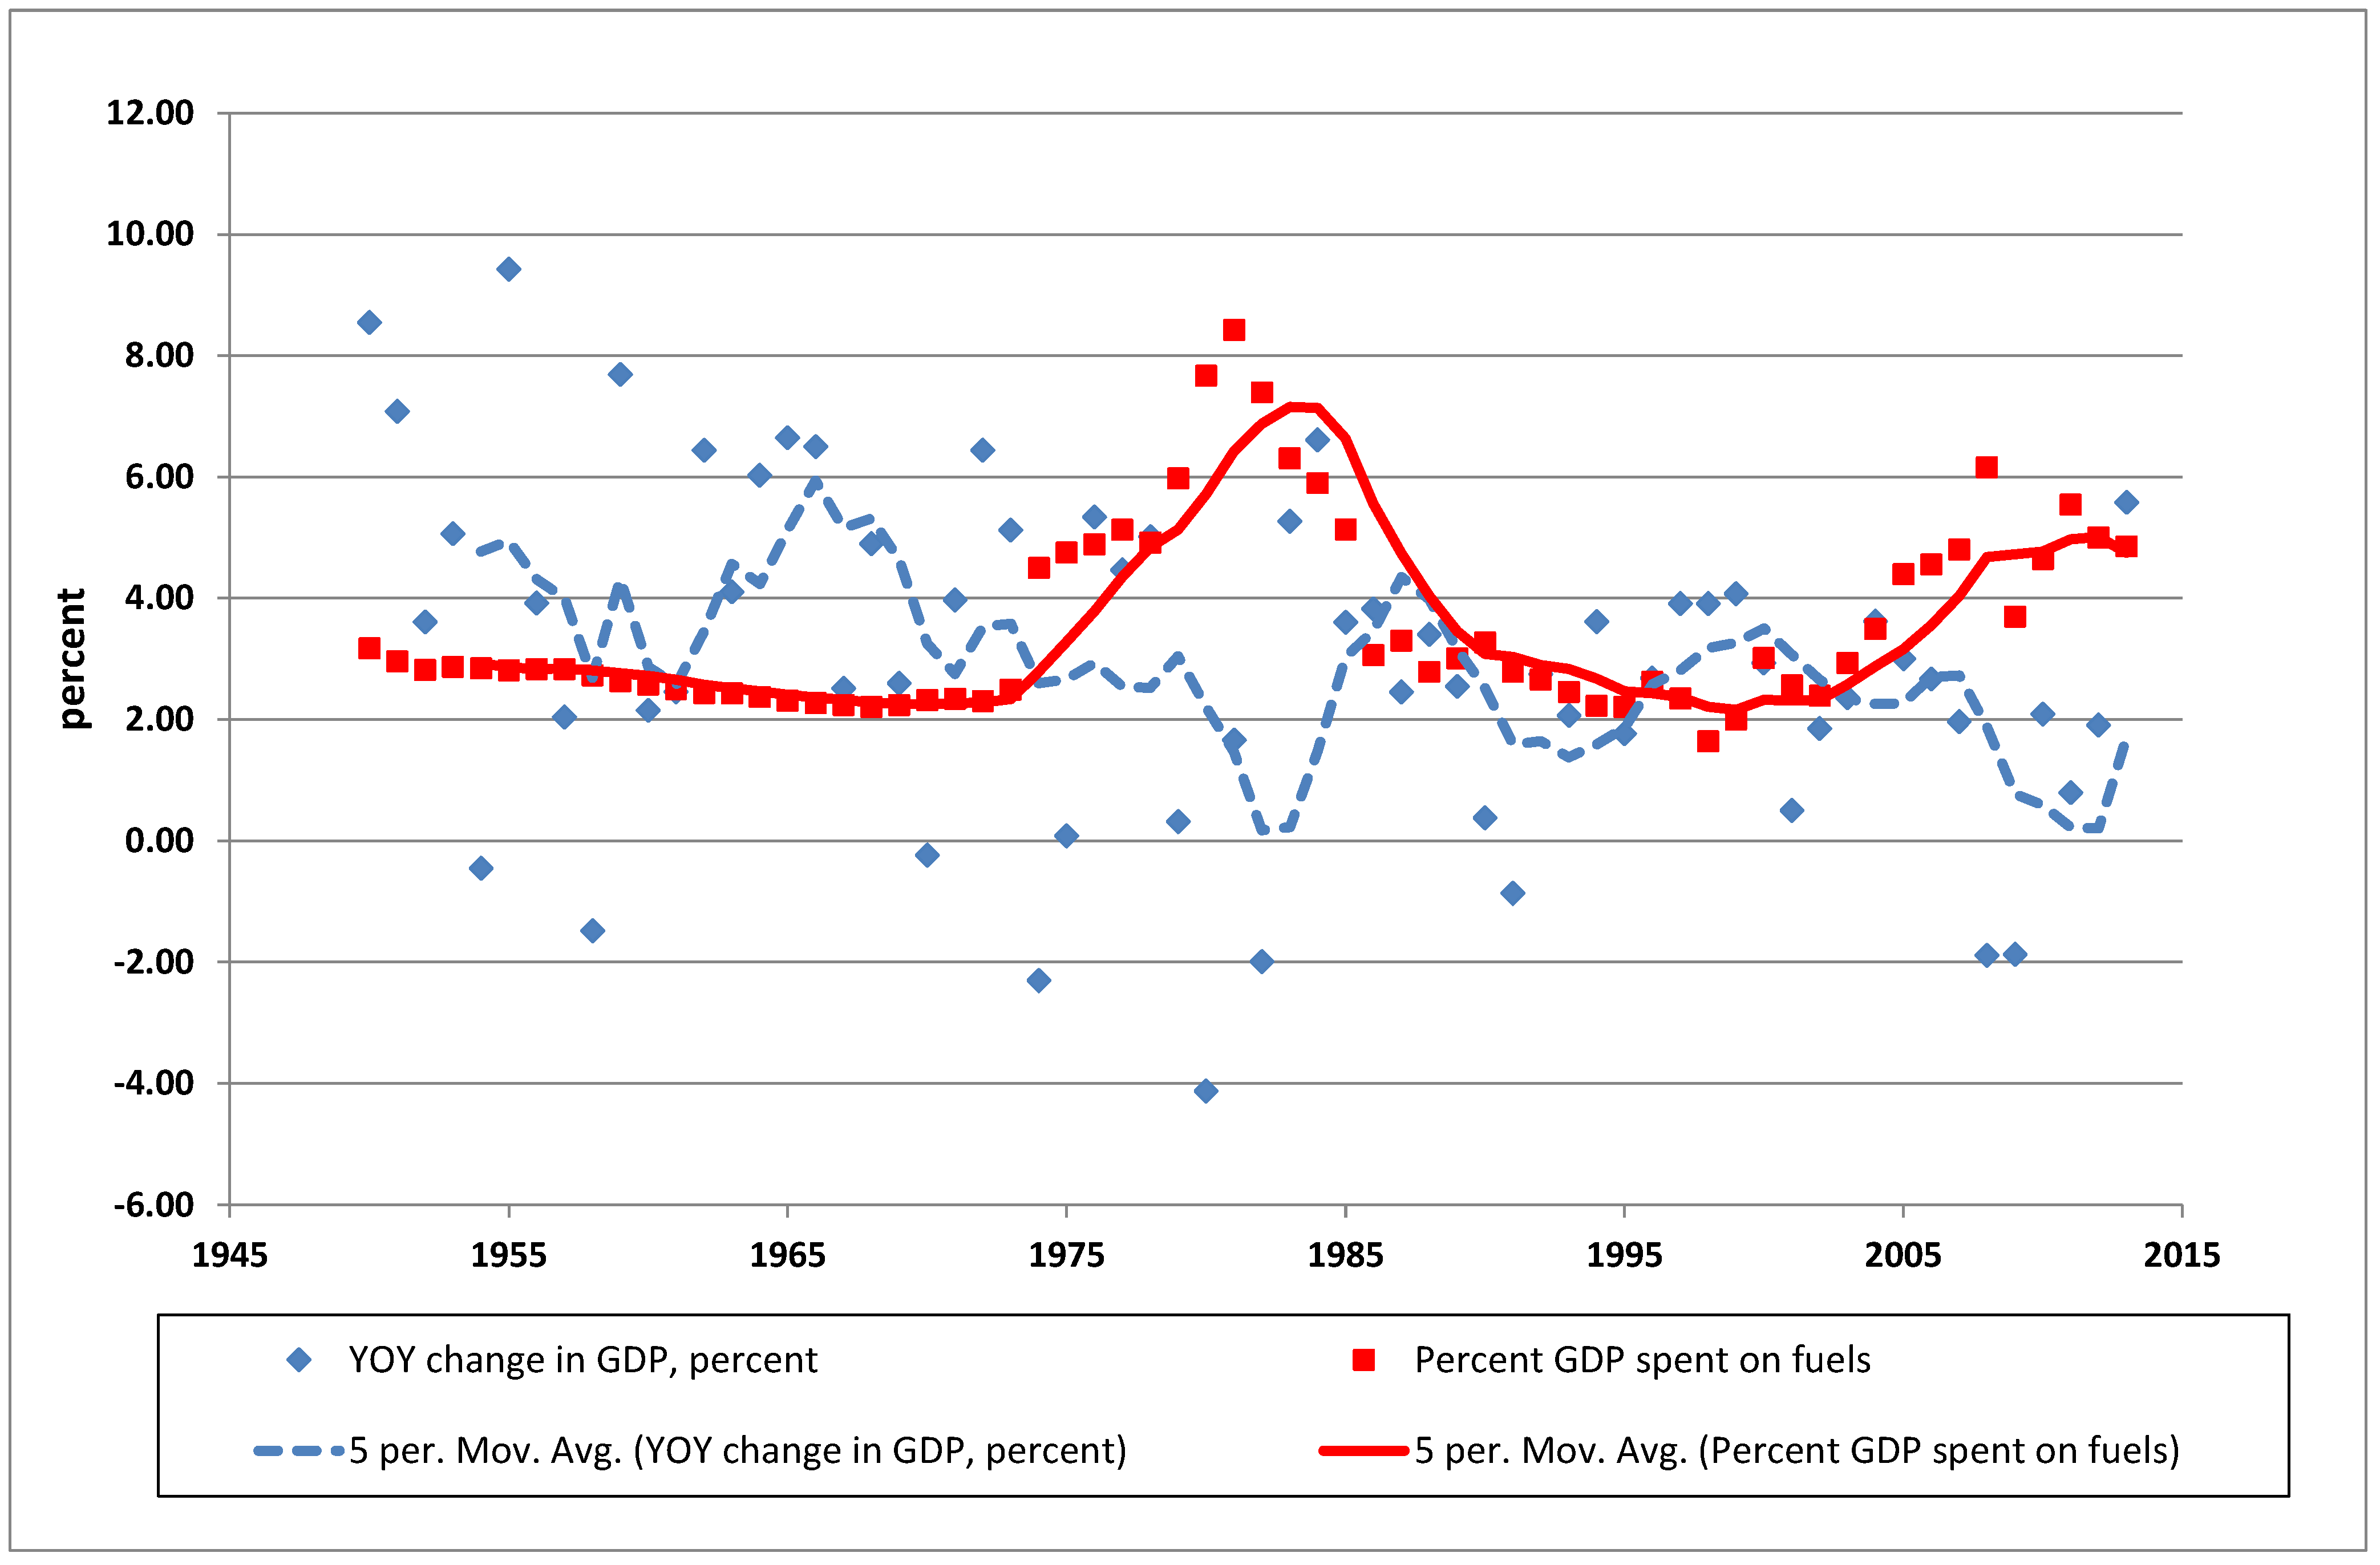
Non-energy-related influences which include interest rate, availability of labor, and other factors, doubtless play a role in the year-to-year variability reflected in the data. In an effort to smooth out the data and reveal more clearly any fundamental relationships, both percent year-over-year change in GDP and percent of GDP spent on fuels for each year, along with five-year moving averages of these same parameters, were plotted for each year from 1950 through 2013 (
Figure 4).
Figure 4.
Year-over-year percent change in real GDP and percent GDP spent on fuel, 1950 through 2013, and five-period (per.) moving averages (each period is one year).
Figure 4.
Year-over-year percent change in real GDP and percent GDP spent on fuel, 1950 through 2013, and five-period (per.) moving averages (each period is one year).
From the mid-1970s on, the five-year moving averages of each parameter are approximate mirror images of each other; as energy costs escalate, GDP decreases, and vice versa. This relation holds within a range of moving average periods, e.g., two years and ten years; it is especially apparent with the five-year period shown.
Prior to the 1970s, a mirror image pattern is not apparent. Generally during this period, however, as evinced by the five-year moving average, YoY GDP changes were positive. This erratic but generally positive performance of the economy during this earlier period suggests that other factors besides energy are important, or at least were important during that period. It should be noted that the percent of GDP spent on energy was consistently well below the approximate 4% threshold during this period. It may be that only when energy costs rise above this threshold level that energy costs begin to impact economic performance significantly. Prior to 1970, energy was plentiful and its supply was rapidly increasing, and it may not have been as important an economic driver as it is today.
2.3. Implications
If energy costs are in fact an important driver of economic performance, and if a threshold of influence exists in the range of 4% of GDP spent on fuels, then it is unlikely that the current economic malaise will end until this percent is reduced significantly from its current level, which is approximately 5% and fairly likely to increase as EROI for petroleum will, presumably, continue to decline and prices increase over the long term. On the other hand, if prices decline for other reasons we would expect a temporary increase in economic growth.
There are two ways that industrial society might lower the percent of GDP spent on fuel costs in the future.
One way might be to replace fossil fuel-powered systems with cheap renewable energy sources and nuclear power, all of which offer the promise of much lower operating costs, once the initial investment in facilities and associated infrastructure is recouped. These initial costs may be large, however, and much of the development of sufficient capacity will be dependent on inputs of fossil fuels (e.g., for construction and maintenance). Therefore, there is no guarantee that low operating costs will adequately compensate for the high inputs, and thus the overall EROI of these sources could be low enough so that they will not, in fact, lead to a reduced percent of GDP spent on fuels. For example, as shown by three recent analyses, solar photovoltaic systems may have an EROI so low as to offer relatively little benefit to the continued functioning of industrial society [
23,
24,
25].
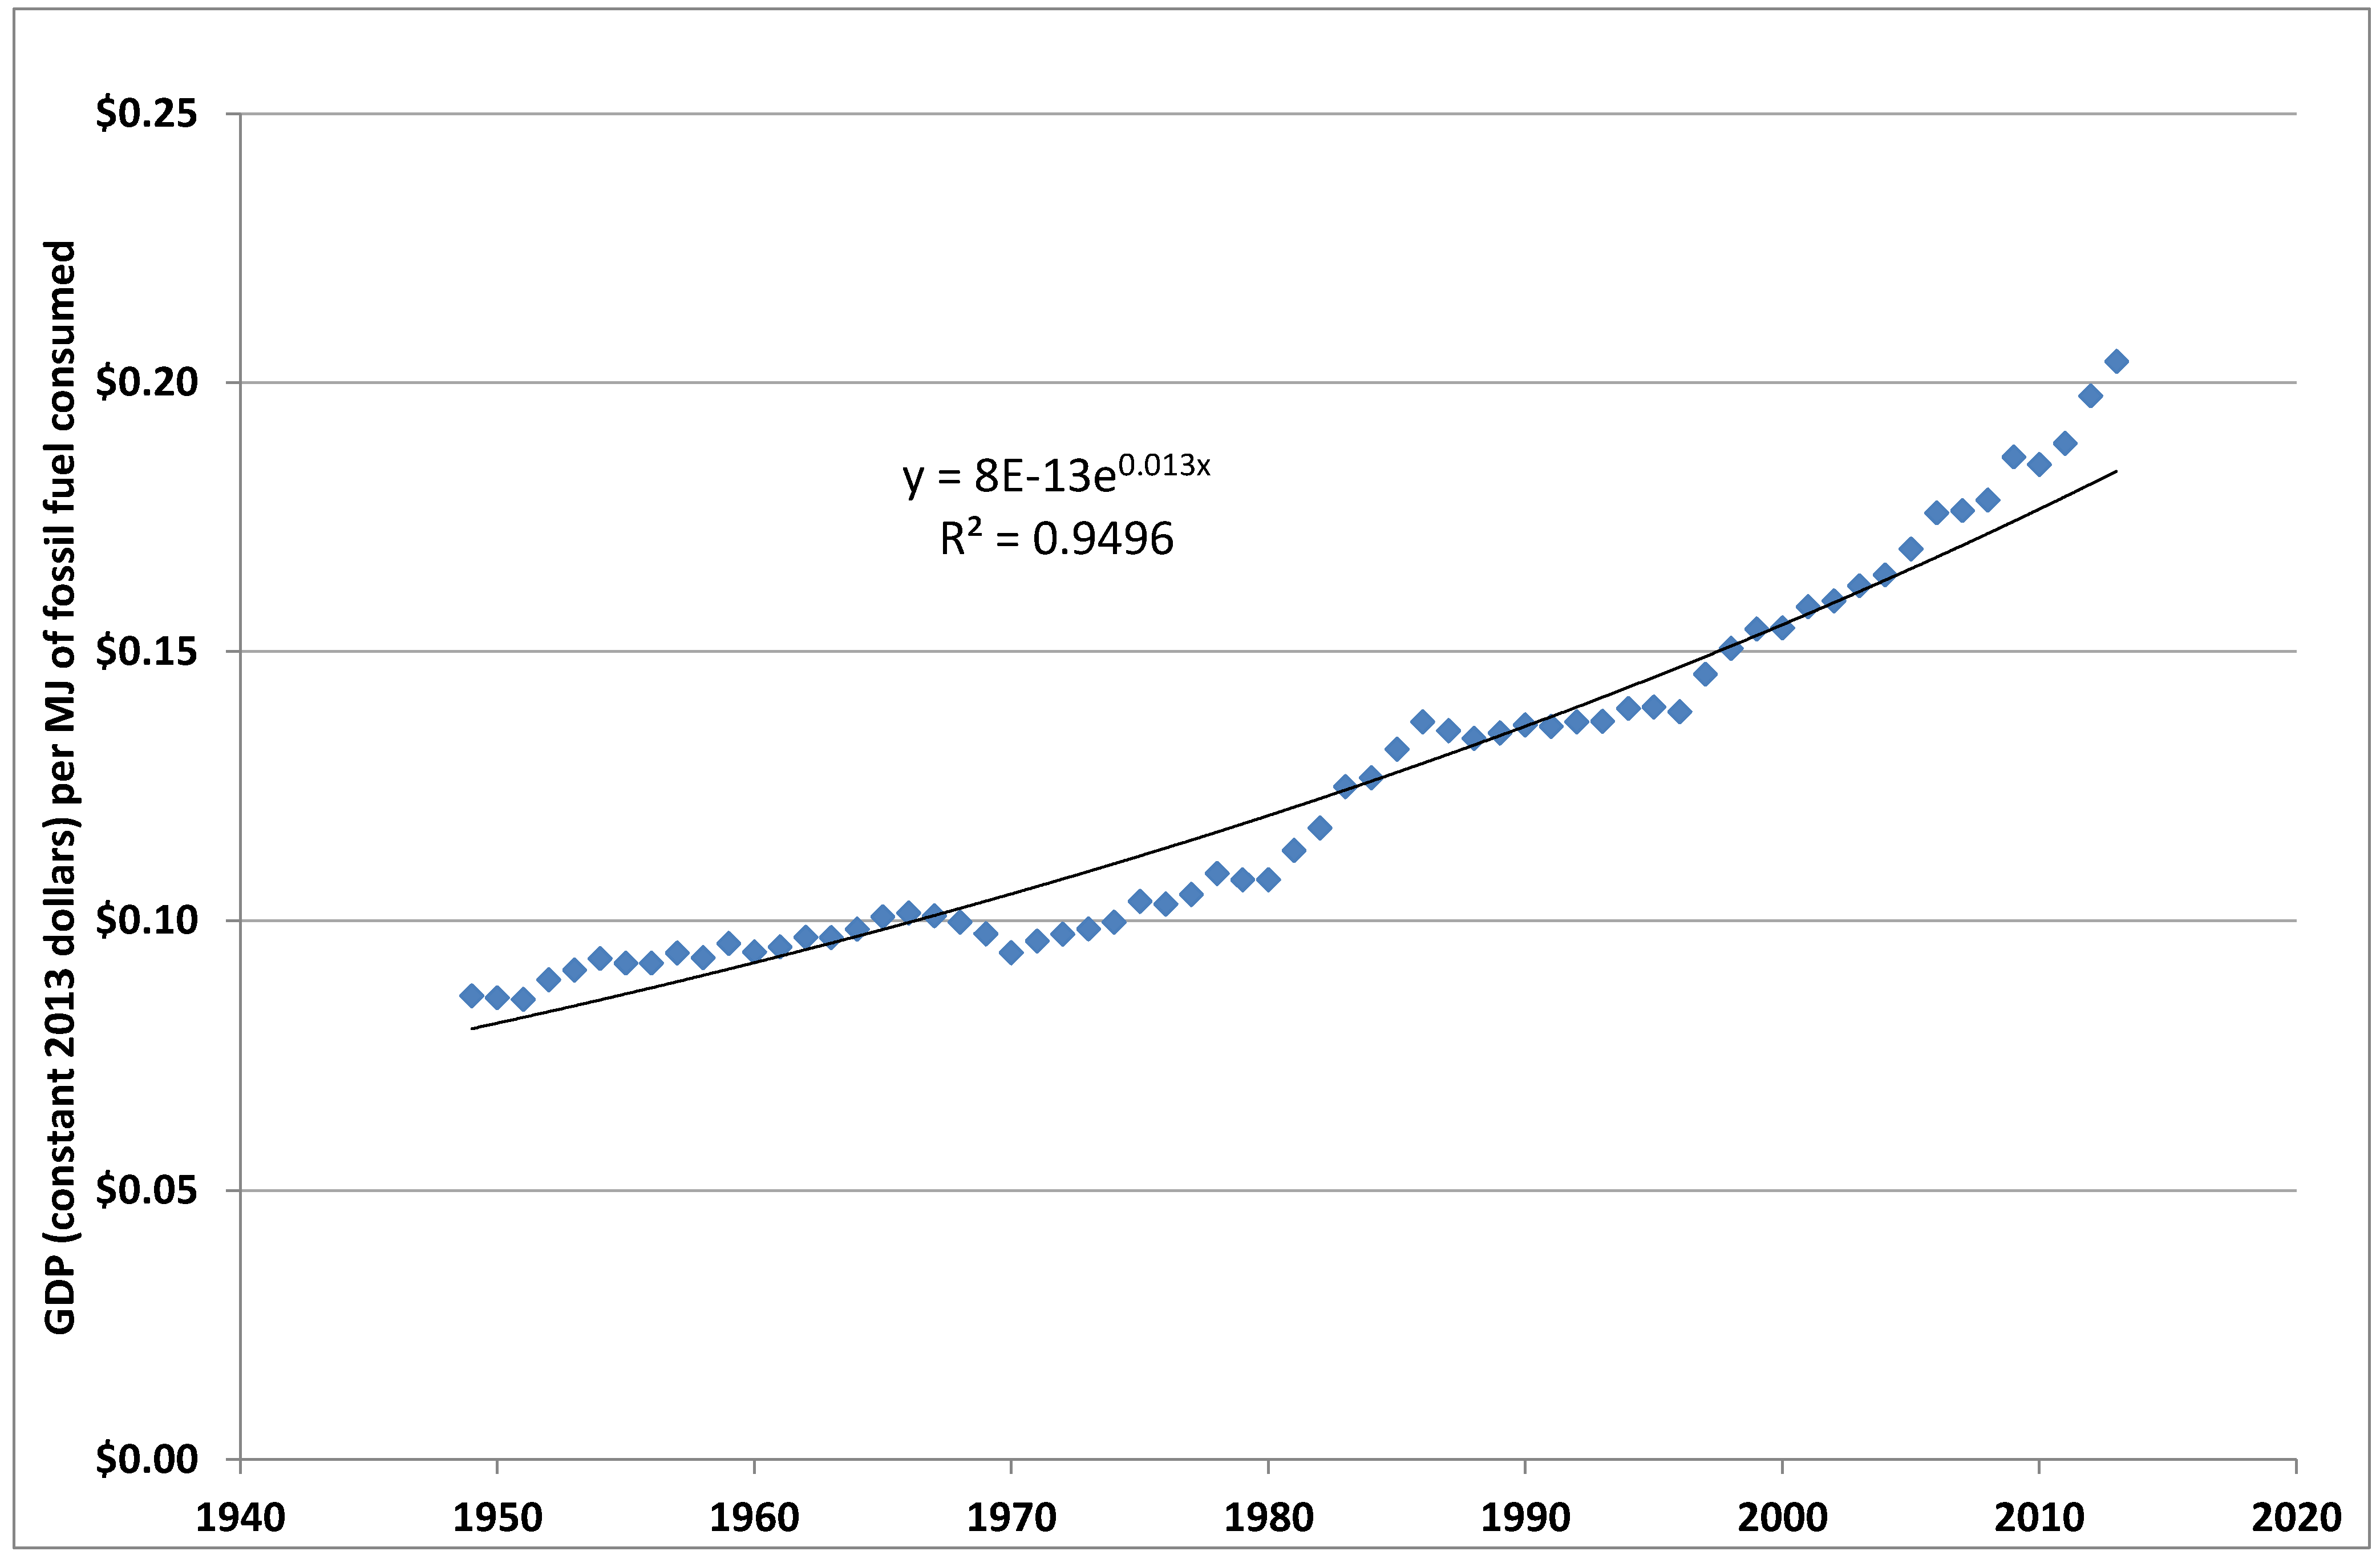
Another way that society can reduce the percent of GDP spent on energy is to become more efficient in its use. In fact, there is a long-standing and consistent trend of improvement in energy efficiency (
Figure 5). Note, however, that these assessments require accurate inflation corrections for year-to-year analysis of GDP, and there are concerns that this trend in apparent increasing efficiency may be due, at least in part, to an unrealistically low assessment of the inflation rate [
8,
26]. These concerns are not universally accepted [
27].
Figure 5.
Dollars of GDP per megajoule of fossil fuel consumed, and best-fitting exponential trend; constant 2013 dollars.
Figure 5.
Dollars of GDP per megajoule of fossil fuel consumed, and best-fitting exponential trend; constant 2013 dollars.
As this figure shows, the long-term trend in apparent increasing efficiency is in the range of 1.3% per year increase in the dollars of GDP generated per MJ fossil fuel invested. However, the recent rate of increase of the cost of petroleum has overwhelmed this efficiency ratio in terms of monetary (vs. energy) cost to society. In 2003, the U.S. spent approximately $200 billion on petroleum. By 2013, this cost had risen to nearly $700 billion, a factor of 3.5, while the efficiency ratio increased from 6.2 MJ per dollar of GDP to 4.9 MJ per dollar of GDP, a change of about 20%. Should the cost stay in this range, it would require more than a three-fold increase in efficiency in the consumption of petroleum and its products such as gasoline to lower the cost back to the $200 billion range. Over a ten-year time frame, improvements of energy efficiency in the consumption of petroleum and products would have to be greater than 10% per year to achieve this amount of reduction. It must be noted that there are limits to energy efficiency; it is constrained by the laws of thermodynamics. Nevertheless, improvements in the range of a factor of 3 in miles per gallon of motor vehicles, for example, are feasible with existing technology.
3. Methods
To better assess the relation between economic performance and costs of energy, appropriate data were gathered and adjusted as necessary to bring these data into a consistent framework. U.S. economic, population, and energy use data were obtained for the years 1949 through 2013. Fuel consumption data were then adjusted as discussed below so that units were consistent, and the degree of correlation was determined between the year-over-year changes in gross domestic product (GDP) and the percent of GDP spent each year in acquiring the primary energy-containing fuels including coal, natural gas, petroleum, and nuclear ore.
The primary data sources for the analyses reported herein have been the U.S. Department of Energy, Energy Information Administration (EIA) [
6] and the U.S. Department of Commerce, Bureau of Economic Analysis (BEA) [
1], and the U.S. Department of Commerce, Bureau of Census [
2], used for population-related analyses. Cost values were translated to constant 2013 dollars using consumer price CPI-U data from the U.S. Department of Labor [
3]. Some data was obtained as noted in other sources referenced above.
Development of consistent data on quantities of fuels and associated costs used to develop the percent of GDP spent on fuels data presented several challenges due to changes in methods within available reports spanning the entire time span of the analysis. The primary objective was to gain an accurate and consistent picture of the dollar costs of fuels purchased each year. In order to do this, data on both the quantity of fuels purchased and their costs were necessary.
Coal data up to and including 1994 was reported by EIA in Btu. For 1995 and later years, it is reported in short tons. To be consistent with the earlier data, the 1995 and later data was converted to Btu using EIA data on the average energy content of coal per year [
28]. These data show a long-term decreasing trend in the average energy content. Costs of coal were obtained from EIA tables for 1949 through 2010 [
29] and for 2011 and 2012 [
30], and were estimated for 2013 as the mean of the 2011 and 2012 costs. EIA data in Btu was used for natural gas production quantities, and was converted using 974.4 Btu per 1000 cubic feet conversion factor to be consistent with cost data which was reported in thousands of cubic feet [
31]. Historical crude oil prices, up to 1968, are from a non-EIA source [
32]. Crude oil costs from 1968 through 2013 [
33] are what EIA terms “composite acquisition cost by refiners” and so represent combined sources of petroleum for U.S. refineries which include both domestic and imported crude oils. Nuclear fuel costs were estimated from EIA data [
34]. Although nuclear power provides approximately 8% of U.S. total energy consumption, as a percentage of total fuel costs the cost of nuclear fuel, less than $3 billion per year, is too small to be significant in the analyses reported herein, representing 0.02% of the GDP of about $16 trillion.
It should be noted that some aspects of energy costs were not included in these analyses. These include construction and capital costs related to development of renewable sources and other new power plants, and costs associated with construction of infrastructure necessary for electrical energy or fuels transmission. Such costs would increase the percentage of GDP that was in effect spent on energy, and might be large enough to influence the picture significantly. For example, if, during a period of time, construction activity shifted to some degree from building houses to building new electricity transmission lines or pipelines, this would represent an increased portion of the GDP dedicated to providing energy.
4. Conclusions
Currently, in the range of 5% (probably more if energy-related expenses, such as construction of facilities and other necessary infrastructure are included) of U.S. gross domestic product is spent on fossil and nuclear fuels each year. During earlier periods of consistent prosperity, the percentage was in the range of 3% or less. We compared these percent data with the year-over-year percent change in the gross domestic product. We found that these variables are correlated inversely and significantly. This suggests that the availability and cost of energy, consistent with analyses based on the energy return on investment EROI concept, is a significant determinant of economic performance, and argues that the U.S. economy has and probably will continue to face a drag due to increasing energy cost as a result of the depletion of highest quality fuels, including coal).
The best-fitting linear equation relating the percent of GDP and YoY GDP change variables suggests that a threshold exists in the vicinity of 4%; if the percent of GDP spent on fuels is greater than this, poorer economic performance has been observed historically. This threshold is consistent with a similar analysis by Murphy and Hall [
35], building on the work of Hamilton, that found that the economy is likely to move towards a recession when petroleum expenditures as a percentage of GDP exceed 5.5%. In that study, petroleum expenditures were the sum of distillate fuel oil, residual fuel oil, motor gasoline, liquefied petroleum gas (LPG), and jet fuel. The total cost for these finished petroleum products is necessarily higher than the cost to refineries of petroleum as used in this study. Because petroleum makes up most of the cost of fuels, it is likely that the 5.5% threshold is consistent with the approximate 4% of GDP threshold identified in this study as the level at which a negative YoY change in GDP becomes likely. Our results are also consistent with those of Bashmakov [
22], who found that energy costs as a percent of GDP become unsustainable in the U.S. when they exceed 8% to 10%. Bashmakov’s study used energy costs to final consumers, unlike costs of fuels entering the economy as used herein, which may account for the higher percentage of GDP at which energy costs become problematic in that study.
It is frequently argued by economists that because energy costs are small compared to other expenditures that make up GDP (e.g., consumer spending, which makes up about 70%), that energy costs are unlikely to be significant. But this view ignores the difference between the physical and financial importance of energy. Simply comparing the percentage accounted for by energy expenditures with other expenditures ignores the multiplier effect of energy. If the price of energy goes up, almost everything costs more, and this ripples through the economy. Fertilizer may be a useful analogy. Adding 50 kg of nitrogen per hectare can change the yield of corn by several tons per ha. This is because nitrogen is typically a “limiting nutrient”. It may be that energy is the “limiting nutrient” of the economy.
Because currently about 5% of GDP is spent on fuels, continued weak economic performance appears likely unless a major improvement in energy efficiency and/or a more rapid adoption of renewable or nuclear energy sources with a sufficiently high EROI can be achieved. Because most of the increased cost of energy is due to rising costs for petroleum, this source of energy should be a focus for such improvements and alternatives. On the other hand, oil, as indicated by its price, may have an economic value per energy unit higher than alternatives and may be difficult to replace.
Further work in a variety of areas could shed more light on the connection between energy cost and economic performance. Comparative studies that include other countries and the world as a whole could be useful in answering questions such as whether the threshold where the cost of energy begins to negatively impact economic performance is the same for all countries, whether this threshold is changing over time, and whether it even exists for some countries. Work in this area should build on what has already been done [
8,
22]. Also, more sophisticated statistical approaches, perhaps including co-integration analysis or Granger causality, could reveal details about the connection and potential time relationship between energy costs and economic performance. Furthermore, analyses similar to the approach of this study, but exploring other factors besides fuel cost, such as capital stock or labor for the provision of energy, could be revealing.
