Three-Dimensional CFD Modeling of Transport Phenomena in a Cross-Flow Anode-Supported Planar SOFC

 ,
, 

Abstract
: In this study, a three-dimensional computational fluid dynamics (CFD) model is developed for an anode-supported planar SOFC from the Chinese Academy of Science Ningbo Institute of Material Technology and Engineering (NIMTE). The simulation results of the developed model are in good agreement with the experimental data obtained under the same conditions. With the simulation results, the distribution of temperature, flow velocity and the gas concentrations through the cell components and gas channels is presented and discussed. Potential and current density distributions in the cell and overall fuel utilization are also presented. It is also found that the temperature gradients exist along the length of the cell, and the maximum value of the temperature for the cross-flow is at the outlet region of the cell. The distribution of the current density is uneven, and the maximum current density is located at the interfaces between the channels, ribs and the electrodes, the maximum current density result in a large over-potential and heat source in the electrodes, which is harmful to the overall performance and working lifespan of the fuel cells. A new type of flow structure should be developed to make the current flow be more evenly distributed and promote most of the TPB areas to take part in the electrochemical reactions.1. Introduction
Fuel cells can directly convert the free energy of a chemical reactant into electrical energy and heat, which is different from a conventional thermal power plant, where the fuel is oxidized in a combustion process combined with a conversion process (thermal-mechanical-electrical energy), that takes place after the combustion [1]. If pure hydrogen is used, no air or environmental pollution occurs at all, because the output from the fuel cells is electricity, heat and water. High temperature solid oxide fuel cells (SOFCs), with their advantages of high efficiencies, environmental friendliness and flexibility of fuel types that can be used, have been considered as one of the most promising technologies for electricity generation [2].
Depending on the specific configuration and design, a variety of physical phenomena are present in an SOFC, e.g., multi-component gas flow, energy and mass transfer of chemical species in composite domains, even at the micro- and nano-scale levels. Due to the electrochemical reactions, generation and consumption of chemical species together with current production are involved at the active surfaces in SOFCs. All these are inaccessible to experimental measurements, so computational fluid dynamics (CFD) methods are becoming more attractive.
The aim of the study presented in this paper is to investigate the transport phenomena inside an single SOFC fed with hydrogen as the fuel and to evaluate its overall performance. For this purpose a three-dimensional CFD model has been developed for an anode-supported planar SOFC. With the modeling results, the distribution of temperature, flow velocity, the gas concentrations (fuel and air) through the cell structure and gas channels is discussed. Electric potential and current density distributions over the cell and fuel utilization are also computed. The commercial CFD code Ansys FLUENT is used to solve the mass, momentum, energy and charge conservation. The electrochemical reactions, over-potentials and related electric parameters throughout the cell are calculated using the FLUENT add-on SOFC module.
2. Model Geometry
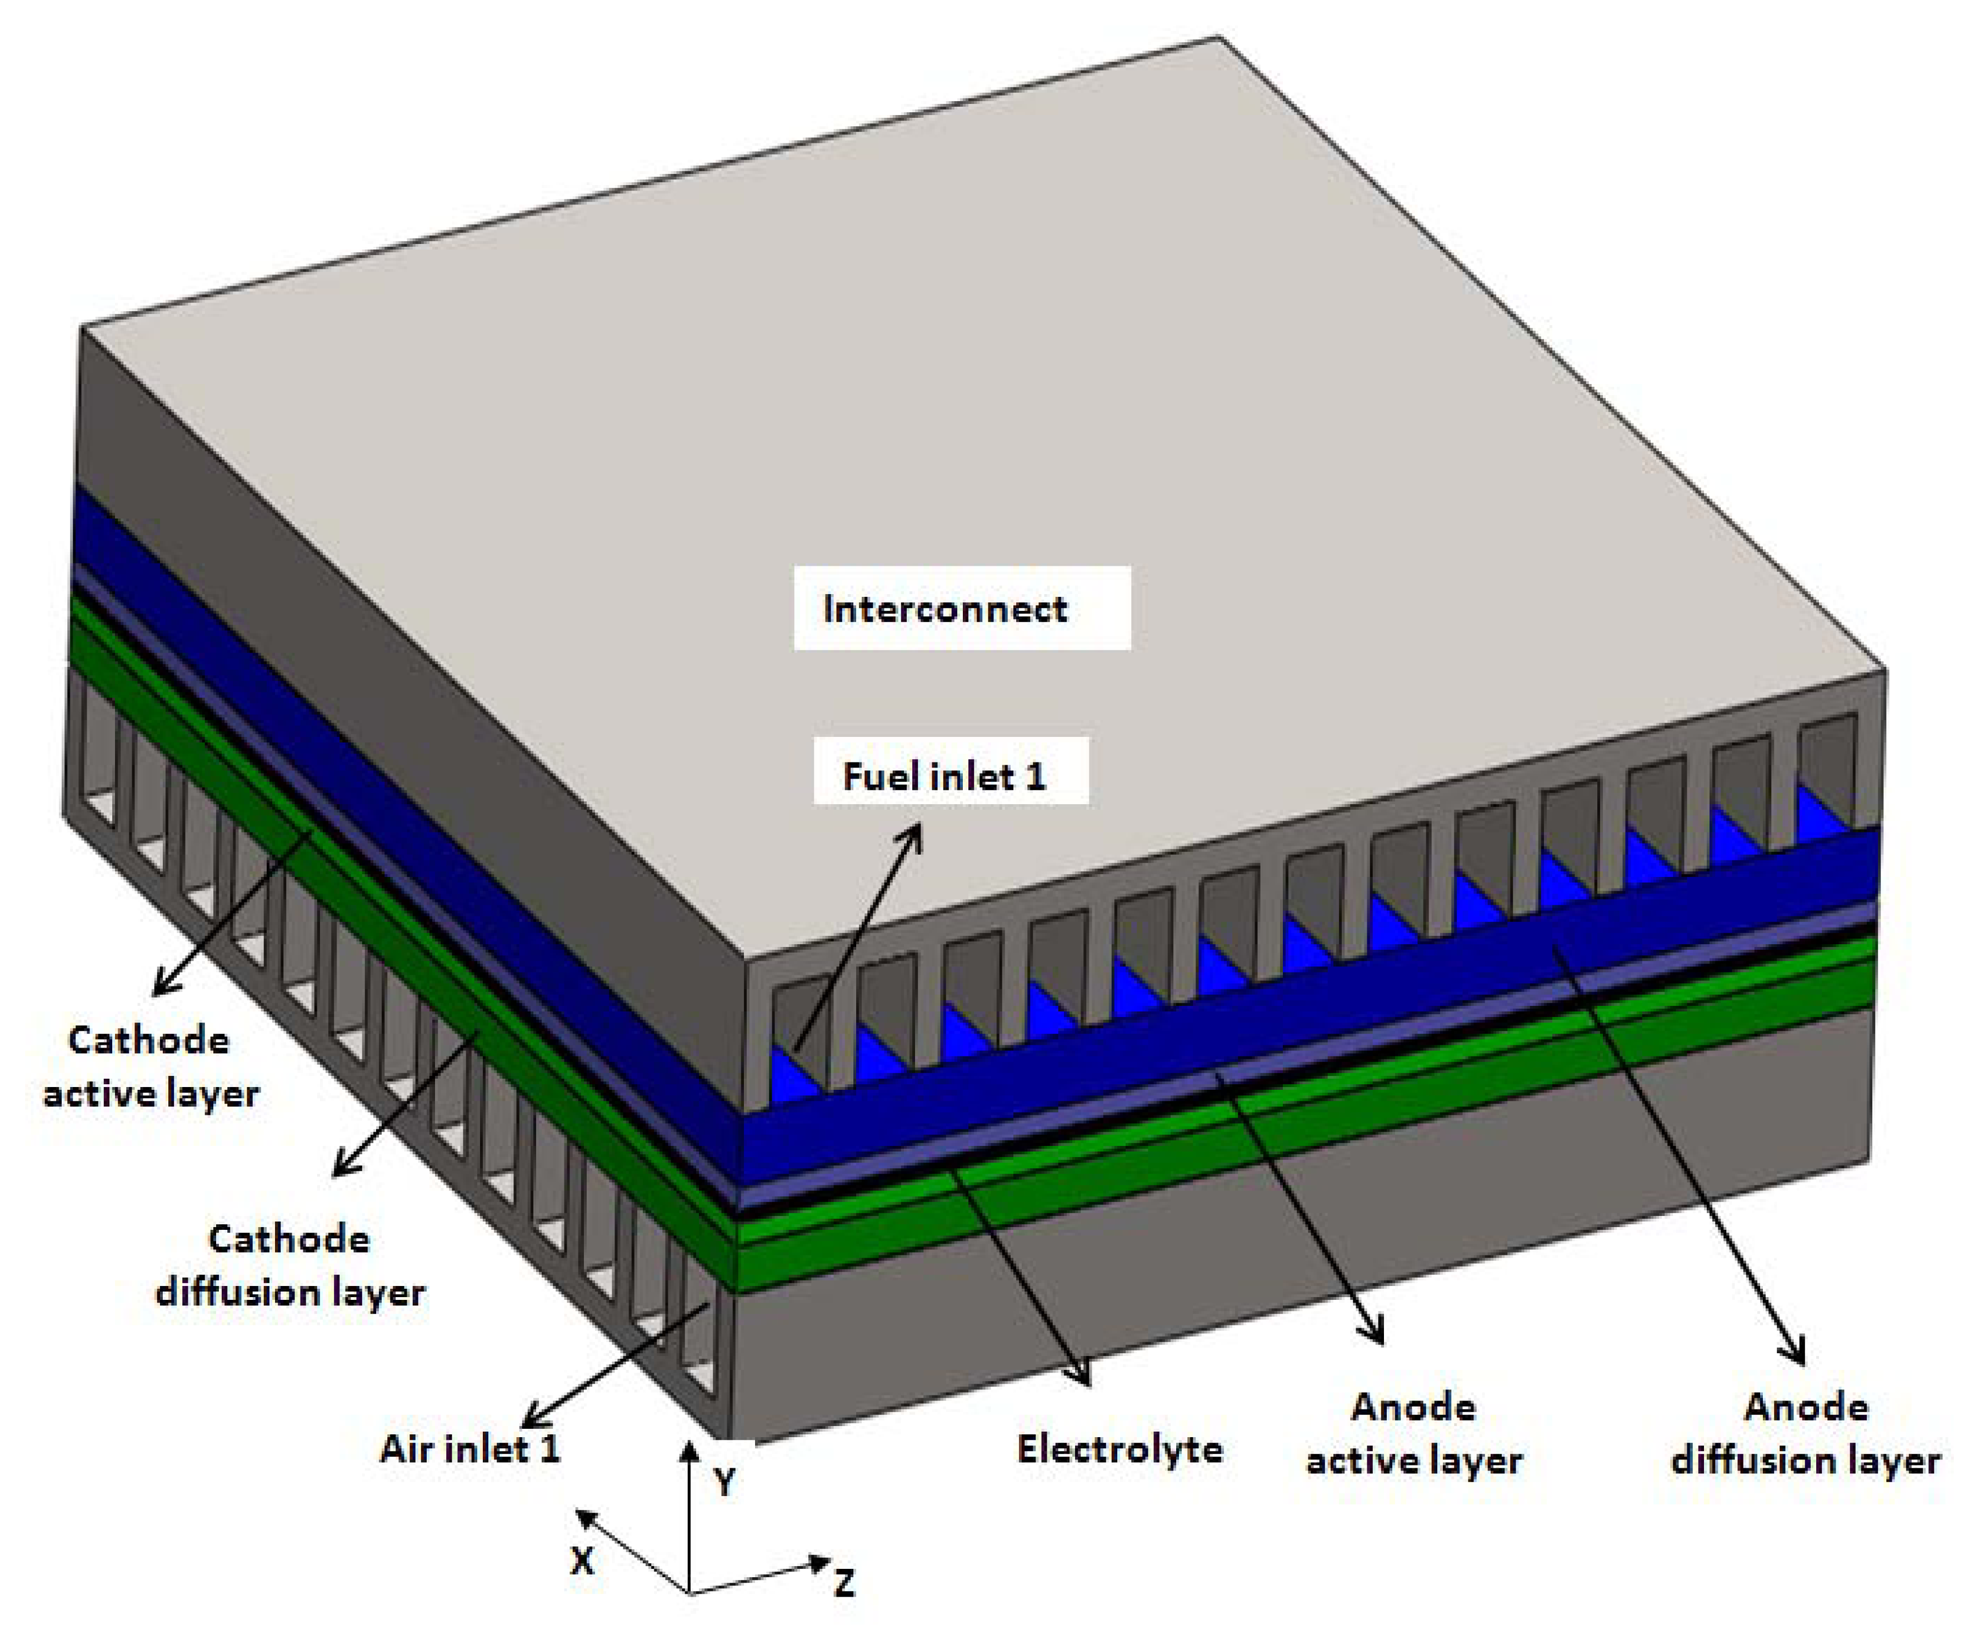
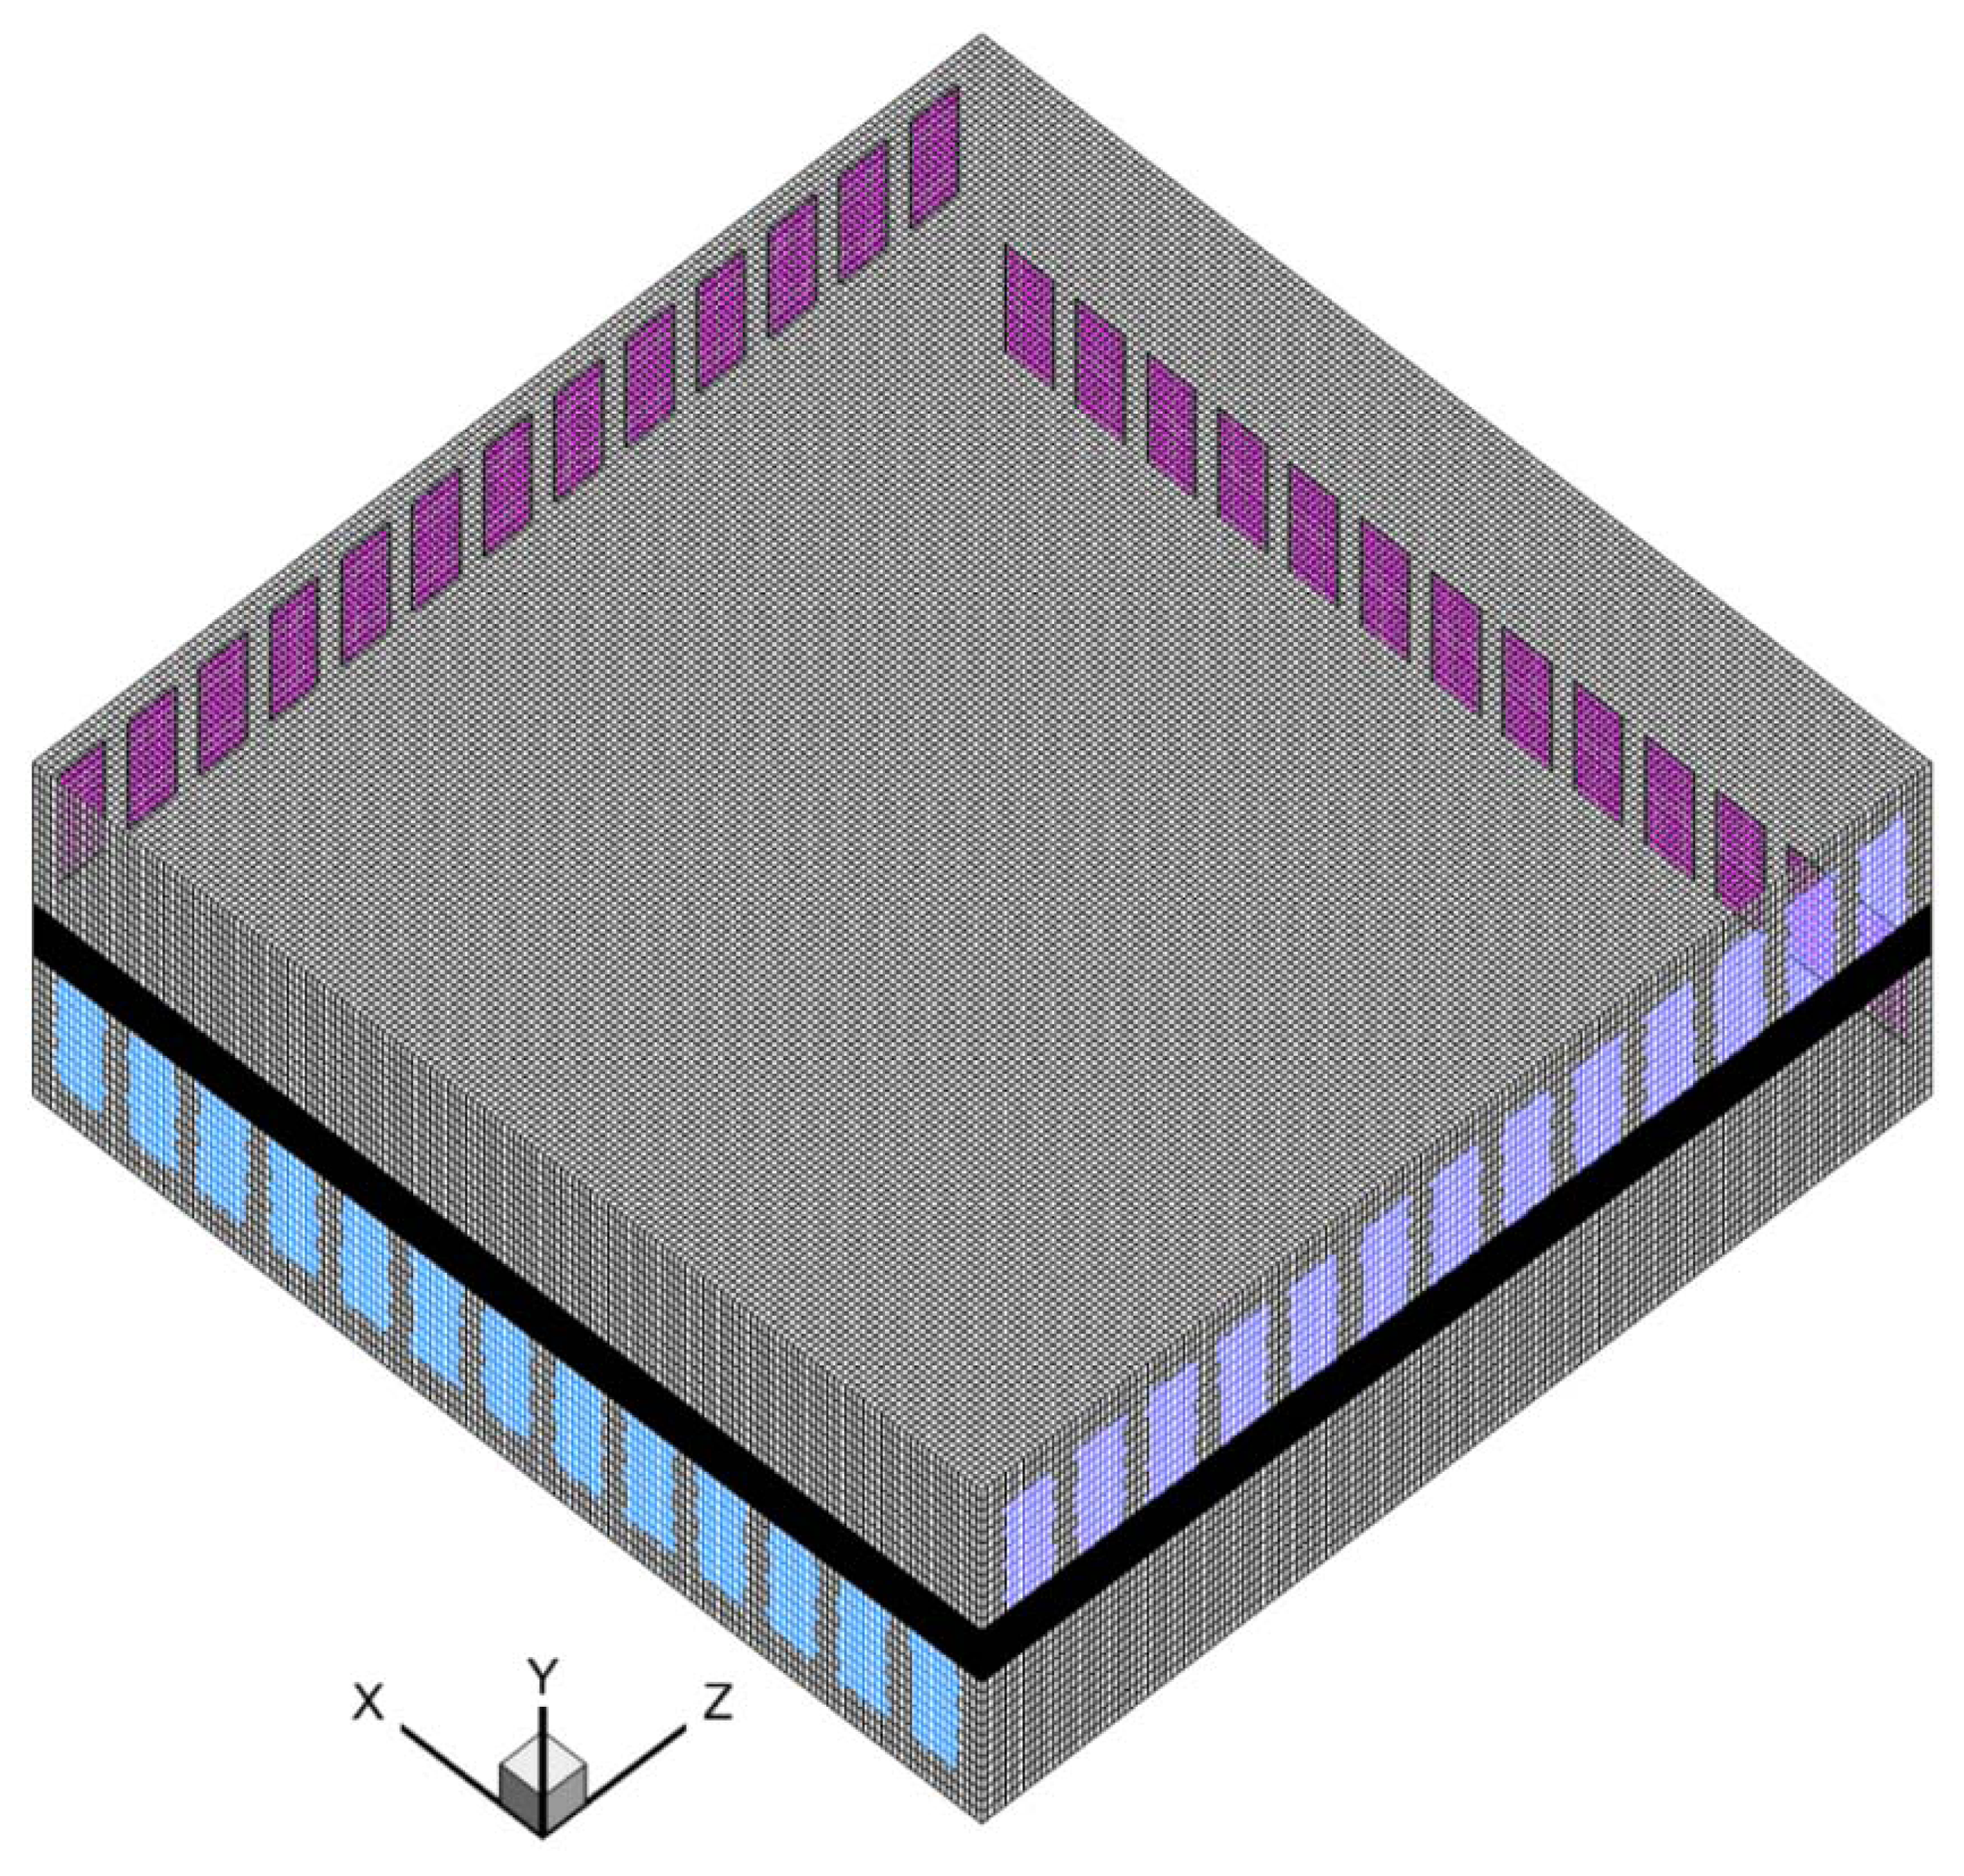
The geometry to be modeled in this paper is based on a tested anode-supported planar SOFC developed at the Chinese Academy of Science Ningbo Institute of Material Technology and Engineering (NIMTE). Figure 1 is the sketch of the SOFC structures for cross-flow configuration. The complete domain having 13 channels for fuel and air channels is adapted. Figure 2 displays the grid arrangement for the studied cell. The computational domain is divided into more than 2 million control volumes, all of which are high quality hexahedron meshes. The meshes are finer in the electrolyte, anode and cathode layers, and coarser for the air and fuel channels and for the interconnects. Grid independence was achieved at 2.15 × 10⁶ elements (Figure 2), after which the change in the maximum temperature was less than 1%, in maximum velocity less than 2%, in average current density less than 2%, in oxygen consumption less than 0.2% and in hydrogen consumption less than 1% (compared with the ones predicted by 3.00 × 10⁶ elements). Table 1 shows the geometrical parameters of simulation domain.
3. Mathematical Equations
Species transport in the porous electrodes occurs in the gas-phase, integrated with the electrochemical reactions at the solid active surfaces in the electrode active layers. The electrodes are porous and species transfer is dominated by gas diffusion [3]. The electrolyte has two functions: to transport oxygen ions from the cathode to the anode and to block electron and gas flow between the anode and cathode [4]. The flow of electrons (electronic charge) through external circuit balances the flow of ions (ionic charge) through the electrolyte when electrical power is produced [5]. The interconnect can be assumed to be impermeable to gases. Electron transport needs to be considered because the current from the SOFC is collected [6]. The governing equations to be solved are conservation of mass, momentum, charge, thermal energy and species. These transport equations are coupled with electrochemical processes through source/sink terms to describe the relevant processes in fuel cells.
3.1. Mass Continuity Equation
Equation (1) is used to describe the mass conservation for gas-phase components inside the cell and solved for the fuel and air channels and the respective electrodes:
The source term Sm in Equation (1) accounts for the mass balance caused by mass consumption or production from the electrochemical reaction (in catalyst layers or active layers).
It should be mentioned that the source terms can be expressed using the volumetric production/consumption rate of species due to the electrochemical reactions occurring at the triple-phase boundary (TPB). For SOFCs, it corresponds to the hydrogen consumption and water generation on the anode side, oxygen consumption on the cathode side, respectively.
For the anode active layer:
For the cathode active layer:
For the channels and diffusion layer: Sm = 0
In Equations (3) and (4), Mi means the molecular weight of the species, V refers to the volume of the control volume at the active sites, Aactive the electrochemically active area per volume, F is Faraday's constant, IA,act,a/c the volumetric transfer current of the reactions in the anode and cathode. We can define , to represent active surface area-to-volume ratio in TPB regions.
3.2. Momentum Conservation Equation
The governing equations for momentum transport is normally the Navier-Stokes equations applied in the fuel channels and the Darcy term added for the porous electrodes [7,8]. The physics of laminar and turbulent incompressible flow are well described by the Navier-Stokes equation, and it is a common practice to assume laminar flow for fuel cell gas channels due to the small velocities, which decreases the computational cost significantly [9].
The momentum equation reads:
The source term Sd can be expressed as follows:
3.3. Heat Conservation Equation
The thermal energy equation can be expressed as:
Equation (8) balances the convective energy, the heat conduction through the solid and the fuel gas mixture, the heat flux due to fuel gas species diffusion, and a source term ST. hi is the partial enthalpy of the ith species.
The effective parameters applied for the porous structures, such as effective thermal conductivity keff and effective specific heat cp,eff, can be evaluated as:
The source term for the thermal energy equation in the anode/cathode active layer due to the electrochemical reactions can be written as:
The reaction rate of the electrochemical reaction, appearing in the source terms is:
In Equation (11) Δhele is the net enthalpy change due to the electrochemical reactions, IA,act,a/c× η act,a/c is the product of the volumetric transfer current (A/m3) and the activation over-potential in the anode or cathode active layer, the so-called three phase boundary (TPB), Rohm is the ohmic resistivity in the charge conducting media. IA (A/m2) is the current flux density magnitude, n means number of electrons transferred per reaction.
3.4. The Species Conservation Equation
The species conservation equations are formulated in a general form:
In the anode/cathode active layer:
For the mass diffusion, the dusty-gas model is used in this work. The diffusion coefficients of species i in fuel duct are based on the binary coefficients, as given by [10,11]:
In the porous electrode, it is assumed that the mean free-path of the molecules is larger than the pore size which means the collisions between the molecules and the solid walls are more frequent than with other molecules. Then, Knudsen diffusion is evaluated as follows:
3.5. Ion and Electron Transport
The charge conservation equation is solved for the involved charge transport in the ionic/electronic phase. It involves the solution of the Poisson equations for the ionic/electric field over the entire region:
The electronic conductivities (σelectron) in the bulk anode (Ni) and the bulk cathode (LSM) materials, and ionic conductivity (σion) in the bulk electrolyte material (8YSZ) are defined in Equations (19)–(21), respectively:
For the porous electrodes, effective conductivity for electron/ion is estimated by Equation (22) [12]:
3.6. Electrochemical Reactions
In the anode duct, the fuel (e.g., H2) is supplied and air (O2 + N2) is introduced in the cathode ducts. Reactants are transported by diffusion and/or convection to the TPBs, where electrochemical reactions take place.
The actual open-circuit voltage (OCV) varies locally with gas composition and temperature in the electrodes, which can be determined by the Nernst equation [Equation (23)] for the electrochemical reaction of pure hydrogen and oxygen.
The open-circuit potential (OCV) is the maximum voltage which can be achieved by a fuel cell when no current flow is applied. However, the actual voltage of a real cell (E), i.e., the potential difference between the cathode and the anode, is lower than OCV when a current flow is applied. The difference between OCV and cell voltage E is due to the various potential losses. For the current work, the ohmic losses in the solid part of the SOFC, and activation and concentration losses at the TPBs are considered. Therefore, the operating cell voltage (E) can be expressed by Equation (25):
The activation loss (or over-potential) represents the energy lost due to the slowness of electrochemical reactions at the anode and the cathode active layers. A potential difference is needed at the interfaces between the electrode (metal for the electrons) and electrolyte material (YSZ for the ions) to drive the reaction away from equilibrium. In the equilibrium, the forward and backward reactions are happening at an equal rate. There are two activation over-potentials: one for the anode active layer and one for the cathode active layer. For each of these over-potentials, the Butler-Volmer equation relates the local value to the current density, as below:
4. Input Parameters and Boundary Conditions
The operating conditions and input parameters for the developed model are listed in Tables 4 and 5. The potential at the anode current collector is set to zero and the one at the cathode current collector as the cell operating voltage (0.7 V in this study). All other external boundaries and interfaces are electrically insulated.
5. Simulation Results and Discussion
The SOFC model outlined above is implemented by using the finite volume method (FVM) in the commercial code Ansys/Fluent 14, with the add-on fuel cell module. The SIMPLE scheme is used to calculate the velocity coupling with pressure, and the second order upwind differencing scheme (UDS) is used for convection and diffusion coupling. The user-defined function (UDF) file is complied into the model to define the electrochemical reactions and the source terms for the governing equations.
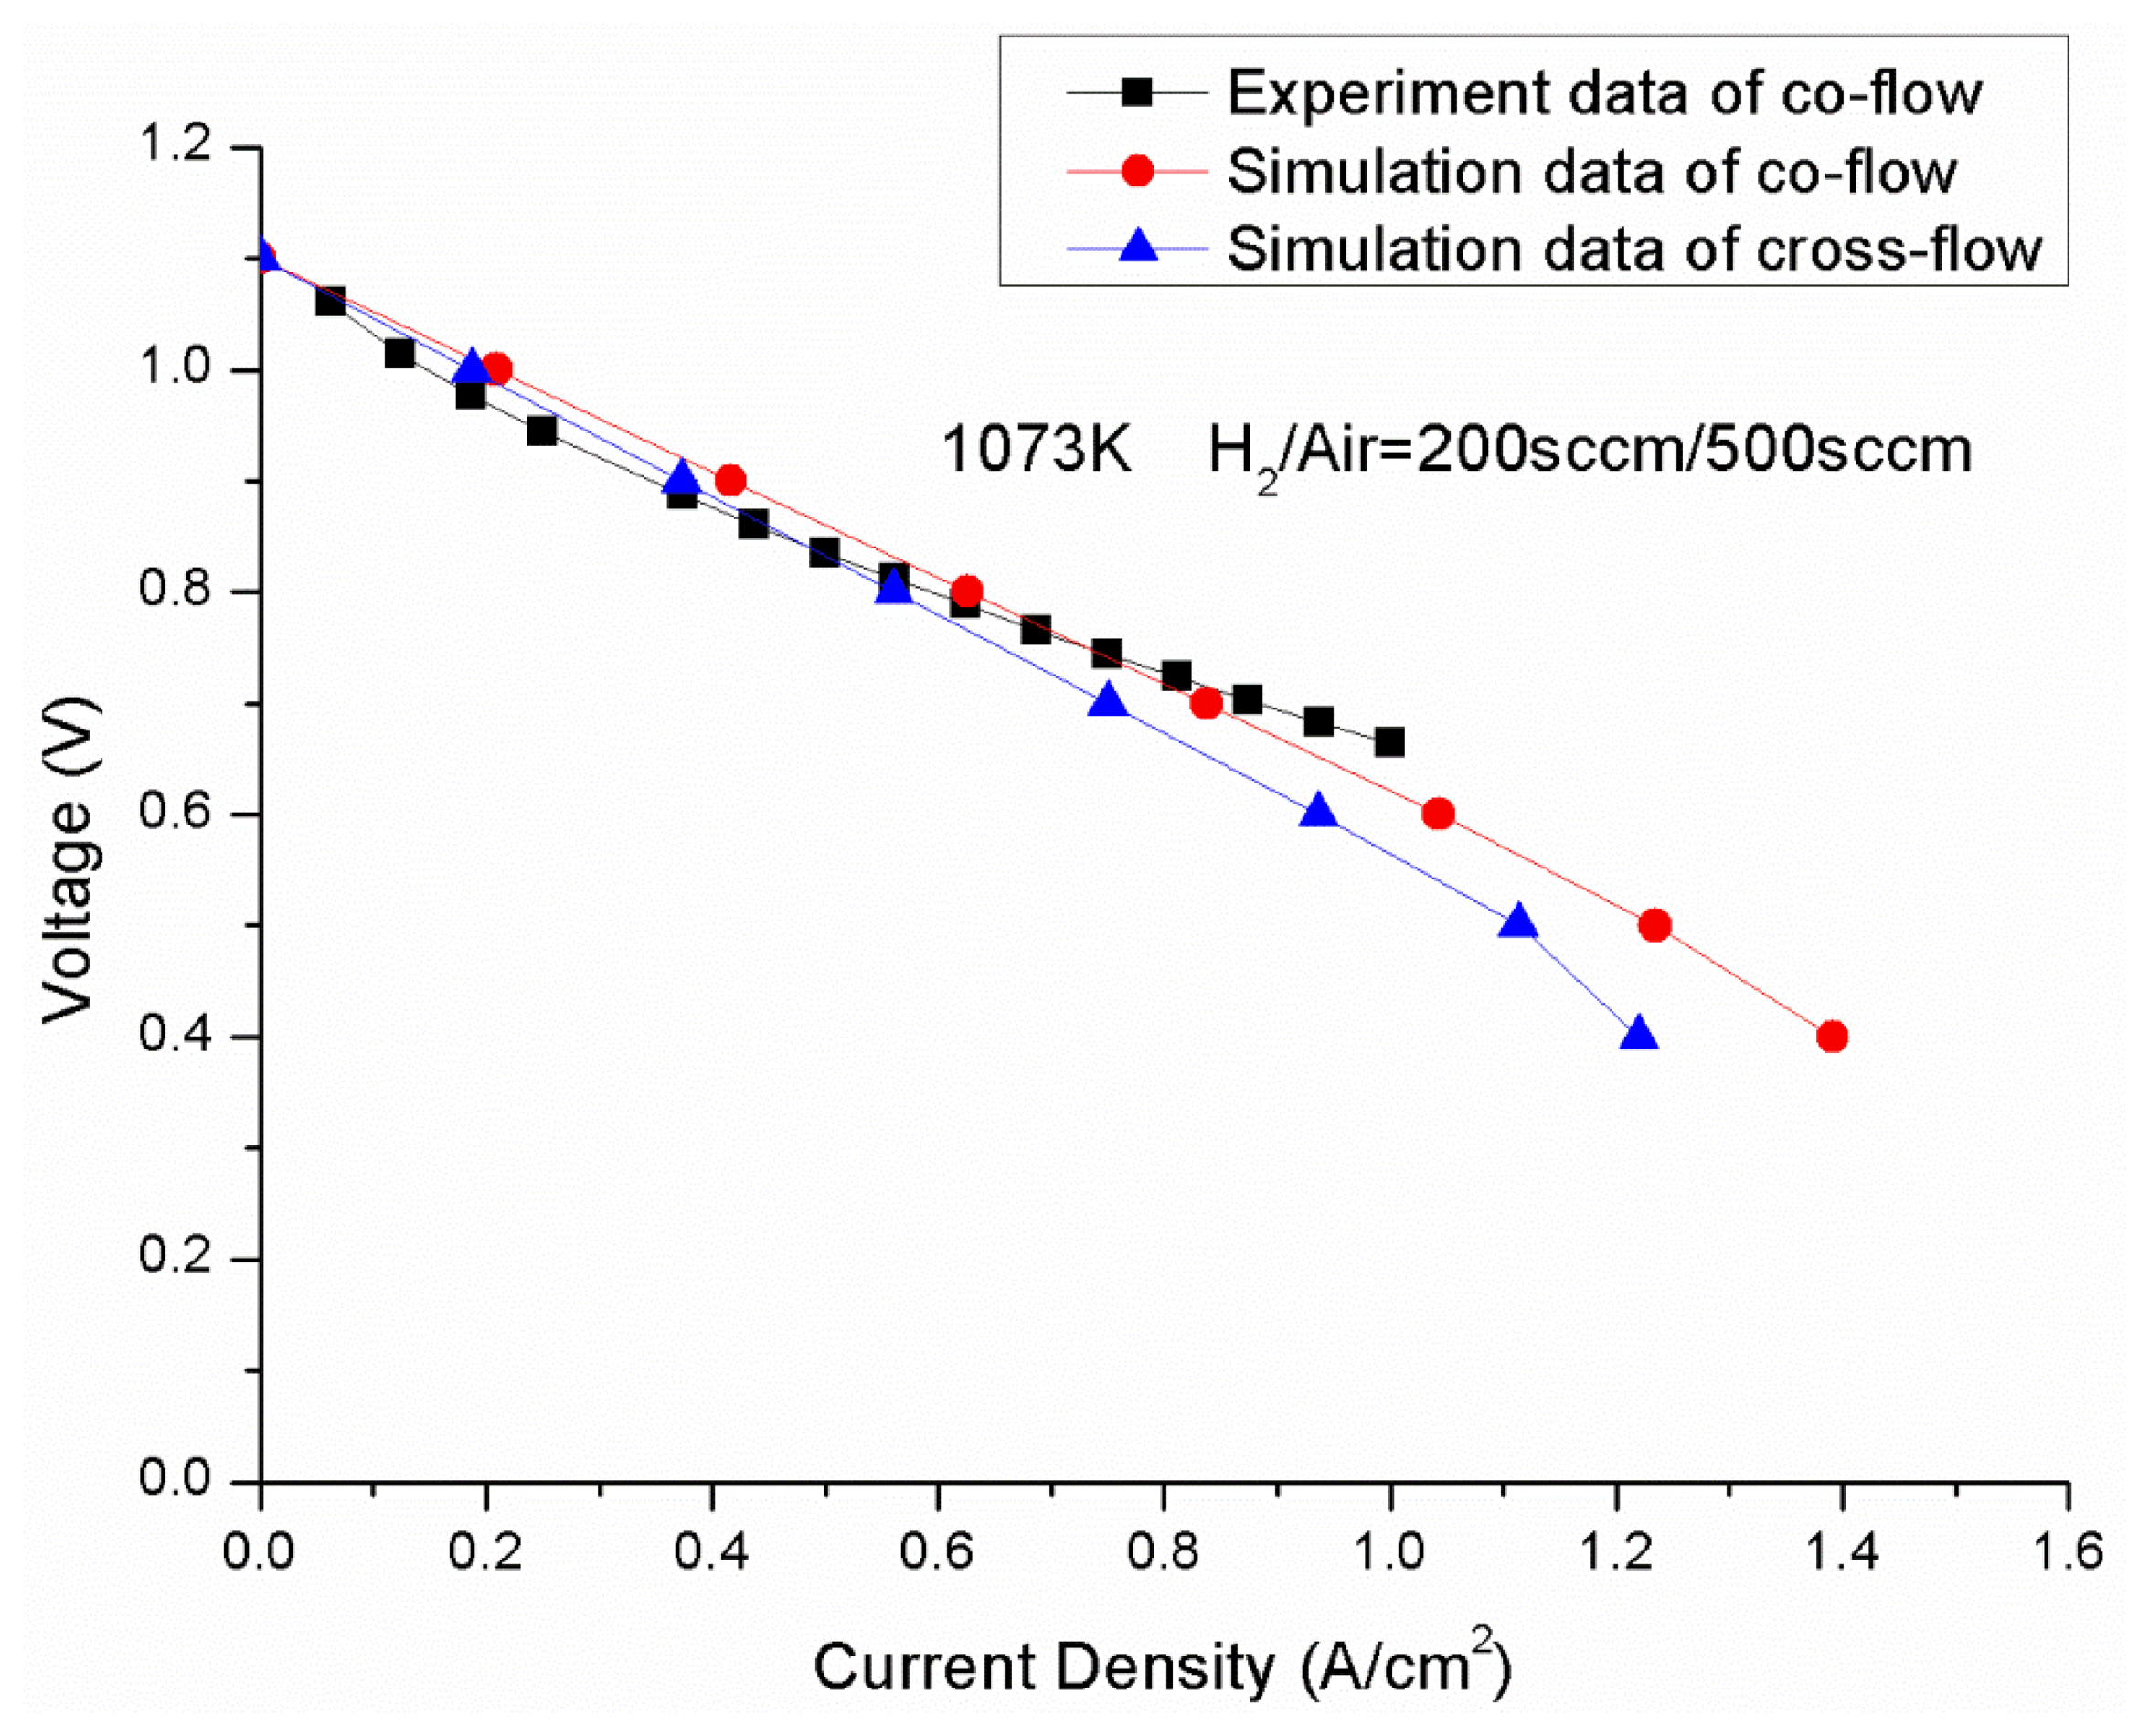
Ni-YSZ anode-supported SOFCs developed at the Chinese Academy of Sciences NIMTE were used for both the modeling and the experiment. The dimensions of the cells are 4 × 4 cm2, in which, a 400 μm thick Ni/8YSZ anode substrate was prepared by tape casting, followed by a 20 μm thick anode functional layer (anode TPB layer) and a 10 μm thick 8YSZ electrolyte layer. The cathode of the cell is a double LSM layer sprayed onto the anode substrate before it was co-sintered. The cells were tested in an alumina testing chamber. Platinum and nickel foils were used as current collectors at the cathode and anode sides, respectively. Silver mesh sandwiched between LSM was utilized for gas distribution at the cathode side; the silver mesh was applied to decrease the contact resistance between the cathode and the current collector. For the anode side, two layers of nickel foam were used for gas distribution and current collection. Air and humidified hydrogen were introduced into the cathode and anode, respectively. The operating temperature was 800 °C. The flow rate of hydrogen was 200 sccm, and the air flow rate was 500 sccm. Figure 3 shows the V-I curve predicted from CFD model compared with the experimental data under the same operating conditions. The cell was tested in a 800 °C heated oven, so the thermal isolation is assumed for the external walls during the validation, to agree with the experimental conditions.
Considering the cells in the stack (except the cell at the top and bottom), we can define the outside wall of the cell being adiabatic. The operating conditions for the developed model are given as follows: operating voltage 0.7 V; the mass flow rate of fuel inlet per duct: 2 × 10⁻⁸ kg/s, the mass flow rate of air inlet per duct: 0.8 × 10⁻⁶ kg/s, as specified in Table 5.
6.1. Temperature Distribution
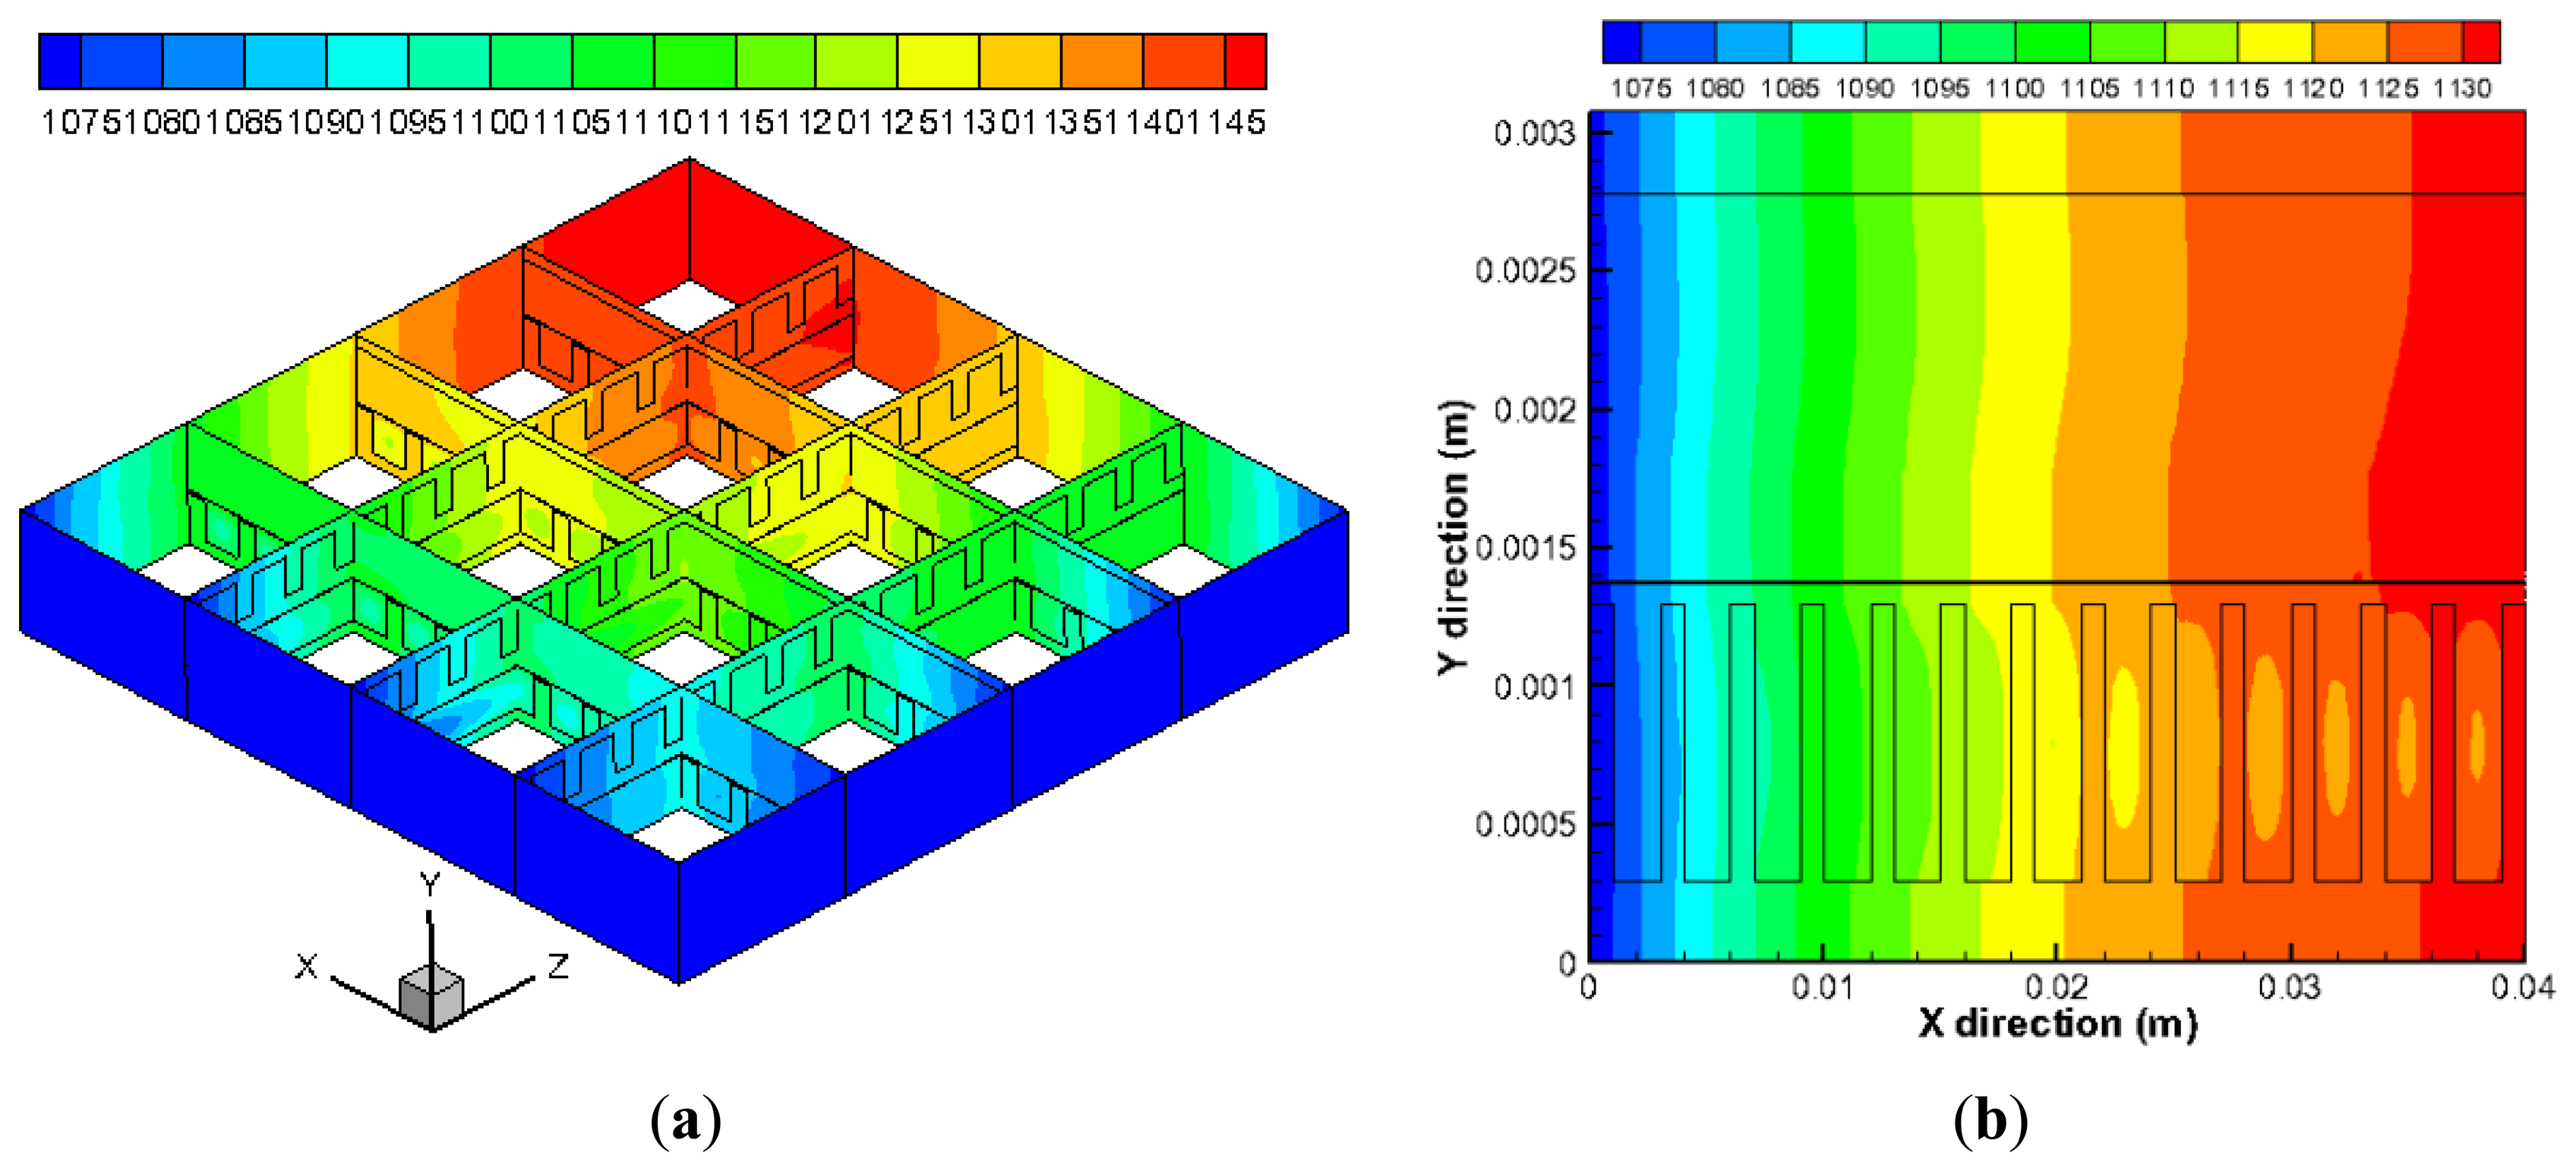
The predicted temperature distribution in the cell is shown in Figure 4. It is found in the Figure 4a that the temperature in the anode and cathode inlet is the lowest (1073 K), then it rises along the flow directions as the heat is generated due to the electrochemical reactions. The temperature reaches the maximum value about 1150 K in the regions close to the outlets of the fuel and air channels. Figure 4b shows the temperature distribution along the cell thickness direction (y) in the plane z = 0.02 m. The temperature in the air channels (bottom part) is lower than that in fuel channel at the same x position. This is because the mass flow rate of air (500 sccm) in the cathode is substantially higher than that in the anode side (200 sccm), and more heat is taken away by the flowing air.
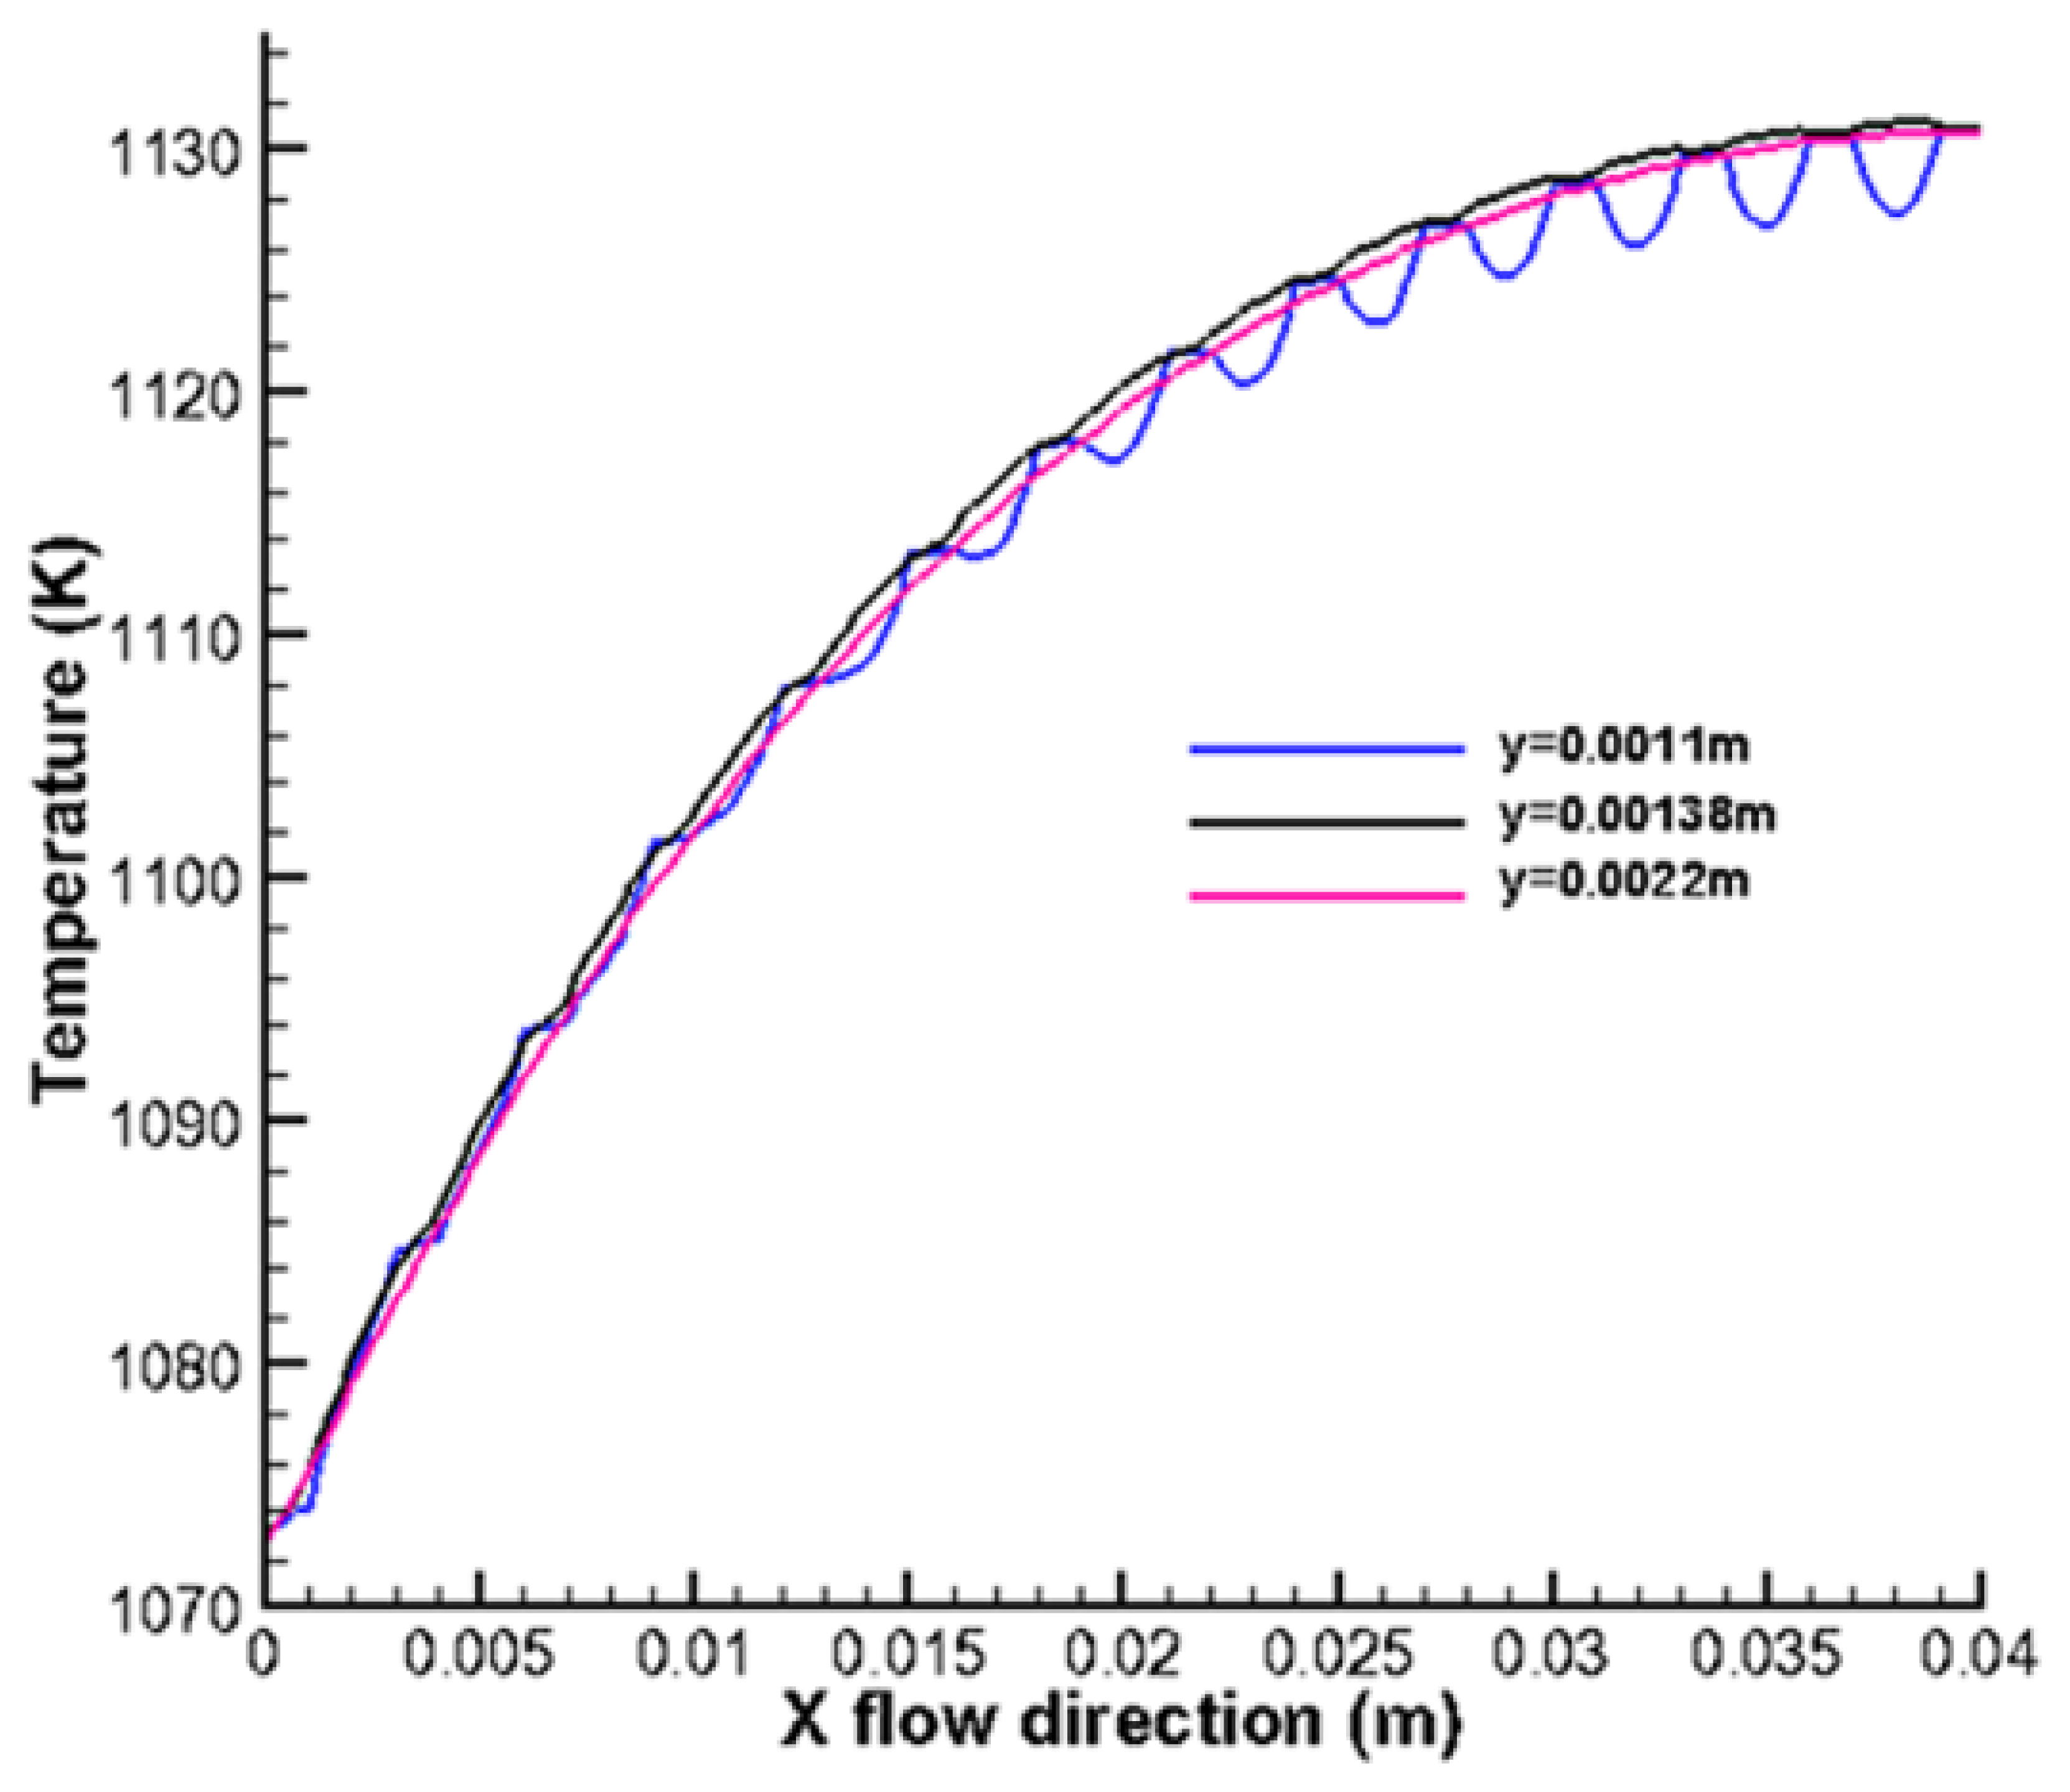
Figure 5 shows the temperature distribution along the fuel main flow direction in the plane z = 0.02 m at different cell height, i.e., y = 0.0011 m, 0.00138 m and 0.0022 m, respectively. It is revealed that, for the cross-flow arrangement, the temperature difference between different cell heights is very small and the temperatures in the fuel channel (y = 0.0022 m) and the electrolyte (y = 0.00138 m) are all increased along the fuel flow direction (x-direction), and the value of the temperature for y = 0.0011 m is a wave-shaped curve. This is because the temperature of the air is lower than that of the solid part in the cathode (see Figure 4b); The temperature in the electrolyte is the highest because of the heat source produced by the electrochemical reactions occurring nearby.
6.2 Flow Field of Gases
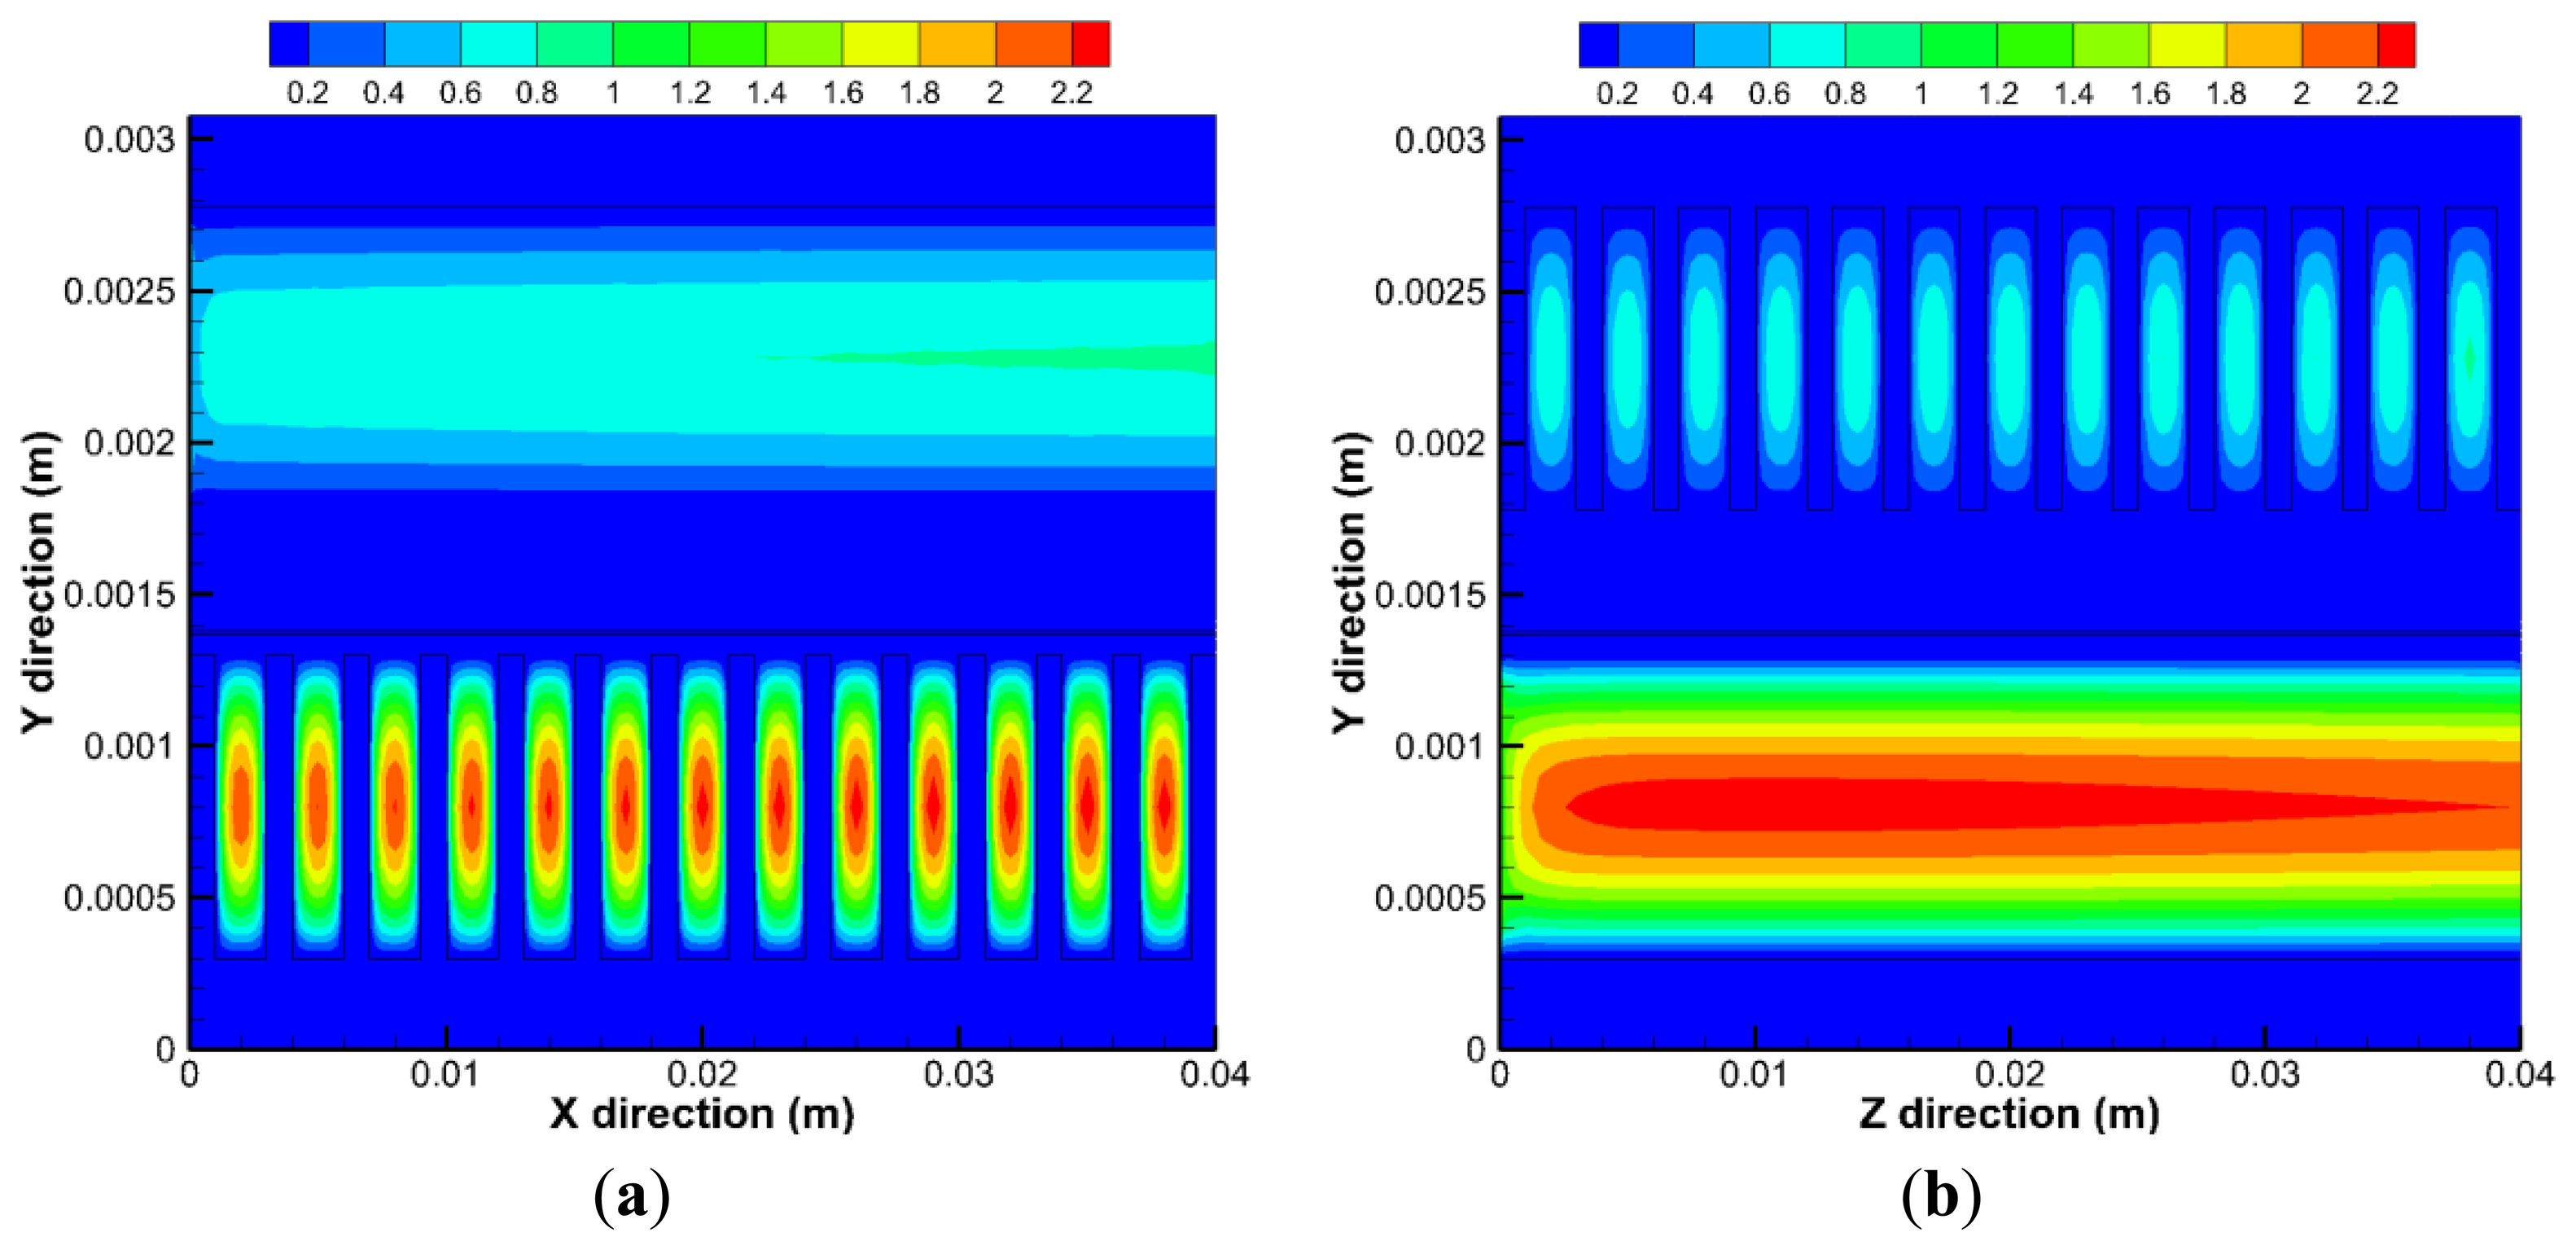
Figure 6 shows the predicted velocity distribution in both the anode and cathode. As shown in Figure 6, the velocity in the air channel is much larger than that in the fuel channel. This is because the gas flow rate in the cathode (500 sccm) is substantially higher than that in the anode side (200 sccm).
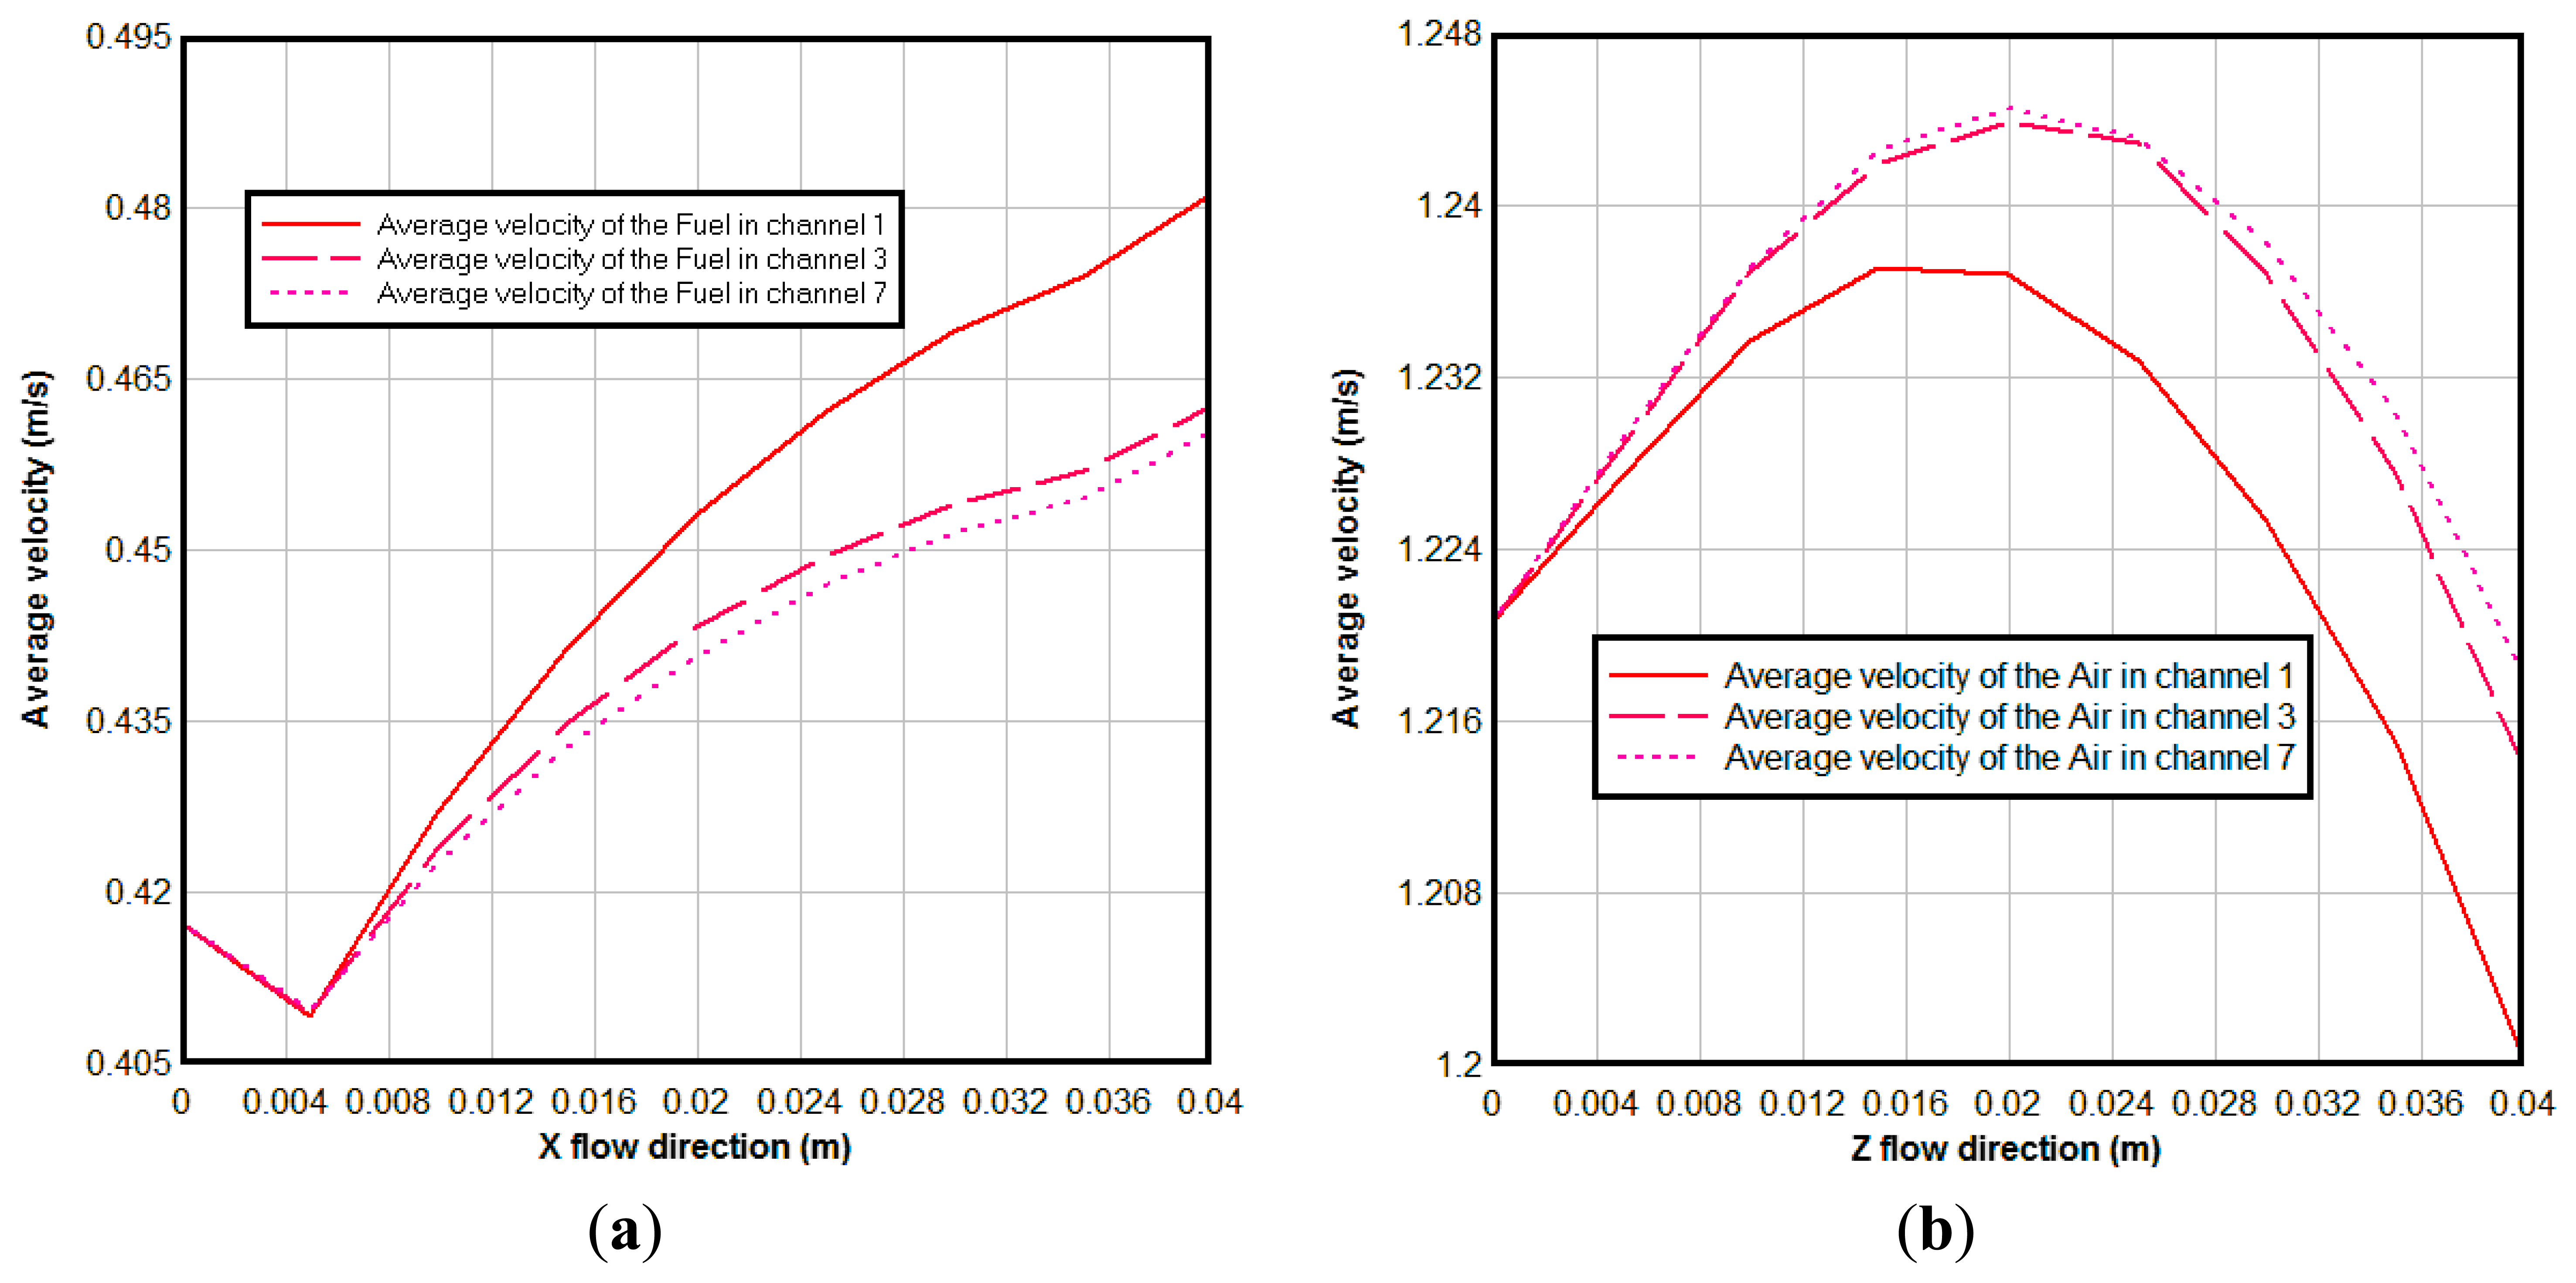
Figure 7 shows the average velocity of the gas in different channels. From Figure 7a we can see the average velocity of the fuel is decreased at first from the channel inlet, due to the fuel diffused to the anode diffusion layer at the beginning; then it is increased along the flow direction, it is so because the temperature is increased along the main flow direction and H2O generation due to the electrochemical reactions in the anodic TPBs. It can be seen also that the average velocity in the channel 1 is bigger than that in channel 3 and 7. This happened due to two reasons: first, the channel 1 is at the side of the cell, and correspondingly more reaction areas are expected; second, channel 1 is near the air inlet where the concentration of the O2 is higher. More reaction areas and high concentration of the O2 result in stronger electrochemical reactions here. At the cathode the oxidant reduction reaction occurs, i.e., O2 is consumed. This may reduce the velocity of the air in the air channel. At the same time, the high temperature increases the velocity of the air. In overall, the air velocity magnitude reaches to a maximum value and then decreases to the lowest value in the outlet, as seen in Figure 7b. The same reasons as for in the anode cause the average velocity of air channel 1 being lower than that in channels 3 and 7.
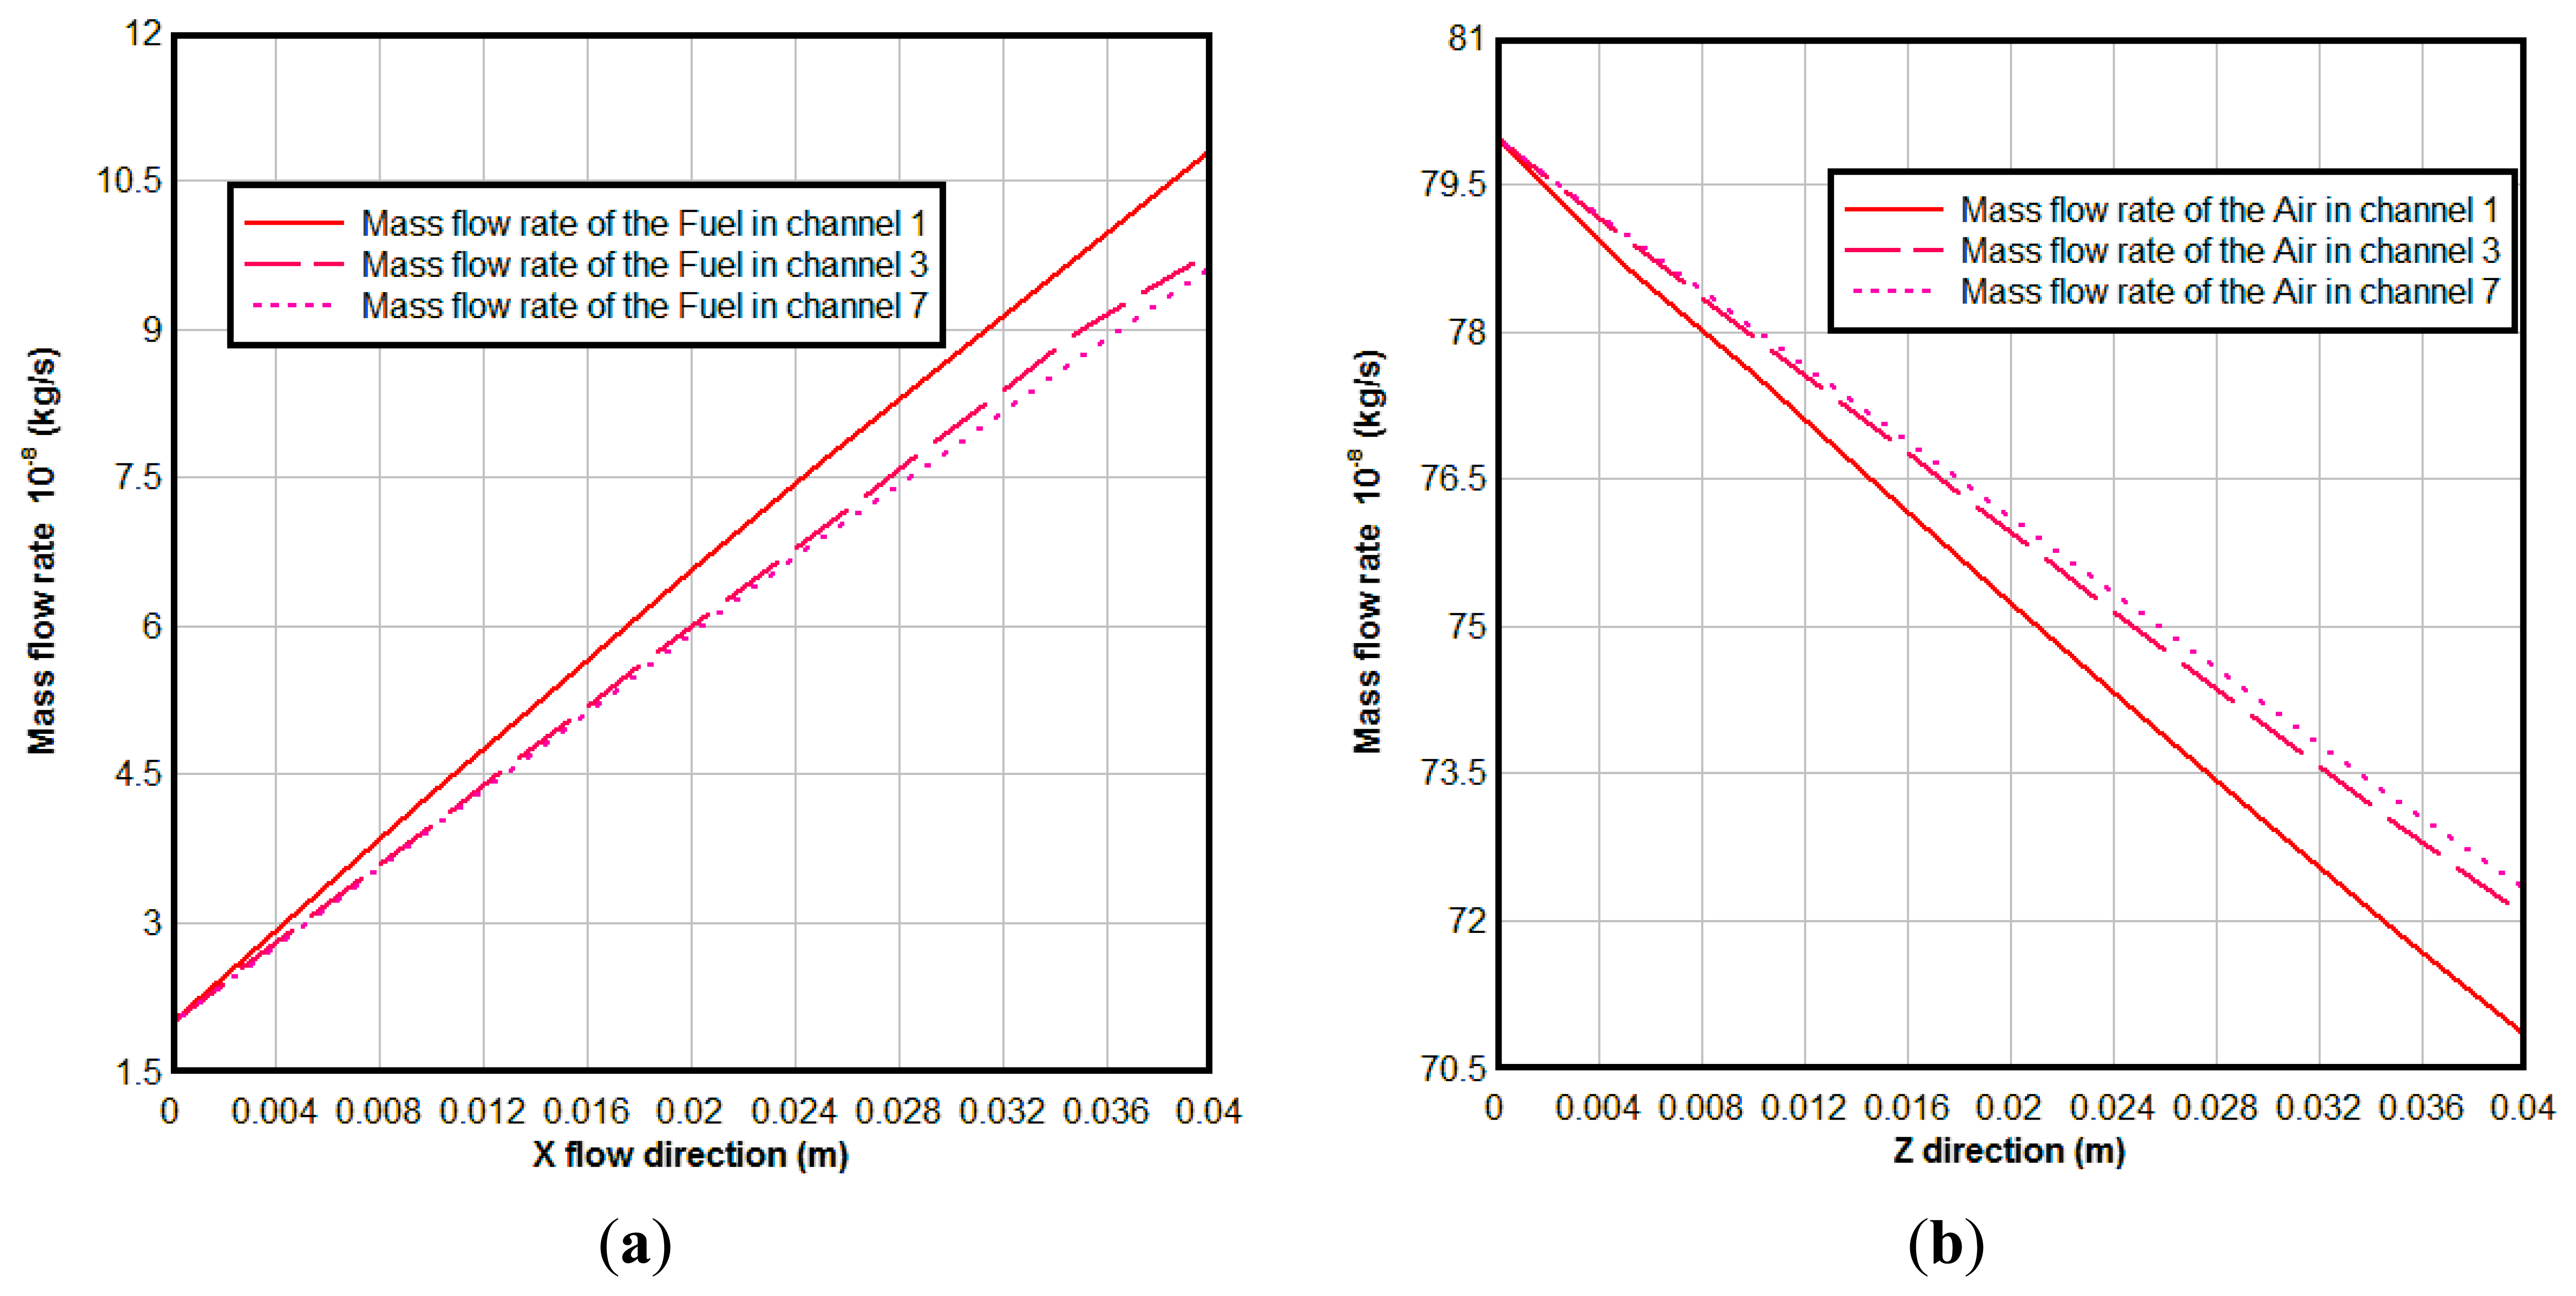
Figure 8 is the mass flow rate of the gases in different channels, From Figure 8, we can see that the mass flow rate of the fuel increases along the fuel flow direction, because of the H2O generation due to the electrochemical reactions in the anodic TPBs; while the mass flow rate of the air decreases along the air flow direction due to the O2 consumed in the cathode. The reason for the mass flow rate of fuel in channel 1 being bigger than that in channel 3 and channel 7 is that more reaction areas and high concentration of the O2 result in stronger electrochemical reactions here.
From Figures 7 and 8, we can see that although there is a constant mass flow rate of gas in the inlet of each channel, the flow distribution is non-uniform along the flow direction because electrochemical reaction rate is different in different locations. The amount of fuel transported to the active surfaces for the electrochemical reactions is governed by different parameters, such as porous microstructure, gas consumption rate, pressure gradient between the fuel flow duct and the porous anode, and the inlet conditions, etc. [19].
6.3 Mole Fraction of the Gases
For the case of H2/H2O composition of 0.95/0.05, air as oxidant, 800 °C and cell operating voltage 0.7 V, the mole fractions of hydrogen at the inlet and outlet are 0.95 and 0.4, respectively. Based on Equation (29), the fuel utilization is about 0.60:
From Equation (23), the mole fraction or partial pressure of hydrogen in the anode is an important factor determining OCV and thus the current density. In the anode channels, the mole fraction of hydrogen is high, which diffuses towards the active layer, for the electrochemical reaction. Hydrogen is consumed and water vapor generated. It is also interesting to have a close look at the hydrogen distribution inside the anode and fuel channels.
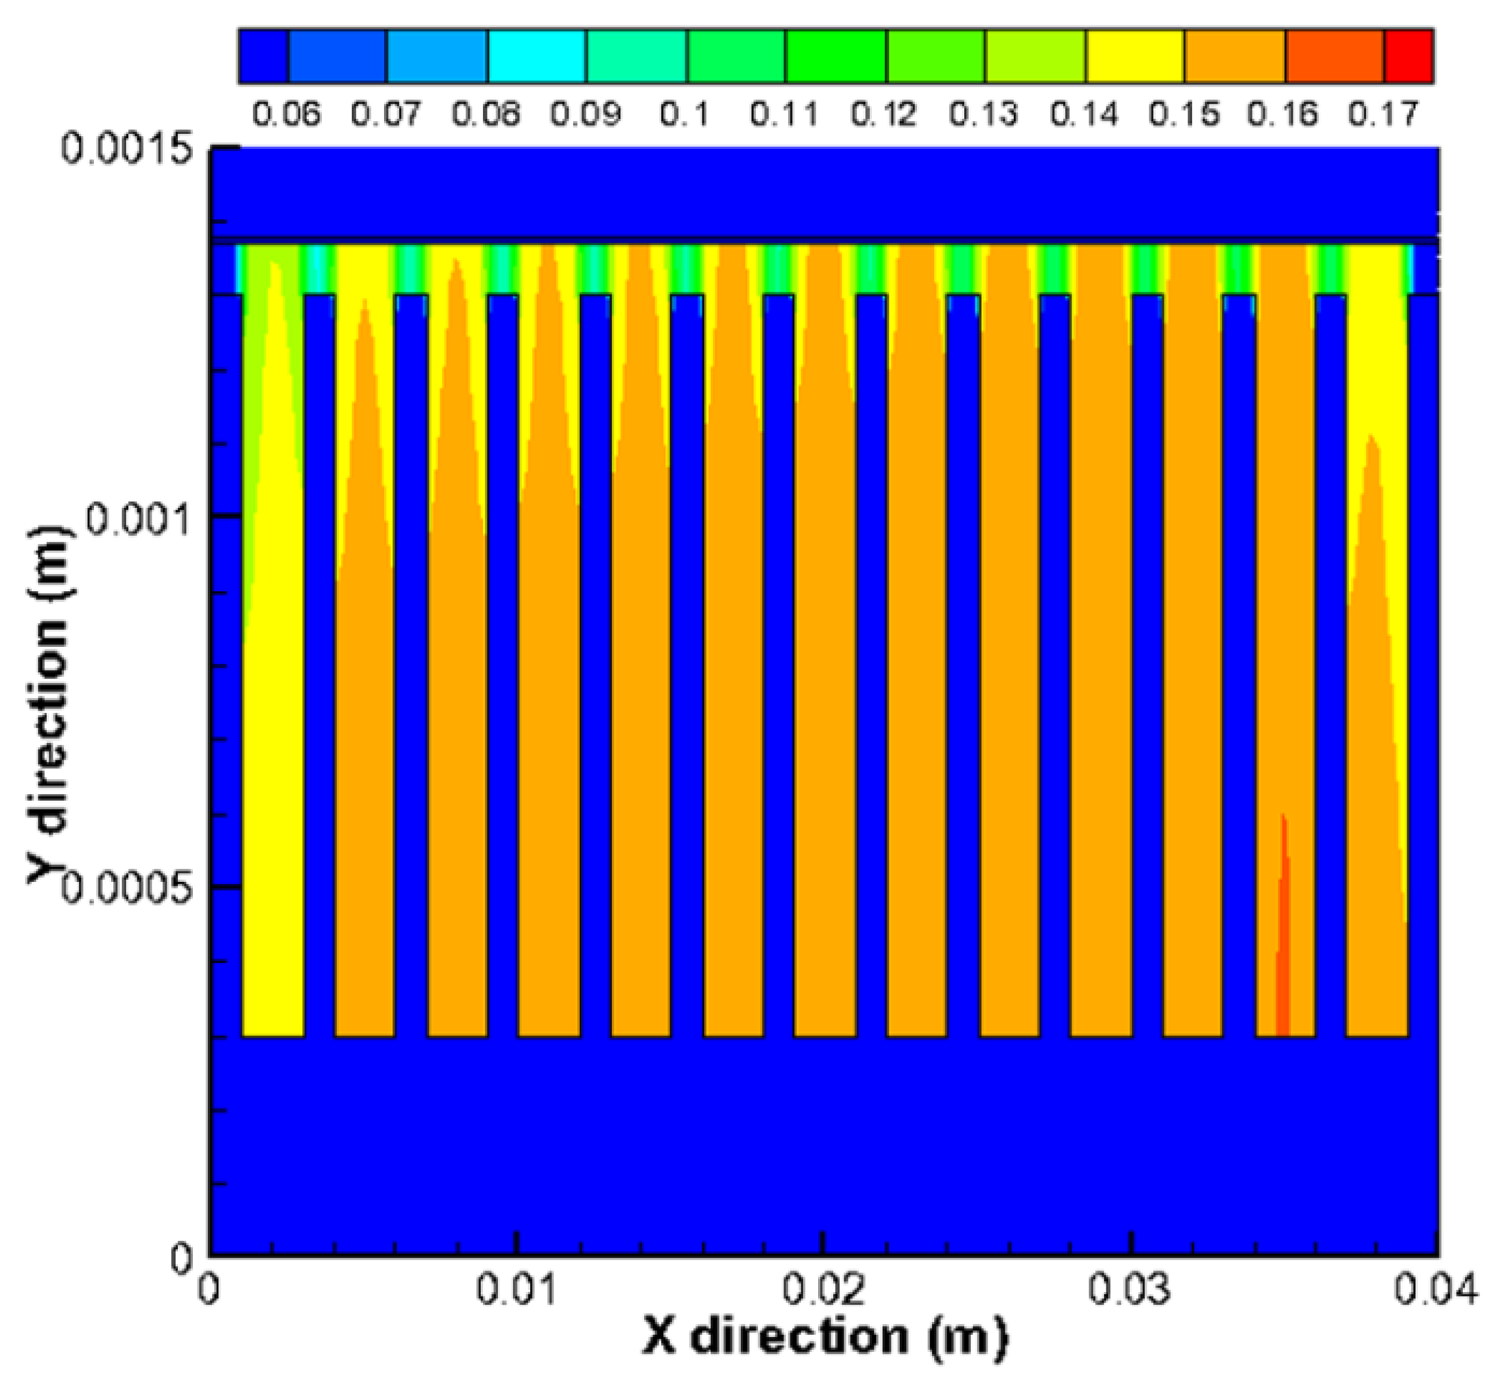
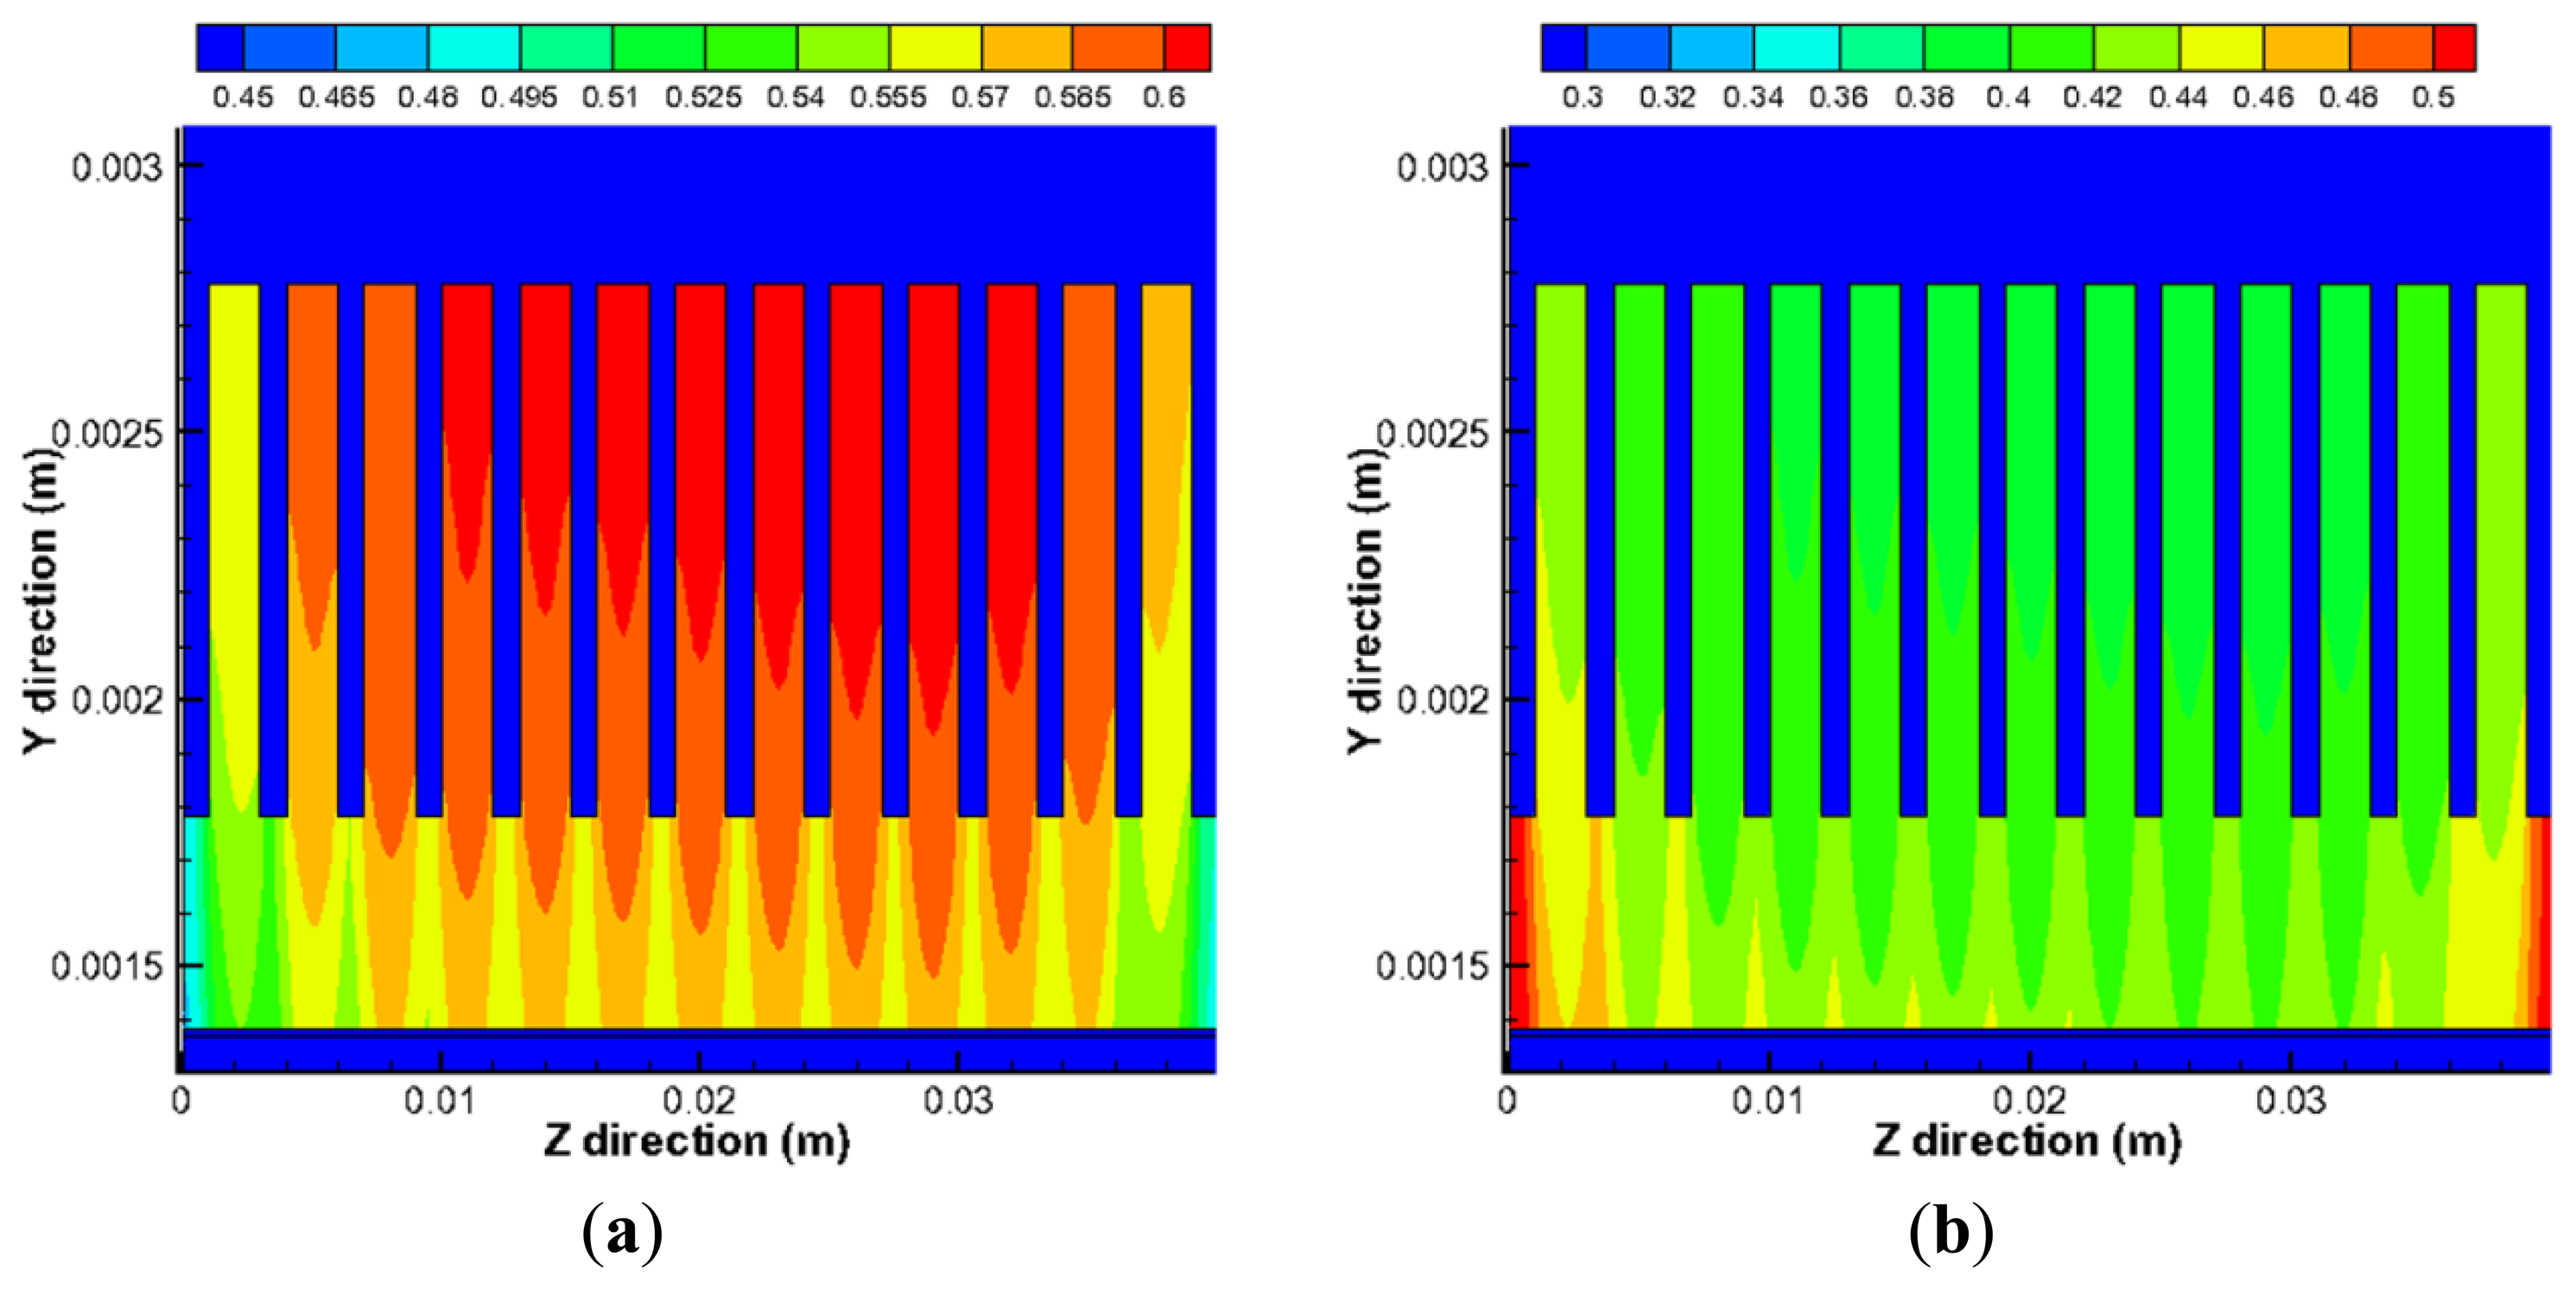
Figure 9 shows the mole fraction distribution of gases for a cross-flow section in the plane x = 0.03 m. In Figure 9a, the bottom (y is 0.00137–0.00138 m) and top (y is 0.00278–0.00308 m) regions represent the electrolyte and interconnect, respectively, while the middle parts are for fuel channels/ribs (y is 0.00178–0.00278 m) and anode (y is 0.00138–0.00178 m). It is clear that the mole fraction of H2 in the side channels is smaller compared with the middle channels. It can be also seen that the mole fraction of H2 decreases in the electrode from the fuel channel/electrode interface (y = 0.00178 m) to electrode/electrolyte interface (y = 0.00138 m), while the opposite finding is observed for H2O in Figure 9b. This is due to the electrochemical reaction occurring at the bottom of the anode, where there is a depletion of hydrogen and production of water vapor. The gradients are higher in the porous zone because the fluid flow velocity is much smaller in the substrate of the anode. The H2 mass transport by the diffusion becomes dominant compared to the convective mass transport. It is also found that, due to H2 mole fractions unevenly distributed between each channels, a very small mole fraction of H2 appears in the anode under the side channels. For the porous region under the channels, it is revealed that the mole fraction of H2 is higher, while for the regions under the ribs between the channels, the mole fraction is lower. It is so because the H2 diffusion to the places under the ribs is much limited due to the longer diffusion pathway.
Figure 10 is the mole fraction of O2 for a cross-section in the plane z = 0.03 m. In Figure 10, the bottom (y is 0–0.0003 m) and top (y is 0.00137–0.00138 m) regions represent the interconnect and electrolyte, respectively, while the middle parts are for channels/ribs (y is 0.0003–0.0013 m) and cathode (y is 0.0013–0.00137 m). It is found that the O2 has almost the similar distribution as the H2 (Figure 9a), except that the mole fraction of the O2 in the cathode electrode/electrolyte interface (y = 0.00137 m) is higher than that of the H2. This is because the cathode (0.07 mm) is much thinner than the anode (0.4 mm). On the other hand, the O2 is hardly diffused to the places under the ribs compared with those under the channels in such a thin thickness, which results in a steped distribution of O2 in the cathode (y is 0.0013–0.00137 m).
6.4. Current Density Distribution
From Figure 11a, it is revealed that the current density distribution along the air main flow direction is very uneven in the electrodes, and the maximum value is located at the interfaces between the ribs and the cathode electrodes, and the minimum value appears in the anode electrodes corresponding to the middle of the channels. This is so because the electrons always transfer in the shortest path. From Figure 11b, it is also found that the maximum value of the current density in the cathode is decreased alone the X direction as the hydrogen in the fuel is being consumed along this direction and its concentration decreases.
From Figure 12, we can find that the maximum current density in the cathode active area is larger than that in anode active area. The reason is that the thickness of the cathode electrode (0.07 mm) is much smaller than that of the anode (0.4 mm). It is also seen that the current density is decreased along the fuel flow direction (X direction), as the fuel concentration becomes low, even compensated by an increased temperature along the main flow direction [20].
Generally speaking, the distribution of the current density is determined by various parameters, such as porous microstructure, gas concentration, geometry structure of the gas channel, operating conditions. A big current density results in a big over-potential in the active area, and also leads to the big ohmic heat generation there. The uneven current density distribution is harmful to the performance and working life time of the fuel cells.
7. Conclusions
In this study, a three-dimensional computational fluid dynamics (CFD) model has been developed and applied for an anode-supported planar SOFC. The simulation results of the developed model are in agreement with the experimental data obtained under the same conditions. With the simulation results, the distribution of temperature, flow velocity and the fuel gas concentrations through the cell components and gas channels are presented and discussed. Potential and current density distributions in the cell and overall fuel utilization are also presented. It is found that the significant temperature gradients exist along the length of the cell, and the maximum value of the temperature for the cross-flow is at the outlet region of the cell. The distribution of the current density is uneven, and the maximum of the current density is located at the interfaces between the channels, ribs and the electrodes. The maximum current density results in the large over-potential and heat source in the electrodes, which is harmful to the overall performance and working life time of the fuel cells. New types of flow structures may be possible to make the current flow more evenly distributed and promote most of the TPB areas taking part in the electrochemical reaction.
Acknowledgments
This work was supported by the National Natural Science Foundation of China (21276036).
Conflicts of Interest
The authors declare no conflict of interest.
References
- Li, P.-W.; Schaefer, L.; Chyu, M.K. Transport Phenomena in Fuel Cells. In Multiple Transport Processes in Solid Oxide Fuel Cells; ISBN 9781853128400; Sundén, B., Faghri, M., Eds.; WIT Press: Southampton, UK, 2005; Chapter 1. [Google Scholar]
- Yuan, J.; Huang, Y.; Sundén, B.; Wang, W.G. Analysis of parameter effects on chemical reaction coupled transport phenomena in SOFC anodes. Heat Mass Transf. 2009, 45, 471–484. [Google Scholar]
- Nam, J.H.; Jeon, D.H. A comprehensive micro-scale model for transport and reaction in intermediate temperature solid oxide fuel cells. Electrochim. Acta 2006, 51, 3446–3460. [Google Scholar]
- Goodenough, J.B.; Huang, Y.-H. Alternative anode materials for solid oxide fuel cells. J. Power Sources 2007, 173, 1–10. [Google Scholar]
- Haile, S.M. Fuel cell materials and components. Acta Mater. 2003, 51, 1981–2000. [Google Scholar]
- Kakac, S.; Pramuanjaroenkij, A.; Zhou, X.Y. A review of numerical modeling of solid oxide fuel cells. Int. J. Hydrog. Energy 2007, 32, 761–786. [Google Scholar]
- Versteeg, H.K.; Malalasekera, W. An Introduction to Computational Fluid Dynamics: The Finite Volume Method; Pearson: London, UK, 1995. [Google Scholar]
- Damm, D.L.; Fedorov, A.G. Local thermal non-equilibrium effects in porous electrodes of the hydrogen fueled SOFC. J. Power Sources 2006, 159, 1153–1157. [Google Scholar]
- Chao, C.H.; Hwang, A.J.J. Predictions of phase temperatures in a porous cathode of polymer electrolyte fuel cells using a two-equation model. J. Power Sources 2006, 160, 1122–1130. [Google Scholar]
- Yuan, J.; Faghri, M.; Sundén, B. Chapter 4: On Heat and Mass Transfer Phenomena in PEMFC and SOFC and Modeling Approaches. In Transport Phenomena in Fuel Cells; ISBN 1-85312-840-6; Sundén, B., Faghri, M., Eds.; WIT Press: Ashurst Lodge, Ashurst Southampton, UK, 2005; pp. 133–174. [Google Scholar]
- Yuan, J.; Sundén, B. On mechanisms and models of multi-component gas diffusion in porous structures of fuel cell electrodes. Int. J. Heat Mass Transf. 2014, 69, 358–374. [Google Scholar]
- Hussain, M.M.; Li, X.; Dincer, I. Mathematical modeling of transport phenomena in porous SOFC anodes. Int. J. Therm. Sci. 2007, 46, 48–56. [Google Scholar]
- Kanno, D.; Shikazono, N.; Takagi, N.; Matsuzaki, K.; Kasagi, N. Evaluation of SOFC anode polarization simulation using three-dimensional microstructures reconstructed by FIB tomography. Electochim. Acta 2011, 56, 4015–4021. [Google Scholar]
- Iwai, H.; Shikazono, N.; Matsui, T.; Teshima, H.; Kishimoto, M.; Kishida, R.; Hayashi, D.; Matsuzaki, K.; Kanno, D.; Saito, M.; et al. Quantification of SOFC anode microstructure based on dual beam FIB-SEM technique. J. Power Sources 2010, 195, 955–961. [Google Scholar]
- Aguiar, P.; Adjiman, C.S.; Brandon, N.P. Anode-supported intermediate temperature direct internal reforming solid oxide fuel cell. I: Model-based steady-state performance. J. Power Sources 2004, 138, 120–136. [Google Scholar]
- Patcharavorachor, Y.; Arpornwichanop, A.; Chuachuebsuk, A. Electrochemical study of a planar solid oxide fuel cell: Role of support structures. J. Power Sources 2001, 93, 130–140. [Google Scholar]
- Andersson, M.; Yuan, J.; Sundén, B. SOFC modeling considering electrochemical reactions at the active three phase boundaries. Int. J. Heat Mass Transfer 2012, 55, 773–788. [Google Scholar]
- Janardhanan, V.; Deutschmann, O. CFD analysis of a solid oxide fuel cell with internal reforming: Coupled interactions of transport, heterogeneous catalysis and electrochemical processes. J. Power Sources 2006, 162, 1192–1202. [Google Scholar]
- Yuan, J.; Sundén, B. Analysis of chemically reacting transport phenomena in an anode duct of intermediate temperature SOFCs. ASME J. Fuel Cell Sci. Technol. 2006, 3, 89–98. [Google Scholar]
- Zhu, H.; Kee, R.J.; Janardhanan, V.M.; Deutschmann, O.; Goodwin, D.G. Modeling elementary heterogeneous chemistry and electrochemistry in solid-oxide fuel cells. J. Electrochem. Soc. 2005, 152, A2427–A2440. [Google Scholar]


| Parameters | Values | Unit |
|---|---|---|
| Cell length (x-fuel, z-air) | 40 | mm |
| Cell width (z-fuel, x-air) | 40 | mm |
| Channel width (z-fuel, x-air) | 2 | mm |
| Channel height (y) | 1 | mm |
| Total number of channels | 13 | - |
| Thickness of the anode diffusion layer (y) | 0.38 | mm |
| Thickness of the anode/cathode active layer (y) | 0.02 | mm |
| Thickness of the cathode diffusion layer (y) | 0.05 | mm |
| Thickness of the electrolyte (y) | 0.01 | mm |
| Height of the interconnect (y) | 1.3 | mm |
| Domain | ε | τ | Veff |
|---|---|---|---|
| Anode | 0.3 | 10 | YSZ:0.60/Ni:0.40 |
| Cathode | 0.3 | 10 | YSZ:0.60/LSM:0.40 |
| Domain | [-]ref mol/m3 | r | α | Ai 1/(Ωm2) | Ea (kJ/mol) | n |
|---|---|---|---|---|---|---|
| Anode | 10.78 | 0.5 | 0.5 | 6.54 × 10¹¹ | 140 | 2 |
| Cathode | 2.38 | 0.5 | 0.5 | 2.35 × 10¹¹ | 137 | 2 |
| Title | Anode diffusion layer | Anode active layer | Electrolyte | Cathode active layer | Cathode diffusion layer | Solid interconnect |
|---|---|---|---|---|---|---|
| Porosity [17] ε | 0.3 | 0.3 | 0 | 0.3 | 0.3 | 0 |
| Permeability β (m2) | 2 × 10⁻¹⁰ | 2 × 10⁻¹¹ | 0 | 2 × 10⁻¹¹ | 2 × 10⁻¹⁰ | 0 |
| Specific heat [18] Cp (J/kg K) | 450 | 450 | 550 | 430 | 430 | 550 |
| Thermal conductivity [6] K (W/m·K) | 11 | 11 | 2.7 | 6 | 6 | 20 |
| Active surface area to volume ratio, Ave, (m2/m3) | 1.08 × 10⁵ | 1.3 × 10⁵ | - | 1.3 × 10⁵ | 1.08 × 10⁵ | - |
| Title | Boundary condition | Temperature, K | Species | Oxygen ion | Electron |
|---|---|---|---|---|---|
| Fuel inlet per duct | Mass flow rate: 2 × 10⁻⁸ kg/s | T = 1073 | YH2 = 0.95 YH2O = 0.05 | None | None |
| Top wall of the anode interconnect | Wall | Adiabatic | None | None | 0 V |
| Bottom wall of the cathode interconnect | Wall | Adiabatic | None | None | 0.7 V |
| Air inlet per duct | Mass flow rate: 8 × 10⁻⁷ kg/s | T = 1073 | YO2 = 0.233 YN2 = 0.767 | None | None |
| Fuel outlet | Pressure outlet | convection | convection | None | None |
| Air outlet | Pressure outlet | convection | convection | None | None |
© 2013 by the authors; licensee MDPI, Basel, Switzerland. This article is an open access article distributed under the terms and conditions of the Creative Commons Attribution license( http://creativecommons.org/licenses/by/3.0/).
Share and Cite
Zhang, Z.; Chen, J.; Yue, D.; Yang, G.; Ye, S.; He, C.; Wang, W.; Yuan, J.; Huang, N. Three-Dimensional CFD Modeling of Transport Phenomena in a Cross-Flow Anode-Supported Planar SOFC. Energies 2014, 7, 80-98. https://doi.org/10.3390/en7010080
Zhang Z, Chen J, Yue D, Yang G, Ye S, He C, Wang W, Yuan J, Huang N. Three-Dimensional CFD Modeling of Transport Phenomena in a Cross-Flow Anode-Supported Planar SOFC. Energies. 2014; 7(1):80-98. https://doi.org/10.3390/en7010080
Chicago/Turabian StyleZhang, Zhonggang, Jingfeng Chen, Danting Yue, Guogang Yang, Shuang Ye, Changrong He, Weiguo Wang, Jinliang Yuan, and Naibao Huang. 2014. "Three-Dimensional CFD Modeling of Transport Phenomena in a Cross-Flow Anode-Supported Planar SOFC" Energies 7, no. 1: 80-98. https://doi.org/10.3390/en7010080