Abstract
As of today, the considerable influence of select environmental variables, especially irradiance intensity, must still be accounted for whenever discussing the performance of a solar system. Therefore, an extensive, dependable modeling method is required in investigating the most suitable Maximum Power Point Tracking (MPPT) method under different conditions. Following these requirements, MATLAB-programmed modeling and simulation of photovoltaic systems is presented here, by focusing on the effects of partial shading on the output of the photovoltaic (PV) systems. End results prove the reliability of the proposed model in replicating the aforementioned output characteristics in the prescribed setting. The proposed model is chosen because it can, conveniently, simulate the behavior of different ranges of PV systems from a single PV module through the multidimensional PV structure.
1. Introduction
The first step to study about an appropriate control method in photovoltaic systems is to know how to model and simulate a PV system attached to the converter and power grid. In general, PV systems present nonlinear Power-Voltage (P-V) and Current-Voltage (I-V) characteristics which tightly depend on the receiving irradiance levels and ambient conditions. The mathematical model of the photovoltaic device is significantly valuable for studying the maximum power point tracking algorithms, doing research about the dynamic performance of converters, and also for simulating photovoltaic components by using circuit simulators [,,].
Despite the recent advancements in PV cell technology, the effects of certain disruptive environmental factors, which remarkably reduce the efficiency of photovoltaic arrays, still remain an inevitable hurdle. One of these environmental phenomena is partial shading which causes the emergence of multiple peaks in the output power curve and has a huge impact on the efficiency of most of the conventional Maximum Power Point Tracking (MPPT) methods [,,,,,,]. Hence, a comprehensive study on the modeling and simulation of the photovoltaic systems is a necessary effort, so that the designs of possible MPPT schemes and the proper configurations for PV arrays may be simplified.
Regarding the import of photovoltaic technology, there has been expansive research on the modeling and simulation of PV systems exposed to a multitude of temperatures and irradiance intensity levels [,,,,,]. Villalva and Gazoli [] presented the basic behavior of photovoltaic devices under different irradiance levels and also introduced a simple method to model and simulate the practical PV array. However, their work is very limited to PV arrays’ behaviors under uniform irradiance levels. While some researchers in [,] pursued their investigations to encompass partial shading, their research was, again, restricted to the photovoltaic modules and basic configuration of the PV arrays. Yuncong [] and Kajihara [] recommend some useful methods to model and simulate the PV modules under partial shading, but larger size and industrial PV systems have not been discussed in their studies.
Besides the size of the PV system and qualification of partial shading conditions, the connection and configuration of the PV systems significantly affect the functionality of the whole system under partial shading conditions. In this regard, Petrone and Ramos [] conducted a precise and comprehensive research, in which a modeling method based on an optimized algorithm for fast computation of PV plant behavior is presented. However, their approach is suited for the long term evaluation and data collection of the energetic performances of a PV field under mismatching conditions.
The multidimensional (modular) configuration of PV arrays is one of the cost effective forms of PV systems which significantly reduces the hardware cost in the photovoltaic power plant. This configuration is preferred when applying the evolutionary algorithms such as Particle Swarm Optimization (PSO) and Differential Evolutionary (DE) as the main concept of tracking the Maximum Power Point (MPP) []. Some researchers have used the multidimensional configuration to prove the effectiveness of their proposed MPPT methods. For example, Keyrouz and Georges [] used a multidimensional configuration to evaluate the combination of Bayesian Fusion and PSO to track the Maximum Power Point. However, the behavior of the PV system under partial shading was not discussed in their works.
In accordance with the above paragraphs, it might be inferred that, besides the importance of understanding the effects of partial shading on the output of photovoltaic systems, an accurate and user friendly method for modeling and simulation of PV systems is highly required []. Such a method which comprehensively covers different scales and configurations of PV systems serves the following statements:
- Being a basic tool for researchers to predict the output characteristics of the photovoltaic systems in both normal and partial shading conditions.
- Having a reliable and robust model is the first requirement for designers who want to analyze the performance and efficiency of different configurations of PV systems before installation.
- It is the first step to study and define the effectiveness of Maximum Power point tracking methods applied in different configuration of a PV system under variable environmental conditions.
- It is an aid for users who want to build actual PV systems without going into the intricate details such as semiconductor physics.
In this paper, the authors pursue the mathematical analysis of the responses of a single module under uniform irradiance levels. Afterwards, in a more practical scheme, by analyzing the effects of the partial shading phenomenon on the output of PV systems, the study is followed up by the modeling of the module and array under partial shading conditions. Finally, the simulation of the outputs for the proposed multidimensional PV arrays configuration correlating to different degrees of partial shading is presented. The considerable advantage of modeling and simulation method in this research is to cover different scales of a PV system under both normal and partial shading conditions, without analyzing the in-depth semiconductor physics definitions.
2. Modeling of Photovoltaic System Parameters
2.1. PV Cell Model
The single-diode circuitry for a photovoltaic cell is represented in Figure 1. Normally, the output of photovoltaic systems corresponds directly to solar irradiance and temperature, so obtaining the maximum power point should involve the most recent values of these factors.
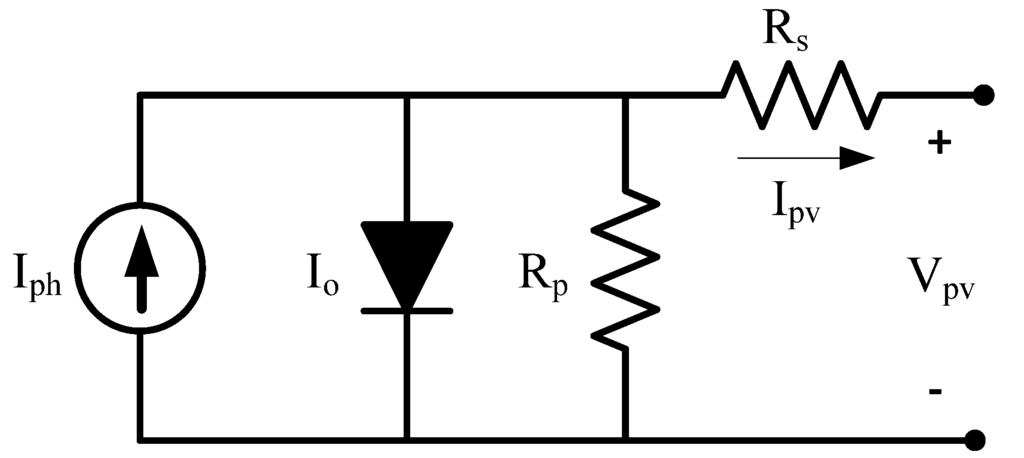
Figure 1.
Equivalent circuit of a photovoltaic array.
The mathematical model of PV also varies with the short circuit current (Isc) and the open circuit voltage (Voc), which are gleaned from the cell manufacturer’s data sheet. Using the General model, while applying Kirchhoff’s law on the common node of the current source, diode and resistances, the PV current can be derived by:
In which IPV is the output current to be fed through the load or network grid and Io represents the diode current which will be discussed later. Iph refers to the solar-generated current; which, as mentioned beforehand, is affected by solar irradiance and temperature, and so can be calculated this way [,]:
where Ki is the temperature coefficient, Tdif is the deviation of the operating temperature from the reference temperature (Tdif = Tk − Tr), and G and Gr are the operating and reference irradiances, respectively. Aside from obtaining the open circuit voltage from the PV cell data sheet, one may also procure it by measuring the output voltage when the output current value is assumed zero. Meanwhile, the reverse saturation current (Irs) at a certain reference temperature can be calculated as follows [,]:
wherein A is the diode ideality factor, q is the constant known as the electron charge (q = 1.602 × 10⁻¹⁹ C); Kb is the Boltzmann constant. As stated earlier Io is the diode current that will be calculated by the Shockley Equation []:
In the meantime, the diode saturation current (Io1) fluctuates in accordance with particular environmental changes, and so can be determined by the following mathematical statement [,]:
In the above equation, the parameter Ego refers to the band gap energy for the silicon semiconductor, which should be between 1.1 and 1.2 eV. Finally, by substituting Equation (5) into Equation (1) and considering the slight current through the parallel resistance, we have the following formula for the PV cell’s output current []:
where the term Rp is the parallel resistance which normally has a high resistance and sometimes assumed infinity in the applicable PV module, due to its slight impression. On the other hand the value and variation of series resistance (RS) cannot be ignored according to its impacts on output power. It should be noted that the output current of the PV cell (Ipv) exists on both sides of the equation; meaning Ipv cannot be expressed as a separate function from Vpv. Thus, the output characteristic of the PV cell can be deduced by solving the following implicit form:
2.2. PV Module Model
From a practical standpoint, the output power of a single solar cell is insufficient for any useful application in this context, so the overall capability of the PV system should be enhanced by connecting the cells either in series or in parallel, in which case, all the cells in the PV module, Ns being their given number, would contribute to the output power. Subsequently, we may calculate the output of the module using this equation:
Figure 2 shows the output of the BP SX PV module considered in this paper, which employs 72 cells connected to provide a power (P) of 150 W at a terminal voltage (Vpvm) of 21.3 V. The detailed information about the electrical parameters is given in Table 1.

Table 1.
PV module specifications.
| Electrical Characteristic | BP SX 150s |
|---|---|
| Open circuit voltage | 43.5 V |
| Short circuit current | 4.75 A |
| Maximum power voltage | 34.5 V |
| Maximum power current | 4.35 A |
| Maximum power | 150 W |
| Temperature coefficient of ISC | (0.065 ± 0.015)%/°C |
| Temperature coefficient of VOC | −(160 ± 20) mV/°C |
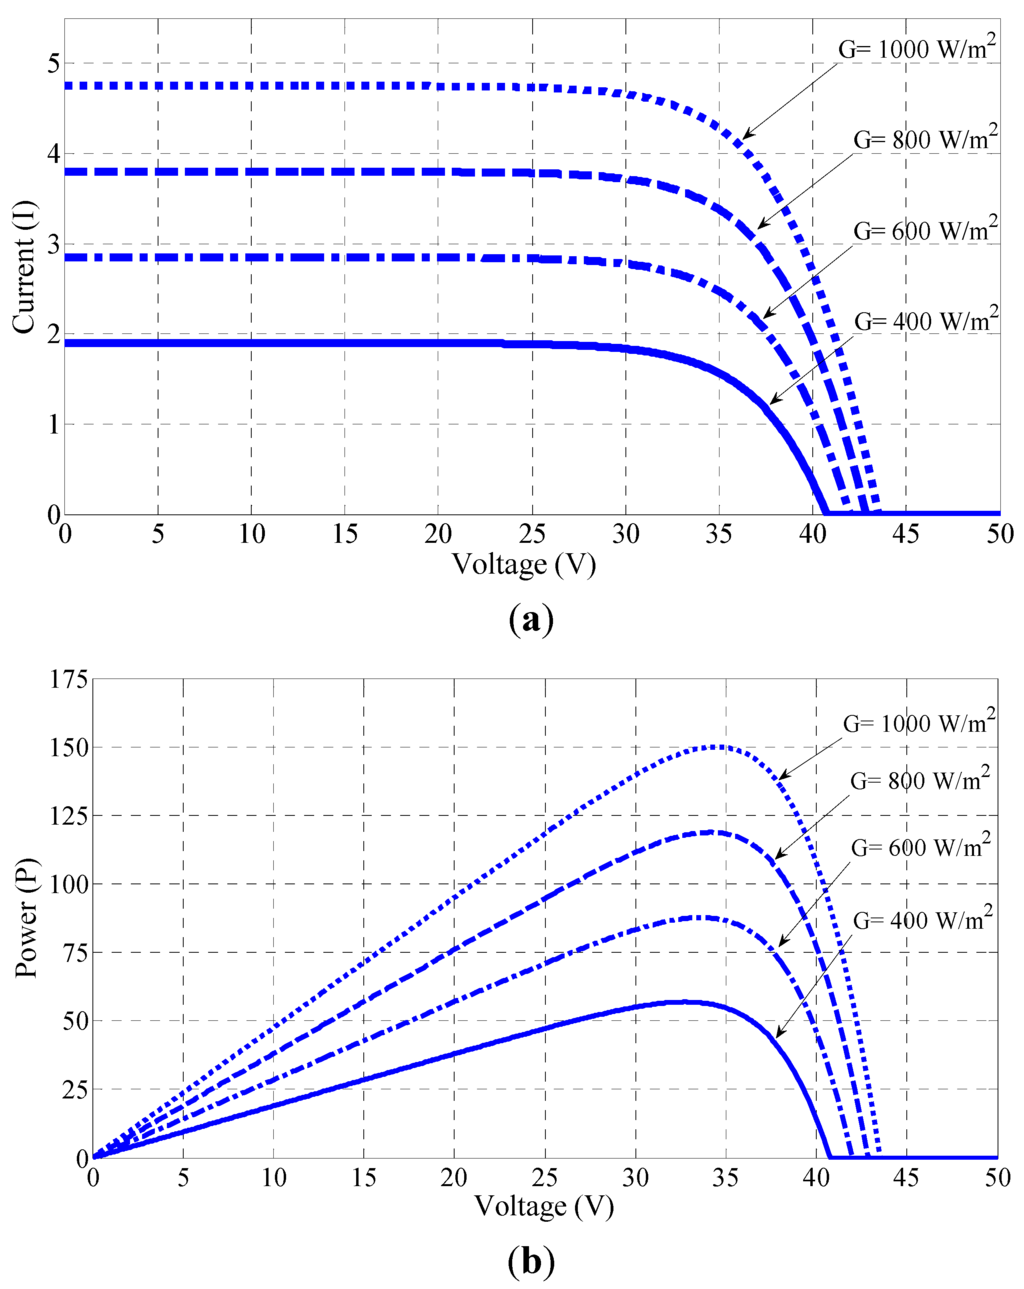
Figure 2.
Output characteristics of PV module at normal condition (a) I-V characteristic; (b) P-V characteristic.
3. Characteristics of the PV System under Partial Shading
In any outdoor environment, the whole or some parts of the PV system might be shaded by trees, passing clouds, high building, etc., which result in non-uniform insolation conditions as in Figure 3. During partial shading, a fraction of the PV cells which receive uniform irradiance still operate at the optimum efficiency. Since current flow through every cell in a series configuration is naturally constant, the shaded cells need to operate with a reverse bias voltage to provide the same current as the illumined cells [,,,]. However; the resulting reverse power polarity leads to power consumption and a reduction in the maximum output power of the partially-shaded PV module. Exposing the shaded cells to an excessive reverse bias voltage could also cause “hotspots” to appear in them, and creating an open circuit in the entire PV module. This is often resolved with the inclusion of a bypass diode to a specific number of cells in the series circuit [].
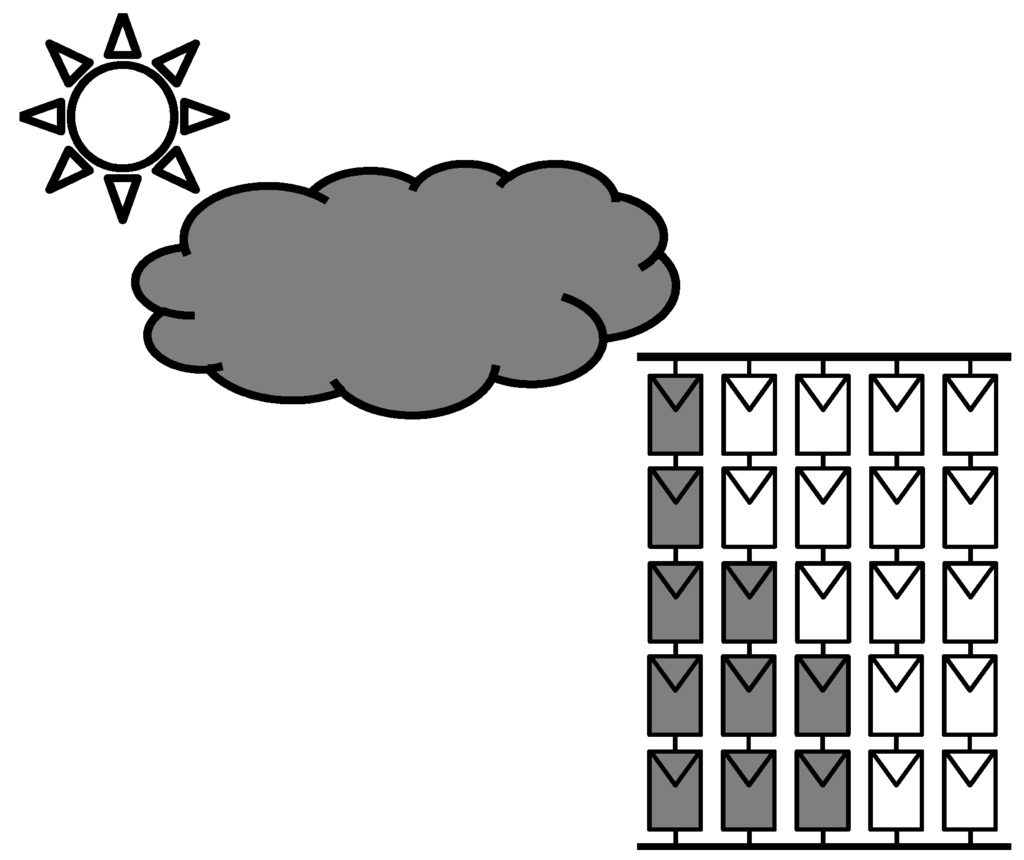
Figure 3.
PV system under partially shaded conditions caused by passing cloud.
3.1. Effect of Bypass and Blocking Diodes on PV Characteristics
Figure 4 depicts n PV modules with their bypass diodes connected in series inside an array. It is important to note that the characteristics of an array with bypass diodes differ from the one without these diodes. Since the bypass diodes provide an alternate current path, cells of a module no longer carry the same current when they are partially shaded. Therefore, the power-voltage curve develops multiple maxima, shown in Figure 5. This figure shows how the extractable maximum power point differs in PV array with and without bypass diodes. However, presenting multiple maxima in the P-V characteristic is a crucial issue and most of the conventional MPPT algorithms may not distinguish between the local and global maxima.
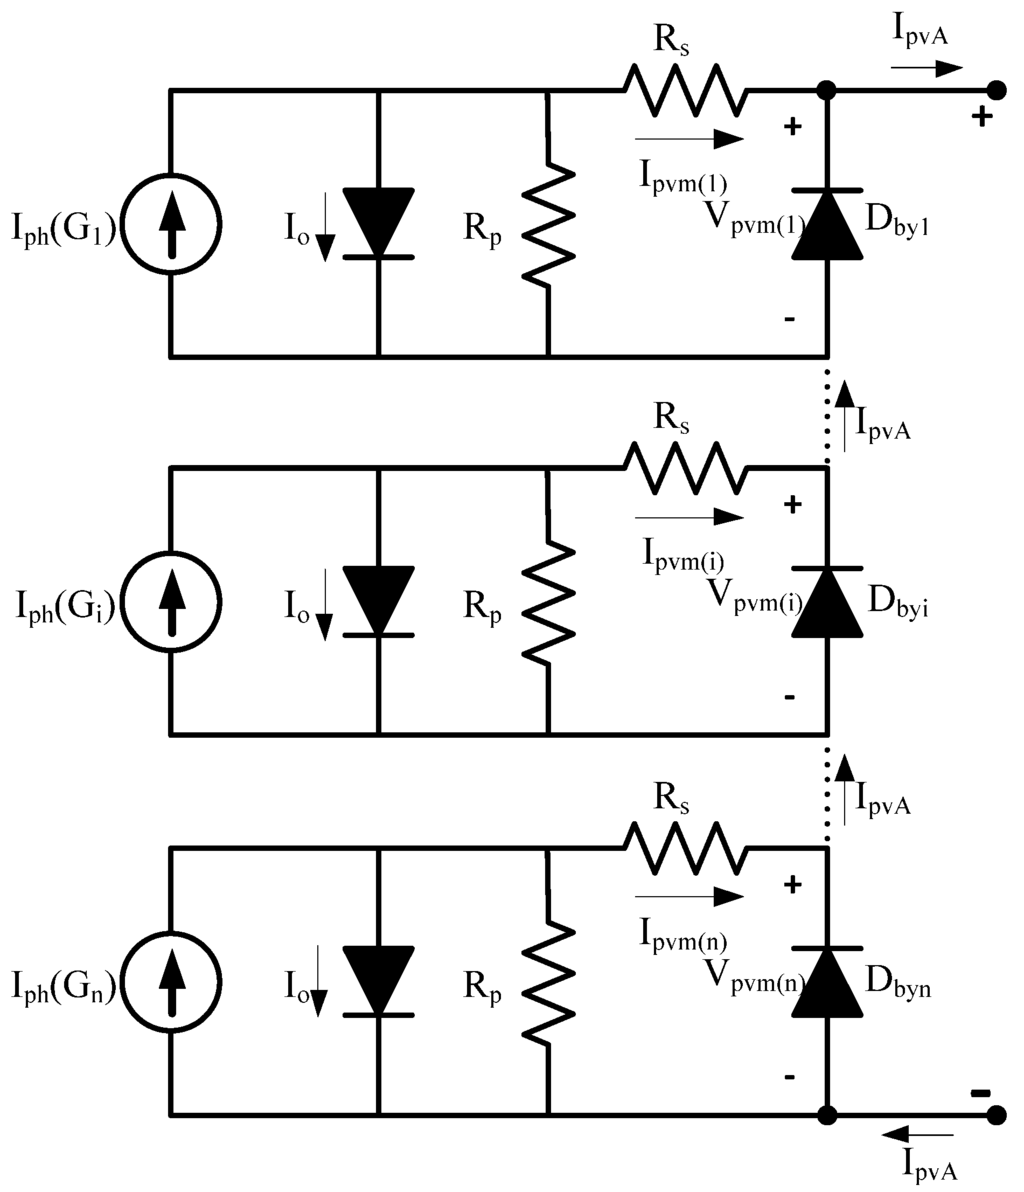
Figure 4.
Circuit model of array consist of n series connected array.
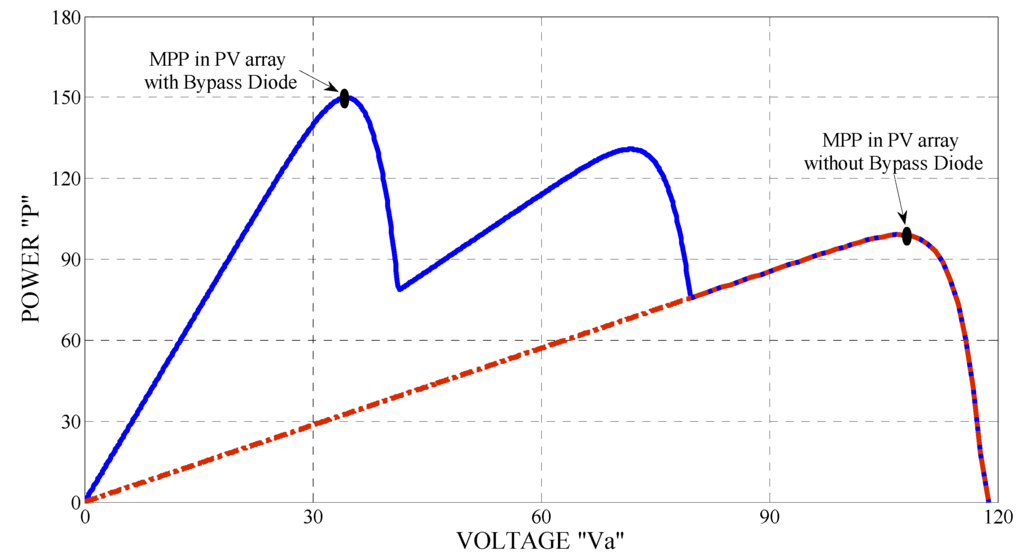
Figure 5.
Power-voltage curve of a PV array under partial shading condition.
If the generated current (Iph) of ith module decreases to less than the current generated by the whole array, the bypass diode restricts the reverse voltage to be less than the breakdown voltage of the PV cells. In other words, the ith bypass diode shown in Figure 4 begins to conduct when Equation (9) is satisfied:
These diodes can be mathematically modeled as one resistance with regards to measured solar generated current of the PV module. As shown in Equation (9), a bypass diode is represented as a high resistance (1010 Ω) when it is reverse biased and low resistance (10−2 Ω) while it is forward biased:
3.2. Partially Shaded Module
A partially shaded module can be modeled by two groups of PV cells connected in series inside a module. Each group receives different level of irradiance. Let’s assume no bypass diode for the cells inside a module, so Figure 6 shows the circuit model for a partially shaded module. The module is composed of r series connected cells in which s shaded cells receive irradiance G1 and (r − s) shaded cells receiving irradiance G2. The PV parameters can be represented as:
where, the subscripts 1 and 2 refer to the cells receiving irradiance of G1 and G2, respectively.
In accordance to the presence of single bypass diode for whole PV module, the output current and voltage of PV array are equal to following mathematical statements:
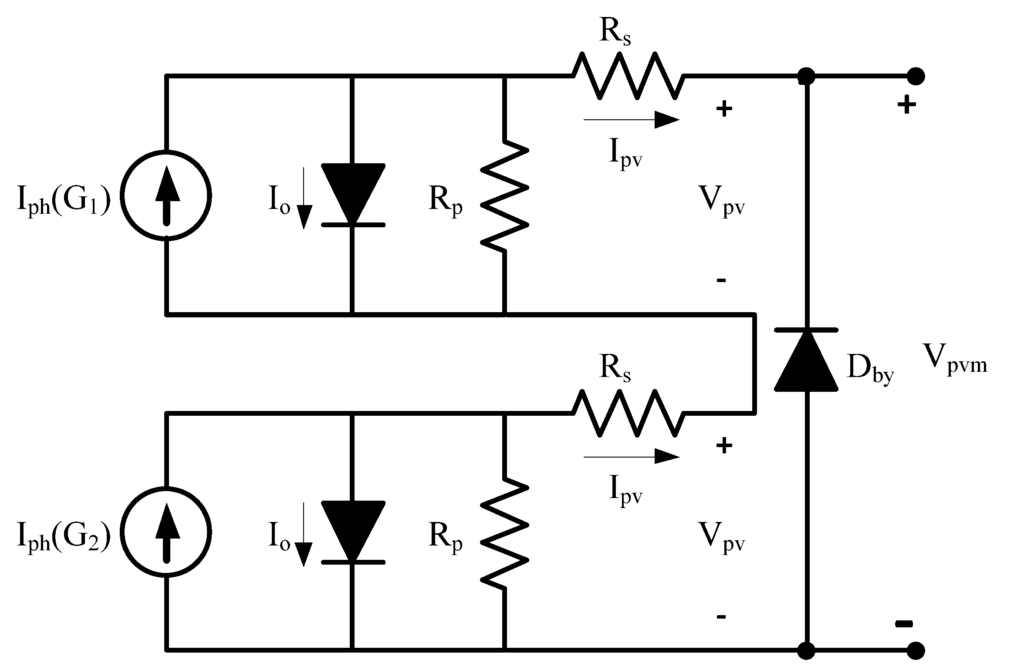
Figure 6.
Circuit diagram of partial shaded module.
3.3. Partially Shaded Array
In experiments, the solar arrays inclusive of several PV modules are used to generate a higher level of electrical output power. The output power of the array may lead to a complex form when facing partial shading conditions. The mathematical analysis on the output characteristics of the PV array consisting of several modules in an array is presented in this section. Figure 7 shows K series connected modules in an array. If single bypass diode is assumed for each PV module the following steps should be considered to find the output characteristics of the array:
- Calculate the solar irradiance received by each individual PV module and determine the irradiance matrix. This point must be mentioned that in accordance with assuming a single bypass diode for each PV module, if the partial shading occurs in the PV module, the lowest irradiance level will be considered.
- Compute the Iph and Ns of each module using Equation (11) and define the Iph, Ns matrix respective to their solar irradiances.
- Rearrange Iph matrix from the highest toward the lowest value.
- Calculate the output current of array (Ipva) using Equation (13) in which the Ipvm(i) is the output current of ith module.
- Calculate the output PV voltage (Vpva) using Equation (13) in which the Vpvm(i) is the output voltage of ith module:
The flowchart shown in Figure 8 can be used for coding purposes.
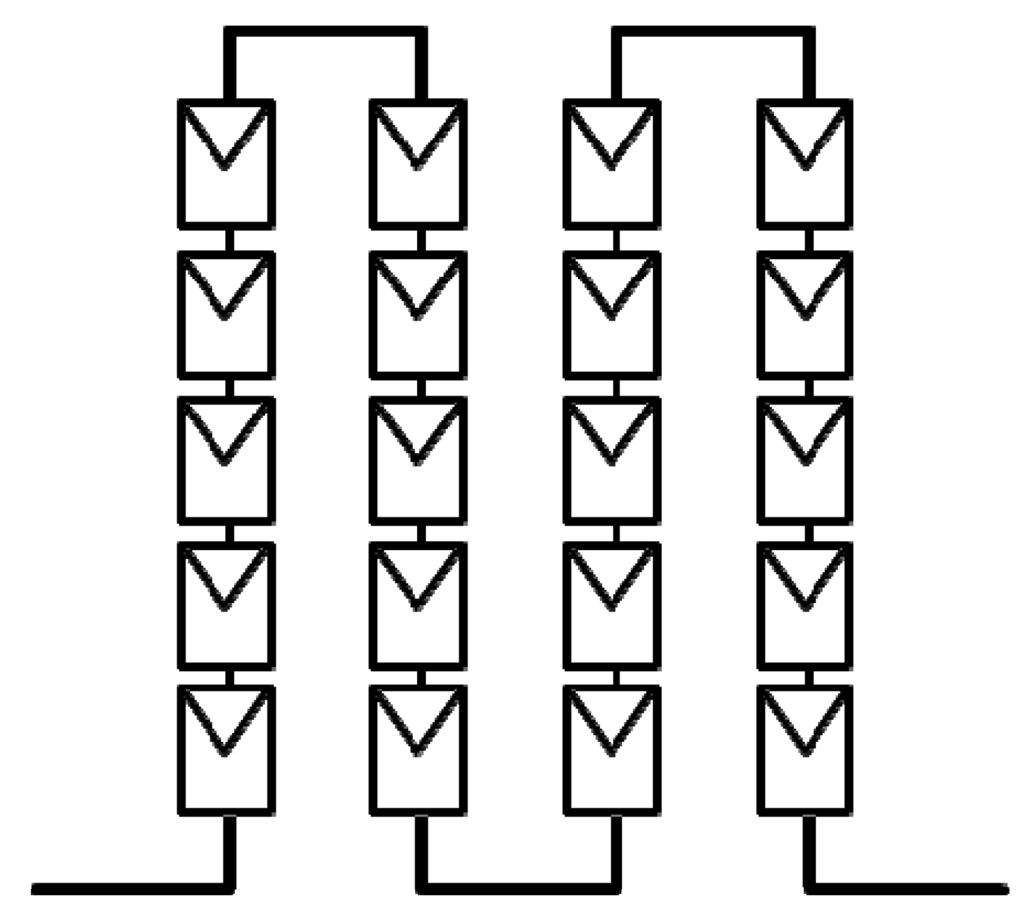
Figure 7.
Series connected configuration of modules in an array.
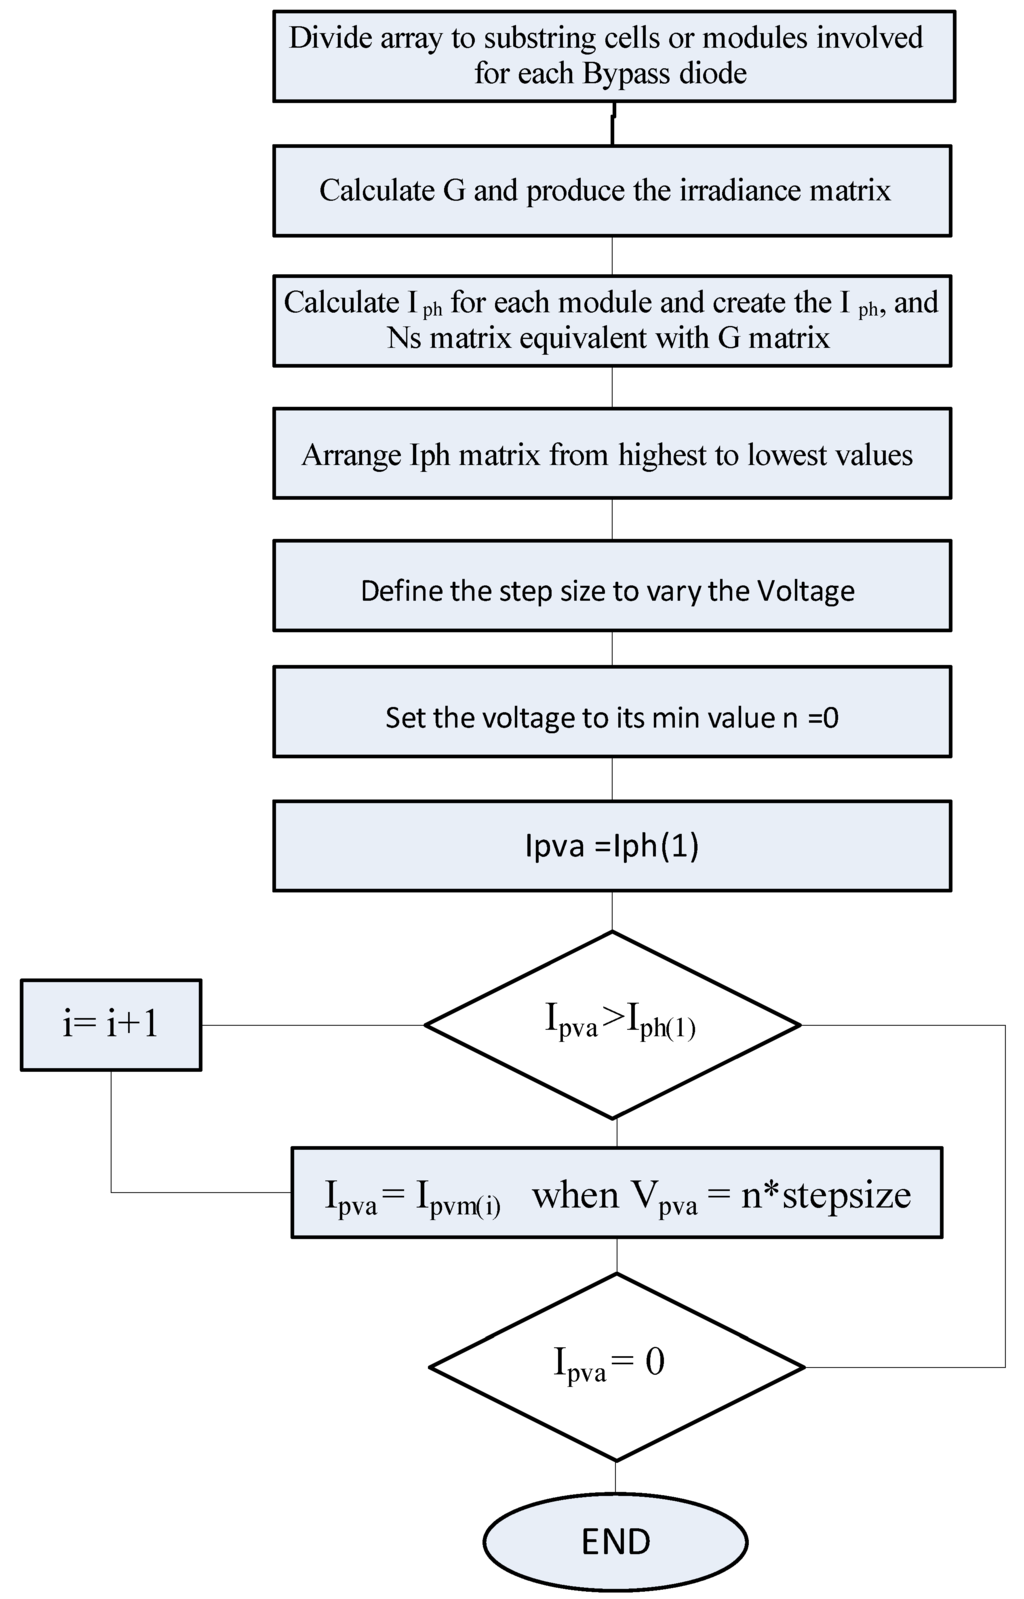
Figure 8.
Flowchart diagram for modeling the output characteristic of an array.
4. Numerical Examples
4.1. Partially Shaded Module Series with Fully Illuminated Module
Figure 9 shows the series configuration of two PV modules in an array receiving irradiance levels of G1 and G2 respectively. Under the uneven insolation, G1 is given as 1000 W/m2 and G2 is assumed to be 500 W/m2. Taking the presence of a single bypass diode for each PV module into consideration, the output current and voltage at the array terminal can be obtained by solving the following formulae:
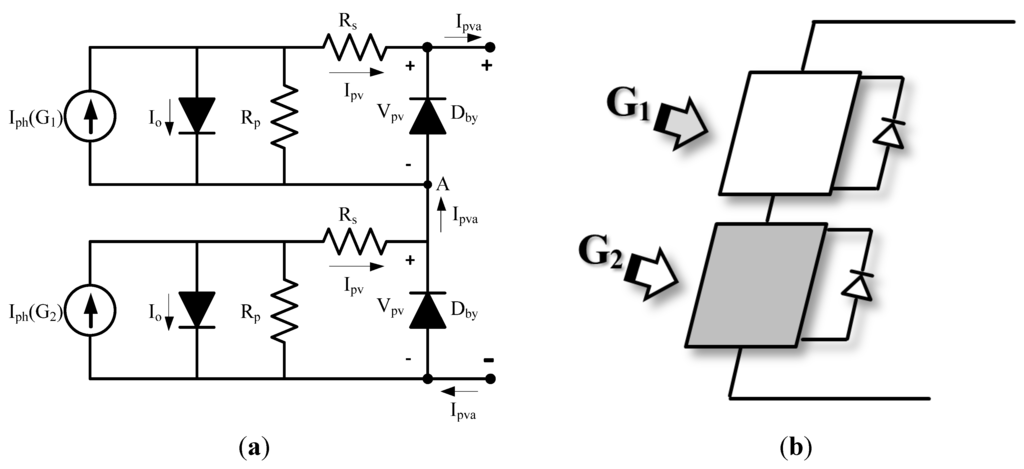
Figure 9.
PV array consisting two series connected modules (a) Circuitry diagram; (b) Block diagram.
In this case, the modeling of the PV array is divided into two zones defined with respect to the photonic generated current of the shadowed module as compared to the output current of the illuminated module. Within the first zone, the output current of the entire PV array is identical to the current generated by the well-lit module. In this zone, the generated current of the second PV module is less than total array output current; therefore, by assuming node A as common point between two modules, Equation (9) will be satisfied for the second module and bypass diode 1 will become ON. The array current will be equivalent to the current generated by the un-shaded module until its value reaches the same value as the generated current of the shaded module and enters the second zone. In the second zone, PV module 2 starts to generate the power.
Applying Equations (8) and (12) for the output of unshaded and shaded modules, and Equations (14) and (15) for the current and voltage of the entire PV array, the results represented in Figure 10 are obtained. As observed, there are multiple peaks in the output Power-Voltage characteristics as a result of the different irradiance levels and presence of bypass diodes.
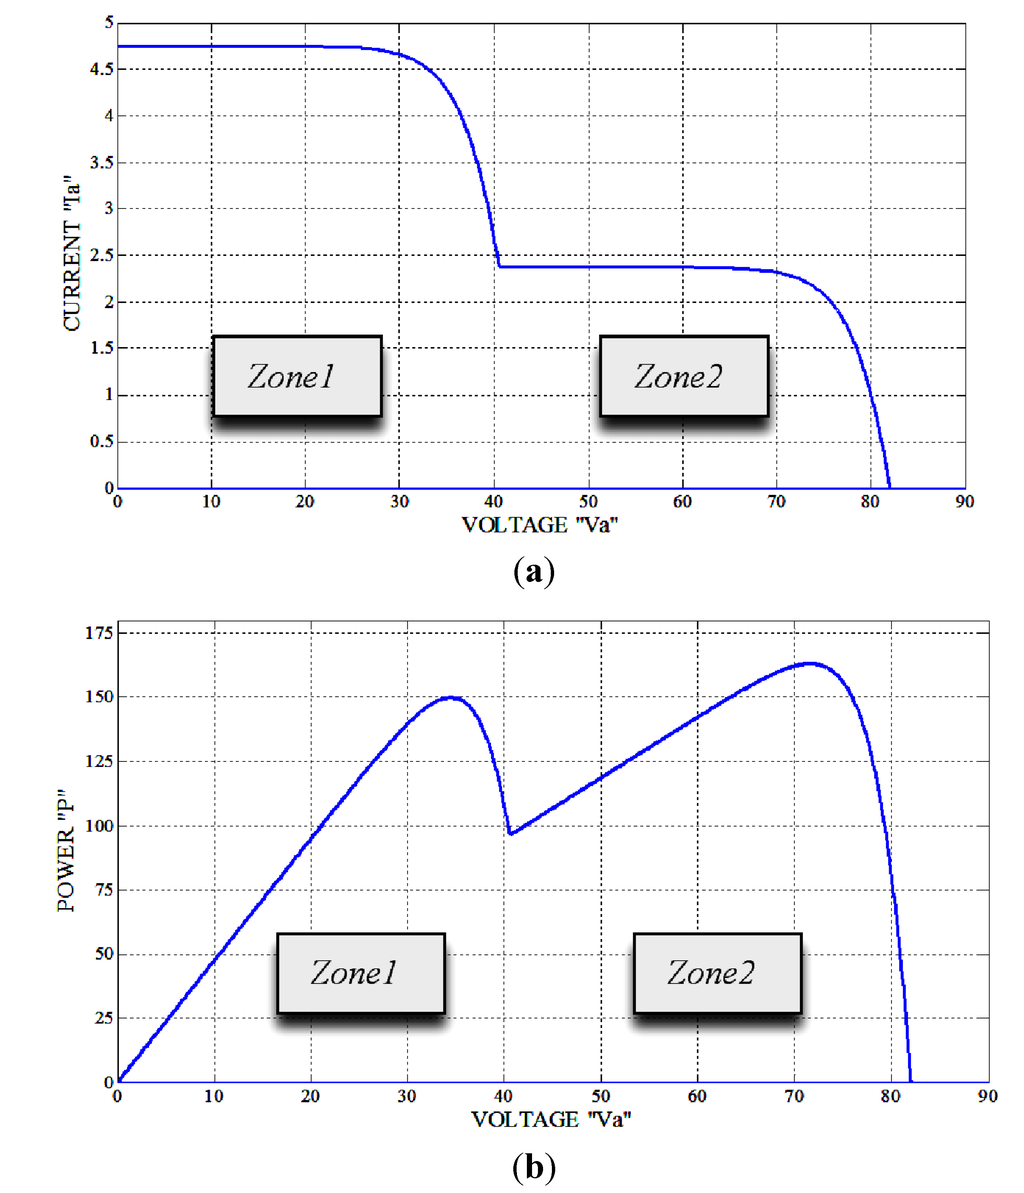
Figure 10.
Output characteristics of partially shaded PV array (a) I-V characteristic; (b) P-V characteristic.
4.2. Multidimensional PV System
Figure 11a shows a multidimensional PV system in which each PV array is controlled by its individual DC/DC converter. Despite the disadvantageous need for numerous sensors and transducers, this system can minimize the effects of partial shading while meeting the load demand. One solution is considering a centralized controller which would supply the required alternating patterns of each converter just as well. Therefore, the configuration shown in Figure 11b is proposed as a compromise, to increase the output power of the PV system and reduce the number of sensors needed at the same time. The general advantages of the multidimensional PV systems can be briefly stated as below:
- The lower number of sensors and transducers which significantly reduces the overall system cost.
- The lower space required for the control unit, even in a large scale PV system.
- High flexibility of this configuration helps the designers to develop the system without increasing the control units. Only some amendments in programming are required.
In this structure, each PV array consists of two PV modules, which are connected in series and controlled by both DC/DC converters and a centralized controller.
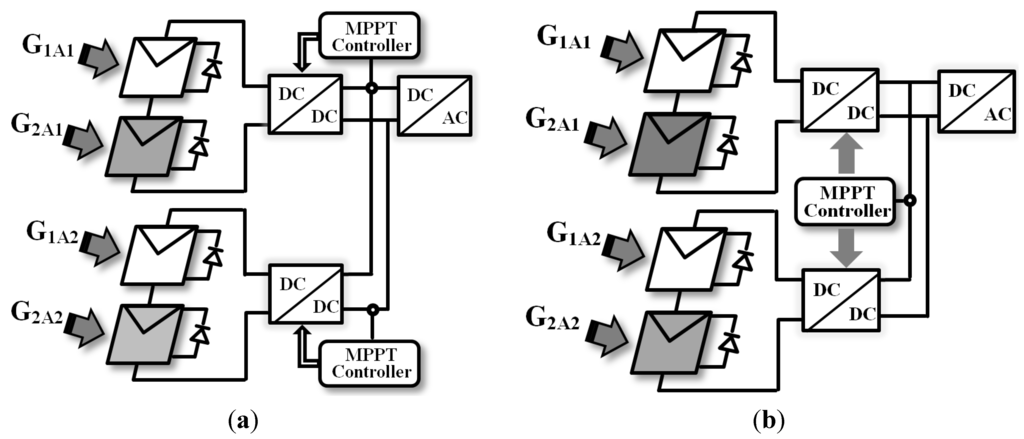
Figure 11.
Multidimensional PV system (a) Controlled by multiple controllers; (b) Controlled by centralized controllers.
To analyze the influence of partial shading on the output of the proposed configuration, a numerical case study is considered. In the conventional scheme, the controllers generate single switching patterns for the individual converters while in the cost-effective multidimensional scheme, the centralized controller is required to provide two appropriate duty cycles for the two individual converters. Finding an accurate output characteristic of PV system with this configuration, in a simple procedure, is very important with which the functionality of the MPPT method can be evaluated. At first, the system is divided into the separate PV arrays connected to separate DC/DC converters. Afterwards, the effects of partial shading must be analyzed through Equations (9) till (12) for each of these separate PV arrays. Finally the output results of all PV arrays will be considered to define the output result of the whole PV system.
For example, for defining the output characteristics of the PV system shown in Figure 11(b), the system must be divided into two separate PV arrays inclusive of two series connected PV modules. The mathematical model of each PV array has been discussed in Section 3.2–Section 4.1. It is assumed that the modules inside the both PV array receive irradiance levels of G1A1 = 1,000 W/m2, and G2A1 = 500 W/m2. While inside the second PV array receive G1A2 = 1,000 W/m2, and G2A2 = 700 W/m2. The output current of each PV array would be computed using Equation (13). Consequently the output characteristic of each PV array results to the similar characteristic shown in Figure 10. As mentioned earlier in the Cost-effective configuration, the central controller is tracking the MPP for both PV arrays. So the output characteristic will result in three dimensional characteristic shown in Figure 12. In this figure, the X axis shows the output voltage of the first array, the Y axis shows the output voltage of the second array and the Z axis represents the output current [in Figure 12(a)] and power [in Figure 12(b)] of the whole PV system.
Figure 12 also shows how the output curves of two PV arrays are seen in the output characteristic of the whole PV system. The zones indicated in this figure are exactly the ones described in Figure 10 for each PV array. The combination of these zones will result into four regions in output characteristics of PV system shown in Figure 7, in which the regions are defined by:
- Region 1 = Contribution of PV arrays in Zone2A2 + Zone1A1
- Region 2 = Contribution of PV arrays in Zone2A2 + Zone2A1
- Region 3 = Contribution of PV arrays in Zone1A2 + Zone1A1
- Region 4 = Contribution of PV arrays in Zone2A2 + Zone2A1
The graph presented in Figure 13 shows four distinct regions marked by differences in the output’s characteristics created by each individual array. It also proves that MPP occurs inside the region in which the contribution of individual array to generate the power is maximized.
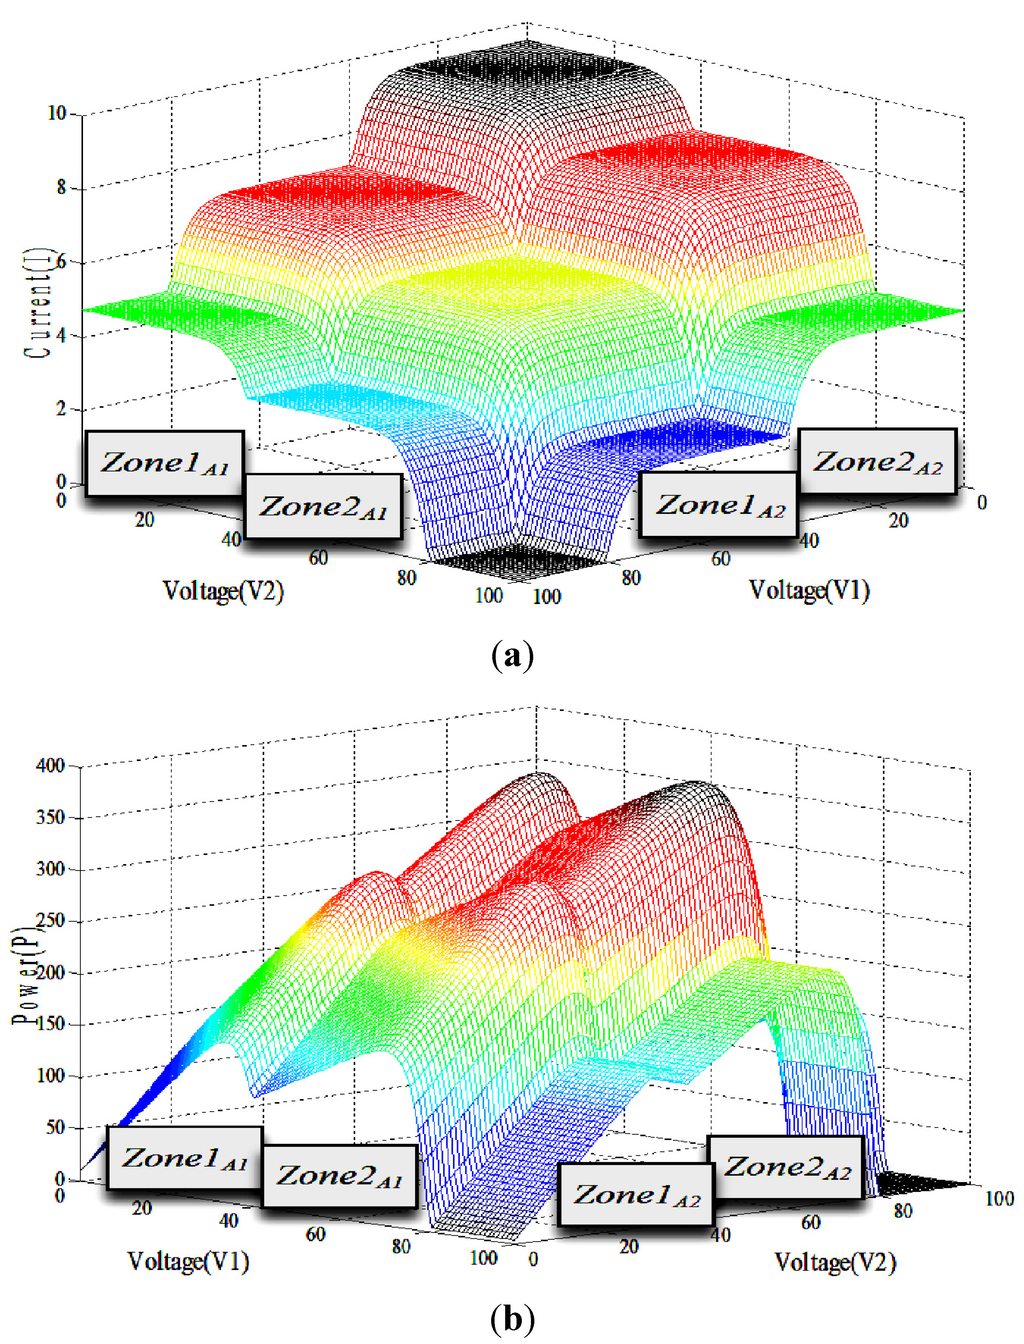
Figure 12.
Output characteristics of partially shaded multidimensional PV system with centralized controller (a) I-V characteristic (b) P-V characteristic.
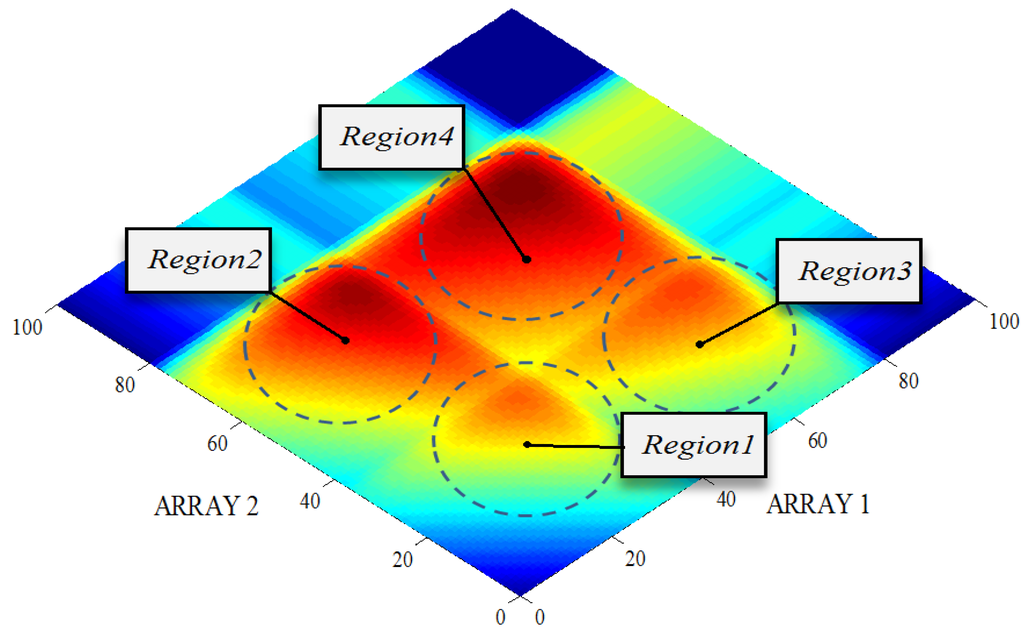
Figure 13.
Appeared regions at output of partial shaded multidimensional PV system.
5. Conclusions
As discussed in the analytical modeling of photovoltaic systems, the model should consider all the parameters of the photovoltaic system under normal conditions and also partial shading. The latter condition was simulated in a step by step analysis, using a range of irradiance levels for G1 and G2, and a model encompassing PV modules connected in series with individual bypass diodes. The study then proceeded by modeling the multidimensional structure of PV systems which is known as a cost-effective configuration for PV arrays. This system significantly reduces the number of sensors and transducers utilized in control system. The cost effective aspect of this configuration can be even more apparent when the large scale PV farm is the case. The final results show how the output characteristics of PV system are the combination of output behavior of each PV array involved in the whole system. The study shows even the mathematical modeling of large n-dimensional PV system in which the central controller tracks the MPP for all the PV arrays, can be achieved by only analyzing the characteristic of the PV arrays inside the system.
Nomenclature:
| Iph | Solar-Generated current |
| A | Diode ideality factor |
| Ki | Short-circuit temperature/current coefficient |
| Q | Electron charge constant |
| G | Operating irradiance level (W/m2) |
| K | Boltzmann constant |
| Gr | Nominal irradiance level (W/m2) |
| Ns | Number of series connected cells |
| Tk | Operating temperature (K) |
| Irs | Solar generated current |
| Tr | Reference cell temperature(K) |
| Isc | Short circuit current |
| Vpv | PV output voltage |
| Io1 | Diode saturation current |
| Vpvm | PV module output voltage |
| Ipv | PV output current |
| Vpva | PV array output voltage |
| Ipvm | PV module output current |
| Rs | Series connected resistance |
| Ipva | PV array output current |
| Io | Diode current |
| Rp | Parallel connected resistance |
Acknowledgments
The authors would like to thank Ministry of Higher Education of Malaysia and University of Malaya for providing financial support under the research grant No. UM.C/HIR/MOHE/ENG/16001-00-D000024.
References
- Bastidas, J.D.; Ramos-Paja, C.A.; Franco, E.; Spagnuolo, G.; Petrone, G. Modeling of photovoltaic fields in mismatching conditions by means of inflection voltages. In Proceedings of Engineering Applications (WEA) 2012 Workshop, Bogota, Colombia, 2–4 May 2012; pp. 1–6.
- Mekhilef, S.; Saidur, R.; Safari, A. A review on solar energy use in industries. Renew. Sustain. Energy Rev. 2011, 15, 1777–1790. [Google Scholar] [CrossRef]
- Elhassan, Z.A.M.; Zain, M.F.M.; Sopian, K.; Abass, A. Building integrated photovoltaics (BIPV) module in urban housing in Khartoum: Concept and design. Int. J. Phys. Sci. 2012, 7, 487–494. [Google Scholar]
- Esram, T.; Chapman, P.L. Comparison of photovoltaic array maximum power point tracking techniques. IEEE Trans. Energy Convers. 2007, 22, 439–449. [Google Scholar] [CrossRef]
- Hohm, D.; Ropp, M. Comparative study of maximum power point tracking algorithms. Prog. Photovolt. Res. Appl. 2003, 11, 47–62. [Google Scholar] [CrossRef]
- Jewell, W.T.; Unruh, T.D. Limits on cloud-induced fluctuation in photovoltaic generation. IEEE Trans. Energy Convers. 1990, 5, 8–14. [Google Scholar] [CrossRef]
- El Ouariachi, M.; Mrabti, T.; Tidhaf, B.; Kassmi, Ka.; Kassmi, K. Regulation of the electric power provided by the panels of the photovoltaic systems. Int. J. Phys. Sci. 2009, 4, 294–309. [Google Scholar]
- Safari, A.; Mekhilef, S. Simulation and hardware implementation of incremental conductance MPPT With direct control method using Cuk Converter. IEEE Trans. Ind. Electron. 2011, 58, 1154–1161. [Google Scholar] [CrossRef]
- Salas, V.; Olias, E.; Barrado, A.; Lazaro, A. Review of the maximum power point tracking algorithms for stand-alone photovoltaic systems. Sol. Energy Mater. Sol. Cells 2006, 90, 1555–1578. [Google Scholar] [CrossRef]
- Petrone, G.; Ramos-Paja, C.A.; Spagnuolo, G.; Vitelli, M. Granular control of photovoltaic arrays by means of a multi-output Maximum Power Point Tracking algorithm. Prog. Photovolt. Res. Appl. 2012. [Google Scholar] [CrossRef]
- Ahmed, M.; Yahya, I.Y.; Kader, A. Behavior and performance of a photovoltaic generator in real time. Int. J. Phys. Sci. 2011, 6, 4361–4367. [Google Scholar]
- Durgadevi, A.; Arulselvi, S.; Natarajan, S.P. Photovoltaic modeling and its characteristics. In Proceedings of International Conference on Emerging Trends in Electrical and Computer Technology (ICETECT), 23–24 March 2011; pp. 469–475.
- Nordin, A.H.M.; Omar, A.M. Modeling and simulation of Photovoltaic (PV) array and maximum power point tracker (MPPT) for grid-connected PV system. In Proceedings of the 3rd International Symposium & Exhibition in Sustainable Energy & Environment (ISESEE), Shah Alam, Malaysia, 1–3 June 2011; pp. 114–119.
- Wasynczuk, O. Modeling and dynamic performance of a line-commutated photovoltaic inverter system. IEEE Trans. Energy Convers. 1989, 4, 337–343. [Google Scholar] [CrossRef]
- Yusof, Y.; Sayuti, S.H.; Abdul Latif, M.; Wanik, M.Z.C. Modeling and simulation of maximum power point tracker for photovoltaic system. In Proceedings of Power and Energy Conference, Kuala Lumpur, Malaysia, 29–30 November 2004; pp. 88–93.
- Mahmodian, M.S.; Rahmani, R.; Taslimi, E.; Mekhilef, S. Step by step analyzing, modeling and simulation of single and double array PV system in different environmental variability. In Proceedings of International Conference on Future Environment and Energy, Singapore, 26–28 February 2012; pp. 37–42.
- Villalva, M.G.; Gazoli, J.R. Comprehensive approach to modeling and simulation of photovoltaic arrays. IEEE Trans. Power Electron. 2009, 24, 1198–1208. [Google Scholar] [CrossRef]
- Guangyu, L.; Sing Kiong, N. A general modeling method that simulates photovoltaic arrays for environmental and electrical variability. In Proceedings of IEEE International Conference on Information and Automation (ICIA), Harbin, China, 20–23 June 2010; pp. 195–200.
- Yuncong, J.; Qahouq, J.A.A.; Orabi, M. Matlab/Pspice hybrid simulation modeling of solar PV cell/module. In Proceedings of the Twenty-Sixth Annual IEEE on Applied Power Electronics Conference and Exposition (APEC), 6–11 March 2011; pp. 1244–1250.
- Kajihara, A.; Harakawa, A.T. Model of photovoltaic cell circuits under partial shading. In Proceedings of IEEE International Conference on Industrial Technology (ICIT), Hong Kong, China, 14–17 December 2005; pp. 866–870.
- Petrone, G.; Ramos-Paja, C.A. Modeling of photovoltaic fields in mismatched conditions for energy yield evaluations. Electr. Power Syst. Res. 2011, 1, 1003–1013. [Google Scholar] [CrossRef]
- Ishaque, K.; Salam, Z.; Amjad, M.; Mekhilef, S. An improved particle swarm optimization (PSO)-based MPPT for PV with reduced steady-state oscillation. IEEE Trans. Power Electron. 2012, 27, 3627–3638. [Google Scholar] [CrossRef]
- Keyrouz, F.; Georges, S. Efficient multidimensional maximum power point tracking using bayesian fusion. In Proceedings of the 2nd International Conference on Electric Power and Energy Conversion Systems (EPECS), Sharjah, United Arab Emirates, 15–17 November 2011; pp. 1–5.
- Patel, H.; Agarwal, V. Maximum power point tracking scheme for PV systems operating under partially shaded conditions. IEEE Trans. Ind. Electron. 2008, 55, 1689–1698. [Google Scholar] [CrossRef]
- Wang, Y.J.; Hsu, P.C. Analytical modelling of partial shading and different orientation of photovoltaic modules. Renew. Power Gener. IET 2010, 4, 272–282. [Google Scholar] [CrossRef]
- Pandiarajan, N.; Muthu, R. Mathematical modeling of photovoltaic module with simulink. In Proceedings of the 1st International Conference on Electrical Energy Systems (ICEES), Newport Beach, CA, USA, 3–5 January 2011; pp. 258–263.
- Maki, A.; Valkealahti, S. Power losses in long string and parallel-connected short strings of series-connected silicon-based photovoltaic modules due to partial shading conditions. IEEE Trans. Energy Convers. 2012, 27, 173–183. [Google Scholar] [CrossRef]
- Paraskevadaki, E.V.; Papathanassiou, S.A. Evaluation of MPP voltage and power of mc-Si PV modules in partial shading conditions. IEEE Trans. Energy Convers. 2011, 26, 923–932. [Google Scholar] [CrossRef]
- Silvestre, S.; Boronat, A.; Chouder, A. Study of bypass diodes configuration on PV modules. Appl. Energy 2009, 86, 1632–1640. [Google Scholar] [CrossRef]
© 2013 by the authors; licensee MDPI, Basel, Switzerland. This article is an open access article distributed under the terms and conditions of the Creative Commons Attribution license (http://creativecommons.org/licenses/by/3.0/).