
Influence of the Preformed Coil Design on the Thermal Behavior of Electric Traction Machines


Institute of Electrical Machines (IEM), RWTH Aachen University, Schinkelstraße 4, 52062 Aachen, Germany
*
Author to whom correspondence should be addressed.
Energies 2021, 14(4), 959; https://doi.org/10.3390/en14040959
Submission received: 4 January 2021
/
Revised: 29 January 2021
/
Accepted: 31 January 2021
/
Published: 11 February 2021
(This article belongs to the Special Issue Design and Application of Electrical Machines)
Abstract
:Preformed coils are used in electrical machines to improve the copper slot fill factor. A higher utilization of the machine can be realized. The improvement is a result of both, low copper losses due to the increased slot fill factor and an improved heat transition out of the slot. In this study, the influence of these two aspects on the operational improvement of the machine is studied. Detailed simulation models allow a separation of the two effects. A preform wound winding in comparison to a round wire winding is studied. Full machine prototypes as well as motorettes of the two designs are built up. Thermal finite element models of the stator slot are developed and parameterized with the help of motorette microsections. The resulting thermal lumped parameter model is enlarged to represent the entire electric machine. Electromagnetic finite element models for loss calculation and the thermal lumped parameter models are parameterized using test bench measurements. The developed models show very good agreement in comparison to the test bench evaluation. The study indicates that both, the improvements in the heat transition path and the advantages of the reduced losses in the slot contribute to the improved operational range in dependency of the studied operational point.
1. Introduction
To further increase the thermal operational limits of high torque low speed electrical machines, high slot fill factors are required. The theoretical maximum copper fill factor using round-wire-windings without insulation is given by the value of an orthocyclic winding with 90.7%. This theoretical value is reduced by the wire insulation and a non-perfect arrangement of the conductors within the notch. Several studies focus to approach high slot fill factors with round wires. Authors in [1] use innovative needle winding and indicate realistic copper fill factors of 65% in the machine. Rectangular conductor designs are a well-known approach to increase the copper slot fill factor in comparison to a round wire design. A state-of-the-art approach is using parallel slot designs with rectangular conductors of the same size in a so called hairpin winding design [2,3,4,5,6,7]. Only few studies focus on parallel teeth such as [3] where rectangular conductors of the same size are inserted into the notch. Studies with rectangular conductors arranged in a parallel tooth design are more seldom to find [8]. A widely studied field is the loss calculation of ac-copper losses within the winding in two dimensional [5] or three dimensional [4] electromagnetic simulations. Comparison of round wire designs and rectangular wire designs can be found in [2,5]. The authors of both publications focus on the loss comparison of the two designs. Thermal aspects are not studied in detail, even if high slot fill factors cause different thermal resistances within the notch. Investigations focusing on thermal aspects of machines with rectangular wire regularly study different innovative cooling concepts. Direct cooling concepts of the conductors within the notch [7,9] or the end winding [6] can be found. In these studies, authors usually focus on the improved heat extraction of the cooling designs.
In order to avoid the disadvantage of parallel slots, semi finished coils are used in this study and compressed to fit the geometry of a parallel tooth stator slot. The production process of such coils is described in [10,11].
The semi finished coil has larger radial dimensions than the final tooth of the machine as depicted in Figure 1a. This coil is compressed in a specially designed fixture as described in [10] to match the final size of the slot as shown in Figure 1b. The coil is then impregnated. The final product before inserting into the stator tooth is shown in Figure 1c.
Within this study, two different machines are compared to each other. One machine is equipped with classical round wires, the second is equipped with the newly developed preformed coils. In order to have comparable results, the iron core and the entire machine design excluding the coil are kept identical. The machines are designed as directly driven wheel hub drives in an automotive application without using a gearbox. The design requires a relatively low maximum speed of 1200 rpm. The machines are designed with 20 pole pairs, 60 stator slots and a v-shaped permanent magnet arrangement such as depicted in Figure 2.
A single-tooth winding pattern is used to enable short end windings. The used round wire is the film grade one wire Synwire W210 from SynFlex with a outer diameter of 0.95 mm. The used rectangular wire for the preformed coil has the outer dimensions of 3.4 mm × 1.4 mm with a corner radius of 0.5 mm. The newly developed technology shows influence on three different categories:
- Insulation system,
- thermal behavior, and
- electromagnetic behavior.
A detailed study of the insulation system is given in [8]. The insulation system of the round wire winding is designed to hold a temperature of 180 °C (thermal class H) while the interturn insulation of the formed coil in its current setup can hold 120 °C (thermal class E). An insulation system for the formed coils, which meets the requirements of thermal class H, is however under development.
This study focuses on the enhancement of torque and power density of the drive by analyzing the thermal behavior. Microsections of the designs are evaluated to identify the geometrical arrangement of all components within the stator slot, i.e., surface insulation, impregnation, interturn insulation or conductors. The results are used to develop detailed two-dimensional finite element analysis (FEA) models of the stator slot. Lumped parameter thermal network (LPTN) models such as introduced in [12] or [13] are developed for each machine. The FEA models are used to parameterize the thermal resistances of the LPTN models. As all components of the two machines are kept constant between the two machine designs except the winding, only these resistances are adjusted in the LPTN models. The local temperature distribution is analyzed in detail. The LPTN models are validated by thermal transient test bench measurements so that measured temperatures on the test bench, simulated temperatures of the machine LPTN models, and two-dimensional thermal FEA models are coincident in their results. The developed model is used to determine continuous power (S1) for different maximum permitted winding temperatures. The results of this evaluation are validated by test bench measurements of the continuous power (S1).
From a thermal perspective, the electromagnetic behavior can be specified by the amount of copper and iron losses that are produced at a specific operational point of the machine, i.e., at defined torque and speed. The approach of substituting the machine winding, which is chosen in the present publication, leaves the iron losses unchanged. The increased copper fill factor leads to a reduction of the copper losses of the machine. From the application of hairpin windings, it is known that large conductor cross sections lead to more pronounced skin- and proximity effects at high speeds [14], which diminishes the advantage of an increased copper fill factor. Electromagnetic finite element simulations and test bench trials are performed to investigate this influence. The efficiency of both machines is simulated and measured for the entire torque-speed range.
2. Simulation Methodology
2.1. Electromagnetic Simulation
The electromagnetic characteristics of both machines are obtained by applying electromagnetic 2D finite element simulations. The torque and the magnetic flux distribution are calcualated in the d-q current reference frame. An exemplary distribution of the magnetic flux density B is given in Figure 3. An exemplary operating point with and is used. The local distribution of the losses within the device under test are obtained by applying this data to the post processing process.
The torque-speed map is obtained by applying a maximum torque per ampere (MTPA) control strategy in the base speed region. The copper loss calculation is initially introduced in [8]. Skin and proximity effects are not considered for the machine with conventional round wires due to the small conductor cross section. The copper losses are calculated according to:
where I is the amplitude of the phase current and is the line-to-line resistance. For the preformed coil, skin and proximmity effects are taken into consideration. Therefore, a transient 2D simulation is performed and the ac resistance is obtained as a function of torque and speed. As this calculated resistance only considers the part of the coil, which is placed inside the slots, a factor based on the measured dc resistance and the simulated dc resistance is introduced:
The copper losses as a function of torque and speed are calculated by multiplying this factor by the simulated ac resistance:
Thus, the resistance of the end winding can also be considered. The specific iron losses are calculated according to the IEM-five-parameter-formula which is introduced in [15,16,17]:
where B is the magnetic flux density, f is the magnetization frequency. as well as are material dependent parameters that define hysteresis losses. The eddy current losses are defined by , excess losses by . The remaining parameters specify the amount of non-linear losses in the application. The iron losses of the drive can be derived by an integration of the specific iron losses over the mass :
The loss data to parametrize Equation (4) is taken from the testbench measurements. As only the total losses can be measured, the simulated copper losses are substracted to obtain the ironlosses :
Friction losses are not considered. As both machines are identical except from the winding, the same set of parameters is used to calculate the iron losses. An overview of the resulting losses for each studied operational point (OP) of this parameterization process can be found in Table 1.
OP1 is selected at low speed n and high torque T. Due to the low magnetization frequency f in the soft magnetic material, OP1 shows low iron losses in the stator tooth , the stator yoke , the rotor embedded magnet pole , and the rotor yoke . The high torque demand in the base speed region leads to high currents in the winding and a high share of copper losses. The round wire design with shows increased copper losses by in comparison to the preformed coil design with . OP2 and OP3 are operational points, both placed at a rotational speed n of . OP2 has no load, is placed in the base speed region, and thus has no copper losses . OP4 is the operational point with the highest studied speed of . It is interesting to note that the round wire design shows significantly higher winding losses for OP1 (), but lower winding losses for OP4 () due to the influence of proximity and skin effects. This difference needs to be kept in mind for the later comparison of the temperature curves. It is interesting to see weather this disadvantage of the preformed coil design is outperformed by the expected improved heat path in the later study.
2.2. Thermal Lumped Parameter Model
For the representation of the thermal behavior of both machines, LPTN models are developed. An assignment of the most important thermal nodes within the network model to the existing geometry is give in Figure 4 using the preformed coil design. The figure includes a longitudinal and a transverse section of the motor as shown in Figure 4a,b respectively.
The machine is equipped with a water based cooling channel within the housing of the machine. The fluid has a volume flow rate of 7.5 L min−1 and a heat transfer coefficient of = 4011 W m−2 K−1. The thermal resistance between the housing and the fluid is calculated to be 1.2 mW K−1. A more detailed description of the LPTN model with the most important nodes and resistances being labeled, is shown in Figure 5.
Different areas are highlighted in Figure 5. The middle section represents the electromagnetic active length and is the portion that is later modeled in the two-dimensional finite element model. The dotted area marks the thermal resistances and capacities that are changed between the round wire and the preformed coil model. All other parameters of the model are kept constant. The end winding of both machines is potted using a mixture of a mineral-filled epoxy resin Araldit CW 5730 N and a hardener HY 5731 by Bodo Möller Chemie GmbH. Due to the potting, the end winding nodes are directly linked to the end shield and the housing front node of the model. The model is designed symmetrically on both sides of the end winding. The radial connection resistance is calculated to be 690 mK W−1. The two axial connection resistances and are calculated to be 1160 mK W−1. The interface resistance between the housing and the stator lamination shows significant influence on the temperature distribution within the machine. Conductive resistances are calculated using the thickness of the conductive layer d, the area of the conductive layer A and its thermal conductivity k
The resistance is a sum of the conductive share of the housing , the interface , and the conductive share of the lamination . The second resistance with = 3.3 mK W−1 has the largest share of = 4.7 mK W−1 and is frequently discussed in literature. Thus it is described here in detail. The resistance is influenced by several parameters, such as the surface roughness, the contact pressure between the components, or the material hardness [18]. It can be modeled by an equivalent interface air gap between the components:
The thermal conductivity of air is assumed to be = 31.7 mW m−1 K−1 and the area of the interface . Typical literature values for the interface thickness are between and [18,19,20] with one outlier in [20] of . This range is used for the later described parameter identification process using test bench measurements. The final value is identified to be and thus placed at the lower level of identification range. Some other important resistances in the LPTN are the conductive resistances within the stator lamination. For the stator and rotor lamination, a thermal conductivity of 28 W m−1 K−1 ± 10% is used for the parameterization. The final value is identified to be 30 W m−1 K−1 leading to a thermal resistance between the stator yoke and the stator tooth of = 7.3 mK W−1 for the outer part of the tooth of = 12 mK W−1 and the inner part of the tooth of = 12 mK W−1. The winding and the stator tooth of the model is represented by two radially placed cuiboidal elements as introduced in [21]. The two radially aligned cuboidal elements of the active length are labeled with C1 for the radially outside and C2 for the radially inside element. The two cuboidal elements in the active section are supplemented by two elements for each, the front and the rear section of the motor, i.e., N Ewdg f and N Ewdg r.
The losses according to Table 1 are used for the model. The iron losses of the stator tooth are inserted into the stator tooth nodes labeled with C1 and C2. is applied to stator yoke node. The iron losses and are applied to the rotor embedded magnet pole node and the rotor yoke respectively. The copper losses and are distributed between the end winding section and the winding section based on the estimated length of the coil
with the active length and the length of one end winding turn .
2.3. Thermal Finite Element Analysis
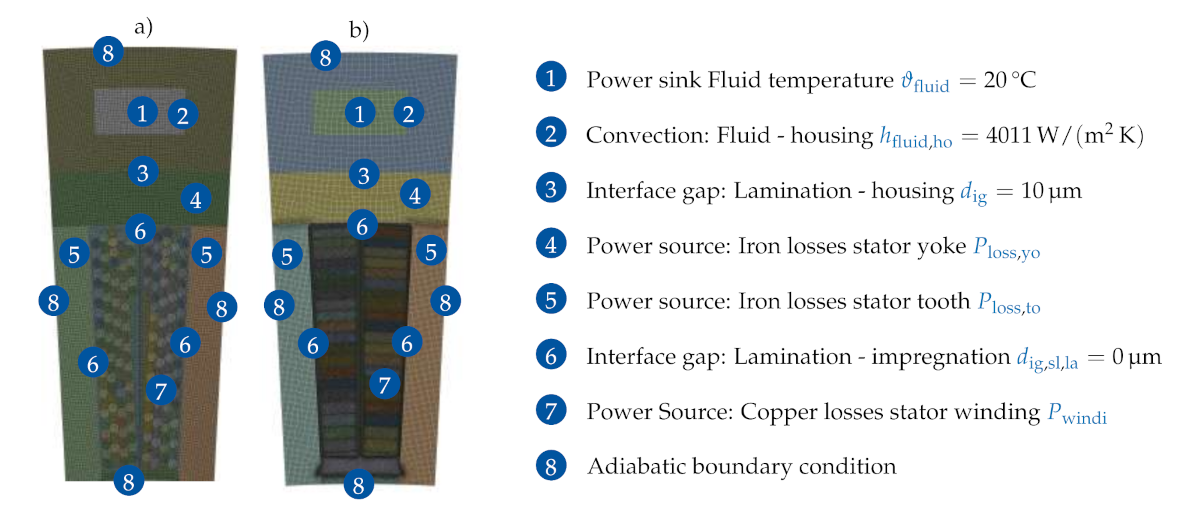
In order to achieve a well suited network model for the winding section, thermal two-dimensional finite element analysis (FEA) of the slot are performed. The adiabatic boundary of the FEA model is highlighted in the LPTN model description in Figure 5. The LPTN is run with cut resistances along this boundary for comparison and parameterization. The determination of the exact positioning of the components within the slot as well as the penetration of the impregnation material into the cavities is crucial for an exact representation of the slot. Partial stator models that are referred to as motorettes are build up for this purpose. They are first used for the accelerated aging of the winding as described in [8]. After this process, microsections are processed as depicted in Figure 6. A Leica S9i microscope is used for the measurement of the geometrical arrangement of the components. Four images of different locations of the slot of the preformed coil are shown in Figure 6. The results are used for the development of the FEA model as depcited in Figure 7.
No major air pockets can be found in the potting in Figure 6 and thus, no airgap between the lamination stack and the slot liner is modeled (see in Figure 7). Four layers of the phase-to-ground insulation material Nomex Kapton Nomex (NKN) can be found between the two coils in image 1 of Figure 6, i.e., two overlying layers for each coil. The well visible contour is the capton layer. The NKN has a datasheet thickness of . This thickness can be confirmed in section 4 of Figure 6. With a measured thickness in section 1 of Figure 6 for four layers of , it is obvious that no additional layer of impregnation needs to be inserted in the FEA model between the four layers in the coil divider area. The slot liner is modeled with isotropic conductivity. The value is varied by between the value of 0.15 W m−1 K−1 and is identified to be 0.18 W m−1 K−1 during the parameterization process using test bench measurements as described later in this study. The wire insulation thickness varies significantly in dependency of the location. The maximum measured value is as found in section 1 of Figure 6. The minimum value is highlighted by a circle in section 4. No significant remaining wire insulation can be found at this position. The sharp edge is a parasitic effect of the forming process. This effect can lead to a local error-prone wire insulation in combination with the used spray coating process. Values for two layers of wire insulation between the conductors of one coil between and are measured (see Section 4). This indicates a thickness between and for the wire insulation thickness. The cross sectional area of one conductor is known with . The wire insulation thickness with given cross sectional area of the conductor and given slot shape influences the position of the last conductor as measured in section 3 of Figure 6. In order to meet measured distances, an uniformly distributed wire insulation thickness of is selected for the FEA model.
A heat sink representing the cooling fluid is added to the model with . The heat transfer coefficient of = 4011 W m−2 K−1 and the interface gap between the stator lamination and the housing with is selected in accordance to the values of the LPTN. The model is surrounded by adiabatic boundary conditions.
3. Measurement Setup
Test bench measurements are performed for the validation of the study as introduced in [8] and depicted in Figure 8.
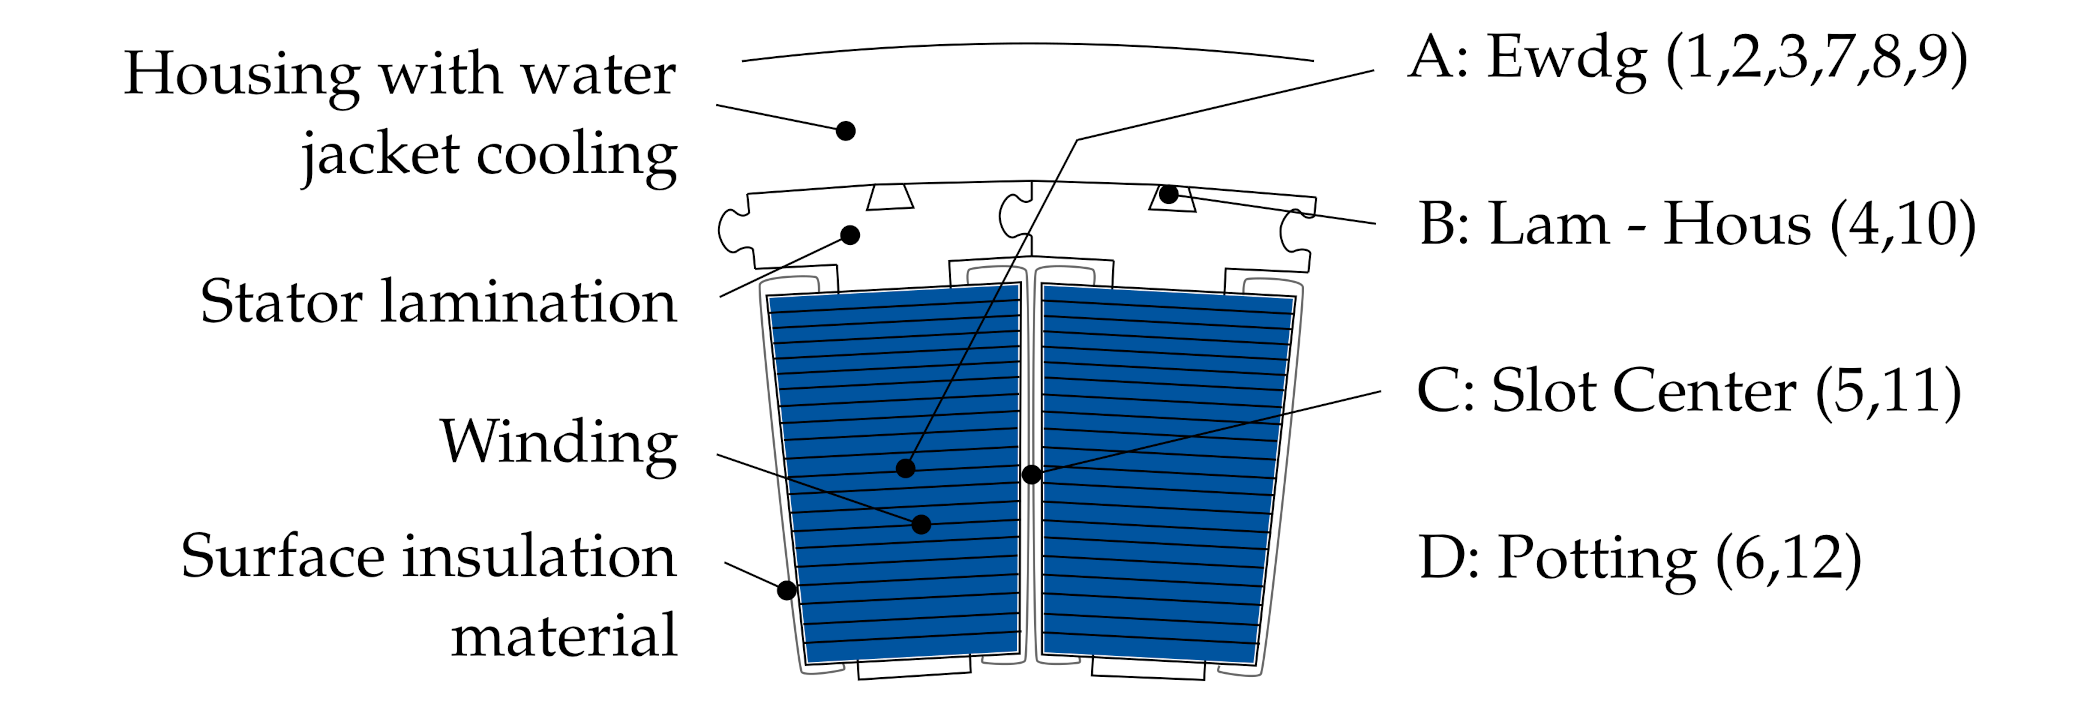
The control system is designed in Matlab-Simulink using d-q lookup tables. The control system is flashed on a dSPace DS1006 system. A dc-link voltage of for the device under test is used. The tested machine is conditioned with 7.5 L min−1 and . The two machines are mechanically connected without a gearbox. A HBM T12 torque transducer is placed in the connecting shaft measuring the torque and the rotational speed of the setup. The currents are measured by LEM sensors. The voltages are measured by a voltage transducer. The measured values are transmitted to a Yokogawa-WT-3000 power analyzer for efficiency evaluation. Temperatures are measured by twelve thermocouples type J per motor. The locations of the sensors are shown in Figure 9. Two sensors for each phase are placed in the end winding region (A: Ewdg). The temperature between the housing and the stator lamination is measured by two sensors, placed in a grove of the stator teeth (B: Lam-Hous). The slot center of the machine is equipped with two sensors (C: Slot Center). The last two sensors are placed in the potting region between the end winding and the housing (D: Potting).
4. Results
4.1. Comparison of Simulated and Measured Efficiency and Losses
A detailed description of the measurement preparation including results of induced voltage measurements as well as drag torque measurements can be found in [8]. This study also includes a detailed comparison of measured and simulated efficiency. As the losses in the machine are crucial for the thermal modeling, a short review is given. The efficiency of the machines is evaluated using grid points which are placed at steps of 50 and . A comparison of the efficiency between measured and simulated losses is given in [8]. The measured and simulated efficiencies fit well in the entire torque speed map. The measured maximum efficiency of the round wire design with is similar to the measured efficiency of the preformed coil design with . The increased copper fill factor leads to reduced losses of the preformed coil design in comparison to the round design in the base speed region. Similar behavior was already observed for the simulated losses as shown in Table 1. For high magnetization frequencies f, the advantage of the preformed coil is outperformed due to the increased skin and proximity effects occuring in the winding.
4.2. Influence of Winding Design on Measured Transient Temperature Curves
The parameterization of the models is performed in an iterative process. The simulated losses are used for the parameterization. The thermal 2D-FEA model is adjusted by the parameters that are already introduced in the pervious sections. The maximum and the average temperature ( and ) of OP1 are calculated and the LPTN model is calibrated to fit these temperatures. The maximum temperature is chosen, because it is crucial for the lifetime and the operational range. The average temperature is chosen, as copper losses of the LPTN model are scaled with average temperature . OP1 is selected, as the highest winding temperature is expected in this operational point. After calibrating the FEA with the simplified two-dimensional LTPN, the LPTN is transformed to represent the three-dimensional machine. Transient simulations of this model are performed and compared to the test bench measurements. The parameters are changed until measurements, 3D-LPTN as well as 2D-LPTN and 2D-FEA coincide. A comparison of the steady state temperatures for the four operational points between 2D-FEA and 2D-LPTN is given in Table 2. Due to the usage of operational point OP1 for the parameterization, this point fits with almost no deviation. The other operational points all fit well with a deviation of less than . It is interesting to note that the LPTN model seems to over-predict the temperatures for the operational points with increasing speed and a larger share of iron losses. As the cuboidal model of the winding in the LPTN is a low-discretizised model in comparison to the FEA some deviations seem to be inavoidable.
A comparison of the transient temperature curves of the two machines for all operational points as introduced in Table 1 is given in Figure 10.
A very good fit of 3D-LPTN-simulated and the measured temperatures is achieved. A deviation of not more than is observed. The previously identified trend regarding the exact representation of the winding temperature of the LPTN model can be confirmed. The LPTN model seems to overpredict temperatures at OP4 and tends to under-predict temperatures at OP1. As an example, the end winding temperature in OP1 for the round machine is underpredicted by the LPTN model by , whereas the end winding temperature of the preformed coil design in OP4 is overpredicted by . The fit of measured and simulated temperatures was possible under the following boundary conditions:
It is interesting to compare the temperature curves for the slot center and the end windings for the different operational points. Due to the short end winding, temperatures in the electromagnetic active part of the machine are very similar to the curves of the end winding for each operational point. In OP1, the maximum winding temperature of the round design of around is approximately higher than the winding temperature of the preformed coil with around . The copper losses of the round wire machine are higher than those of the preformed coil design. The maximum winding temperature for OP4 is also lower for the preformed coil design by some , even if the input losses of the round design are lower than those of the preformed coil design. The advantages of the improved heat dissipation paths of the preformed coil design outperform the disadvantage of the increased losses. Following observations can be concluded:
- The 2D-LPTN and the 2D-FEA show good agreement with a maximum temperature deviation of .
- The 3D-LPTN and the transient test bench measurements show a very good agreement with a maximum deviation of .
- A parameterization of all models was possible under consideration of several boundary conditions that ensure a high degree of comparability.
- The maximum winding temperature of the preformed coil design at the transient operation of OP1 for is approximately lower than the winding temperature of the round wire design.
- The disadvantage of the increased winding losses of the preformed coil design at an operational point with maximum speed (OP4: ) is outperformed by the improved heat transfer path.
4.3. Comparison of the Influence of Reduced Losses and Improved Heat Extraction Path
Some more detailed investigations are performed to separate the two different influences on the maximum temperature of the winding, i.e., the reduction of the losses by the preformed coil design in the base speed region and the improved heat transfer path. The boundary conditions of OP1 are used for this investigation. Three different temperature distributions within the slot are depicted in Figure 11.
The first setup (a) uses the geometry and the winding losses of the round design according to Table 1 with the conversion of Equation (9). The second setup (b) is an imaginary setup, where the geometry is changed to the settings of the preformed coil, but the high losses of the round wire are used. The third setup (c) is the real design of the preformed coil with the losses of the preformed coil. The average temperature as well as the maximum temperature in the slot are evaluated for the investigation. Two effects can be determined:
- (1)
- Influence on the average temperature in the slot: The improved heat path (from a to b) shows a reduction of and the reduced losses (from b to c) of . The reduced losses have a slightly higher potential of improvement.
- (2)
- Influence on the maximum temperature in the slot: The improved heat transfer path (from a to b) reduces the maximum temperature by , the reduced losses (from b to c) by . The improved heat path has a more significant influence on the maximum temperature.
The second described influence is a result of the good thermal heat dissipation from the center of the slot to the side. While setup (a) shows iso-temperature lines with an elliptical shape within the slot, (b) and (c) only show horizontal iso-temperature lines in the slot. The preformed coil design enables a more uniform temperature distribution within the slot.
4.4. Influence of Winding Design on the Operational Limits of the Machine
Simulations as well as test bench measurements are performed to investigate the influence of the winding design on the continuous operational limit S1. In the simulation approach, the validated LPTN models are used. The losses from the electromagnetic simulated torque-speed map are used as heat sources in the LPTN model. Steady state simulations are performed in a grid of torque and rotational speed steps. The maximum winding temperature of the steady state simulation is evaluated. The resulting maximum temperatures are plotted in Figure 12. For the measurement approach, the rotational speed beginning from is investigated in steps of . Each rotational speed is set by the load machine on the test bench. The torque demand for the device under test is increased until a maximum steady state temperature of the hottest sensor in the winding of is reached. The operational point is held for a time of . Within this period of time, a maximum deviation of the measured temperatures of is permitted. The measurement curve is added to the overview in Figure 12.
The process is repeated for rotational speeds up to for the round wire design and up to for the preformed coil design. A heat-up of the winding up to for speeds larger than is not possible for the preformed coil design with the given lookup tables and restrictions of the test bench setup. The curves of the possible S1-power for a maximum permitted temperature of show a good agreement between measurement and simulation. Following observations can be made:
- For the round wire design, the simulated S1-power is larger than the measured S1-power of at .
- For the preformed coil design, the simulated S1-power of is larger than the measured S1-power of at .
- According to the measurement, the S1-power of the preformed coil design at is increased by in comparison to the round wire design.
- According to the simulation, the S1-power of the preformed coil design at is increased by in comparison to the round wire design.
- Be aware that the given results of the S1-power are calculated based on the temperature limitations caused by the stator winding. Restrictions for the temperature of the permanent magnets in the rotor are likely to occure for high rotational speed [12].
A more significant deviation between measurement and simulation can be observed at maximum speed for the round wire design. At , the simulation gives a higher S1-power than the measurement. One reason for this deviation is the difference between the magnet temperatures between measurement and simulation. The torque of the device under test in the measurement is not controlled in a closed-loop, i.e., the direct and quadrilateral current from the lookup table is controlled in a closed loop. The achievable S1 power is determined at the end of the time frame. During measurement, the magnet temperature increases. The remanence flux density of the rear earth magnets decrease with increasing temperature. The decreasing rotor flux linkage leads to a decreased permanent magnet torque as shown in [22]. In the simulation, this influence is not considered, because the electromagnetic simulation is performed at room temperature. A more detailed analysis is not possible with the given hardware setup. In order to get a fully validated model, including the permanent magnet temperatures in the rotor, a measurement incorporating a rotor telemetry would be necessary such as performed in [23]. Such investigations could be content of future work.
5. Discussion
A detailed comparison of the conventional round wire design and the innovative preformed coil design is performed in this study. The used losses for the thermal modeling are validated in previous studies [8]. A thermal 2D-FEA model is developed to parameterizte a 2D-LPTN model. The 2-D FEA model is parameterized using microsections of a partial stator prototype. The 2D-LPTN and the 2D-FEA show good agreement with a maximum temperature deviation of . The 2D-LPTN model is extended to a 3D-LPTN model to represent the entire machine. Transient test bench measurements of four operational points are performed for each machine design. The 3D-LPTN and the transient test bench measurements show a very good agreement with a maximum deviation of . The parameterization of all models is possible under consideration of several boundary conditions that ensure a high degree of comparability. The maximum winding temperature of the preformed coil design at transient operation (OP1: ) is approximately lower than the winding temperature of the round wire design. The disadvantage of the increased winding losses of the preformed coil design at a operational point with maximum speed (OP4: ) is outperformed by the improved heat transfer path. A detailed analysis of the local temperature distribution in the slot is performed for steady state temperature distribution of OP1 at and . The influence of the loss reduction and the improvement of the heat extraction path on the winding temperature distribution is performed. The reduction of losses has a slightly higher potential of improving the average temperature () in the slot than the improvement of the heat path (). The improved heat path has a more significant influence on the maximum temperature () within the slot than the reduction of losses (). The preformed coil design leads to a more uniform temperature distribution within the slot. Both effects significantly contribute to the improved performance of the preformed coil design in comparison to the round wire design. The relevance of the two factors depends on the studied operational point. The maximum continuous power of the preformed coil design and the round wire design is compared. Simulations as well as test bench measurements are performed. The improvement of the S1-power is estimated by the simulation model by and by the measurements by at and a maximum allowed winding temperature of . Measurement and simulation show a very good agreement up to by a maximum deviation of . For higher speeds, a maximum deviation of up to between measurement and simulation of the round wire design is observed. A reason for this difference is the decreasing remanence flux density of the magnets for increasing magnet temperatures.
An investigation of the designs including rotor telemetry measurements could be content of a future study. The interturn insulation of the formed coil in its current setup can only withstand 120 °C (thermal class E). The analysis of the microsections additionally shows some error-prone locations, where no significant insulation thickness can be found. An insulation system for the formed coils, which meets the requirements of thermal class H, is under development.
6. Conclusions
The study shows that both aspects of the newly developed preformed coil design contribute to gain an improved performance in comparison to the round wire design in dependency of the operational conditions. The reduction of losses, especially in the base speed region of the machine, shows high potential of improvement. The improved heat removal path shows high potential for operational points with high copper losses. The thermal studies demonstrate that the improved heat dissipation path especially contributes to an improved heat removal ability from the middle of the notch to the side, i.e., to the stator teeth not to the stator yoke. This new heat path causes new inter-dependencies that should be taken into account during the design process of machines with preformed coil designs.
Author Contributions
Conceptualization, B.G., F.P. and K.H.; methodology, B.G. and F.P.; software, B.G. and F.P.; validation, B.G. and F.P.; formal analysis, B.G. and F.P.; writing—original draft preparation, B.G.; writing—review and editing, B.G., F.P. and K.H.; visualization, B.G.; supervision, K.H.; project administration, K.H.; funding acquisition, K.H. All authors have read and agreed to the published version of the manuscript.
Funding
This research and development project is funded by the German Federal Ministry of Education and Research (BMBF) within the Framework Concept “Serienflexible Technologien für elektrische Antriebe von Fahrzeugen 2”. The authors are grateful to the BMBF for the financing of this collaboration and are responsible for the contents of this publication.
Data Availability Statement
Data sharing not applicable.
Acknowledgments
We want to thank our partners of the project “FlexiCoil” for the excellent collaboration concerning this project, i.e., Schaeffler AG, Breuckmann GmbH and the Institute of Metal Forming (IBF) of RWTH Aachen University.
Conflicts of Interest
The authors declare no conflict of interest. The funders had no role in the design of the study; in the collection, analyses, or interpretation of data; in the writing of the manuscript, or in the decision to publish the results.
Abbreviations
The following abbreviations are used in this manuscript:
| ac | alternating current |
| dc | direct current |
| FEA | Finite Element Analysis |
| LPTN | Lumped Parameter Thermal Network Model |
| MTPA | Maximum Torque per Ampere |
| OP | Operational Point |
References
- Stenzel, P.; Dollinger, P.; Richnow, J.; Franke, J. Innovative needle winding method using curved wire guide in order to significantly increase the copper fill factor. In Proceedings of the 17th International Conference on Electrical Machines and Systems (ICEMS), Hangzhou, China, 22–25 October 2014; pp. 3047–3053. [Google Scholar]
- Zhao, Y.; Li, D.; Pei, T.; Qu, R. Overview of the rectangular wire windings AC electrical machine. CES Trans. Electr. Mach. Syst. 2019, 3, 160–169. [Google Scholar] [CrossRef]
- Bianchini, C.; Vogni, M.; Torreggiani, A.; Nuzzo, S.; Barater, D.; Franceschini, G. Slot Design Optimization for Copper Losses Reduction in Electric Machines for High Speed Applications. Appl. Sci. 2020, 10, 7425. [Google Scholar] [CrossRef]
- Aoyama, M.; Deng, J. Visualization and quantitative evaluation of eddy current loss in bar-wound type permanent magnet synchronous motor for mild-hybrid vehicles. CES Trans. Electr. Mach. Syst. 2019, 3, 269–278. [Google Scholar] [CrossRef]
- Berardi, G.; Nategh, S.; Bianchi, N.; Thioliere, Y. A Comparison between Random and Hairpin Winding in E-mobility Applications. In Proceedings of the 46th Annual Conference of the IEEE Industrial Electronics Society (IECON), Singapore, 18–21 October 2020; pp. 815–820. [Google Scholar]
- Liu, C.; Xu, Z.; Gerada, D.; Li, J.; Gerada, C.; Chong, Y.C.; Popescu, M.; Goss, J.; Staton, D.; Zhang, H. Experimental Investigation on Oil Spray Cooling with Hairpin Windings. IEEE Trans. Ind. Electron. 2020, 67, 7343–7353. [Google Scholar] [CrossRef]
- Venturini, G.; Volpe, G.; Villani, M.; Popescu, M. Investigation of Cooling Solutions for Hairpin Winding in Traction Application. In Proceedings of the International Conference on Electrical Machines (ICEM), Gothenburg, Sweden, 23–26 August 2020; pp. 1573–1578. [Google Scholar]
- Pauli, F.; Groschup, B.; Schröder, M.; Hameyer, K. High Torque Density Low Voltage Traction Drives with Preformed Coils: Evaluation of Operation Limitations. In Proceedings of the 10th International Electric Drives Production Conference (EDPC), Ludwigsburg, Germany, 8–9 December 2020; pp. 1–7. [Google Scholar]
- Reinap, A.; Andersson, M.; Marquez-Fernandez, F.J.; Abrahamsson, P.; Alakula, M. Performance Estimation of a Traction Machine with Direct Cooled Hairpin Winding. In Proceedings of the IEEE Transportation Electrification Conference and Expo (ITEC), Detroit, MI, USA, 19–21 June 2019; pp. 1–6. [Google Scholar]
- Petrell, D.; Teller, M.; Hirt, G.; Börzel, S.; Schäfer, W. Manufacturing of Conically Shaped Concentrated Windings for Wheel Hub Engines by a Multi-Stage Upsetting Process. In Proceedings of the 2019 9th International Electric Drives Production Conference (EDPC), Esslingen, Germany, 3–4 December 2019; pp. 1–7. [Google Scholar]
- Petrell, D.; Teller, M.; Hirt, G.; Börzel, S.; Schäfer, W. Economical Production of Conically Shaped Concentrated Windings Using Forming Technology in Wheel Hub Drives. In Proceedings of the 10th International Electric Drives Production Conference (EDPC), Ludwigsburg, Germany, 8–9 December 2020; pp. 1–7. [Google Scholar]
- Groschup, B.; Komissarov, M.; Stevic, S.; Hameyer, K. Operation Enhancement of Permanent Magnet Excited Motors with Advanced Rotor Cooling System. In Proceedings of the IEEE Transportation Electrification Conference and Expo (ITEC), Detroit, MI, USA, 19–21 June 2019; pp. 1–6. [Google Scholar]
- Boglietti, A.; Cavagnino, A.; Staton, D.; Shanel, M.; Mueller, M.; Mejuto, C. Evolution and Modern Approaches for Thermal Analysis of Electrical Machines. IEEE Trans. Ind. Electron. 2009, 56, 871–882. [Google Scholar] [CrossRef] [Green Version]
- Du-Bar, C.; Wallmark, O. Eddy Current Losses in a Hairpin Winding for an Automotive Application. In Proceedings of the 2018 XIII International Conference on Electrical Machines (ICEM), Alexandroupoli, Greece, 3–6 September 2018; pp. 710–716. [Google Scholar]
- Schmidt, D.; van der Giet, M.; Hameyer, K. Improved iron-loss prediction by a modified loss-equation using a reduced parameter identification range. In Proceedings of the 20th International Conference on Soft Magnetic Materials (SMM), Mpenou, Kos Island, Greece, 18–22 September 2011; p. 421. [Google Scholar]
- Eggers, D.; Steentjes, S.; Hameyer, K. Advanced Iron-Loss Estimation for Nonlinear Material Behavior. IEEE Trans. Magn. 2012, 48, 3021–3024. [Google Scholar] [CrossRef]
- Steentjes, S.; Eggers, D.; Leßmann, M.; Hameyer, K. Iron-loss model for the FE-simulation of electrical machines. In Proceedings of the INDUCTICA Technical Conference, Berlin, Germany, 26–28 June 2012; Monkman, G., Ed.; pp. 239–246. [Google Scholar]
- Staton, D.; Boglietti, A.; Cavagnino, A. Solving the More Difficult Aspects of Electric Motor Thermal Analysis in Small and Medium Size Industrial Induction Motors. IEEE Trans. Energy Convers. 2005, 20, 620–628. [Google Scholar] [CrossRef] [Green Version]
- Boglietti, A.; Cavagnino, A.; Staton, D.A. Determination of Critical Parameters in Electrical Machine Thermal Models. IEEE Trans. Ind. Appl. 2008, 44, 1150–1159. [Google Scholar] [CrossRef]
- Wang, W.; Zhou, Y.; Chen, Y. Investigation of lumped-parameter thermal model and thermal parameters test for IPMSM. In Proceedings of the 17th International Conference on Electrical Machines and Systems (ICEMS), Hangzhou, China, 22–25 October 2014; pp. 3246–3252. [Google Scholar]
- Wrobel, R.; Mellor, P.H. A General Cuboidal Element for Three-Dimensional Thermal Modelling. IEEE Trans. Magn. 2010, 46, 3197–3200. [Google Scholar] [CrossRef]
- Thul, A.; Groschup, B.; Hameyer, K. Influences on the Accuracy of Torque Calculation for Permanent Magnet Synchronous Machines. IEEE Trans. Energy Convers. 2020, 35, 2261–2268. [Google Scholar] [CrossRef]
- Jaeger, M.; Ruf, A.; Hameyer, K.; Tongeln, T.G.V. Thermal Analysis of an Electrical Traction Motor with an Air Cooled Rotor. In Proceedings of the IEEE Transportation and Electrification Conference and Expo (ITEC), Long Beach, CA, USA, 13–15 June 2018; pp. 467–470. [Google Scholar]
Figure 1.
Overview of preformed coil: (a) Semi finished coil. (b) Finished coil in the stator tooth. (c) Images of the final coil with insulation.
Figure 1.
Overview of preformed coil: (a) Semi finished coil. (b) Finished coil in the stator tooth. (c) Images of the final coil with insulation.

Figure 2.
Axial view of the electromagnetic active motor parts and detailed axial view of the slot of the proposed preformed coil design.
Figure 2.
Axial view of the electromagnetic active motor parts and detailed axial view of the slot of the proposed preformed coil design.
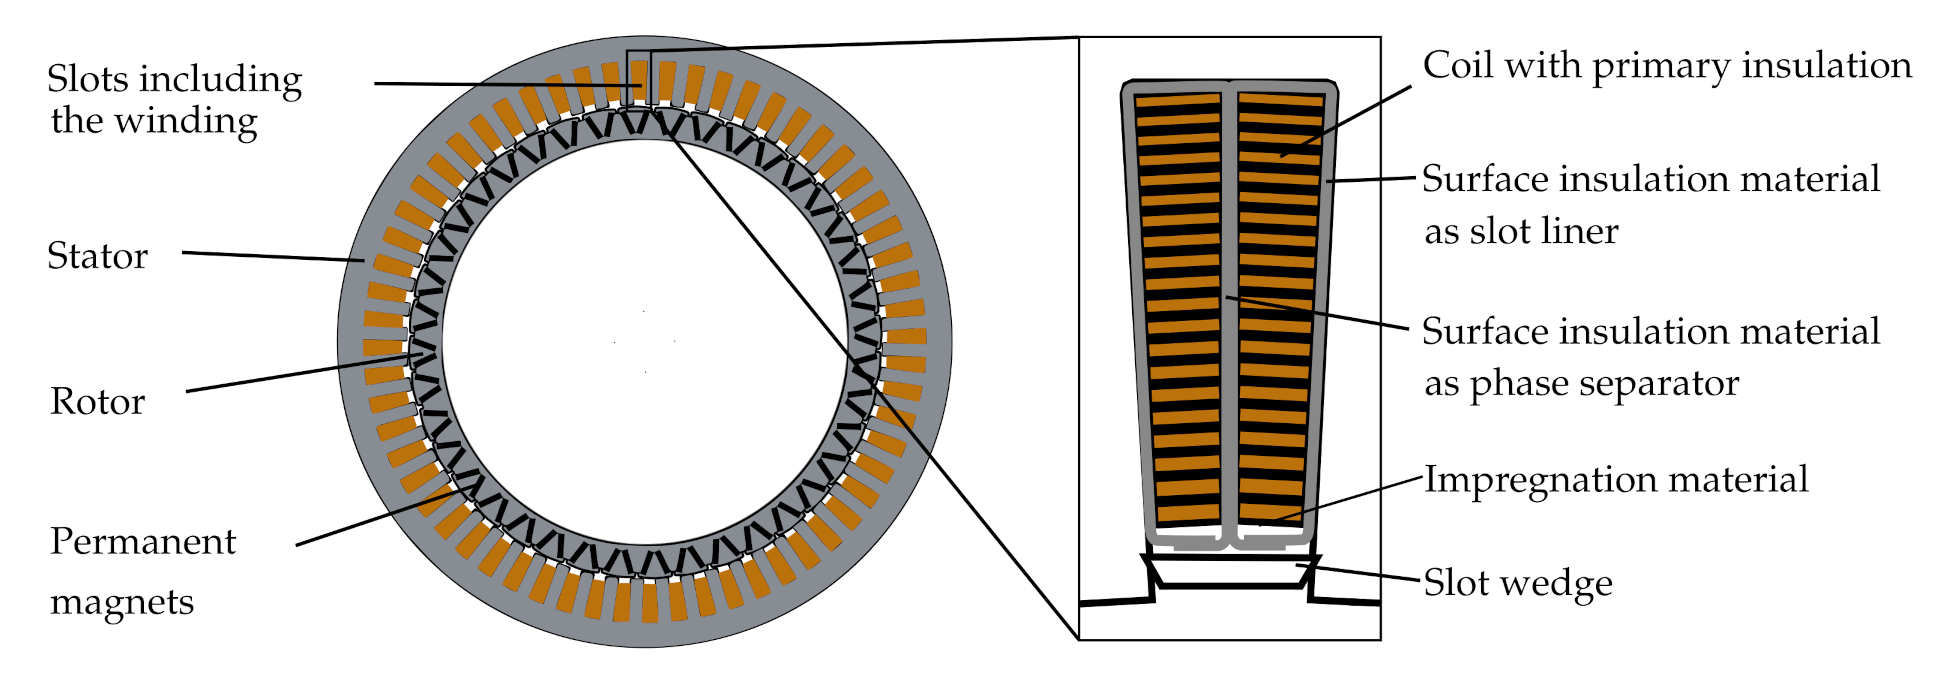
Figure 3.
Flux distribution inside the PMSM at an examplary operating point and .
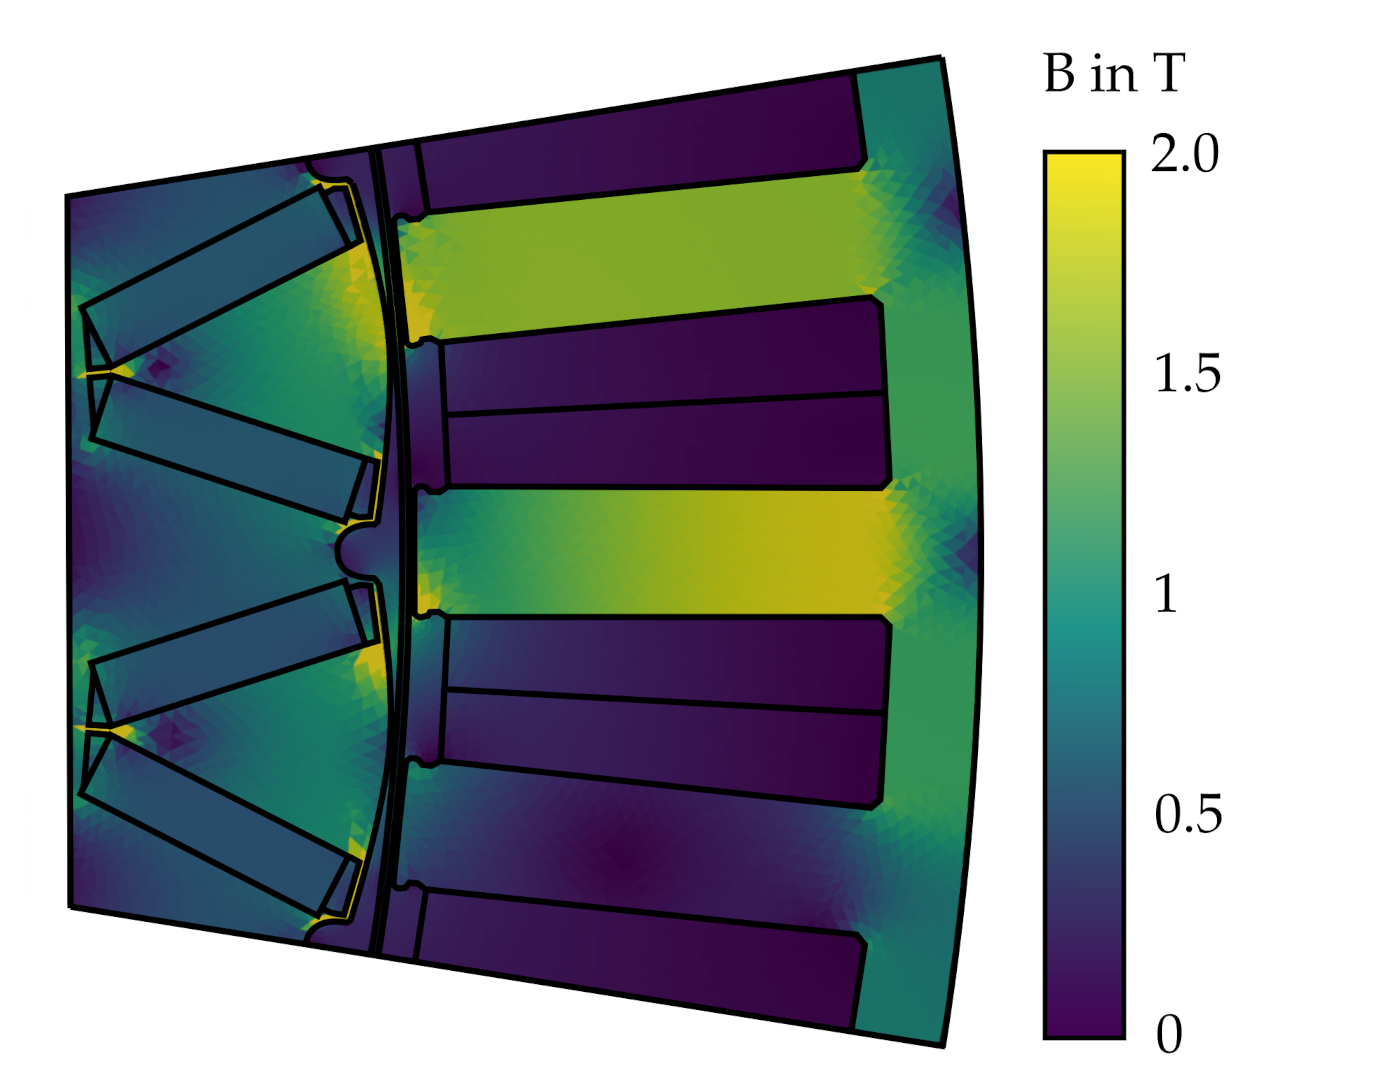
Figure 4.
Location of the nodes of the LPTN model: (a) Longitudinal section of the geometry. (b) Transverse section of the geometry.
Figure 4.
Location of the nodes of the LPTN model: (a) Longitudinal section of the geometry. (b) Transverse section of the geometry.
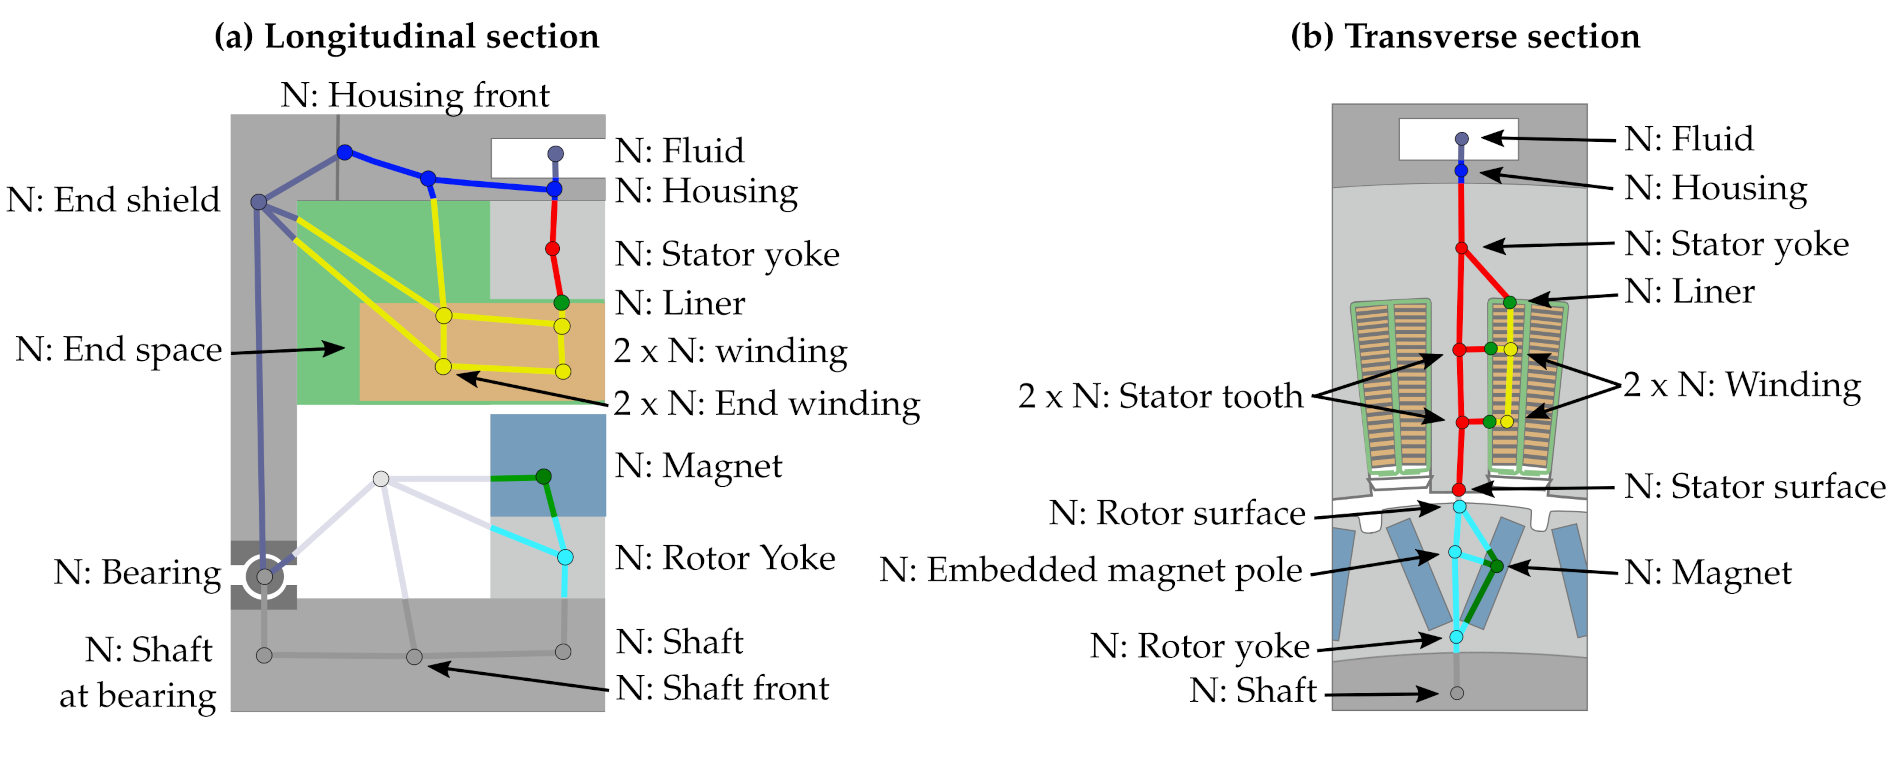
Figure 5.
Detailed overview of entiere LPTN model.

Figure 6.
Microsection of a partial motor model of the preformed coil design.
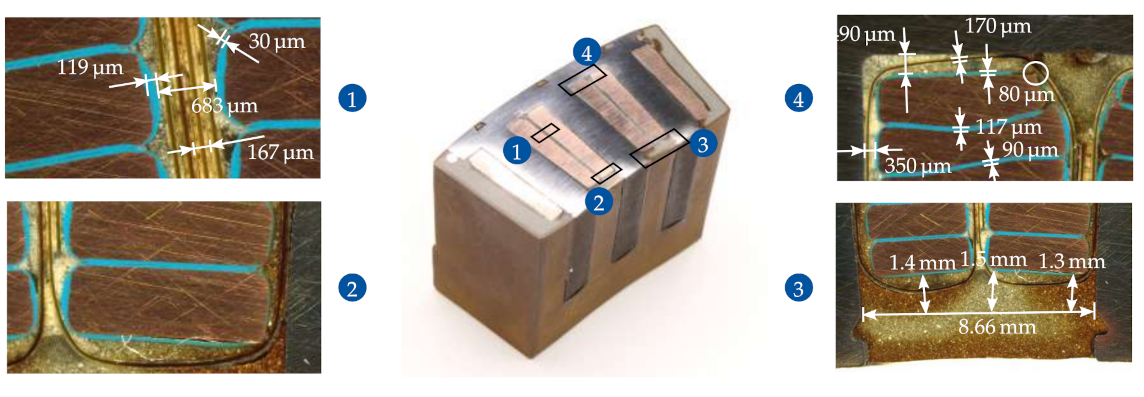
Figure 7.
Comparison of mesh settings and boundary conditions for the thermal FEA models. Round wire design (a) and preformed coil design (b).
Figure 7.
Comparison of mesh settings and boundary conditions for the thermal FEA models. Round wire design (a) and preformed coil design (b).

Figure 8.
Schematic overview of the test bench setup.
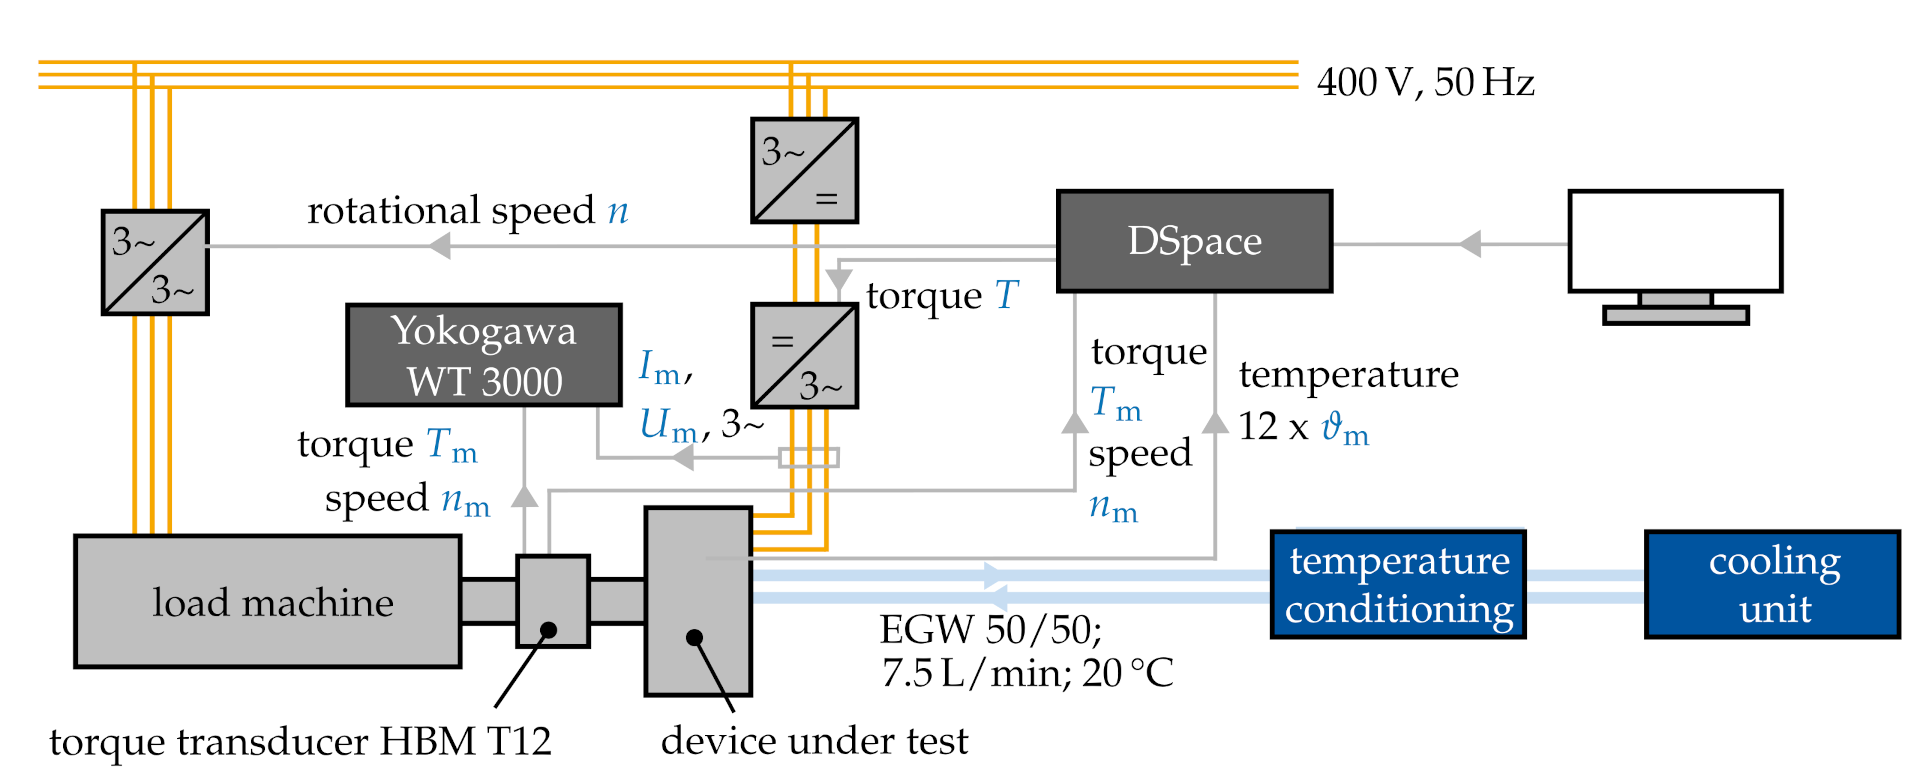
Figure 9.
Positioning of the thermocouples type J within the machine.

Figure 10.
Comparison between LPTN simulation models and test bench measurement data.
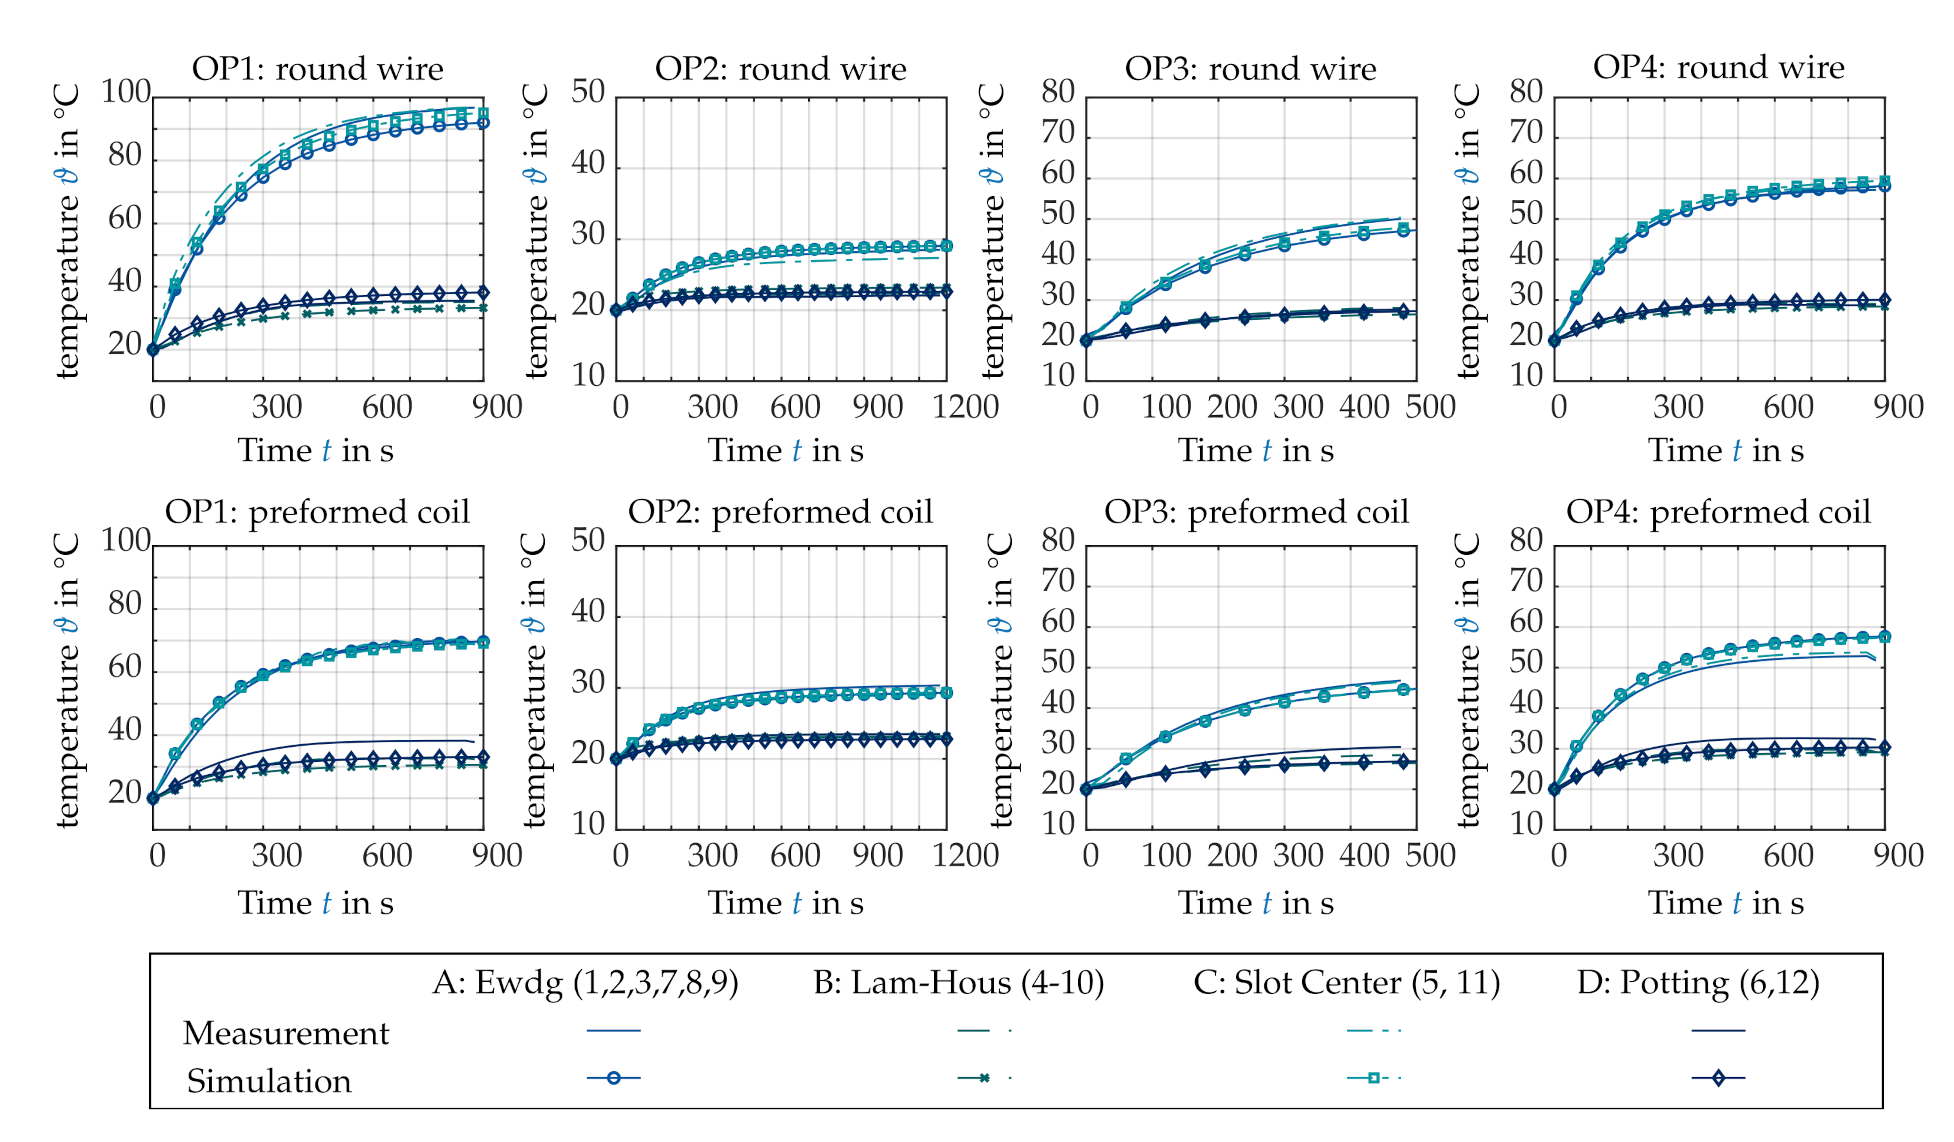
Figure 11.
Comparison of temperature distribution in the slot using two-dimensional thermal FEA: (a) Round wire design and high copper losses. (b) Preformed coil design with high copper losses. (c) Preformed coil design with low copper losses.
Figure 11.
Comparison of temperature distribution in the slot using two-dimensional thermal FEA: (a) Round wire design and high copper losses. (b) Preformed coil design with high copper losses. (c) Preformed coil design with low copper losses.
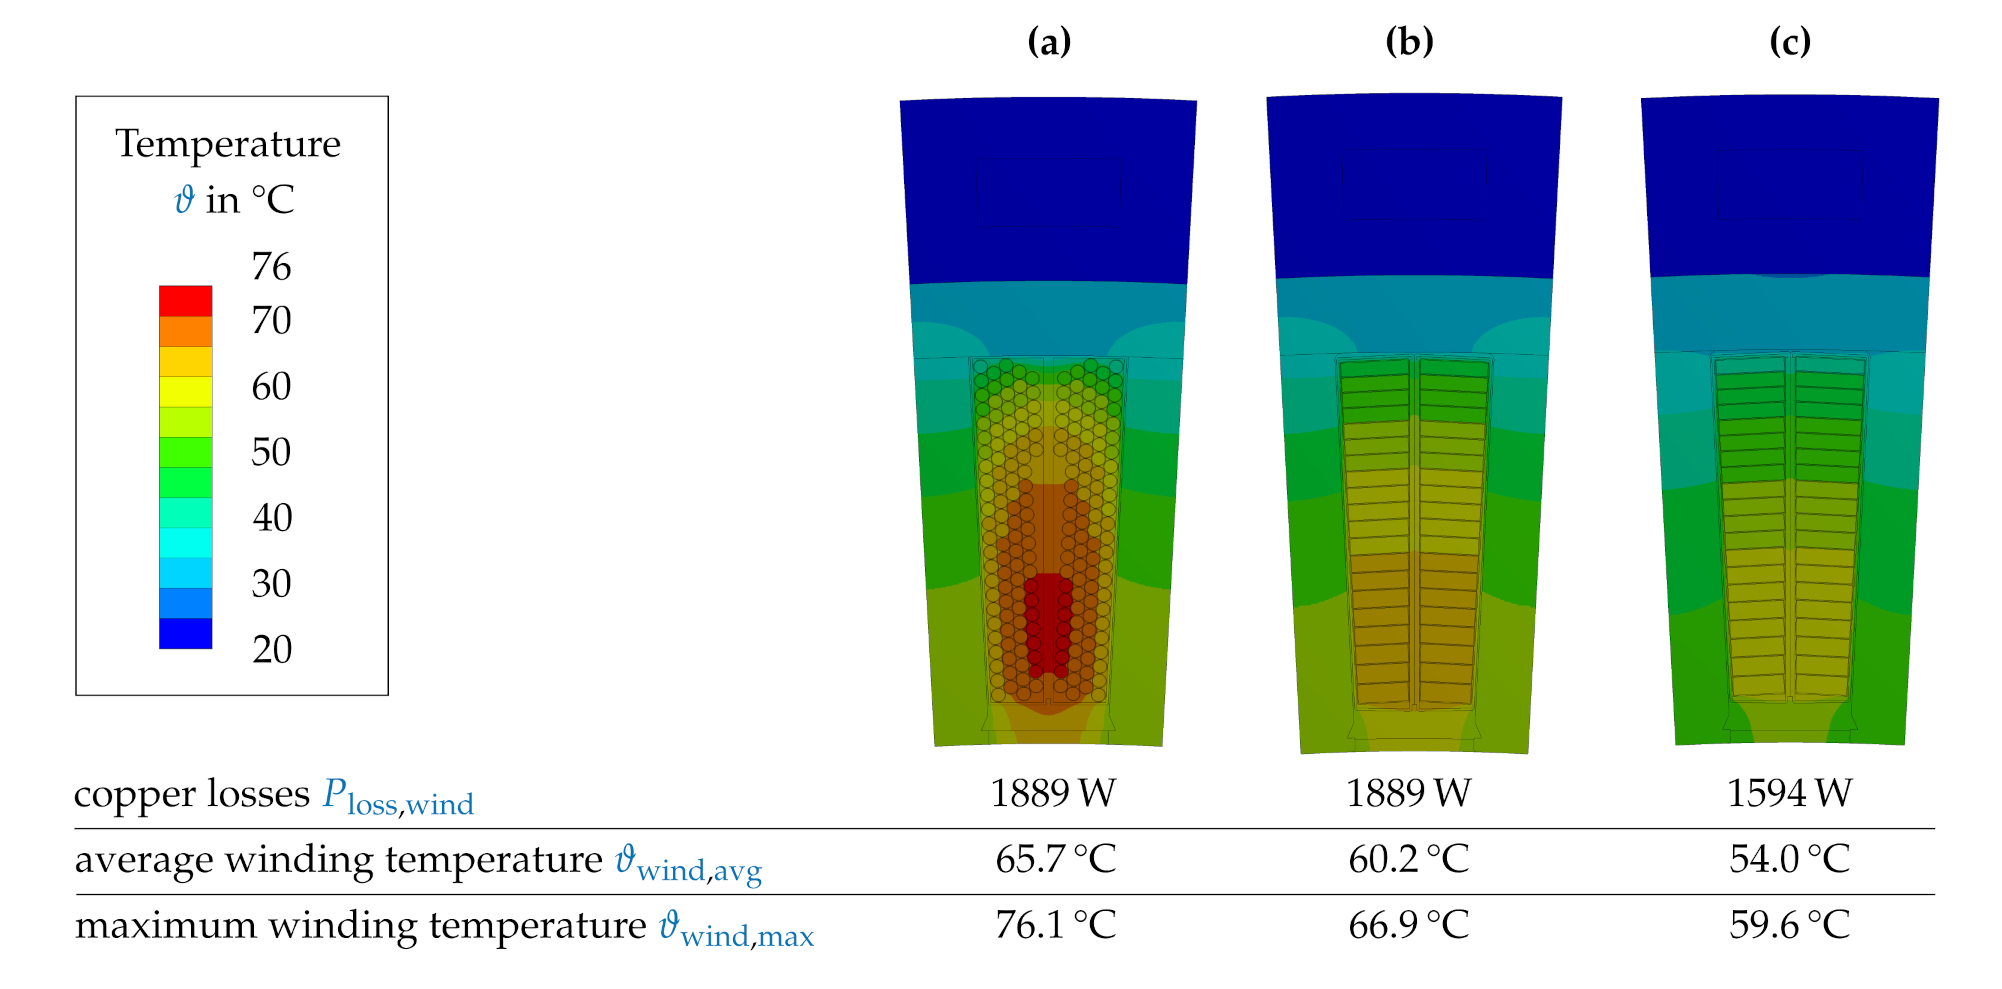
Figure 12.
Comparison of continuous operational power (S1) between simulation and measurement: (a) Round wire design (b), Preformed coil design.
Figure 12.
Comparison of continuous operational power (S1) between simulation and measurement: (a) Round wire design (b), Preformed coil design.


Table 1.
Overview of losses for studied operational points.
| OP | T | n | PFe,sta,to | PFe,sta,yo | PFe,rot,emp | PFe,rot,yo | Pwind,round | Pwind,pref |
|---|---|---|---|---|---|---|---|---|
| in Nm | in rpm | in W | in W | in W | in W | in W | in W | |
| 1 | 650 | 50 | 32 | 14 | 9 | 2 | 2699 | 2277 |
| 2 | 0 | 800 | 507 | 217 | 155 | 39 | 0 | 0 |
| 3 | 400 | 800 | 515 | 222 | 152 | 38 | 905 | 894 |
| 4 | 300 | 1200 | 461 | 198 | 205 | 51 | 1275 | 1440 |
Table 2.
Comparison of Steady State Temperatures of Two-Dimensional Thermal LPTN and FEA in °C.
| Maximum Temperature ϑmax | Average Temperature ϑavg | |||||||
|---|---|---|---|---|---|---|---|---|
| OP1 | OP2 | OP3 | OP4 | OP1 | OP2 | OP3 | OP4 | |
| round wire design: ϑLPTN−2D − ϑFEA−2D | 0.4 | 3.1 | 3.5 | 5.4 | 0.3 | 3.1 | 3.1 | 4.5 |
| preformed coil design: ϑLPTN−2D − ϑFEA−2D | −0.4 | 3.1 | 3.3 | 4.9 | 0.0 | 3.3 | 3.1 | 4.4 |
Publisher’s Note: MDPI stays neutral with regard to jurisdictional claims in published maps and institutional affiliations. |
© 2021 by the authors. Licensee MDPI, Basel, Switzerland. This article is an open access article distributed under the terms and conditions of the Creative Commons Attribution (CC BY) license (http://creativecommons.org/licenses/by/4.0/).
Share and Cite
MDPI and ACS Style
Groschup, B.; Pauli, F.; Hameyer, K. Influence of the Preformed Coil Design on the Thermal Behavior of Electric Traction Machines. Energies 2021, 14, 959. https://doi.org/10.3390/en14040959
AMA Style
Groschup B, Pauli F, Hameyer K. Influence of the Preformed Coil Design on the Thermal Behavior of Electric Traction Machines. Energies. 2021; 14(4):959. https://doi.org/10.3390/en14040959
Chicago/Turabian StyleGroschup, Benedikt, Florian Pauli, and Kay Hameyer. 2021. "Influence of the Preformed Coil Design on the Thermal Behavior of Electric Traction Machines" Energies 14, no. 4: 959. https://doi.org/10.3390/en14040959
Note that from the first issue of 2016, this journal uses article numbers instead of page numbers. See further details here.