A Survey of Condition Monitoring and Fault Diagnosis toward Integrated O&M for Wind Turbines


Department of Electrical Engineering, Tsinghua University, Beijing 100084, China
*
Author to whom correspondence should be addressed.
Energies 2019, 12(14), 2801; https://doi.org/10.3390/en12142801
Submission received: 15 June 2019
/
Revised: 15 July 2019
/
Accepted: 16 July 2019
/
Published: 20 July 2019
(This article belongs to the Special Issue Maintenance Management of Wind Turbines)
Abstract
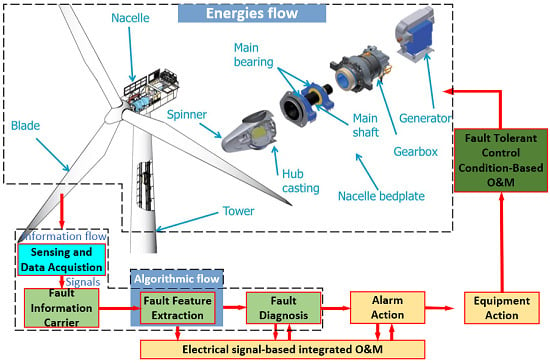
:Wind power, as a renewable energy for coping with global climate change challenge, has achieved rapid development in recent years. The breakdown of wind turbines (WTs) not only leads to high repair expenses but also may threaten the stability of the whole power grid. How to reduce the operation and the maintenance (O&M) cost of wind farms is an obstacle to its further promotion and application. To provide reliable condition monitoring and fault diagnosis (CMFD) for WTs, this paper presents a comprehensive survey of the existing CMFD methods in the following three aspects: energy flow, information flow, and integrated O&M system. Energy flow mainly analyzes the characteristics of each component from the angle of energy conversion of WTs. Information flow is the carrier of fault and control information of WT. At the end of this paper, an integrated WT O&M system based on electrical signals is proposed.
1. Introduction
1.1. Background
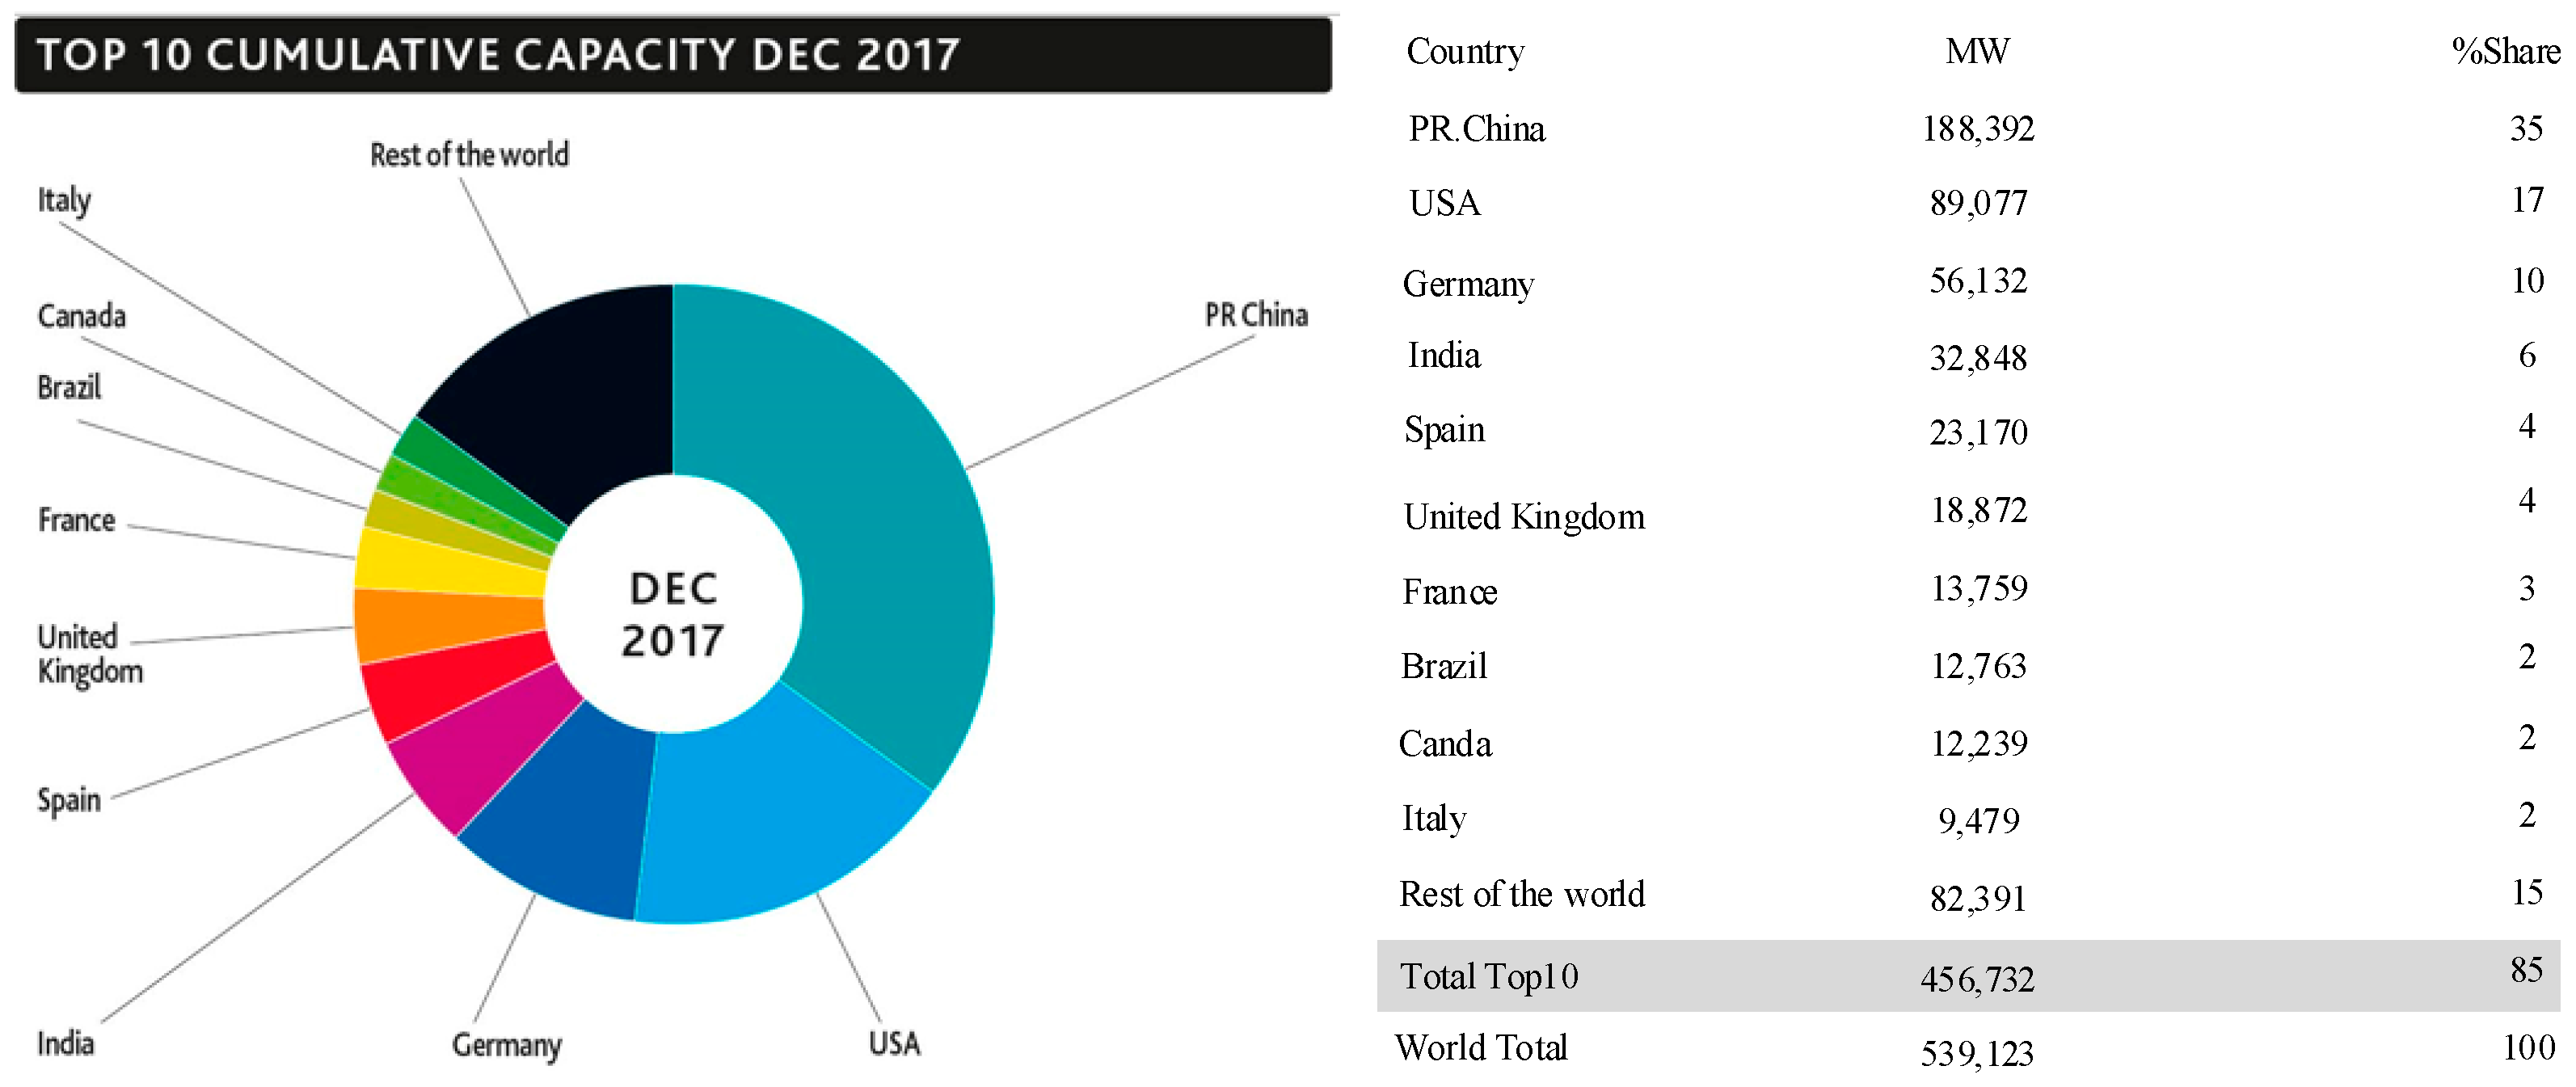
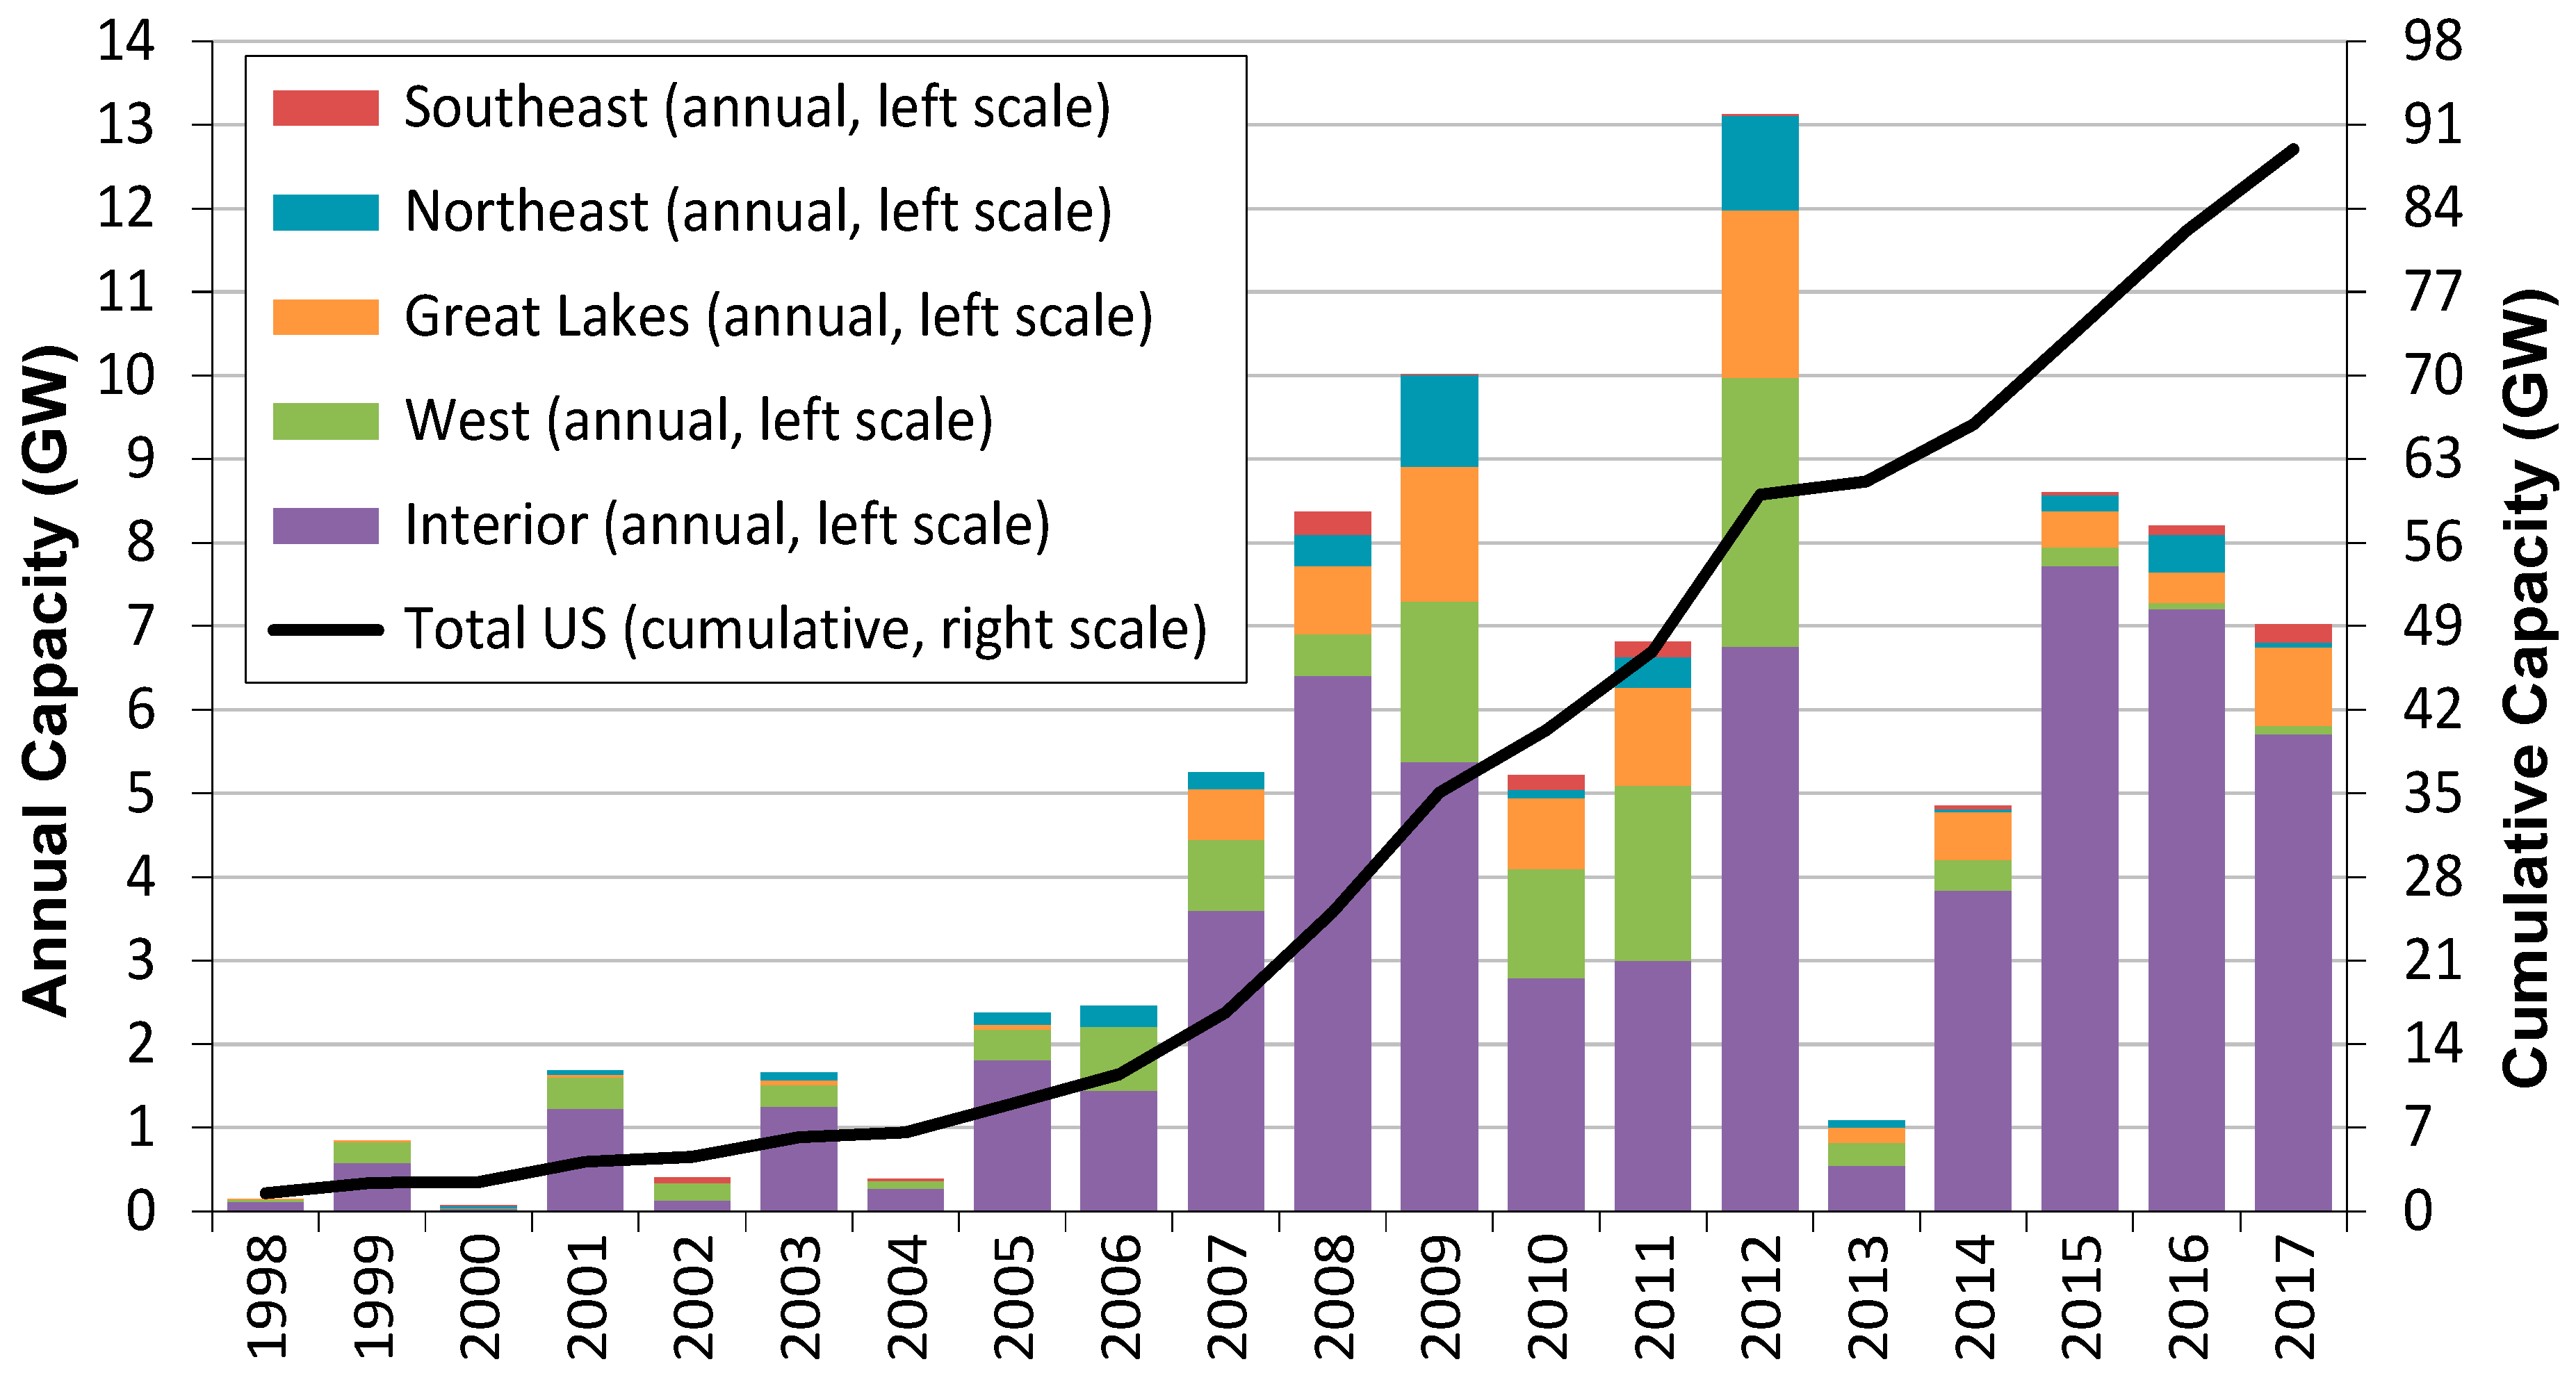
The global desire for clean energy is driving the rapid development of wind power, and wind turbine (WT) manufacturing techniques have made tremendous progress in recent decades. As shown in Figure 1, the reports show that the installed capacity of wind power in the United States and P.R. China accounted for more than half of the total worldwide in 2017. Furthermore, the USA wind power market surged in 2017 with 9598 MW of new capacity added, bringing the cumulative total to 89,077 MW as shown in Figure 2 [1]. Meanwhile, China surpassed the United States in cumulative installations in 2017, and the latest data show that China led both offshore and onshore wind energy installation in 2017 [2]. The rapid increase of installed capacity of WTs has brought hope for solving the problem of fossil energy shortage, especially the utilization of offshore wind energy.
Despite the rapid development of WTs, the operation and the maintenance (O&M) techniques of WTs are lagging behind, and little research has been done. Compared with traditional steam turbines and hydraulic turbines, WTs are usually located in remote and harsher environments with high humidity, high salt-fog, large temperature fluctuation and even snow-covered conditions. Long-term and large-scale load fluctuations also bring great uncertainty to prognostic and health management of WTs. The WT is complex in structure, and its nacelle is located above a tower hundreds of meters high and difficult to access. The O&M data from the first-line wind farms show that the high failure rates of WTs seriously squeezes the economic benefits of the wind farm. The condition monitoring and fault diagnosis (CMFD) technique of a wind farm is the core issue of timely discovery of incipient faults and arranging scheduled maintenance to reduce the O&M cost of the wind farm.
1.2. Overview of the Survey
This paper introduces the related techniques of the WT CMFD from a comprehensive perspective. Energy flow, information flow, and an integrated WT O&M system based on electrical signal are discussed in detail in this paper. In the design and the production stage of WTs, the fault modes and the fault characteristic parameters of each component of WTs need to be considered beforehand. Firstly, the various components of the WT are divided into wind energy subset, mechanical energy subset, and electrical energy subset from the perspective of energy flow. As the highlight of the paper, the failure modes and the characteristic parameters of each component are considered comprehensively. Secondly, the various signals of the WT are divided into vibration, torque, electrical, temperature, and acoustic emission (AE) from the perspective of information flow. The intrinsic link between the fault information carriers is discussed and summarized in detail. Thirdly, since the electrical signal is non-intrusive in nature, it is not necessary to add redundant sensors to convert other signals into electrical signals during fault diagnosis. The electrical signal is the optimal fault information carrier in the O&M information flow of the wind farm. A wind farm O&M method based on the electrical signals is proposed.
Compared with the existing literature survey, the contribution of this paper is to focus on the intrinsic link between the various components of the energy flow and the various fault information carriers of the information flow. The manifestations of each faulty component in each fault information carrier is discussed and summarized in detail. Considering that the purpose of all sensors is to convert other kinds of signals into electrical signals, the O&M methods based on electrical signals can directly skip the sensor link, thus the wind farm O&M based on electrical signals with the integration of control and fault diagnosis is emphasized and separated into a single section.
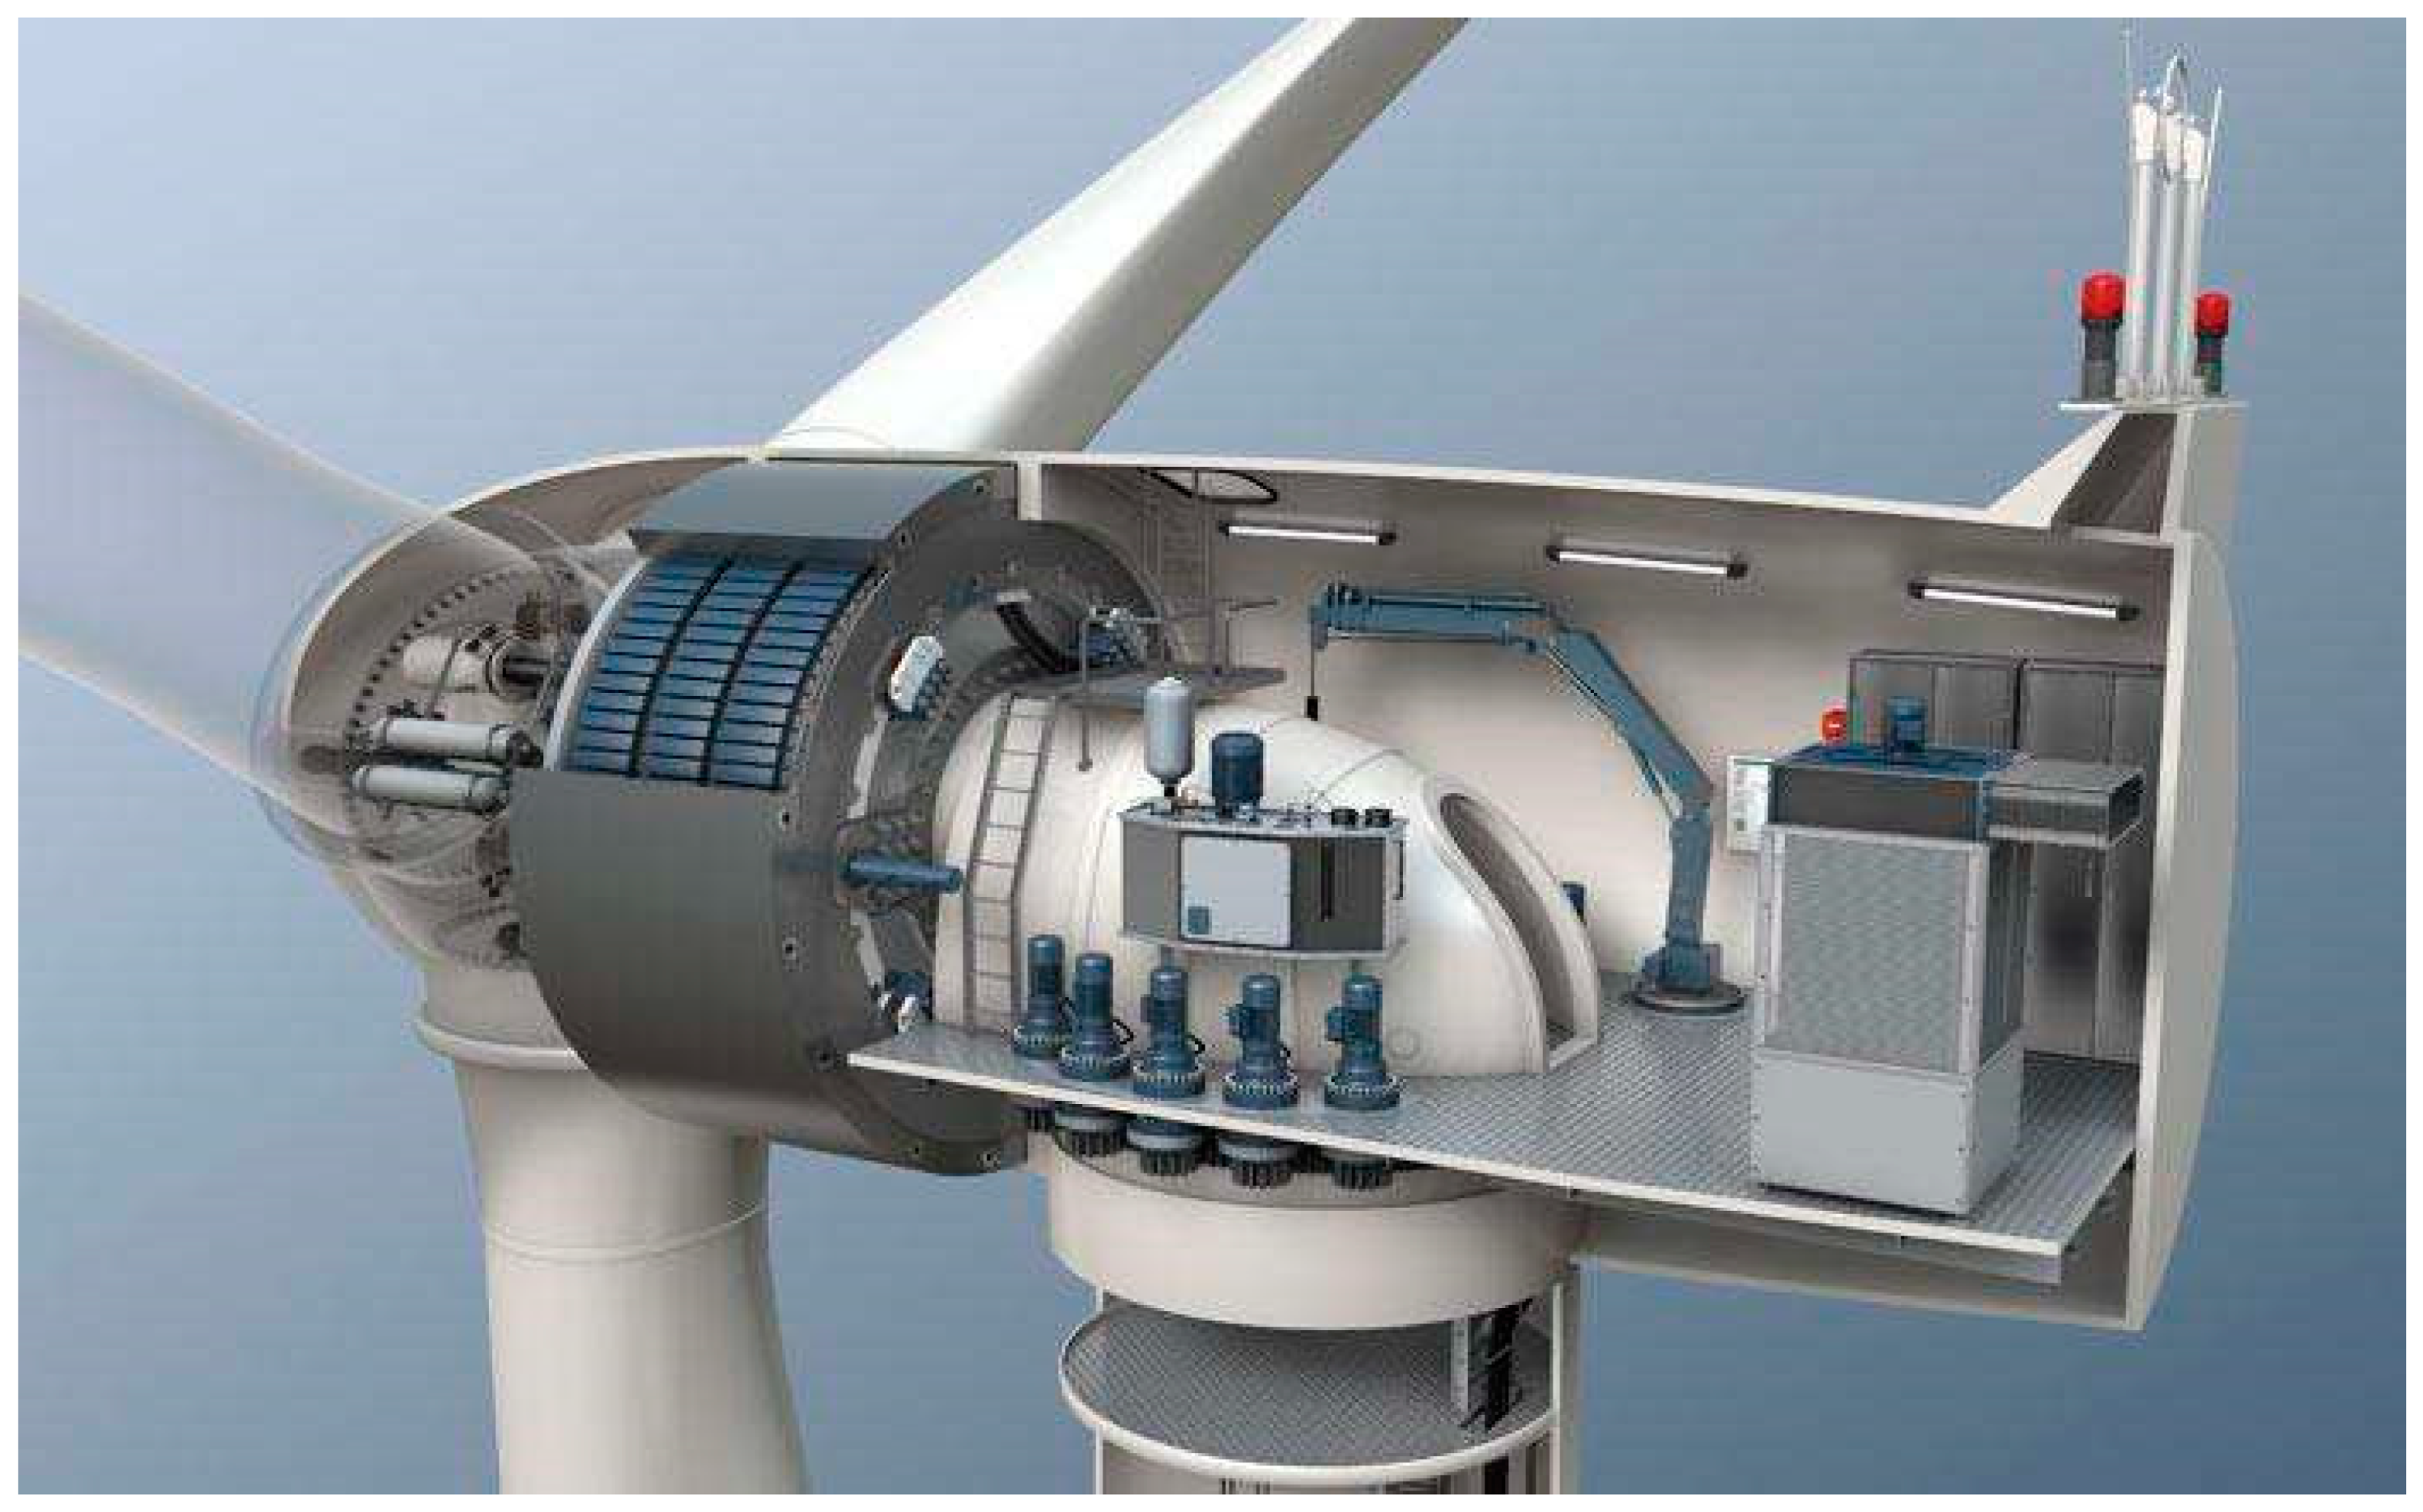
2. WT Component
WTs are a complex and highly coupled power conversion system from wind energy to mechanical energy to electrical energy. In order to obtain maximum wind energy and ensure safe and stable operation of WTs, many sensors and auxiliary equipment are installed in the nacelle of WTs, which increase the complexity of WT. Figure 3 and Figure 4 show the typical structure of WTs. The difference between two structures is that doubly fed induction generator (DFIG) WTs have drivetrain gearboxes, and the generator is directly connected with the blades in a permanent magnet synchronous generator (PMSG). The components of WTs can be divided into three subsets: wind energy subset, mechanical energy subset, and electrical energy subset according to energy flow. The blades are rotating devices that are exposed to the outside and directly capture wind energy. The tower is the supporting device for the entire WT nacelle and blades. The harsh environment will cause cracks from the point to the surface of the tower and may even cause the entire tower to fall down. The pitch system and the yaw system are auxiliary devices for adjusting the pitch angle and the nacelle direction in order to obtain maximum wind energy. These devices are all a subset of the wind energy in the energy flow. Both the shaft and the gearbox are mechanical drivetrain in the nacelle, which belong to the subset of the mechanical energy in the energy flow. Since the vibration sensor is easily attached to the surface of the mechanical drivetrain, the vibration signal is generally preferred in the industry for fault diagnosis. However, unfortunately, the narrow nacelle of the WT creates obstacles to the installation of sensors. A generator and its auxiliary power electronic device transform mechanical energy into uniform and standard electric energy belonging to the electric energy subset of energy flow. Since there is a steel shell on the outside of the motor, it is not advisable to go deep into the motor for monitoring, which would probably cause damage to the electromagnetic reaction. In addition, the more widely used a power electronic device is, the more fragile it will be, which poses a challenge for the fault diagnosis of the electric energy subset.
The CMFD is an effective way to realize intelligent O&M and reduce the cost of wind power. Condition monitoring is a process of monitoring the operation parameters of electromechanical systems. By monitoring the change of parameters and analyzing the physical relationship between parameters and faults, the diagnosis and the prediction of faults can be realized in a timely manner. The wind farm supervisory control and data acquisition (SCADA) system is a remote O&M cloud platform realizing the functions of monitoring, controlling, recording, and statistics of the operation status of each important unit and accessory systems [3,4]. Vibration, electric, AE, temperature, and oil are all possible information carriers of fault parameters. The existing condition monitoring techniques are mainly divided into two parts: offline condition monitoring and online monitoring. Offline condition monitoring requires the WT to be separated from the working condition in order to extract fault information. The advantages of online condition monitoring over offline condition monitoring are obvious—online condition monitoring is performed, whereas the WTs are in service. This reduces the loss of energy production costs in the process of WT condition monitoring. At the same time, it should be emphasized that online monitoring is to extract fault parameters during the operation of WTs. How to extract small fault from massive data under normal conditions is still a great challenge. The harsh environment of the wind farm combined with variable speed and variable load conditions poses a severe challenge to improving the signal-to-noise ratio (SNR) of online monitoring and to achieving decoupling between fault and normal conditions.
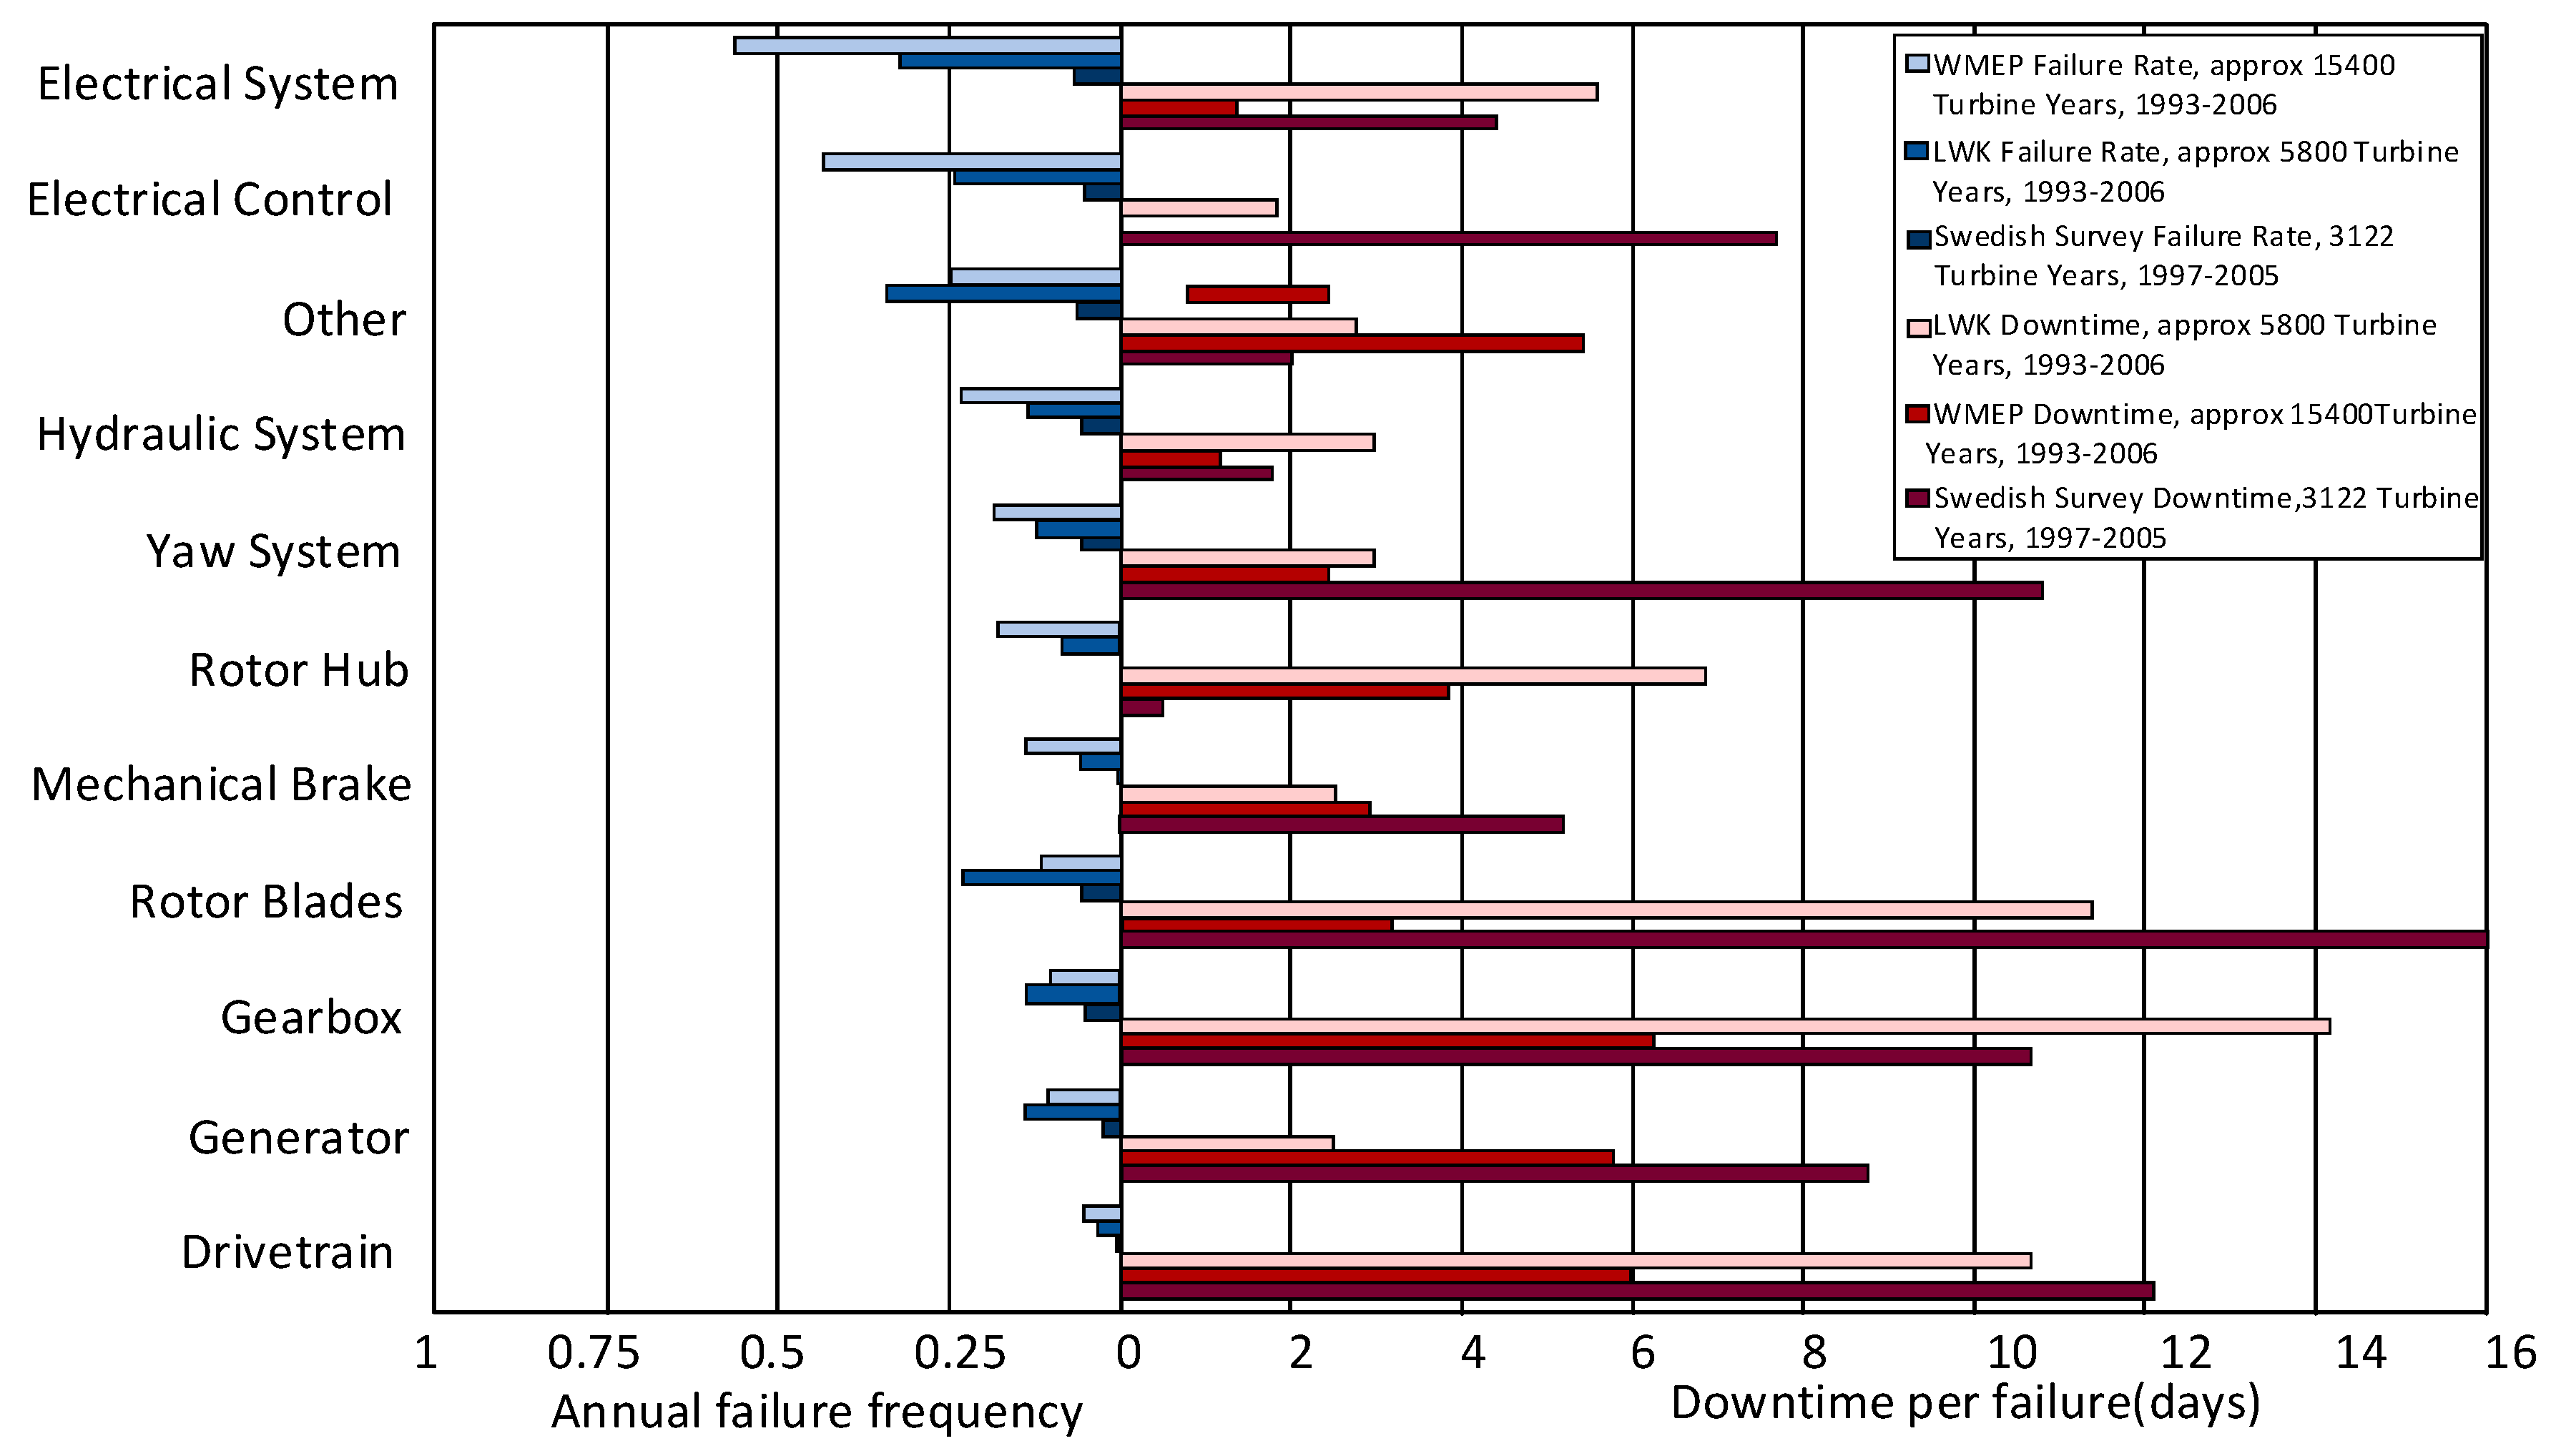
As shown in Figure 5, data surveyed from three wind farms of Europe show the average annual failure of each WT component and the average time of each failure. From this, a conclusion was drawn that the failure rates of blades, generators, electrical system, electrical control, and gearboxes are higher. When WT fault occurs, yaw system, blades, drivetrain, and gear box failures often lead to a long downtime of WT. The components with high failure rate and long downtime caused by each failure are the core issues of CMFD for WTs.
3. WT Energy Flow
3.1. Wind Energy Subset
Components used to capture wind energy or serve wind energy in WTs belong to the wind energy subset in the energy flow. Blades, pitch systems, yaw systems, and towers are indispensable components. Components belonging to the wind energy subset are exposed to the wild, resulting in inevitably higher failure rates. Moreover, due to the change of wind speed and the inertia of the rotation of its own blades, the working condition is unstable. These characteristics of the wind energy subset components bring new challenges to CMFD of WTs, which are discussed below.
3.1.1. Blade
The blade is a device for WTs to capture wind energy. It is the only mechanical component that is widely oscillating and exposed to the outside for all components of the WT. Exposed to the natural environment, the blade is prone to various faults due to the influence of aerodynamic and adverse environmental factors [6,7]. The imbalance of blades threatens the stability of the whole WT and can even lead to the collapse of the wind tower. In recent years, as the focus of wind energy development has shifted from land to sea while bringing more clean energy, it has also led to the size of blades becoming larger and larger [8]. With high wind speed and high salinity and humidity, the risk of failure of larger blades increases exponentially. The maintenance cost of offshore WTs is high, and the blades damaged seriously need to be repaired by transporting ships back to factories. The CMFD of offshore wind farms have a broader application prospect.
The imbalanced fault of the blade is found by using the frequency spectrum of the vibration signal [9,10,11,12]. The imbalanced faults of WT blades can also be monitored by analyzing the frequency spectrum of the shaft torque [13]. Although the generator of a WT is far from the blade in the drivetrain chain, it can also analyze the health of the blade by analyzing the power spectrum [14]. More directly, the researchers used fiber bragg grating (FBG) sensors to monitor the probable unseen crack faults in the blades [15,16].
Although researchers all over the world have proposed various methods to deal with WT blade failures, the challenges are still great. For example, the measurement of shaft torque needs a torque sensor, and the measurement power needs to simultaneously sample the three-phase voltage and the current of the stator, thus the calculation ability and the storage space are big challenges. The blade fault monitoring is greatly affected by the surrounding environment and working conditions. The data collected by the strain sensor are non-periodic, and it is difficult to form a unified fault diagnosis standard.
3.1.2. Pitch System and Yaw System
In order to obtain the maximum wind energy and realize the real-time tracking of wind direction, WTs are equipped with a yaw system and a pitch system. An example of energy conversion for WTs is shown in Figure 6.
The pitch system is a device to control the rotation of the blade around the hub, while the yaw system is a device to control the rotation of the nacelle around the tower [5]. The pitch system and the yaw system structures are similar to the main system of WTs, which consists of a motor, a deceleration gearbox, and a bearing. Therefore, most of the CMFD methods applied to the main drive system are applicable to the pitch system. A data-driven fault diagnosis technique is introduced to solve the pitch system fault of WTs [17]. Aiming at the special working conditions of variable speed and variable load in the pitch system, researchers proposed a gear fault diagnosis technique based on an order tracking algorithm [18]. The research on CMFD of pitch bearing with high failure rates has not been reported yet. Similar to the failure causes of the pitch system, installation misalignment, encoder failure, and lack of lubricant all could lead to yaw system failure. By using power curve copula modeling, the fault diagnosis of the pitch and the yaw system is realized [19]. There has been little research on CMFD of the yaw system until now. With the increase of WT capacity, the weight of nacelle increases, thus the research on CMFD of the yaw system deserves more attention. The problem faced by the pitch system and the yaw system is that the actual working condition is variable speed and variable load. The frequency of the fault signature in the spectrogram causes aliasing due to this special condition. The traditional steady-state analysis method is difficult to apply to this special working condition. The small space in the WT nacelle and the hub limits the installation of the sensor, thus the sensorless fault diagnosis techniques of the pitch system and the yaw system is the direction of the effort.
3.1.3. Tower
The tower is the support component of the whole nacelle. Long-term exposure to the outside world and the fluctuation of wind speed will usually affect the stability of the tower, which also threatens the stability of the upper nacelle and the blades. The vibration signals collected in the SCADA system are used to monitor the health of WT towers. Based on the data transmitted from the strain sensor directly installed on the tower, the cloud platform for wind farm O&M can monitor the subtle changes of the tower in time [20,21]. Researchers introduced the method of measuring strain and bending deformation of a WT tower based on FBG to evaluate the load on the tower in real time [22]. This method not only realizes fault diagnosis but also estimates the tower condition of WT, which greatly reduces the threshold of tower design and wind farm construction cost. Early tower failures may even lead to tower collapse if they are not detected in time when there is a strong wind. Because the collapse of towers is usually sudden, timely detection of early micro-faults is the key to CMFD of WT towers.
3.2. Mechanical Energy Subset
The mechanical energy subset includes two components, the shaft and the gearbox, which together create the tie between the wind energy and the electrical energy that can be used by human beings. Meshing and friction of mechanical components are collectively the process of transmitting energy, but once the mechanical components are subjected to more than the load they can bear, cracks and fracture will occur.
3.2.1. Shaft
Shaft is the connecting device between the hub, the gearbox, and the generator, which plays the function of energy flow transmission. The shaft constantly collides and rubs against various components during the journey of sharing energy. The change of wind speed causes the rotation speed of the shaft to follow the change, which leads to a large fluctuation of force in the transmission process and greatly increases failure rates. There are few studies on CMFD of WT shafts. By using the characteristic parameters corresponding to the faults in vibration and AE, the fault condition of the shaft is detected [23]. When the shaft is imbalanced, the load torque of the generator will fluctuate periodically. Experiments proved that load torque of the motor could be used to monitor the health of the shaft [24]. However, it should be noted that the load of the motor is greatly affected by the fluctuation of wind speed, and the diagnostic results are greatly affected by the working conditions. Similarly, acoustic signals are used to monitor the cracked shaft [25]. Generator current signals are used to monitor the misalignment of the shaft [26]. The difficulty of CMFD regarding shafts lies in the fact that shafts are usually used in conjunction with gearboxes or bearings, and it is difficult to determine the specific source of faults in actual working conditions.
3.2.2. Gearbox
A gearbox is a drivetrain device to realize speed matching between blade and generator. Due to the gears being relatively fragile and the fact that subtle faults are difficult to detect, the gearbox is considered to be the component with the highest failure rates, which often puts doubly fed induction WTs at a disadvantage when competing with permanent magnet direct drive WTs. Installation dislocation, fatigue wear, and lack of lubricant can affect the working conditions of the gearbox. Compared with the fault of the generator body, the gear fault has its own characteristics [27,28]. Because it is a drivetrain component between mechanical components and electric components, it is possible to monitor the condition based on vibration, electrical signals, AE, and temperature signal [6,29].
The influence of the torque fluctuation caused by gear failure on the stator current of the generator is analyzed. After fast Fourier transform, the fault gear can be converted into a fault sideband in the current spectrum. The fault sideband interval is .
where is the fundamental frequency, is a positive integer representing the fundamental and the possible harmonics of the current, is the rotating frequency of the th shaft in the gearbox, is the th gear meshing frequency, and and are the numbers of the shafts and the gear pairs in the gearbox, respectively. When a gear failure occurs in the drivetrain chain, the corresponding side frequency band in the spectrum will be significantly strengthened. Similar to the characteristic frequency in the current, the characteristic frequency in the vibration signal can be expressed as:
By comparing the characteristic frequencies of the current signal with those of the vibration signal, it can be found that the current signal is affected by the fundamental wave, which leads to the low SNR of the fault characteristic frequency. However, at the same time, it should be noted that the vibration signal needs to be equipped with sensors, and the sensor itself has the risk of failure. In the case of gearbox failure, noise will be generated, and friction will also lead to temperature rise. AE signal and temperature signal are also worth considering [30,31].
3.3. Electrical Energy Subset
The capture of wind energy and the transmission of mechanical energy are all for the production of electrical energy. The generator and its auxiliary power electronic devices are indispensable for the electrical energy subset. The CMFD for the electrical energy subset components determines whether a qualified electrical energy can be produced.
3.3.1. Generator
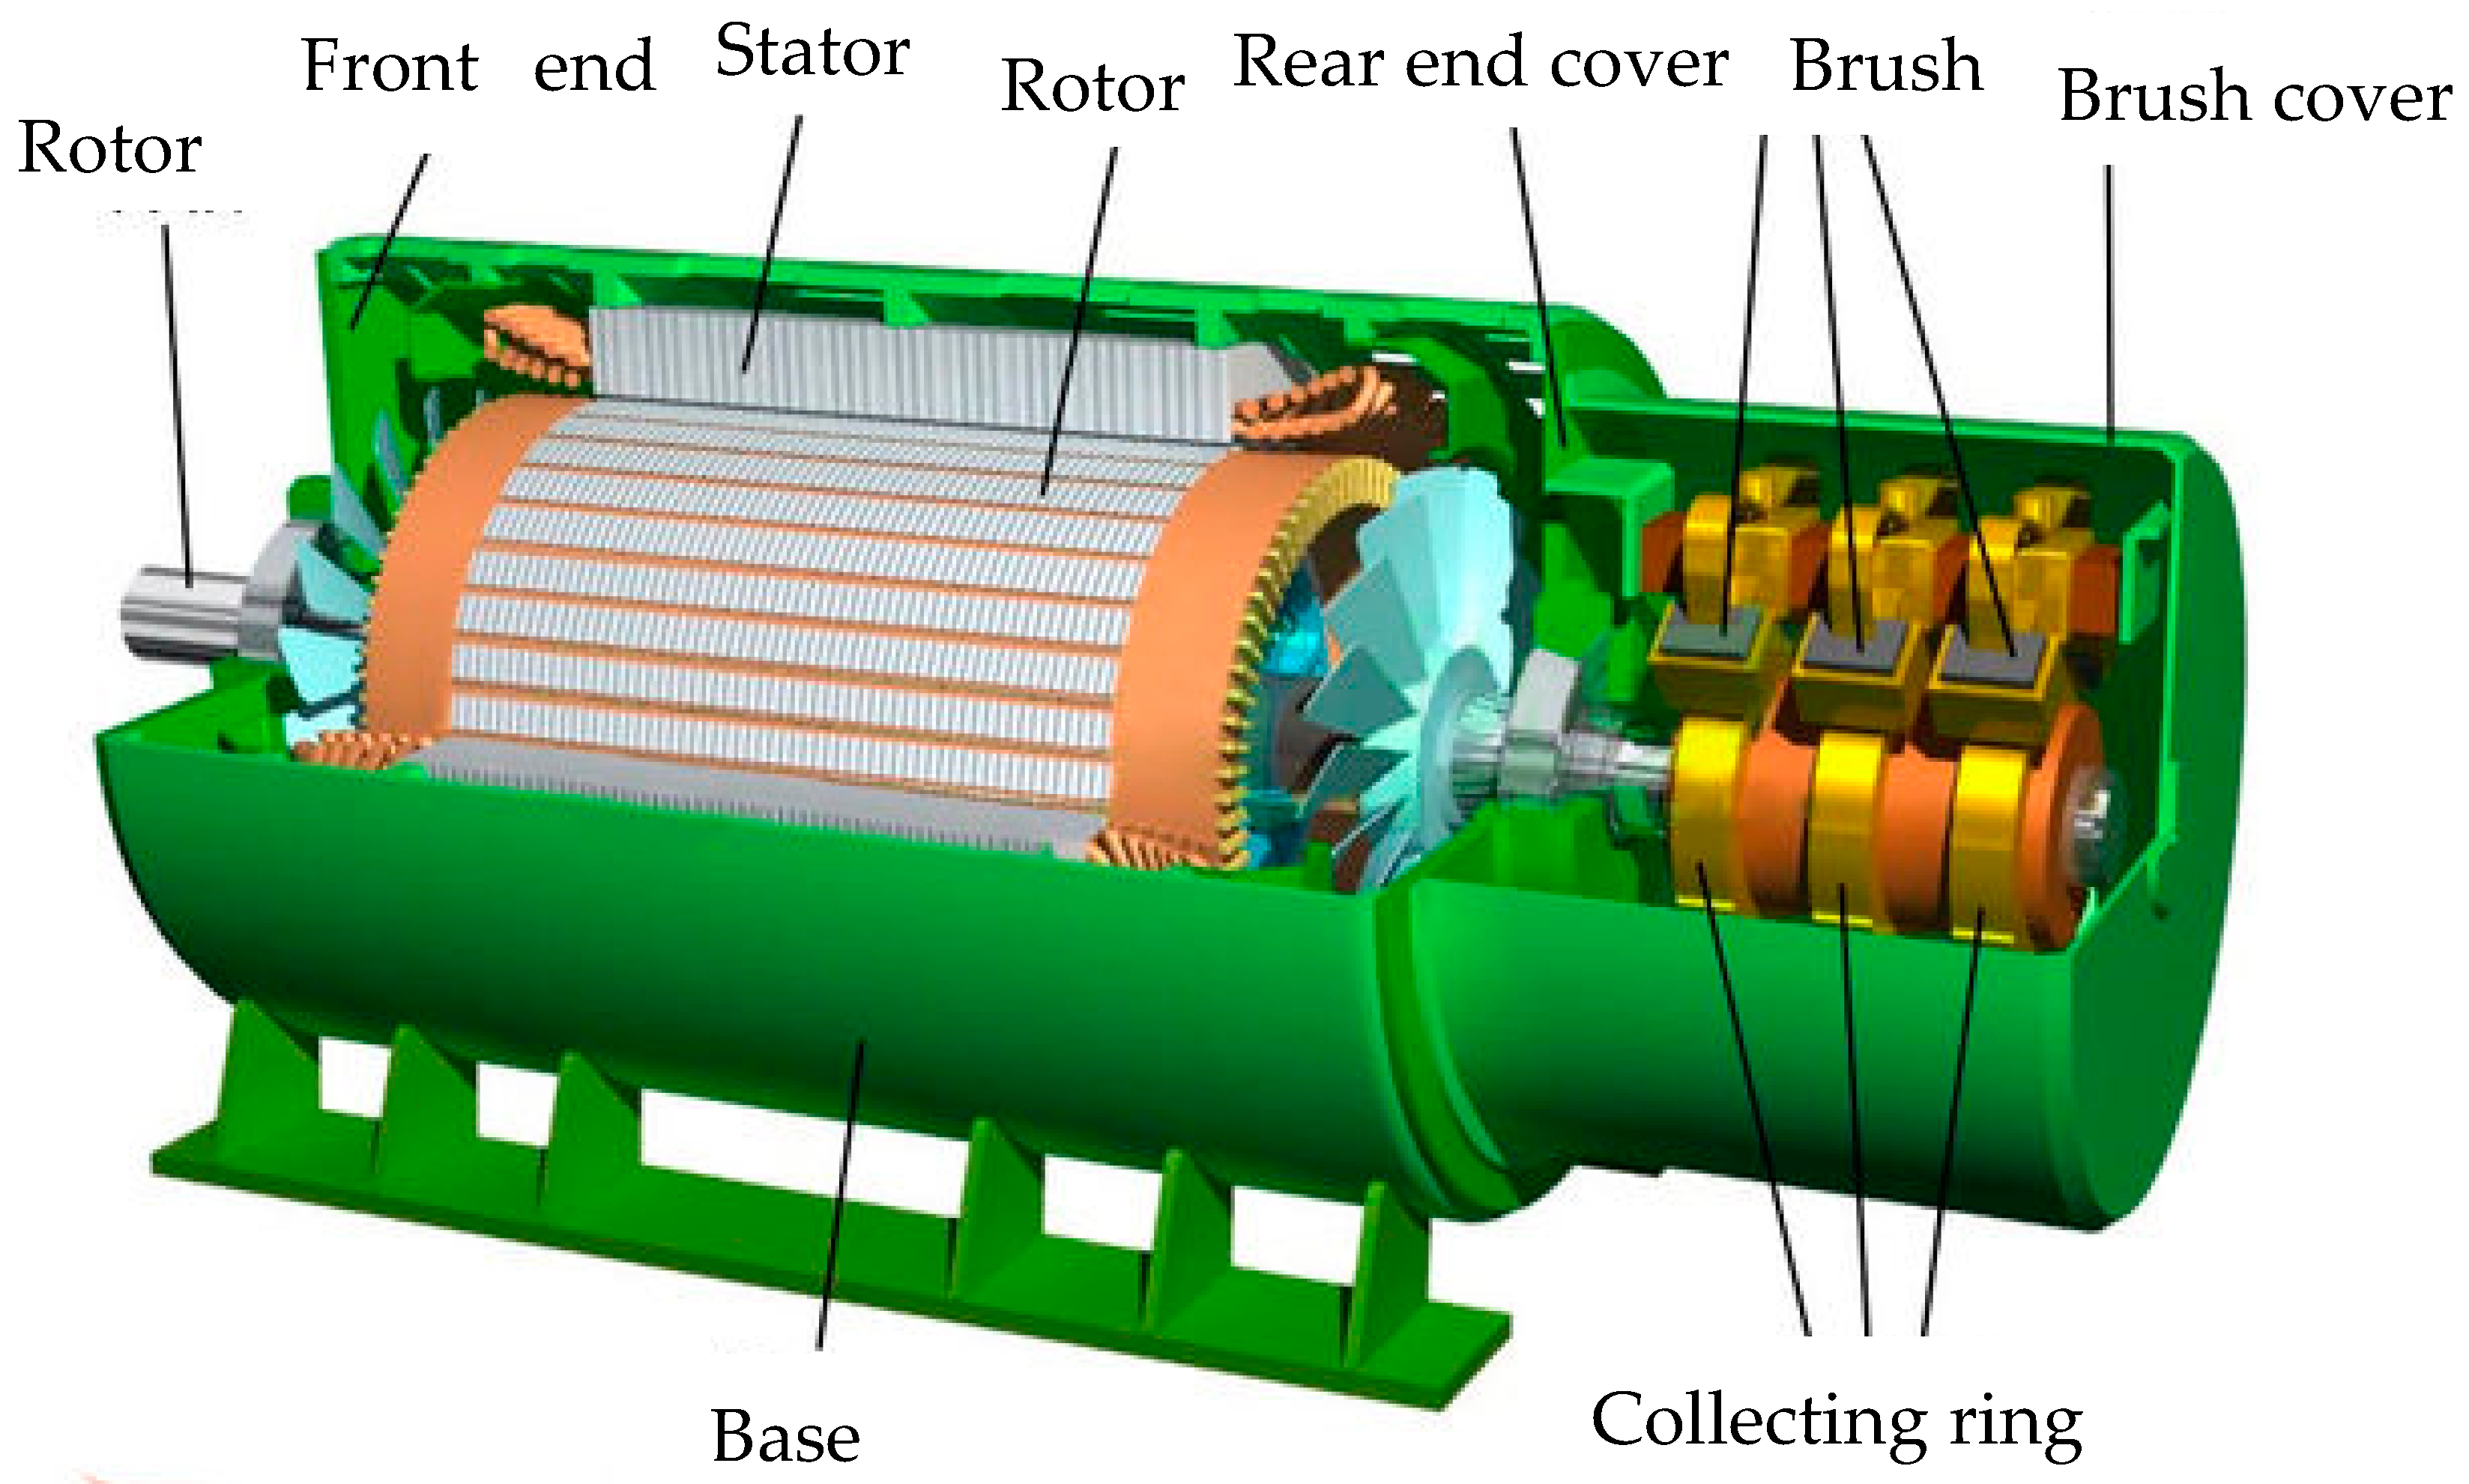
A typical WT generator is shown in Figure 7. Several surveys of fault types of induction motors, conducted by IEEE-IAS [32,33,34], EPRI [35], and Allianz [36], are compared in Table 1. Generator components can be divided into four parts: bearing, stator, rotor, and others. Because the existing WT is rarely a squirrel cage structure, the rotor fault is not considered here. The motor bearing fault and the stator inter-turn short circuit fault are selected as two typical motor faults for detailed analysis.
Generator bearings are composed of an inner ring, an outer ring, a ball, and a cage. The characteristic frequencies of each part are explained in detail elsewhere [37].
where , , , and are the fault characteristic frequencies of the outer race, the inner race, the ball, and the cage faults, respectively, is the rotational frequency of the bearing, N is the number of balls, and are the ball diameter and the ball pitch diameter, respectively, and is the ball contact angle with the races.
The CMFD of WT bearings is mainly based on vibration signals [38,39,40]. A bearing fault diagnosis technique based on electrical signals was developed recently. The stator current signal of the generator is used to monitor the WT bearing [41]. The difficulty of bearing fault diagnosis is that the bearing is composed of many parts that interact with each other. Bearing faults are often not single but are superimposed on each other, thus it is difficult to analyze the characteristic frequencies. It is also necessary to consider how to improve the SNR when using electrical signals.
Generator stator is the static part of the generator. The stator consists of three parts: stator core, stator winding, and machine base. The main function of the stator is to produce a rotating magnetic field for the pushing rotor. The stator inter-turn short circuit fault is one of the most representative stator faults. Because of the internal fault of the generator, the CMFD based on electrical signals becomes the first choice. The stator current waveform of the generator is extracted to judge whether the stator is healthy or not [42,43,44]. For example, consider that a researcher proposes the negative sequence component method to extract the characteristic parameters of stator inter-turn short circuit fault and carry out the relevant theoretical derivation [42]; another group proposes to monitor the stator winding faults of doubly fed induction WTs by using the rotor side current spectrum signal and finds the characteristic frequency, which is not affected by load conditions [43]. Stator reactive power is used to solve this problem [44]. The fault characteristic frequencies in electrical signals can be expressed by the following formula:
where is the number of pole pairs, is the fundamental frequency, and s is the slip. The stator inter-turn short-circuit fault can cause temperature rise and noise, and some literature has carried out research based on this phenomenon [45]. The difficulty of stator faults lies in how to find incipient faults and arrange scheduled maintenance.
3.3.2. Power Electronic Device
WTs are often located in a harsh environment with high temperature heating, oil and water pollution, and dust, which not only affects the performance of the power electronic device but also easily leads to device failure. Unlike the simple and reliable mechanical components discussed above, power electronic devices are more precise and fragile, and slight changes in the environment will affect the working condition [46]. Figure 8 shows the structure and the fault proportion of the power electronic device.
Power electronics devices are used to connect the power generated by DFIG to the grid [47,48]. From Figure 8, a conclusion was drawn that capacitors, printed circuit boards (PCBs), and power semiconductors [e.g., insulated gate bipolar transistor (IGBT) modules] are the three main reliability-critical components. In power electronic devices, CMFD based on vibration and AE signals is obviously not applicable. Electrical signals and temperature changes due to faults have become better choices [49,50,51]. The types of capacitor faults can be divided into numerical deviation, excessive leakage, short circuit, and even explosion. The types of PCB faults can be divided into fixed faults, bridge faults, delay faults, crosstalk faults, etc. [52]. WTs, especially permanent magnet direct drive WTs, which need full power IGBT energy change modules, call for a high reliable quality of power electronic devices. High power IGBT module failure risks are higher. The failure mechanism of an IGBT module of the converter mainly includes aluminum bond line shedding, weld layer fatigue, bond line root fracture, and aluminum oxide reconstruction [53].
In view of the severe reality of low reliability and high maintenance costs of WT power electronic devices, how to evaluate its power electronic module and how to evaluate the residual life of its power electronic module are the keys to condition-based O&M [54]. The mechanical vibration of WTs and the random fluctuation of wind speed will affect the reliability of the power electronic devices. For power electronic devices, researchers lack a deep understanding of their pre-failure aging mechanism, thus the condition monitoring technique reflecting their health level has been stagnant. At present, many engineers and designers often give priority to the reliability improvement methods, such as the crimping packaging technique, fault tolerance, and built-in redundancy, while ignoring condition monitoring as a standby option. The main principle of condition monitoring based on electrical signals is that the end characteristics of IGBT are closely related to its failure degree. A paper published by researchers shows that the three electrical parameters of gate valve voltage, transconductance, and on-voltage drop can be used as characteristic parameters of IGBT condition monitoring [55]. With the development of the power electronic power system and the deep integration of power electronics and power grids, the monitoring of power electronic devices such as converters has become increasingly prominent.
4. WT Information Flow
During the operation of WTs, there is not only the conversion of energy forms but also the transmission of information flow for O&M. The information caused by mechanical failure will be transmitted to the torque signal and the electrical signal along with the flow of energy, which is called information flow. At the same time as mechanical vibration, nonlinear changes in the parameters (such as AE and temperature) are caused, and fault diagnosis based on these signals is also a possible choice.
4.1. Strain
Strain sensor is a kind of sensor based on measuring the strain produced by the force and the deformation of the object. FBG is the most commonly used sensor. It is a kind of sensor that can transform the change of strain on mechanical components into an electrical signal. When a crack occurs in the blade or the tower, the strain sensor detects the stress change at a certain point and converts it into an electrical signal. FBG strain sensor is used to diagnose the fault of WT blades [15,16]. Relevant work describes the usage of strain sensors to detect the health of wind towers [21]. In order to ensure the safety of the tower in a wind field, the monitoring method based on the strain sensor can monitor the status of the tower in real time without excessive design margins, thus saving on construction costs [22]. For those components that are not covered by CMFD based on electrical and vibration signals, such as the blade and the tower faults, the CMFD based on strain signal becomes a better choice. However, the CMFD based on strain signal is affected by the environment and the working conditions. Other key problems are that it is difficult to establish a unified standard and there is a lack of theoretical support.
4.2. Vibration
Vibration signal is the most widely used and mature CMFD signal in the industry. After decades of development, CMFD techniques based on vibration signals have formed their own standards (ISO10816). The acceleration sensor is the most widely used vibration sensor, which converts the received acceleration signal into an electrical signal and transmits it to the data acquisition system. Sensitivity, frequency range, and test environment are all factors to be considered in selecting sensors. A scientist illustrated the gearbox fault of WTs in detail and introduced the relevant algorithms for gearbox fault in the WT industry [29]. The test of a WT drivetrain system based on the National Renewable Energy Laboratory (NREL) WT test platform was carried out completely [29]. The algorithms used include frequency domain and cepstrum analysis, time synchronization average narrowband and residual methods, and methods based on analysis and spectral kurtosis. Similarly, the health of gearboxes was evaluated based on the RMS and the peak values of vibration signals [56,57]. Researchers used a decision tree for feature selection, the optimal priority tree algorithm and the function tree for algorithm and feature classification, and subsequently proposed a better fault diagnosis algorithm for WT blades [58]. By analyzing the difference between vibration signal and other signals, a result was proposed and verified by experiment using empirical mode decomposition and wavelet transform [59]. Finally, the related work to improve the SNR was carried out. By using binary empirical mode decomposition, the SCADA system extracted the fault feature of the vibration signal to realize the fault analysis of the WT shaft [60]. Although the theory, the algorithm, and the experience of CMFD based on vibration signal are relatively mature, their shortcomings are obvious. The acquisition of vibration signals requires the installation of redundant sensors, which increases the cost and occupies the already narrow space. At the same time, the vibration signal is relatively isolated and can only be measured at a single point. It is difficult to form a comprehensive, systematic, integrated, and interactive O&M system.
4.3. Torque
When a mechanical fault occurs in a component of a WT, a periodic fluctuation of fault torque may occur on the shaft. The periodic torque fluctuation on the shaft provides the possibility of CMFD based on the torque signal. Torque signal was used to detect the blade imbalance fault of WT. Using the shaft torque observer, the healthy condition of WT was judged [61]. Analyzing the causal chain between vibration signal, torque signal, and electrical signal, researchers put forward the practical significance of using torque to monitor the fault of WTs. The limitations and the shortcomings of the torque signal have some similarities with the vibration signal. Similarly, special sensors need to be installed, which increases the cost of O&M and occupies narrow space. The bigger problem of the torque signal is affected by the normal working conditions. The proportion of fault torque is not high, thus it is difficult to detect the incipient fault. At the same time, if the voltage and the current signals are used to calculate the torque signal, the accumulative error between the signals will greatly hurt the signal accuracy. The accuracy of the torque sensor is worse than that of the vibration signal, which is the reason why the practical application of the torque signal is rare.
4.4. Temperature, Oil, and AE
When mechanical or electrical faults occur, kinetic energy and energy can be converted into heat energy, resulting in abnormal temperature rise. Therefore, monitoring temperature signal to achieve CMFD of WTs has become a choice. The non-linear relationship between temperature and faults is analyzed based on data and realizes the prediction of early faults [62,63]. The usage of the intelligent system of predictive maintenance allows the health of the WT gearbox and generator to be monitored through temperature signal [64,65]. By detecting the change of temperature signal, the misalignment of the shaft can be detected [66]. Researchers achieved non-intrusive thermal monitoring by signal injection without needing redundant thermocouples, which has a certain reference value for thermal protection of WTs [67]. The biggest challenge facing the temperature signal is that it is greatly influenced by the surrounding environment. Environmental temperature, humidity, and other conditions are obstacles to its application. How to eliminate the influence of the environment usually needs to be combined with other collected signals. How to clarify the relationship between fault signal and temperature rise and eliminate the environment is a hot research topic to be addressed in the future. Oil is used in WTs for lubrication, hydraulic pressure, etc. The monitoring of these components cannot make use of electrical signals, and there is no periodic vibration in the fault, thus it is unrealistic to use vibration signals. The monitoring of oil-related parameters has become a possible choice. Monitoring the leakage of hydraulic oil of the pitch system is a method to know its health [68]. The quality of oil is a tool to realize online monitoring of the WT gearbox [69]. Similarly, gear wear can also be known by detecting the quality of the oil [70]. By monitoring the particulate contaminated areas of lubricants, researchers were able to predict the remaining useful life of WTs [71]. The aspect that restricts monitoring based on oil signal is that oil is not widely used, and there is no uniform standard for the quality of oil. As a by-product of vibration signals, AE is also a useful method for fault prediction and diagnosis. A method for predicting the residual life of the gearbox and the shaft by combining AE with vibration signal was proposed [23]. AE can also be used to monitor the sound when the gearbox fails individually [31]. The advantage of AE is that it does not need to be close to the fault components, and it is a non-invasive methods of fault detection. At the same time, the shortcomings of AE are obvious, and the diagnosis results are greatly affected by surrounding noise. Moreover, it is difficult to determine the fault source when fault information occurs in AE. The characteristic parameters of each fault component based on AE also need to be further studied. Temperature, oil, and AE signal based CMFD of WTs are all by-products of vibration faults, thus they are classified into one category.
5. WT Algorithm Flow
The algorithm applied to CMFD of WTs is a means to improve the SNR and find fault information as soon as possible. When the monitored components are in a working state, how to eliminate the influence of operating conditions on fault information extraction and realize online monitoring requires the intervention of an algorithm. After more than a hundred years of development, researchers have proposed a variety of algorithms. Finding fault diagnosis algorithms for wind turbines is discussed in this section.
5.1. FFT and Wavelet Transform
In 1965, J. W. Cooley and J. W. Tukey proposed a fast algorithm for computing discrete Fourier transform [72]. Fast Fourier transform (FFT) greatly simplifies the calculation of discrete Fourier transform and promotes its practicality. FFT is used to analyze vibration signals to judge the main bearing faults of WTs [73]. Rotor fault is detected by FFT through the current waveform of the generator [74]. By using FFT to analyze the blade angle collected by the encoder, researchers realized the diagnosis of the blade crack fault [75]. FFT is the basis of modern signal processing. It extends the time domain signal to the frequency domain signal and analyzes the fault characteristics from another aspect. Wavelet transform is a new transform analysis method compared with FFT. It inherits and develops the idea of short-time Fourier transform localization and overcomes the shortcomings of window size not changing with frequency. It can provide a “time–frequency” window that changes with frequency. It is an ideal tool for signal time–frequency analysis and processing. Its main features are that it can fully highlight the characteristics of some aspects of the problem by transformation, can localize the time (space) frequency analysis, and can gradually refine the signal by scaling translation operation. Finally, it achieves time subdivision at high frequency and frequency subdivision at low frequency and can automatically adapt to the requirements of time–frequency signal analysis, thus focusing on arbitrary details of the signal. It solves the difficult problem of Fourier transform and has become a major breakthrough in scientific methods since Fourier transform. Wavelet transform is used to monitor generator stator winding faults and rotor imbalance faults [76]. Researchers proposed the concept of the wavelet energy transfer equation to analyze vibration signals for monitoring bearing faults [77]. The problem of wavelet transform is that the selection of wavelet bases is very difficult, and different wavelet bases have great influence on the results. At the same time, time–frequency analysis based on wavelet transform is not suitable for variable speed and variable load operation.
5.2. Order Tracking (OT)
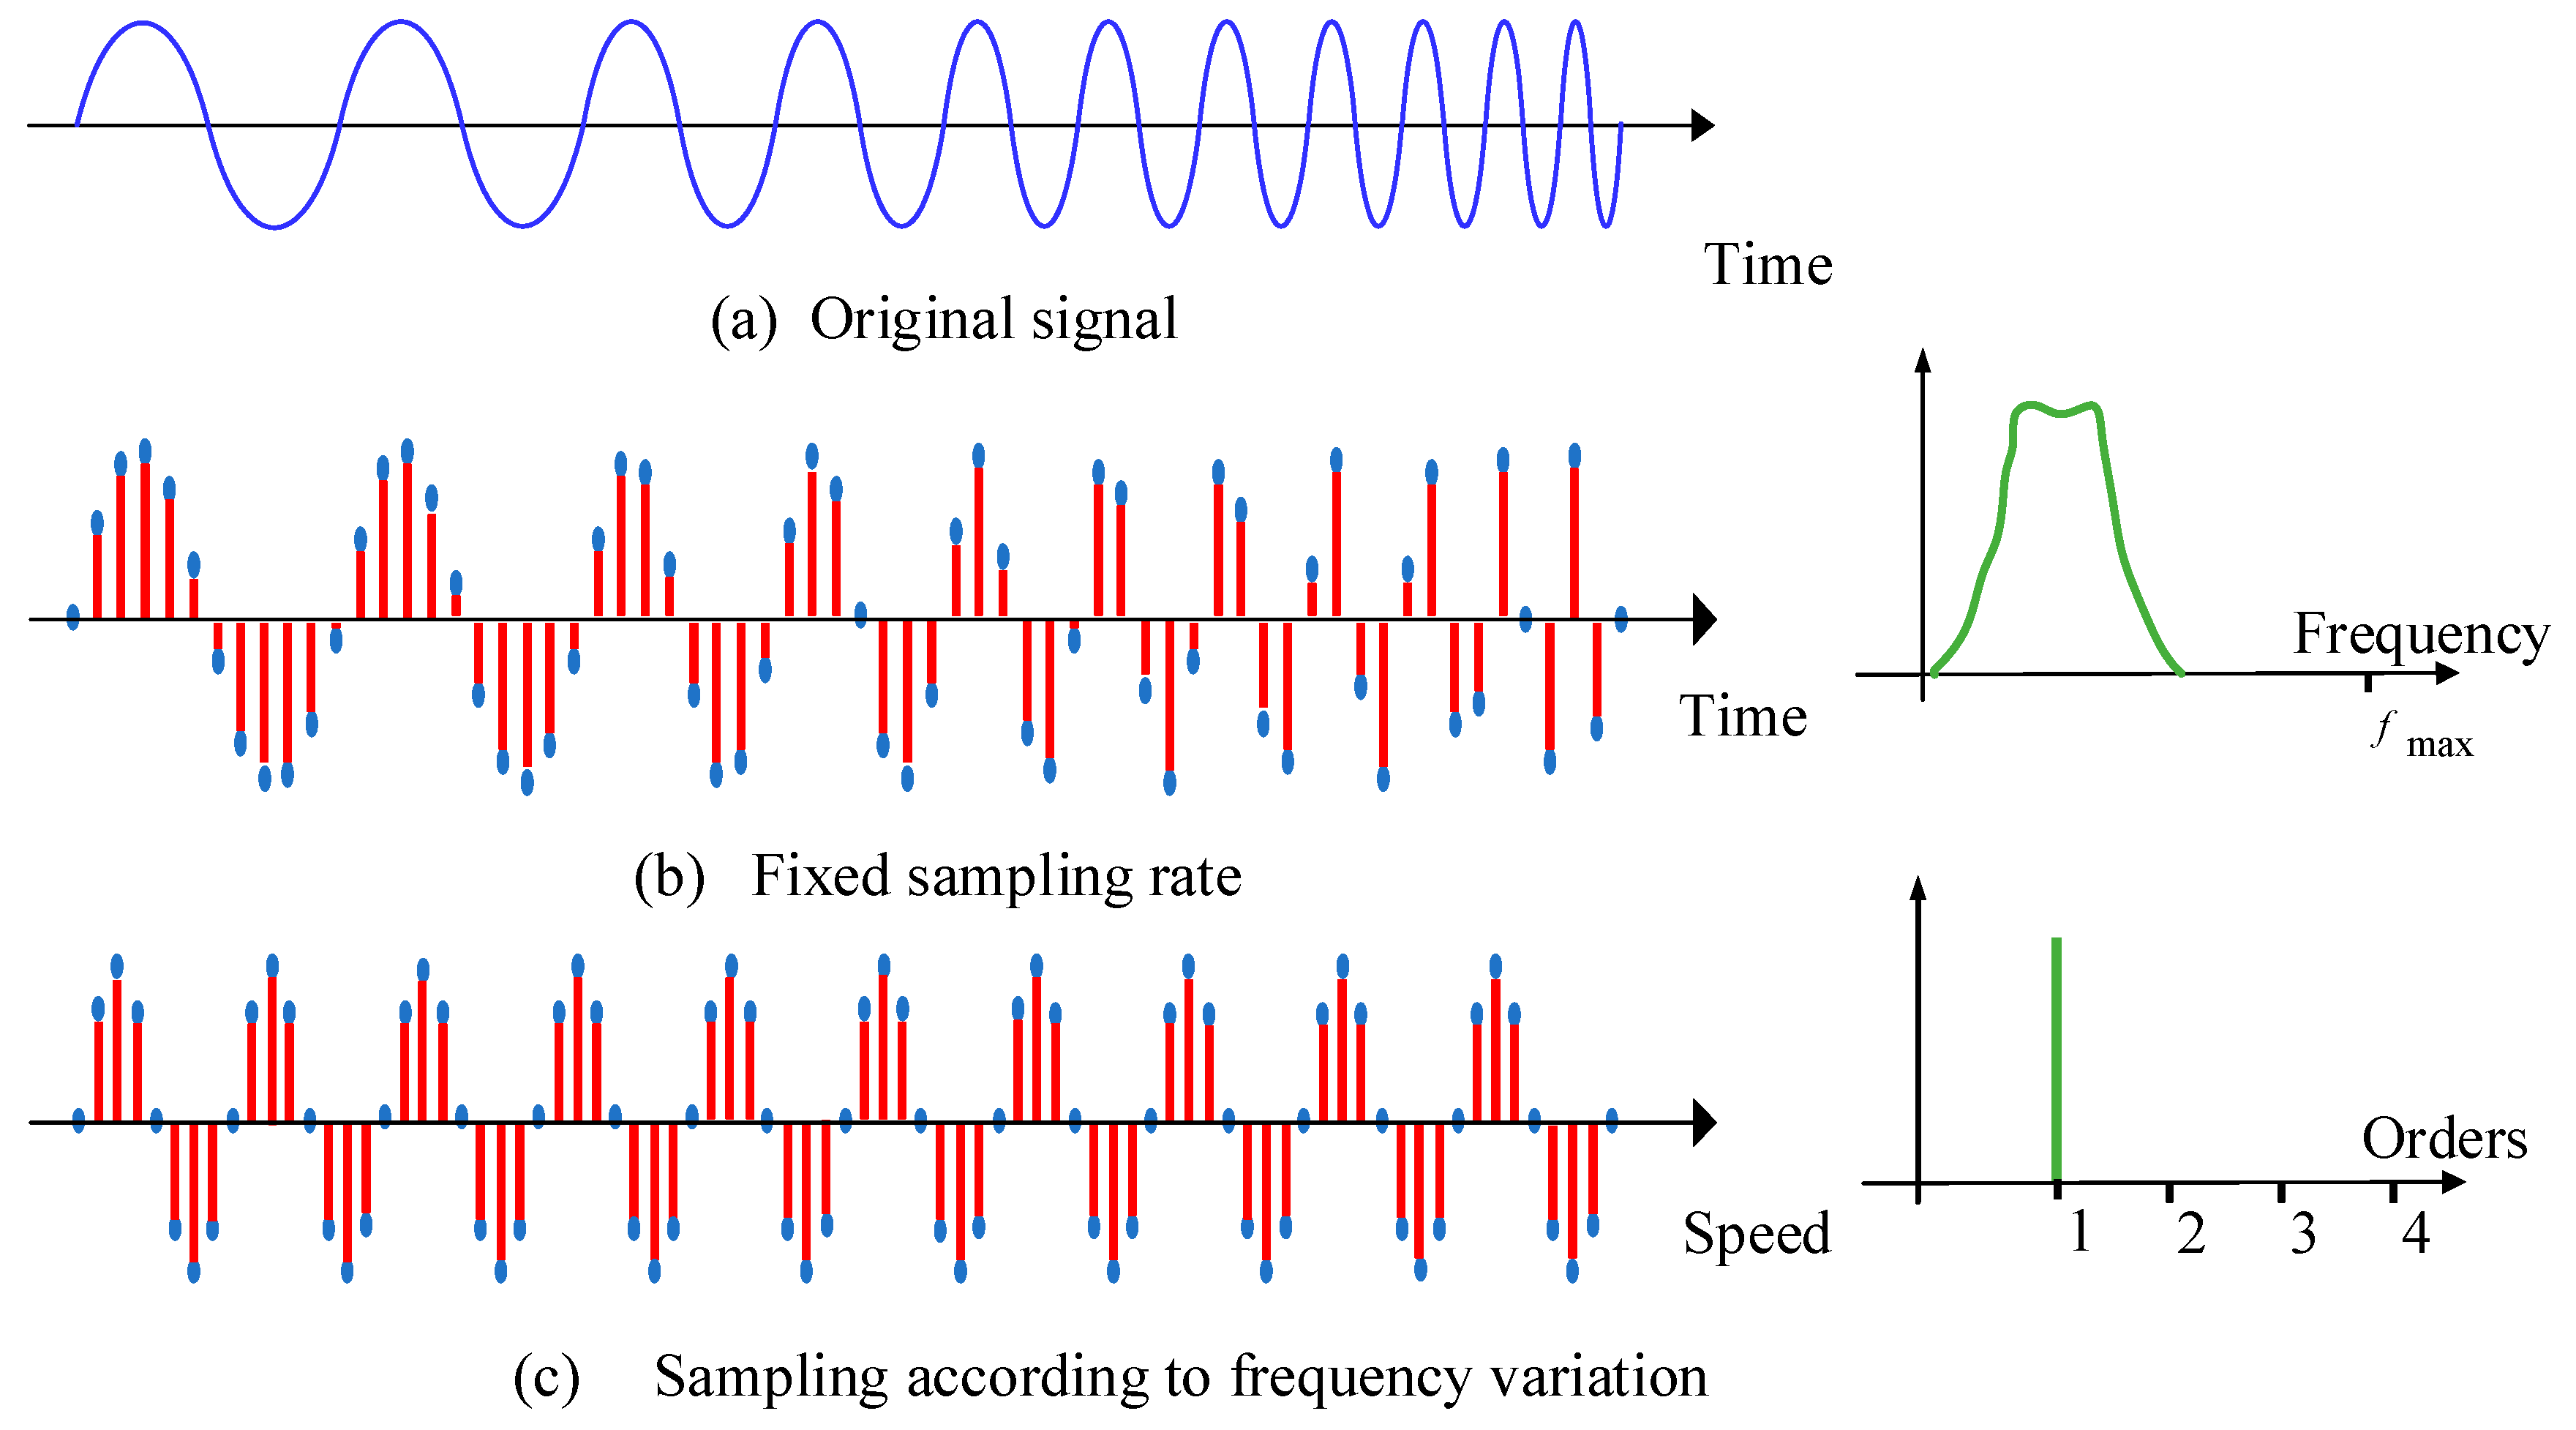
For conventional vibration, frequency is usually used to describe the number of times of vibration in a second, which is called vibration frequency. The order represents the number of times an event occurs for each rotation of a rotating component (360 degrees). We define order tracking O as:
where is the fault information carriers collected, and is the instantaneous speed of the rotating component. Because the instantaneous speed is divided in the definition, the effect of speed variation is eliminated. Order tracking (OT) transforms the time domain signal into the angle domain signal and successfully realizes the fault diagnosis under variable speed and variable load conditions. The relevant schematic diagram is shown in Figure 9 below. OT needs to use the time domain signal and the instantaneous speed signal. Current signal is used to estimate instantaneous speed for the OT algorithm [39]. Vibration signal is divided by instantaneous speed to get the order signal, which successfully solves bearing fault diagnosis. The highlight of literature [78,79,80] is that, for the first time, the concept of order tracking was introduced into the current signal, and the SNR was successfully improved by converting the current to the rotor side. The unsteady state fault diagnosis based on OT is also the focus of future research.
5.3. Artificial Intelligence (AI)
As a new hotspot, artificial intelligence (AI) has its own application in the field of CMFD of WTs. The ultimate help of big data and AI is to make the construction of a wind farm more perfect and replace possible extensive management modules with big data and AI methods. Therefore, the intelligent management of the whole life cycle digital module of a wind farm can be realized, and a wise forward operation and a wise rear operation can be realized. The health evaluation system of WTs based on an artificial intelligence algorithm was constructed [81]. Broader research of CMFD for a machine based on artificial intelligence was systematically introduced [82]. The intelligent O&M of WTs based on current signal was developed and applied to real wind farms [83]. For the fault diagnosis of WT bearing, support vector machine (SVM) can be used to predict its remaining useful life [84]. Similarly, the k-means algorithm can also be used to predict the remaining useful life of WTs [85]. Additionally, the k-nearest neighbors (kNN) algorithm has application in gearbox fault of WTs [86]. AI algorithms are just emerging, and many theories need to be studied urgently. At the same time, we need to pay attention to whether or not the research of the algorithm is flawed, and the mechanism and the reasons behind the algorithm are still worthy of our great attention.
6. Wind Farm Integrated O&M System Based on Electrical Signal
6.1. Theory Analysis
Above all, a comprehensive discussion about the techniques of CMFD of WTs based on multiple signals was carried out. It is noteworthy that they all convert fault information into electrical signals and store them in the data acquisition system. If the electrical signals can be collected directly for CMFD, additional sensors can be removed to realize CMFD of WTs without sensors. Another advantage of CMFD based on electrical signals is obvious, which is that it can realize the integration of the control system and the fault diagnosis system, reducing cost and occupy less space. Therefore, the CMFD system of WTs based on electrical signals is the goal researchers need to strive for. Especially in recent years, the rise of flexible WTs provides a broad space for integrated O&M of WTs based on electrical signals. The stator current signal of the motor is used to estimate the instantaneous mechanical speed under variable speed and variable load conditions [39]. A method of fault diagnosis of bearing based on the EEMD method using the stator current of the motor was introduced [41]. The fault of stator winding could be diagnosed by the stator current waveform signal [42]. Researchers used the rotor current signal of the motor to diagnose the inter-turn fault, eliminate the influence of the fundamental wave of the stator current, and significantly improve the SNR [43]. By reactive power monitoring, the inter-turn short circuit faults could be found [44]. A method of fault diagnosis of bearing based on current-demodulated signals was introduced [87]. Researchers collected the voltage and the current signals of generators and improved the SNR of gearbox faults by using the new algorithm [88]. As for the fault of the generator body, fault monitoring is usually carried out by using its own electrical signals. It is noteworthy that the existing monitoring of power electronic devices is mainly based on electrical signals [46,47,52].
The CMFD technique of WTs based on electrical signals is the most promising and worthy of further study. The advantages of CMFD based on electrical signals are not necessary for redundant sensors to achieve the coordination of the fault diagnosis system and the control system and multi-dimensional input to realize the mutual monitoring of sensors themselves. For the fault of the motor body, it can be monitored well because of its strong relationship with the electric signal. The results of CMFD based on electrical signals are not very good for blades and towers, which are weakly connected with electrical signals. In addition to eliminating the influence of fundamental wave by using the rotor current signal, other methods to improve the SNR by eliminating fundamental wave and clutter wave influence are also the focus of future research work. From the point of view of energy flow and information flow, potential causal chains of CMFD of WTs were revealed. Aiming at an electric signal that can realize the integration of the control system and the fault diagnosis, this paper makes a detailed analysis and elaborates upon it. The corresponding WT flow chart is shown in Figure 10. Taking energy flow, information flow and algorithm flow as the main lines, the O&M of wind farms are divided into three parts.
6.2. Experimental Setup
The theory of integrated O&M of WTs based on electrical signals was put forward, and many works in this field were carried out. Electrical signal was the only signal we needed to collect. Vibration signal was used as a comparison signal. Rogowski coils are used to collect current signals, and voltage probes are used to collect voltage signals. Relevant work proved the validity of the proposed theory as shown in Figure 11 [88]. Because the WT nacelle is tens of meters or even hundreds of meters high, coupled with the harsh environment of the wind farm, a special data acquisition (DAQ) system for such conditions has been developed. If necessary, the DAQ system can also be combined with the control system to realize on-line CMFD of WTs. Based on this, a complete integrated O&M system of wind farms based on electrical signals has been built.
In addition, we provide the safety chain of WT fault diagnosis in actual wind farms. The flow chart is shown in Figure 12.
From the figure above, we can see that the pitch system affects the safety chain of the main control system through the contact of the K4 relay in each pitch cabinet, and the safety chain of the main control system influences the pitch system through the coil of the K7 relay in each pitch cabinet. The safety chain of the pitch and the safety chain of the main control are independent and interactive. When a node in the safety chain of the main control system is disconnected, the relay-115K3 coil of the safety chain to the pitcher loses power, and its contacts are disconnected. The coil of the K7 relay in each pitch cabinet loses power, and the pitch system enters the mode of emergency shutdown. When the pitch system fails (such as loss of OK signal of pitch converter, action of 90 degree limit switch, etc.), the pitch system cuts off the power supply of the K4 relay, and the contact of the K4 relay is disconnected, which makes the relay-115K7 coil of the self-pitching safety chain lose power; consequently, its contact is disconnected, and the whole safety chain of the main control system is disconnected. At the same time, the safety chain to the pitch relay-115K3 coil loses power, thus its contact is disconnected, the coil of the K7 relay in each pitch cabinet loses power, its contact is disconnected, and the control system of the blade without fault in the pitch system enters the mode of emergency shutdown. This design makes the safety chain link, which can maximize the protection of the WT.
In the actual connection, the nodes in our security chain are not really connected in series but are connected by the relationship between “and” in the security chain module. Each input is logically high level 1. After several signals are connected, its output must be high level 1, but as long as one input signal becomes low level 0, its output must be low level 0. Logical output is actually controlled by the output module of the safety chain, which controls the -115K3 and the -106K4 relays, respectively. The input is realized by the actual switch contacts and Boolean variables in the program. The actual switching state of the switch contacts is collected by the input module of the safety chain module. The Boolean variables in the program are controlled by the program. The corresponding logic structure of the WT safety system is shown in Figure 13.
7. Conclusions and Discussion
In view of the predicament of high O&M costs of WTs, this paper comprehensively investigates the existing CMFD techniques of WTs. Especially in recent years, with the rapid development of offshore WTs, the cost of damage and replacement of important components of offshore WTs is even higher than the construction of new WTs. This paper explains the CMFD of WTs from three aspects: energy flow, information flow, and integration of the WT control system and fault diagnosis based on electrical signals. In view of the internal relationship of the WT structure, the concepts of energy flow, information flow and algorithm flow are proposed in this paper. Energy flow is a form of energy in WTs, which is divided into a subset for capturing wind energy, a subset for transferring mechanical energy, and a subset for generating electrical energy. Energy flow is the purpose and the fundamental significance of WTs. In order to realize the energy flow and the safe operation of WTs, the control and monitoring system of WTs based on information flow is indispensable. In order to improve SNR of information flow, algorithm flow is essential. A sensor is an indispensable component for acquiring information of WTs. Providing special sensors for CMFD systems is not only expensive but also takes up limited space. Therefore, a sensorless and non-intrusive WT CMFD system based on electrical signals is the direction of our efforts.
Through the above discussion, the CMFD of WTs is shown from three aspects of energy flow, information flow and algorithm flow. A CMFD system for WTs O&M based on electrical signals is proposed. The corresponding conclusions are as follows:
- Wind farms are generally located in remote areas with harsh environments. WTs have complex structures, and nacelle is difficult to access. The high failure rates of WTs call for more advanced techniques for CMFD of WTs.
- The purpose of WTs is to realize the conversion of wind energy to mechanical energy and then to electrical energy by energy flow. In order to better control and monitor the WT, the acquisition of information flow based on sensors is indispensable. In order to improve SNR of information flow, algorithm flow is essential.
- The CMFD based on electrical signals can use the signals acquired by the control system to realize sensorless CMFD of WTs and integration of control system and fault diagnosis, which is the direction of future efforts.
Author Contributions
Conceptualization, P.Z.; methodology, P.Z., D.L.; validation, D.L.; formal analysis, D.L.; investigation, P.Z., D.L.; resources, P.Z.; data curation, D.L.; writing—original draft preparation, D.L.; writing—review and editing, P.Z.
Funding
This work is funded by Beijing Municipal Natural Science Foundation (L161002) and National Natural Science Foundation of China (51822705,51777112,61703227).
Conflicts of Interest
The authors declare no conflict of interest.
References
- Sawyer, S.; Liming, Q.; Fried, L. Global Wind Report—Annual Market Update 2017. Available online: https://www.researchgate.net/publication/324966225_GLOBAL_WIND_REPORT_-_Annual_Market_Update_2017 (accessed on 4 May 2018).
- Ryan, W.; Mark, B. Wind Technologies Market Report. 2017. Available online: https://www.energy.gov/sites/prod/files/2018/08/f54/2017_wind_technologies_market_report_8.15.18.v2.pdf (accessed on 20 August 2018).
- Schlechtingen, M.; Santos, I.F.; Achiche, S. Wind turbine condition monitoring based on SCADA data using normal behavior models. Part 1: System description. Appl. Soft Comput. 2013, 13, 259–270. [Google Scholar] [CrossRef]
- Schlechtingen, M.; Santos, I.F. Wind turbine condition monitoring based on SCADA data using normal behavior models. Part 2: Application examples. Appl. Soft Comput. 2014, 14, 447–460. [Google Scholar] [CrossRef]
- Matthews, P.C.; Chen, B.; Tavner, P.J. Automated on-line fault prognosis for wind turbine pitch systems using supervisory control and data acquisition. IET Renew. Power Gener. 2015, 9, 503–513. [Google Scholar]
- Qiao, W.; Lu, D. A Survey on Wind Turbine Condition Monitoring and Fault Diagnosis—Part I: Components and Subsystems. IEEE Trans. Ind. Electron. 2015, 62, 6536–6545. [Google Scholar] [CrossRef]
- Qiao, W.; Lu, D. A Survey on Wind Turbine Condition Monitoring and Fault Diagnosis—Part II: Signals and Signal Processing Methods. IEEE Trans. Ind. Electron. 2015, 62, 6546–6557. [Google Scholar] [CrossRef]
- Zhao, M.; Jiang, D.; Li, S. Research on fault mechanism of icing of wind turbine blades. In Proceedings of the World Non-grid-connected Wind Power & Energy Conference, Nanjing, China, 24–26 September 2009. [Google Scholar]
- Ramlau, R.; Niebsch, J. Imbalance Estimation without Test Masses for Wind Turbines. J. Sol. Energy Eng. 2009, 131, 011010. [Google Scholar] [CrossRef]
- Kusnick, J.; Adams, D.E.; Griffith, D.T. Wind turbine rotor imbalance detection using nacelle and blade measurements. Wind Energy 2015, 18, 267–276. [Google Scholar] [CrossRef]
- Niebsch, J.; Ramlau, R.; Nguyen, T.T. Mass and Aerodynamic Imbalance Estimates of Wind Turbines. Energies 2010, 3, 696–710. [Google Scholar] [CrossRef] [Green Version]
- Gardels, D.J.; Qiao, W.; Gong, X. Simulation studies on imbalance faults of wind turbines. In Proceedings of the Power & Energy Society General Meeting, Providence, RI, USA, 25–29 July 2010. [Google Scholar]
- Caselitz, P.; Giebhardt, J. Rotor Condition Monitoring for Improved Operational Safety of Offshore Wind Energy Converters. J. Sol. Energy Eng. 2005, 127, 445–447. [Google Scholar] [CrossRef]
- Gong, X.; Qiao, W. Simulation investigation of wind turbine imbalance faults. In Proceedings of the International Conference on Power System Technology, Hangzhou, China, 24–28 October 2010. [Google Scholar]
- Rubert, T.; Perry, M.; Fusiek, G. Field demonstration of real-time wind turbine foundation strain monitoring. Sensors 2018, 18, 97. [Google Scholar] [CrossRef] [PubMed]
- Arsenault, T.J.; Achuthan, A.; Marzocca, P. Development of a FBG based distributed strain sensor system for wind turbine structural health monitoring. Smart Mater. Struct. 2013, 22, 075027. [Google Scholar] [CrossRef]
- Kusiak, A.; Verma, A. A data-driven approach for monitoring blade pitch faults in wind turbines. IEEE Trans. Sustain. Energy 2011, 2, 87–96. [Google Scholar] [CrossRef]
- Lu, D.; Zhang, P. MCSA-based Fault Diagnosis Technology for Motor Drivetrains. In Proceedings of the 2018 IEEE International Power Electronics and Application Conference and Exposition (PEAC), Shenzhen, China, 4–7 November 2018. [Google Scholar]
- Gill, S.; Stephen, B.; Galloway, S. Wind Turbine Condition Assessment through Power Curve Copula Modeling. IEEE Trans. Sustain. Energy 2012, 3, 94–101. [Google Scholar] [CrossRef]
- Guo, P.; Xu, M.; Bai, N. Wind turbine tower vibration modeling and monitoring driven by SCADA data. Zhongguo Dianji Gongcheng Xuebao/Proc. Chin. Soc. Electr. Eng. 2013, 33, 128–135. [Google Scholar]
- Benedetti, M.; Fontanari, V.; Zonta, D. Structural health monitoring of wind towers: Remote damage detection using strain sensors. Smart Mater. Struct. 2011, 20, 055009. [Google Scholar] [CrossRef]
- Bang, H.J.; Kim, H.I.; Lee, K.S. Measurement of strain and bending deflection of a wind turbine tower using arrayed FBG sensors. Int. J. Precis. Eng. Manuf. 2012, 13, 2121–2126. [Google Scholar] [CrossRef]
- Soua, S.; Van Lieshout, P.; Perera, A. Determination of the combined vibrational and acoustic emission signature of a wind turbine gearbox and generator shaft in service as a pre-requisite for effective condition monitoring. Renew. Energy 2013, 51, 175–181. [Google Scholar] [CrossRef] [Green Version]
- Wilkinson, M.R.; Spinato, F.; Tavner, P.J. Condition Monitoring of Generators & Other Subassemblies in Wind Turbine Drive Trains. In Proceedings of the IEEE International Symposium on Diagnostics for Electric Machines, Cracow, Poland, 6–8 September 2007. [Google Scholar]
- Eftekharnejad, B.; Addali, A.; Mba, D. Shaft crack diagnostics in a gearbox. Appl. Acoust. 2012, 73, 723–733. [Google Scholar] [CrossRef]
- Abusaad, S.; Benghozzi, A.; Smith, A. The Detection of Shaft Misalignments Using Motor Current Signals from a Sensorless Variable Speed Drive. Mech. Mach. Sci. 2014, 23, 173–182. [Google Scholar]
- Nie, M.; Wang, L. Review of Condition Monitoring and Fault Diagnosis Technologies for Wind Turbine Gearbox. Procedia CIRP 2013, 11, 287–290. [Google Scholar] [CrossRef] [Green Version]
- Feng, Y.; Qiu, Y.; Crabtree, C.J. Monitoring wind turbine gearboxes. Wind Energy 2013, 16, 728–740. [Google Scholar] [CrossRef]
- Sheng, S. Wind Turbine Gearbox Condition Monitoring Round Robin Study—Vibration Analysis. Off. Sci. Tech. Inf. Tech. Rep. 2012, 68, 856–860. [Google Scholar]
- Zhong, X.Y.; Zeng, L.C.; Zhao, C.H. Research of Condition Monitoring and Fault Diagnosis Techniques for Wind Turbine Gearbox. Appl. Mech. Mater. 2012, 197, 206–210. [Google Scholar] [CrossRef]
- Qin, H.W.; Cao, F.C.; Fan, Q.Y. Use of AE Testing Data for Condition Monitoring in Wind Turbine Gearbox. Adv. Mater. Res. 2014, 1070, 1893–1897. [Google Scholar] [CrossRef]
- Bell, R.N.; Mcwilliams, D.W.; O’Donnell, P. Report of Large Motor Reliability Survey of Industrial and Commercial Installations, Part I. IEEE Trans. Ind. Appl. 1985, 4, 853–864. [Google Scholar]
- Bell, R.N.; Mcwilliams, D.W.; O’Donnell, P. Report of Large Motor Reliability Survey of Industrial and Commercial Installations, Part II. IEEE Trans. Ind. Appl. 1985, 4, 865–872. [Google Scholar]
- Bell, R.N.; Mcwilliams, D.W.; O’Donnell, P. Report of Large Motor Reliability Survey of Industrial and Commercial Installations, Part III. IEEE Trans. Ind. Appl. 1987, 23, 153–158. [Google Scholar]
- Albrecht, P.F.; Appiarius, J.C.; Mccoy, R.M. Assessment of the Reliability of Motors in Utility Applications —Updated. IEEE Trans. Energy Convers. 1986, 1, 39–46. [Google Scholar] [CrossRef]
- Zhang, P.; Du, Y.; Habetler, T.G. A Survey of Condition Monitoring and Protection Methods for Medium-Voltage Induction Motors. IEEE Trans. Ind. Appl. 2011, 47, 34–46. [Google Scholar] [CrossRef]
- Zarei, J.; Poshtan, J. Bearing fault detection using wavelet packet transform of induction motor stator current. Tribol. Int. 2007, 40, 763–769. [Google Scholar] [CrossRef]
- Chen, J.; Pan, J.; Li, Z. Generator bearing fault diagnosis for wind turbine via empirical wavelet transform using measured vibration signals. Renew. Energy 2016, 89, 80–92. [Google Scholar] [CrossRef]
- Wang, J.; Peng, Y.; Qiao, W. Current-Aided Order Tracking of Vibration Signals for Bearing Fault Diagnosis of Direct-Drive Wind Turbines. IEEE Trans. Ind. Electron. 2016, 63, 6336–6346. [Google Scholar] [CrossRef]
- Yang, B.; Liu, R.; Chen, X. Fault Diagnosis for Wind Turbine Generator Bearing via Sparse Representation and Shift-invariant K-SVD. IEEE Trans. Ind. Inform. 2017, 13, 1321–1331. [Google Scholar] [CrossRef]
- Amirat, Y.; Choqueuse, V.; Benbouzid, M. EEMD-based wind turbine bearing failure detection using the generator stator current homopolar component. Mech. Syst. Signal Process. 2013, 41, 667–678. [Google Scholar] [CrossRef] [Green Version]
- Wang, L.; Zhao, Y.; Jia, W. Fault diagnosis based on current signature analysis for stator winding of Doubly Fed Induction Generator in wind turbine. In Proceedings of the International Symposium on Electrical Insulating Materials, Niigata, Japan, 1–5 June 2014. [Google Scholar]
- Shah, D.; Nandi, S.; Neti, P. Stator-Interturn-Fault Detection of Doubly Fed Induction Generators Using Rotor-Current and Search-Coil-Voltage Signature Analysis. IEEE Trans. Ind. Appl. 2008, 45, 1831–1842. [Google Scholar] [CrossRef]
- Abadi, M.B.; Cruz, S.M.A.; Gonçalves, A.P. Inter-turn fault detection in doubly-fed induction generators for wind turbine applications using the stator reactive power analysis. In Proceedings of the Renewable Power Generation Conference (RPG 2014), Naples, Italy, 24–25 September 2014. [Google Scholar]
- Zaher, A.; Mcarthur, S.D.J.; Infield, D.G. Online wind turbine fault detection through automated SCADA data analysis. Wind Energy 2009, 12, 574–593. [Google Scholar] [CrossRef]
- Ma, K.; Yang, Y.; Wang, H.; Blaabjerg, F. Design for reliability of power electronics in renewable energy systems. In Use, Operation and Maintenance of Renewable Energy Systems; Springer: Cham, Switzerland, 2014; pp. 295–338. [Google Scholar]
- Lu, B.; Sharma, S.K. A Literature Review of IGBT Fault Diagnostic and Protection Methods for Power Inverters. IEEE Trans. Ind. Appl. 2009, 45, 1770–1777. [Google Scholar]
- Avenas, Y.; Dupont, L.; Baker, N. Condition Monitoring: A Decade of Proposed Techniques. IEEE Ind. Electron. Mag. 2015, 9, 22–36. [Google Scholar] [CrossRef]
- Yang, S.; Xiang, D.; Bryant., A. Condition Monitoring for Device Reliability in Power Electronic Converters: A Review. IEEE Trans. Power Electron. 2010, 25, 2734–2752. [Google Scholar] [CrossRef]
- Xue, S.; Quan, Z.; Jian, L. Reliability evaluation for the DC-link capacitor considering mission profiles in wind power converter. In Proceedings of the IEEE International Conference on High Voltage Engineering & Application, Chengdu, China, 19–22 September 2016. [Google Scholar]
- Boettcher, M.; Reese, J.; Fuchs, F.W. Reliability comparison of fault-tolerant 3L-NPC based converter topologies for application in wind turbine systems. In Proceedings of the IECON 2013—39th Annual Conference of the IEEE Industrial Electronics Society, Vienna, Austria, 10–13 November 2013. [Google Scholar]
- Ghimire, P.; de Vega, A.R.; Beczkowski, S. Improving power converter reliability: Online monitoring of high-power IGBT modules. IEEE Ind. Electron. Mag. 2014, 8, 40–50. [Google Scholar] [CrossRef]
- Patil, N.; Das, D.; Goebel, K. Identification of failure precursor parameters for Insulated Gate Bipolar Transistors (IGBTs). In Proceedings of the International Conference on Prognostics & Health Management, Denver, CO, USA, 6–9 October 2008. [Google Scholar]
- Yang, L.; Agyakwa, P.A.; Johnson, C.M. Physics-of-Failure Lifetime Prediction Models for Wire Bond Interconnects in Power Electronic Modules. IEEE Trans. Device Mater. Reliab. 2013, 13, 9–17. [Google Scholar] [CrossRef]
- Xiang, D.; Ran, L.; Tavner, P. Condition monitoring power module solder fatigue using inverter harmonic identification. IEEE Trans. Power Electron. 2011, 27, 235–247. [Google Scholar] [CrossRef]
- Siegel, D.; Zhao, W.; Lapira, E. A comparative study on vibration-based condition monitoring algorithms for wind turbine drive trains. Wind Energy 2014, 17, 695–714. [Google Scholar] [CrossRef]
- Igba, J.; Alemzadeh, K.; Durugbo, C. Analysing RMS and peak values of vibration signals for condition monitoring of wind turbine gearboxes. Renew. Energy 2016, 91, 90–106. [Google Scholar] [CrossRef] [Green Version]
- Joshuva, A.; Sugumaran, V. A data driven approach for condition monitoring of wind turbine blade using vibration signals through best-first tree algorithm and functional trees algorithm: A comparative study. ISA Trans. 2017, 67, 160–172. [Google Scholar] [CrossRef] [PubMed]
- Abouhnik, A.A. An Investigation into Vibration Based Techniques for Wind Turbine Blades Condition Monitoring; Manchester Metropolitan University: Manchester, UK, 2014. [Google Scholar]
- Yang, W.; Court, R.; Tavner, P.J. Bivariate empirical mode decomposition and its contribution to wind turbine condition monitoring. J. Sound Vib. 2011, 330, 3766–3782. [Google Scholar] [CrossRef]
- Perišić, N.; Kirkegaard, P.H.; Pedersen, B.J. Cost-effective shaft torque observer for condition monitoring of wind turbines. Wind Energy 2015, 18, 1–19. [Google Scholar] [CrossRef]
- Gong, X. Online Nonintrusive Condition Monitoring and Fault Detection for Wind Turbines; University of Nebraska Lincoln: Lincoln, Nebraska, 2012. [Google Scholar]
- Guo, P.; Infield, D.; Yang, X. Wind Turbine Generator Condition-Monitoring Using Temperature Trend Analysis. IEEE Trans. Sustain. Energy 2011, 3, 124–133. [Google Scholar] [CrossRef]
- Garcia, M.C.; Sanz-Bobi, M.A.; Pico, J.D. SIMAP: Intelligent System for Predictive Maintenance: Application to the health condition monitoring of a wind turbine gearbox. Comput. Ind. 2006, 57, 552–568. [Google Scholar] [CrossRef]
- Abdusamad, K.B.; Gao, D.W.; Muljadi, E. A condition monitoring system for wind turbine generator temperature by applying multiple linear regression model. In Proceedings of the North American Power Symposium, Manhattan, KS, USA, 22–24 September 2013. [Google Scholar]
- Tonks, O.; Wang, Q. The detection of wind turbine shaft misalignment using temperature monitoring. CIRP J. Manuf. Sci. Technol. 2017, 17, 71–79. [Google Scholar] [CrossRef] [Green Version]
- Cheng, S.; Du, Y.; Restrepo, J.A. A Nonintrusive Thermal Monitoring Method for Induction Motors Fed by Closed-Loop Inverter Drives. IEEE Trans. Power Electron. 2012, 27, 4122–4131. [Google Scholar] [CrossRef]
- Wu, X.; Li, Y.; Li, F. Adaptive Estimation-Based Leakage Detection for a Wind Turbine Hydraulic Pitching System. IEEE-ASME Trans. Mechatron. 2015, 17, 907–914. [Google Scholar] [CrossRef]
- Coronado, D.; Kupferschmidt, C. Assessment and Validation of Oil Sensor Systems for On-line Oil Condition Monitoring of Wind Turbine Gearboxes. Procedia Technol. 2014, 15, 748–755. [Google Scholar] [CrossRef]
- Sheng, S. Monitoring of Wind Turbine Gearbox Condition through Oil and Wear Debris Analysis: A Full-Scale Testing Perspective. Tribol. Trans. 2015, 59, 149–162. [Google Scholar] [CrossRef]
- Zhu, J.; Yoon, J.M.; He, D. Online particle-contaminated lubrication oil condition monitoring and remaining useful life prediction for wind turbines. Wind Energy 2015, 18, 1131–1149. [Google Scholar] [CrossRef]
- Cooley, J.W. An Algorithm for the machine calculation of complex Fourier series. Math. Comput. 1965, 19, 297–301. [Google Scholar] [CrossRef]
- Bodla, M.K.; Malik, S.M.; Rasheed, M.T. Logistic regression and feature extraction based fault diagnosis of main bearing of wind turbines. In Proceedings of the 2016 IEEE 11th Conference on Industrial Electronics and Applications (ICIEA), Hefei, China, 5–7 June 2016. [Google Scholar]
- Ibrahim, R.; Watson, S.J. Advanced Algorithms for Wind Turbine Condition Monitoring and Fault Diagnosis. In Proceedings of the Windeurope Summit, Hamburg, Germany, 27–29 September 2016. [Google Scholar]
- Lee, J.K.; Park, J.Y.; Oh, K.Y. Transformation algorithm of wind turbine blade moment signals for blade condition monitoring. Renew. Energy 2015, 79, 209–218. [Google Scholar] [CrossRef]
- Yang, W.; Tavner, P.J.; Wilkinson, M. Condition monitoring and fault diagnosis of a wind turbine with a synchronous generator using wavelet transforms. In Proceedings of the 2008 4th IET Conference on Power Electronics, Machines and Drives, York, UK, 2–4 April 2008. [Google Scholar]
- Zhang, L.; Lang, Z.Q. Wavelet Energy Transmissibility Function and its Application to Wind Turbine Bearing Condition Monitoring. IEEE Trans. Sustain. Energy 2018, 9, 1833–1843. [Google Scholar] [CrossRef]
- Sapenabano, A.; Pinedasanchez, M.; PuchePanadero, R. Harmonic Order Tracking Analysis: A Novel Method for Fault Diagnosis in Induction Machines. IEEE Trans. Energy Convers. 2015, 30, 833–841. [Google Scholar] [CrossRef] [Green Version]
- Sapena-Bano, A.; Riera-Guasp, M.; Puche-Panadero, R. Harmonic Order Tracking Analysis: A Speed-Sensorless Method for Condition Monitoring of Wound Rotor Induction Generators. IEEE Trans. Ind. Appl. 2016, 52, 4719–4729. [Google Scholar] [CrossRef]
- Sapena-Bano, A.; Burriel-Valencia, J.; Pineda-Sanchez, M. The Harmonic Order Tracking Analysis Method for the Fault Diagnosis in Induction Motors under Time-Varying Conditions. IEEE Trans. Energy Convers. 2017, 32, 244–256. [Google Scholar] [CrossRef]
- Morshedizadeh, M. Condition Monitoring of Wind Turbines Using Intelligent Machine Learning Techniques; University of Hawai’i at Manoa: Honolulu, Hawaii, 2017. [Google Scholar]
- Ali, Y.H. Artificial Intelligence Application in Machine Condition Monitoring and Fault Diagnosis Artificial Intelligence-Emerging Trends and Applications; IntechOpen: Mosul, Iraq, 2018. [Google Scholar]
- Pattison, D.; Segovia Garcia, M.; Xie, W. Intelligent integrated maintenance for wind power generation. Wind Energy 2016, 19, 547–562. [Google Scholar] [CrossRef]
- Cheng, F.Z.; Qu, L.Y.; Qiao, W.; Hao, L. Enhanced Particle Filtering for Bearing Remaining Useful Life Prediction of Wind Turbine Drivetrain Gearboxes. IEEE Trans. Ind. Electron. 2019, 66, 4738–4748. [Google Scholar] [CrossRef]
- Durbhaka, G.K.; Selvaraj, B. Predictive maintenance for wind turbine diagnostics using vibration signal analysis based on collaborative recommendation approach. In Proceedings of the 2016 International Conference on Advances in Computing, Communications and Informatics (ICACCI), Jaipur, India, 21–24 September 2016. [Google Scholar]
- Lin, D.F.; Chen, P.H.; Williams, M. Measurement and Analysis of Current Signals for Gearbox Fault Recognition of Wind Turbine. Meas. Sci. Rev. 2013, 13, 89–93. [Google Scholar] [CrossRef]
- Gong, X.; Qiao, W. Bearing fault diagnosis for direct-drive wind turbines via current-demodulated signals. IEEE Trans. Ind. Electron. 2013, 60, 3419–3428. [Google Scholar] [CrossRef]
- Zhang, P.; Neti, P. Detection of Gearbox Bearing Defects Using Electrical Signature Analysis for Doubly Fed Wind Generators. IEEE Trans. Ind. Appl. 2014, 51, 2195–2200. [Google Scholar] [CrossRef]
Figure 1.
Annual and cumulative growth in USA wind power capacity [1].
Figure 1.
Annual and cumulative growth in USA wind power capacity [1].

Figure 2.
Annual and cumulative growth in USA wind power capacity [2].
Figure 2.
Annual and cumulative growth in USA wind power capacity [2].

Figure 3.
Doubly fed induction generator (DFIG).

Figure 4.
Permanent magnet synchronous generator (PMSG).

Figure 5.
Annual failure rate and downtime per failure for surveyed wind farms in Europe [5].
Figure 5.
Annual failure rate and downtime per failure for surveyed wind farms in Europe [5].

Figure 6.
Energy conversion of WTs

Figure 7.
Typical WT generator structure.

Figure 8.
WT power electronic device and fault proportion.

Figure 9.
OT equal angular interval sampling.

Figure 10.
WT causal chains and monitoring components.

Figure 11.
Typical electrical CMFD system for the WT gearbox.

Figure 12.
WT causal chains and monitoring components.

Figure 13.
Logic structure of the WT safety system.


Table 1.
Percentage of failure by component in induction motor.
| Major Components | IEEE-IAS % of Failures | EPRI % of Failures | Allianz % of Failures |
|---|---|---|---|
| Bearing related | 44 | 41 | 13 |
| Stator related | 26 | 36 | 66 |
| Rotor related | 8 | 9 | 13 |
| Others | 22 | 14 | 8 |
© 2019 by the authors. Licensee MDPI, Basel, Switzerland. This article is an open access article distributed under the terms and conditions of the Creative Commons Attribution (CC BY) license (http://creativecommons.org/licenses/by/4.0/).
Share and Cite
MDPI and ACS Style
Zhang, P.; Lu, D. A Survey of Condition Monitoring and Fault Diagnosis toward Integrated O&M for Wind Turbines. Energies 2019, 12, 2801. https://doi.org/10.3390/en12142801
AMA Style
Zhang P, Lu D. A Survey of Condition Monitoring and Fault Diagnosis toward Integrated O&M for Wind Turbines. Energies. 2019; 12(14):2801. https://doi.org/10.3390/en12142801
Chicago/Turabian StyleZhang, Pinjia, and Delong Lu. 2019. "A Survey of Condition Monitoring and Fault Diagnosis toward Integrated O&M for Wind Turbines" Energies 12, no. 14: 2801. https://doi.org/10.3390/en12142801
Note that from the first issue of 2016, this journal uses article numbers instead of page numbers. See further details here.