Effects of Two-Stage Operation on Stability and Efficiency in Co-Digestion of Food Waste and Waste Activated Sludge

1
School of Environmental Science and Engineering, Tianjin University, Tianjin 300350, China
2
College of Engineering and Technology, Tianjin Agricultural University, Tianjin 300384, China
*
Authors to whom correspondence should be addressed.
Energies 2019, 12(14), 2748; https://doi.org/10.3390/en12142748
Submission received: 19 June 2019
/
Revised: 13 July 2019
/
Accepted: 15 July 2019
/
Published: 18 July 2019
(This article belongs to the Special Issue Anaerobic Digestion for the Production of Energy and Chemicals)
Abstract
:The two-stage anaerobic digestion (AD) technology attracts increasing attention due to its ability to collect both hydrogen and methane. A two-stage AD system feeding with food waste and waste activated sludge was investigated in order to achieve higher energy yield and organics removal. The two-stage process consists of a thermophilic H2-reactor and a mesophilic CH4-reactor, achieved the highest hydrogen and methane yields of 76.8 mL/g-VS and 147.6 mL/g-VS at hydraulic retention times (HRTs) of 0.8 d and 6 d, respectively. The co-digestion process in this study required much less external alkalinity to maintain the pH values than sole food waste digestion in the literature. Compared with the single-stage mesophilic methane AD process, the two-stage AD system had better performance on operation stability, biogas and energy yields, organics removal and chemical oxygen demand (COD) conversion at high organic loading rates (OLRs). According to the TA-cloning analysis, the dominant bacteria in H2-reactor was closely related to Clostridium sp. strain Z6 and species Thermoanaerobacterium thermosaccharolyticum. The dominant methanogens in two-stage and single-stage CH4-reactor were recognized as acetotrophic methanogens and hydrogenotrophic methanogens, respectively. The presence of the genus Nitrososphaera in the two CH4-reactors might contribute to the low NH4+-N concentration in digestate and low CO2 content in biogas.
1. Introduction
Anaerobic digestion (AD) is an effective technology for waste activated sludge (WAS) treatment and biogas production [1]. However, the WAS has low carbon/nitrogen ratio (C/N), which could limit biogas production. Food waste (FW) contains a great amount of easily-degradable carbohydrate, which was commonly mixed with WAS in the co-digestion process and the improvement of fermentation efficiency had been proven [2]. Generally, the digester for methane production was supposed to be stable when the total volatile fatty acid (TVFA)/alkalinity ratio was lower than 0.4 [3,4,5], it was found that the TVFA/alkalinity was 0.32–0.35 and 0.59 for the co-digestion process and sole FW digestion, respectively [6]. Therefore, the stable operation is easy to achieve by co-digestion of FW and WAS.
Many studies focused on methane production by single-stage AD process from co-digestion of WAS and FW [3,4,7,8], and the on-sit pilot-scale co-digestion system is reported [6]. Besides, the two-stage AD process with separated hydrogen and methane production in semi-continuous mode was also investigated in some literatures [9,10]. However, information on the comparison of the single-stage and two-stage AD system treating WAS and FW was limited. The operational comparison of single-stage and two-stage AD process with FW or thin stillage as substrate have been reported, and most studies considered that two-stage AD process prevailed over single-stage AD process on the aspects of biogas production and organic matters removal [11,12,13]. Whereas, one study with the mixture of manure and fruit/vegetable waste as substrate argued that the two-stage and single-stage AD system showed similar performance on energy recovery [14]. Therefore, the category of substrate is significant to the assessment of single-stage and two-stage AD systems. The compositions in FW are easily utilized but the organic matters in WAS is hard to release during AD process, and the unsynchronized degradation of the substrates might lead to diverse evaluation on the operational performance at various hydraulic retention times (HRTs) or organic loading rates (OLRs). It is interesting to compare the performance between two-stage and single-stage AD system for co-digestion of WAS and FW at various HRTs or OLRs.
For two-stage AD system, the continuous and steady hydrogen production in the first stage is essential for operational performance. As a clean energy carrier, hydrogen produces only water upon combustion and releases an energy yield as high as 122 kJ/g, and thus hydrogen production also benefits all the overall energy recovery [15]. Hydrogen production highly relies on the appropriate fermentation temperature and pH condition. For co-digestion of WAS and FW, the emergence of methanogens contamination were found in the mesophilic hydrogen production process [10]. By contrast, the thermophilic hydrogen production process was reported to have some advantages on organic matters degradation, pathogenic organism destruction and hydrogen production [16], which was applied in this study. The pH decline almost occurred in the hydrogen production reactor (H2-reactor) treating WAS and FW due to the accumulation of volatile fatty acid (VFA), and it must be dosed with great amount of alkaline materials to avoid inhibiting hydrogen production [9,10,17]. However, the pH adjustment by external alkaline chemicals would increase the operational cost. In contrast to H2-reactor, the alkalinity is produced in methane production reactor (CH4-reactor) as the VFA consumption and alkaline metabolites generation. In order to balance the alkalinity in the two-stage AD system, the effluent in CH4-reactor was recirculated into H2-reactor in several studies [11,18,19]. The pH of H2-reactor treating sole FW was reported to be successfully kept at 5.5 by effluent recirculation without external base addition at recirculation ratio of 2.9, and the hydrogen production was stable and high-efficient [18]. Compared to sole FW, the mixture of FW and WAS contains a considerable amount of protein and minerals that contribute to pH buffering capacity and alkalinity increase during the AD process [20,21]. It could be speculated that the pH maintenance could be achieved with a low recirculation ratio and the operating cost would be decreased accordingly for co-digestion of WAS and FW.
In order to evaluate the operational performance and energy recovery between two-stage and single-stage AD system for co-digestion of WAS and FW, the continuous two-stage and single-stage AD system was operated at various HRTs and OLRs in this study. The thermophilic H2-reactor and mesophilic CH4-reactor were utilized in the two-stage AD system, and the mesophilic single-stage AD system was operated under the identical CH4-reactor and feedstock. For pH maintenance in H2-reactor, effluent recirculation was applied in the two-stage AD system. Besides, the bacterial community structure in the H2-reactor and archaeal community structure in the CH4-reactors were analyzed for further comparison.
2. Materials and Methods
2.1. Seed Sludge
The seed sludge for hydrogen and methane production was taken from an anaerobic reactor treating FW operated at room temperature without stirring. Prior to being used in reactors, the digested sludge was sieved to remove coarse matters. The sieved sludge was directly used as seed sludge for methane production. Before serving as hydrogen producing seed sludge, the sieved digested sludge was repeated-aerobically pretreated for 7 days and then anaerobically cultured for another 7 days at 55 °C [22]. During repeated-aerobic pretreatment, the digested sludge was firstly aerated for 1–3 h, and then fed with 15 g/L of glucose and settled during the rest hours of the day, and the supernatant was replaced by tap water before the next aeration. The aerobic pretreatment procedure was repeated for 7 times. The initial volatile solid (VS) content of hydrogen producing seed sludge and methane producing seed sludge were 23.38 g-VS/L and 14.59 g-VS/L, respectively.
2.2. Feedstock
The mixture of WAS and FW was used as the feedstock with FW proportion of 54% in VS, which was proved to be optimal in the previous study [2]. The WAS was collected from a membrane bioreactor treating bath wastewater. The FW was collected from the cafeteria of Tianjin University. The substrates and dosage were the same for both two-stage and single-stage AD systems. The characteristics of substrates and feedstock are shown in Table 1 and the values of parameters are the average of 11 measurements.
2.3. Experimental Design and Operation
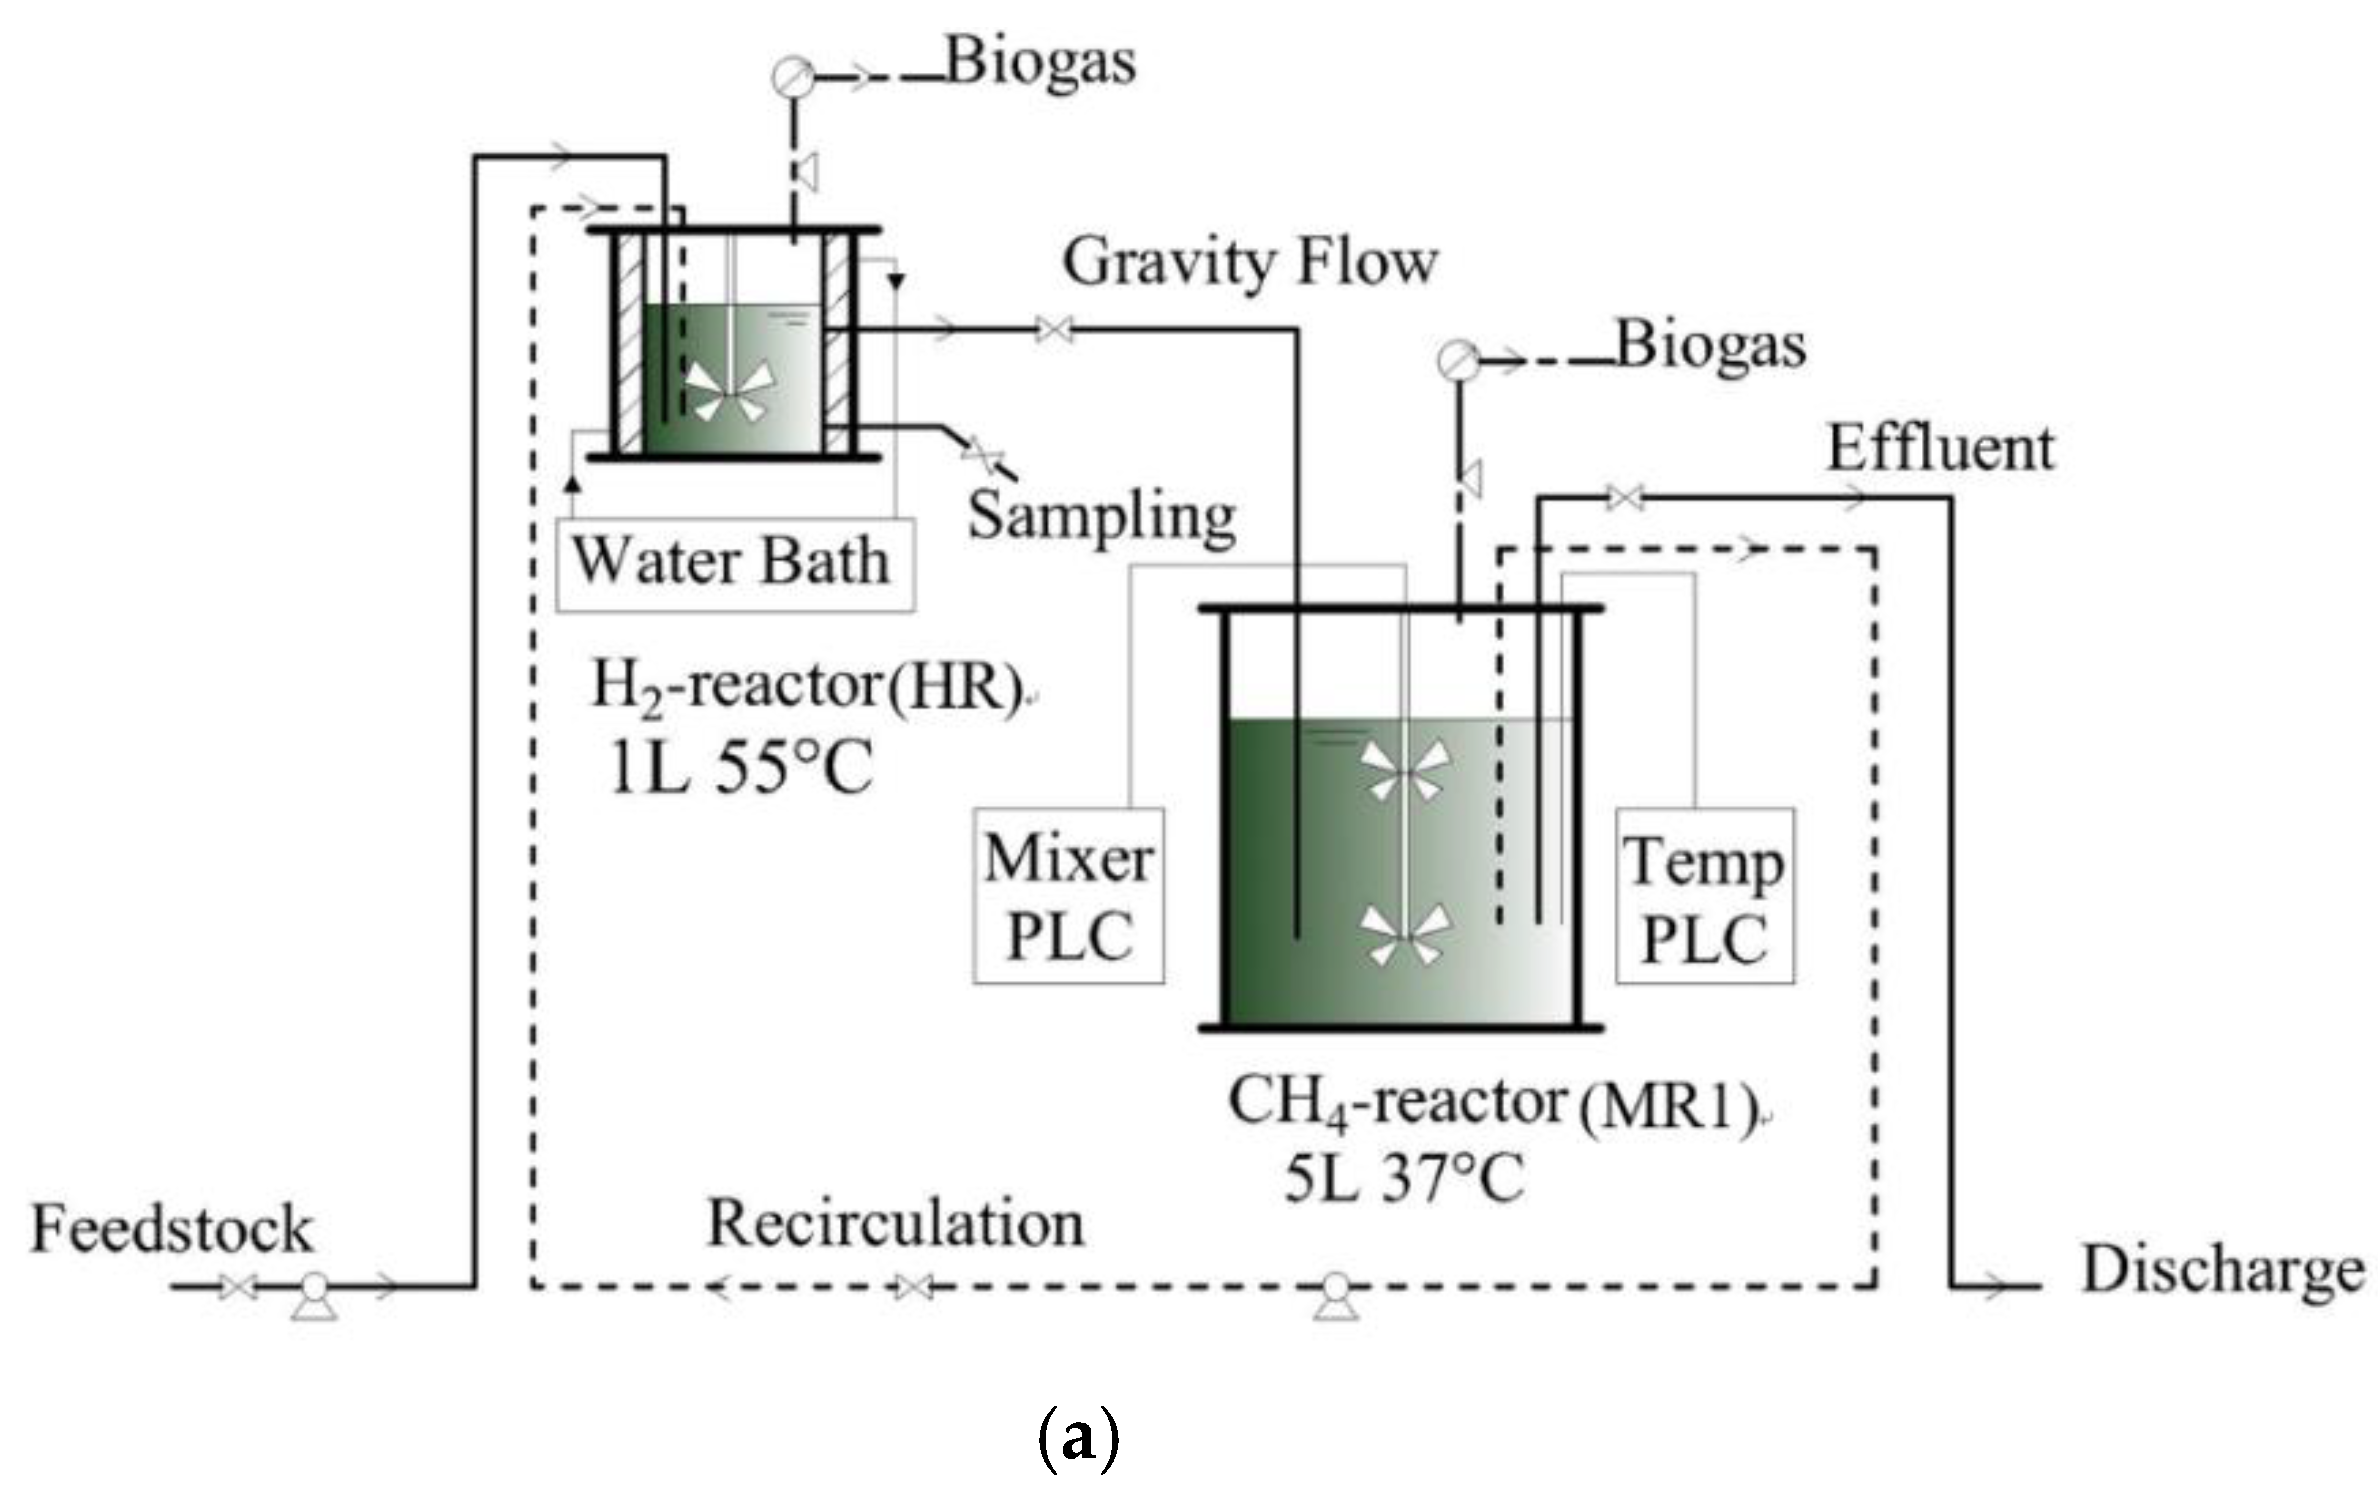
The schematic diagrams of the two-stage and single-stage fermentation apparatus are shown in Figure 1a,b, respectively. The H2-reactor (HR) and CH4-reactor (MR1) in the two-stage system has the working volumes of 0.65 L and 3.6 L, respectively. The CH4-reactor (MR2) in single-stage processes had identical configurations with MR1. The operation temperature of HR was 55 °C, maintained by water jacket connected to a water bath, and the operation temperature of MR1 and MR2 was 37 °C, controlled by Programmable Logic Controller (PLC) equipped for the fermentation reactors. The mechanical stirring rates were 70 rpm for HR and 300 rpm for MR1 and MR2, respectively.
The feedstock was pumped into reactors twice a day. In the two-stage AD process, the feedstock was pumped into HR and the effluent of the HR flew into MR1 by gravity simultaneously. Moreover, part of the digested sludge derived from the MR1 was recirculated into HR with recirculation rate (volume ratio of recirculation to feeding) of 1:1 and the same volume of digested sludge was discharged. Due to the recirculation, the actual HRT was the half of the HRT calculated by feeding in the two-stage AD process.
During the startup stage, the hydrogen producing seed sludge and feedstock with the volume ratio of 2:1 were added into HR, and the MR1 and MR2 were filled with methane producing seed sludge. All of the reactors were purged with nitrogen gas for 10 min to create the anaerobic condition. The seed sludge was acclimatized for one month feeding FW and WAS with the concentration of 62.5 g-VS/L and the feeding volume of 0.1 L/d before the operation stage.
During 120 d operation, the feedstock concentration was controlled at 43.5 g-VS/L, and thus the variation of OLR and HRT had a reverse trend. In this experiment, there were four operation conditions (Operation 1 to Operation 4) according to the variation of HRT and OLR, which are shown in Table 2. The HRT in Table 2 is the actual value considering the digested sludge recirculation for two-stage AD process. The pH values for hydrogen and methane production were controlled at 5.0–5.5 and 6.7–7.4, respectively. If pH was below 5.0 for HR or below 6.7 for MR1 and MR2, a certain amount of K2HPO4 was added for pH adjustment, while Na2CO3 was also dosed in the case of serious pH drop in MR2.
2.4. Chemical Analysis
A gas chromatograph (BEIFEN 3040, Beijing, China) equipped with a thermal conductivity detector and a stainless-steel packed column (TDX-01, 2 m) was used to analyze the gas composition, including hydrogen, methane, carbon dioxide and nitrogen. The operation temperature of the injection port, oven and detector were 100, 100 and 130 °C, respectively. The biogas sample was injected manually by a self-sealed syringe (500 µL) through a septum at the injection port, and argon was used as the carrier gas at a flow rate of 35 mL/min.
The samples taken from reactors were centrifuged and filtrated by 0.22 µm membrane, and then acidized by 5 mol/L H2SO4 solution, and injected into GC manually for VFAs analysis. VFA including acetate, propionate, butyrate, i-butyrate, valerate, i-valerate, and ethanol in the digestate were analyzed by another gas chromatograph (SP6890, Zaozhuang, China) equipped with a flame ionization detector and a fused-silica capillary column (HP-FFAP, 0.53 mm × 10 m × 1 µm). Nitrogen was used as the carrier gas with a flow rate of 6 mL/min, and the split ratio was 10:1. The respective temperature of injection port and detector were 200 and 250 °C, and the heating procedure for the oven increased from 70 °C to 79 °C at the rate of 3 °C/min, 79 °C for 1 min, then increased to 180 °C at the rate of 10 °C/min, 180 °C/min for 3 min.
The pH was measured with a pH meter (Sartorius PB-10, Göttingen, Germany). The carbohydrate was analyzed using anthrone-sulfuric acid method with glucose as standard [23], and the protein was analyzed by Lowry method with bovine serum albumin as standard [24]. Chemical oxygen demand (COD) was measured according to HACH method (HACH, Loveland, CO, USA). The samples for soluble component analysis were filtrated by 0.45 µm membrane before detecting. The total solid (TS), VS, alkalinity and ammonium were determined according to Standard Methods [25].
2.5. Microbial Analysis
The bacterial community structure in HR and archaeal community structure in CH4-reactors were determined by PCR-amplified 16S rRNA clone library analysis. The sludge sample was collected from HR, MR1 and MR2 at the operation day of 118 d, when the microorganism community structure was typical and steady. The genomic DNA of sludge sample was extracted by PowerSoil DNA Isolation kit (Mo Bio, Carlsbad, CA, USA) according to the manufacturer’s instructions. The 16S rRNA genes were amplified by primer pairs of 27F (5′-AGAGTTTGATCMTGGCTCAG-3′)/1392R (5′-ACGGGCGGTGTGTAC-3′) for bacteria in HR [26] and Arc109F (5′-ACKGCTCAGTAACACGT-3′)/Arc 934r (5′-GTGCTCCCCCGCCAATTCCT-3′) for archaea in CH4-reactors [27]. The PCR program for bacteria was as followings: 95 °C for 30 s; 24 cycles of 95 °C for 15 s, 50 °C for 20 s, and 72 °C for 50 s; 40 °C for 30 s; 72 °C for 10 min. For members of archaea in CH4-reactors, the PCR programs corresponded to the following: 95 °C for 5 min; 35 cycles of 95 °C for 45 s, 55 °C for 45 s, and 72 °C for 45 s; 72 °C for 5 min. The PCR products were checked by agarose gel electrophoresis and purified by DNA Fragment Purification Kit (Takara, Shiga, Japan) before cloning. The purified amplicons were cloned using pGEM-T Easy Vector system (Promega, Madison, WI, USA) according to the protocol. For each sludge sample, 96 colonies were picked up and then enriched for positive examination by PCR using the primers of T7 (5′-TAATACGACTCACTATAGGG-3′)/SP6 (5′-ATTTAGGTGACACTATAG-3′). The positive colonies were sent to BGI tech (Beijing, China) for sequencing. The primer sequences were removed to purify the nucleotide sequences, and the length of the base sequences and signals of the bases were also quality-checked before data processing. The processed sequences were aligned by the online RDP classifier for taxonomy classification (confident threshold was 80%), and also clustered in CD-HIT-EST website (sequence identity cut-off was 0.95) to attain the operational taxonomic units (OTUs) and representative sequences. Then, the closest species of representative sequences were searched using BLAST in the NCBI GenBank Nucleotide databases. The representative sequences obtained in this study and the retrieved from database were aligned by BioEdit and phylogenetic tree of the relative sequences were constructed using MEGA 7.0.
2.6. Statistical Analysis
The SPSS software version 22.0 (IBM, Armonk, NY, USA) was used for one way analysis of variance (ANOVA) and liner regression, and the pairwise comparisons of the means were conducted using the Turkey’s honestly significant difference (HSD) test with a threshold p-value of 0.05 declared significant.
3. Results
3.1. Operational Performance in HR at Various HRT
The biogas production rates, VS, pH, acetate and butyrate in HR at various HRTs and OLRs are shown in Figure 2, and the characteristics of gaseous products and fermentation digestate from HR are summarized in Table 3. As shown in Figure 2 and Table 3, it is clear that both hydrogen production rate and hydrogen yield dramatically increased with OLR and decreased with HRT. The hydrogen production rate of 0.2–2.0 L/L/d in this study is comparable to the reported 0.5–5.4 L/L/d in the thermophilic co-digestion process [28,29]. The highest hydrogen yield of 76.8 mL/g-VS or 207.5 mL/g-VSremoved was obtained at Operation 4. Compared to the reported semi-continuous hydrogen production process, the hydrogen yield in this study is much higher than 129.1 mL/g-VSremoved [9] and 32–48 mL/g-VS [10] obtained from mesophilic co-digestion of sludge and FW, suggesting the advantages of thermophilic condition on anaerobic fermentative hydrogen production. The biogas produced in HR was mainly composed of hydrogen (53.4–60.9%), carbon dioxide (39.1–45.0%), and small amount of methane (0–4.0%). Limited methane was detected in this study, indicating that the methanogens contamination was effectively controlled under thermophilic condition. The appearance of methane in HR could be caused by methane dissolution from the recycled digested sludge or acid-tolerant methanogens activity in HR [30,31].
The acetate, butyrate and ethanol were commonly reported as liquid by-products accompanied by hydrogen production, and the propionate, i-butyrate, valerate and i-valerate would also be produced following other metabolic pathways during the organic matter’s fermentation [30]. As shown in Table 3, the TVFA reached the peak level at the Operation 3. In the HR, VFAs mainly consisted of acetate and butyrate, accounting for 83.0–90.0% of the TVFA. However, in another study using aeration pretreatment for hydrogen-producing seed sludge preparation, the acetate and ethanol were the main liquid products [22]. In fact, except for the seed sludge pretreatment methods, the distribution of VFA is influenced by the source of seed sludge, feedstock and fermentative conditions as well. On account of effluent recycling and co-digestion process, the pH in HR was 5.0–5.5 in most cases, which is suitable for hydrogen production. However, the pH occasionally dropped to below 5.0, so the system was dosed with additional alkali (K2HPO4) for pH maintenance. The pH and operational situations could affect the fluctuations of acetate and butyrate during the whole fermentation process, which is shown in Figure 2 and further explained in Supplementary Information S1.
The organic matters, represented as VS, total COD, soluble COD, total carbohydrate and soluble carbohydrate, were consumed during hydrogen production. Table 3 shows that the concentration of organic matters in HR increased with OLR and decreased with HRT. The ratio of the produced TVFA and the input COD could represent the acidogenesis efficiency of organic matters in some degrees. The produced-TVFA/input-TCOD ratios were 0.46, 0.21, 0.20 and 0.14 for Operation 1 to Operation 4, respectively, reflecting the reduction of acidogenesis efficiency with OLR, which might be caused by the insufficient retention time at high OLR. The variation of VS in HR (Figure 2) illustrates that the VS gradually increased from 22.29 g-VS/L to 27.39 g-VS/L in average. The increasing VS in digestate had reverse effect on mass transfer [3], which could be one of the reasons for the reduction of the acidogenesis efficiency at high OLRs. The VS removal efficiency of 38.1–51.7% was comparable to the reported 47% in a hydrogen production reactor for co-digestion of FW and WAS [9]. It could be calculated that the carbohydrate accounted for nearly 70.3–87.3% of the removed VS. Moreover, the soluble carbohydrates removal efficiency was found to be above 94% in all operation conditions. These results suggests that carbohydrates was the major substrate for hydrogen and VFA production, which is accordance with the reported result [32]. Compared with rapid and high-efficient degradation of carbohydrates, the protein was not readily to be utilized and 0.31–0.53 g/L of soluble protein was left in HR. As one of the end products from protein fermentation, NH4+-N increased by 2.4–7.7 times in HR, as calculated from Table 1 and Table 3. It could also be speculated from Table 3 that protein degradation efficiency decreased with OLR according to the consistent drop of NH4+-N concentration and increase of soluble protein concentration from Operation 1 to 4, which agreed with the overall acidogenesis efficiency.
3.2. Comparison of Operational Performance between MR1 and MR2 at Various HRTs
The CH4-reactors in the two-stage and single-stage AD systems were fed with effluent of HR and initial feedstock, respectively. The comparison of MR1 and MR2 could evaluate the influence of pre-acidification on methane production. The biogas production rate, VS, VFA and pH in MR1 and MR2 are illustrated in Figure 3 and Figure 4, respectively, and the operational performance of MR1 and MR2 are summarized in Table 4.
In the two-stage AD system, the effluent of HR with partially hydrolyzed organic matters and abundant VFAs were used for methane production in MR1. It can be seen from Figure 3 that the methane production rate increased with OLR, and the peak value was 713.6 mL/L/d at Operation 4. The methane content of 71.5–81.3% in this study was closed to 70–80% from sole FW fermentation with the similar operational condition [33]. A consistent growth of VS concentration in MR1 was found, indicating the decline in organics removal with OLR. The pH in MR1 was stable at 6.8–7.4 and the TVFA (acetate accounts for 55.1–83.4%) was below 350 mg/L in most cases during the whole digestion process, which are suitable for methane production. The maximum methane yield of 154.1 mL/g-VS or 554.3 mL/g-VSremoved in MR1 was obtained at OLR of 4.4 g-VS/L/d (Operation 3), which was close to the reported value of 133–150 mL/g-VS at OLR of 5.0 g-VS/L/d [4,7]. At the OLR of 1.2 g-VS/L/d in Operation 1, the methane yield of 122.1 mL/g-VS is within the reported range of 90–270 mL/g-VS at OLR of 1.0–1.46 g-VS/L/d in the literature [4,31]. As OLR raised to 2.7 g-VS/L/d in Operation 2, the methane yield of 137.6 mL/g-VS in this study is lower than 170–435 mL/g-VS at the OLR of 2–3 g-VS/L/d in the literatures, and it should ascribe this result to the low HRT of 9 d compared to 10.2–24 d in the literatures [4,7,31]. The insufficient retention time would result in the low organics degradation efficiency and active methanogens washout, which is not conducive to methane production. The AD system treating FW and sludge at the OLR as high as 6.1 g-VS/L/d was also investigated in the literature. The reported methane yield of 200 mL/g-VS at OLR of 6.1 g-VS/l/d and HRT of 7 d obtained from the two-stage thermophilic-mesophilic AD system were higher than 147.6 mL/g-VS at OLR of 6.1 g-VS/L/d and HRT of 4.5 d in this study, whereas most of the methane was produced in the thermophilic reactor [32]. Besides, the two-stage mesophilic system obtained the methane yield of 80 mL/g-VS at OLR of 5.5 g-VS/L/d, which is lower than this study. In another study using single-stage mesophilic process for methane production, the methane yield dropped to about 20 mL/g-VS at OLR of 6.0 g-VS/L/d [4]. The stable and high-efficient methane production in MR1 at OLR as high as 6.1 g-VS/L/d, should be attributed to the pre-acidification by thermophilic hydrogen production stage.
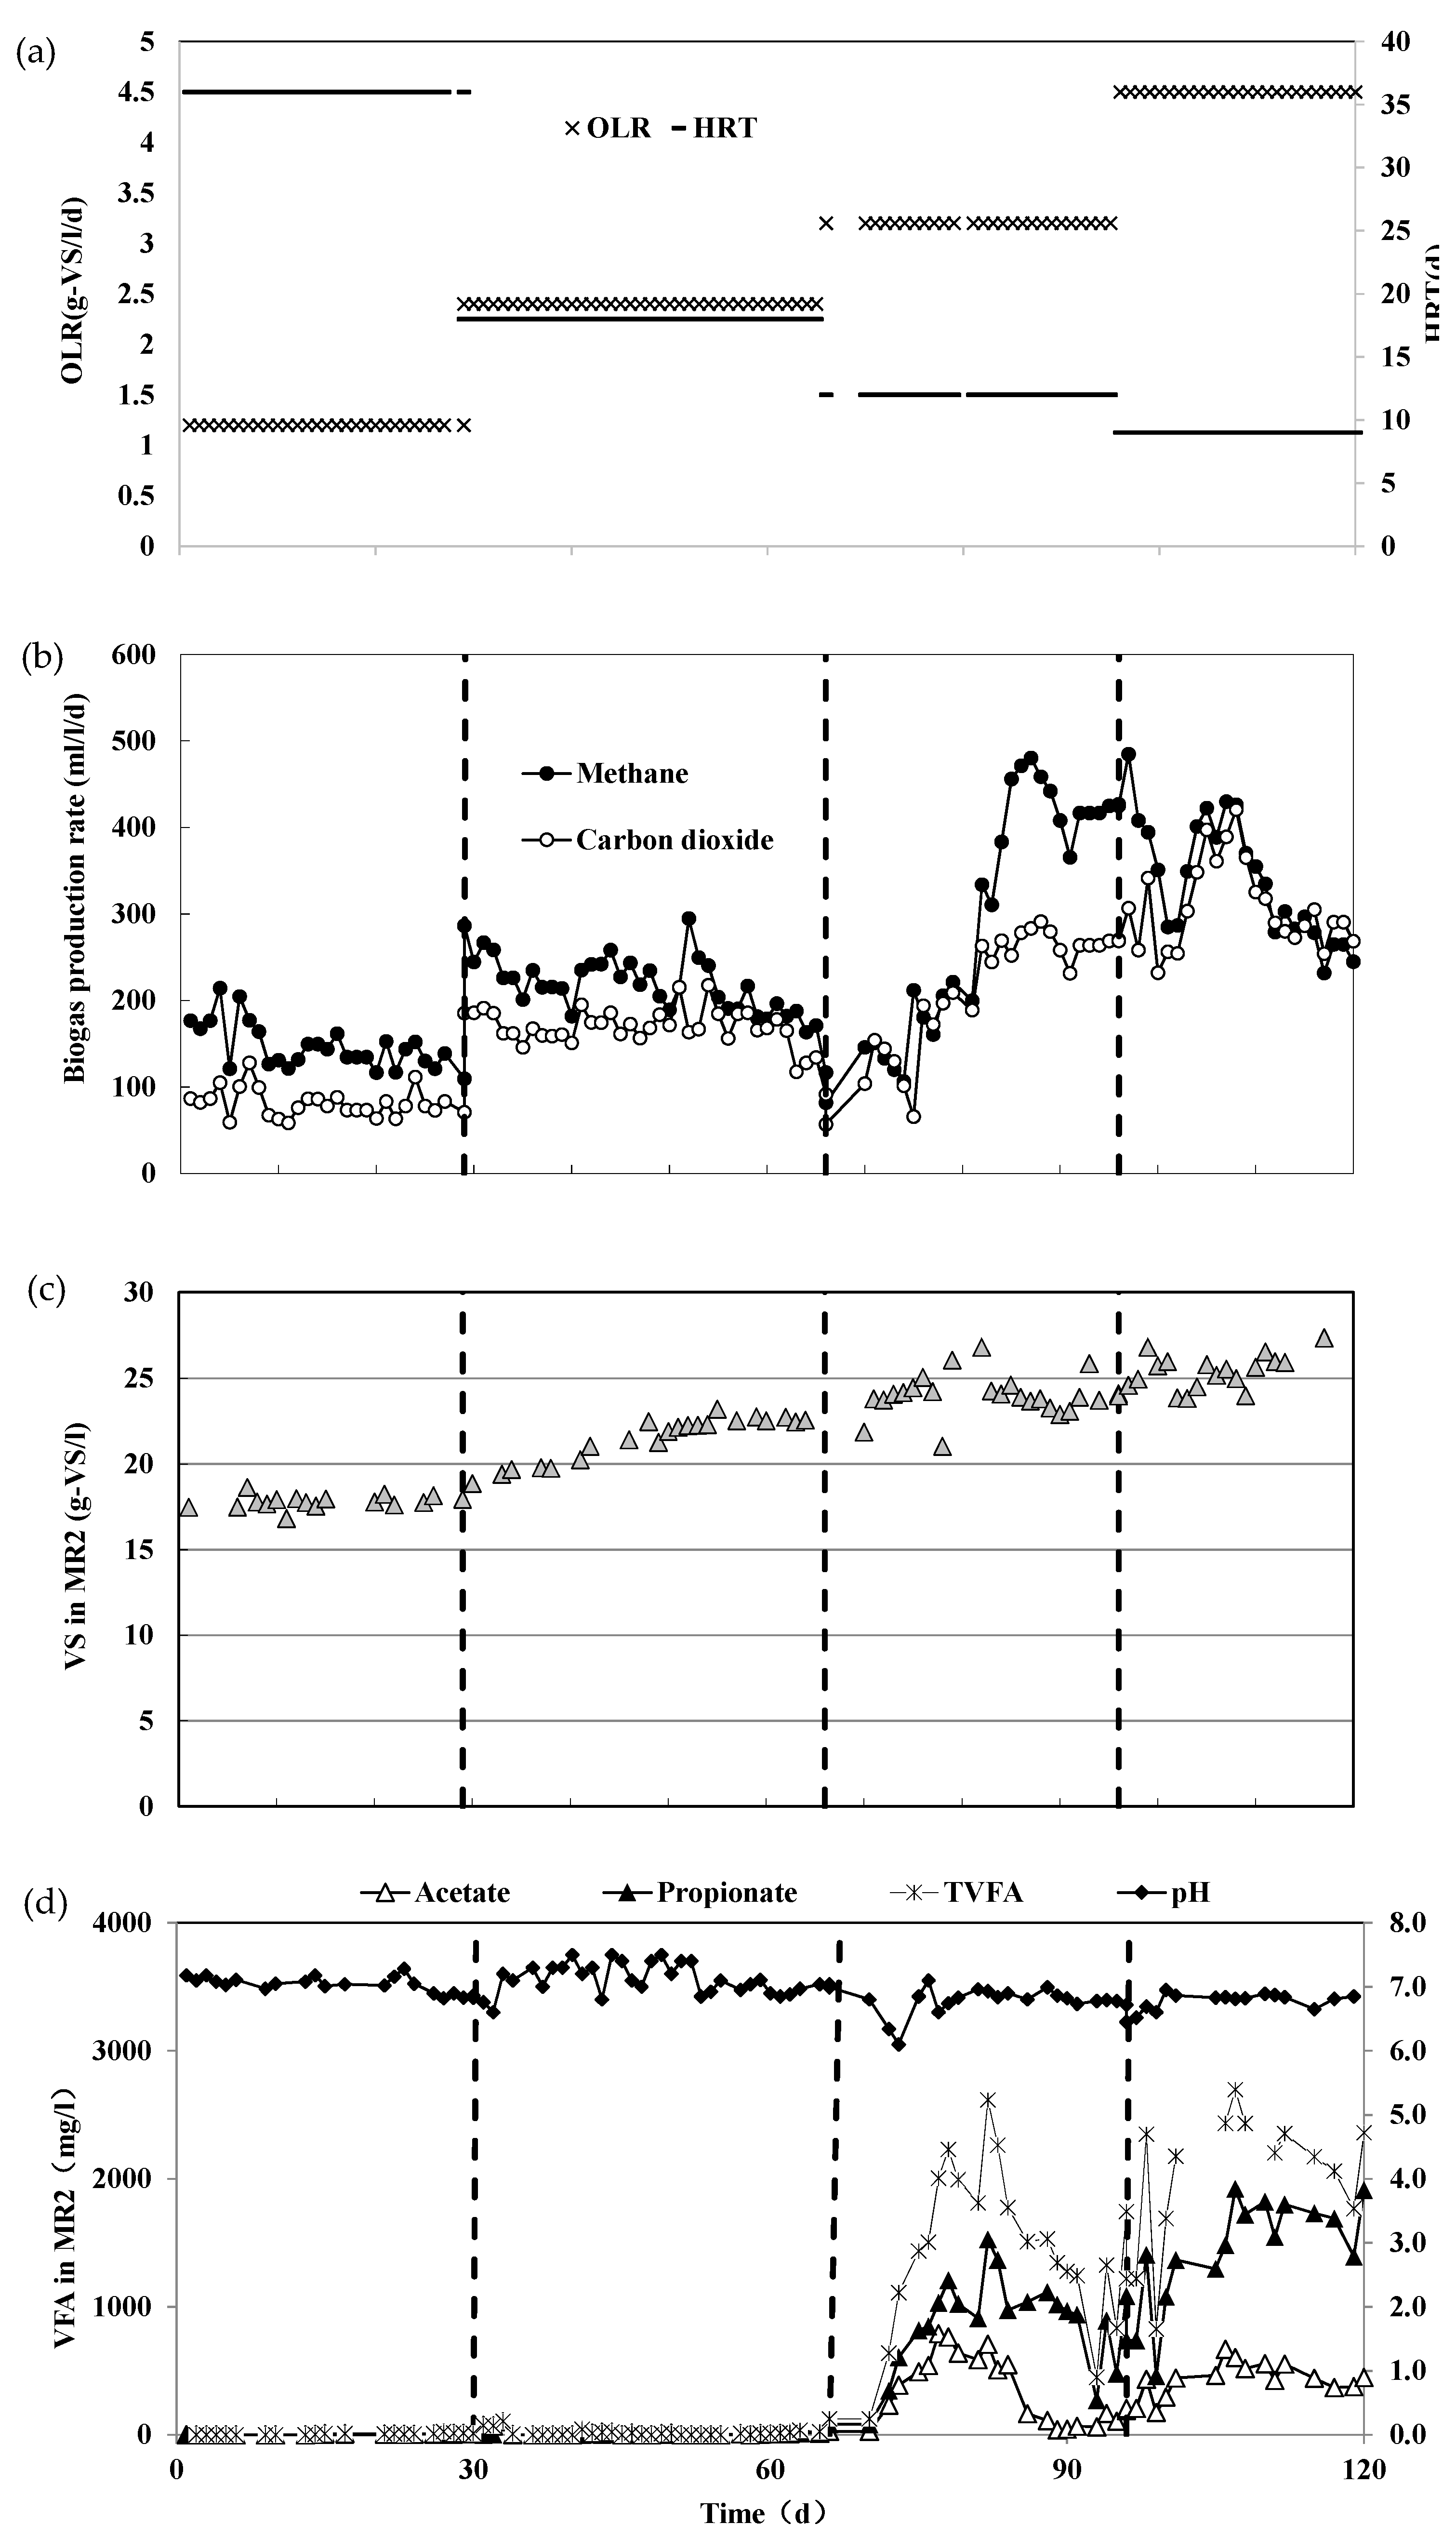
In the single-stage AD system without pre-acidification, the biogas production in MR2 was stable in Operation 1 & 2 but fluctuant in Operation 3 & 4, as shown in Figure 4. During Operation 1 & 2, the pH of 6.8–7.3 and TVFA of below 70 mg/L was popular with the growth of methanogens. It was overloaded at Operation 3 & 4 and the pH was maintained at 6.7–7.1 mainly by addition of alkali. However, the sharp decline of pH to 6.1–6.5 was not prevented at the initial stage of Operation 3 & 4 due to the accumulation of VFA. During the methane production process, VFA accumulation is mainly caused by the unbalance of hydrolysis/acidogenesis and methanogenesis, and the propionate accumulation is particularly detrimental to methane production and methanogens activities [34]. At the first-half of Operation 3, the TVFA gradually increased to 3814 mg/L (propionate account for 55.3%), resulting in the pH drop and methane production reduction. When the pH was adjusted to 6.7–7.0 at the latter-half of Operation 3, the TVFA gradually reduced to 833 mg/L with propionate content of 478 mg/L, leading to the recovery of methane production. However, as the further increase in OLR at the Operation 4, the TVFA was long-term stable at 2064–2696 mg/L and the propionate content was as high as 1470–1920 mg/l. Although the pH was still controlled at 6.8–7.1, the methane production was inhibited by the long-term propionate accumulation.
The methane content in biogas produced in MR2 was 53.4–64.1%, which is much lower than that of 71.5–81.3% in MR1, implying that biogas quality was promoted in two-stage AD system. The methane yield in MR2 had no significant difference to that in MR1 in Operation 1 (n = 26, p > 0.05), but accounting for only 67%, 52% and 50% of those in MR1 in Operation 2–4. This results indicates that two-stage AD system contributes to methane production at high OLR, which is accordant to the previous literature that demonstrated the improvement of methane production by biohydrogen via two-stage AD process at similar OLR [35]. Besides, the concentrations of VS, COD, carbohydrate and protein in MR1 were lower than those in MR2, implying that more organics were converted in two-stage AD system. The VS removal efficiency of 42.5–60.0% in single-stage AD process was lower than 53.1–63.8% in two-stage AD process, which was in the range of 44.2–76.5% at OLR of 1.2–6.1 g-VS/L/d in temperature-separated two-stage AD process [36] and close to 48–62% at OLR 1–5 g-VS/L/d at mesophilic single-stage AD process [3]. Besides, it should be noticed that the NH4+-N in MR2 was not detectable and the soluble protein reached 1.57 g/L in average in Operation 4, reflecting the difficulty in protein metabolism at high OLR. Considering that NH4+-N is a significant nitrogen source for cell growth and activities, it could be speculated that the lack of NH4+-N in MR2 at high OLR might be one of the reasons for the low methane yield in single-stage AD process.
3.3. Microbial Communities in Each Reactor
3.3.1. Bacterial Community Dynamics in Hydrogen Reactor
An overall of 10 phyla were retrieved from 16S rRNA gene sequences, as illustrated in Figure S1. The most predominant phylum in thermophilic HR was phylogenetically affiliated with the phylum Firmicutes with relative abundance (RA) of 72.3%, followed by phylum Bacteroidetes (8.5%), Cloacimonetes (6.4%), Proteobacteria (4.3%), Chloroflexi (3.2%), and other phyla. The absolute dominant position of phylum Firmicutes could be caused by the selective enrichment during hydrogen fermentation [37]. The sequences affiliated to order Clostridiales (RA of 70.2%) accounted for 97% of the phylum Firmicutes sequences, including the known genus Thermohydrogenium (RA of 4.3%), Mogibacterium (RA of 1.1%), Thermoanaerobacterium (RA of 20.2%) and Clostridium IV (RA of 18.1%). The clones developed from the sample were classified into 32 OTUs, the abundance of each OTU and the phylogenetic tree of the bacterial OTUs and their closest relatives are shown in Figure 5. Parts of OTUs in order Clostridiales were grouped as Cluster I (RA of 34.2%) and Cluster II (RA of 33.0%) based on the phylogenetic relationship, which is also shown in Figure 5. The Cluster I showed above 90% similarity to Clostridium sp. strain Z6, isolated from paper mill wastewater [25], and above 93% similarity to uncultured bacterium clone VKW-TB-3.2, dominated in thermophilic hydrogen fermentation reactor treating vegetable kitchen waste [38]. Cluster II was closely related (>97%) to species Thermoanaerobacterium thermosaccharolyticum, known as hydrogen producer via acetate-butyrate fermentation pathway in thermophilic condition [39]. The microbes in Cluster I and Cluster II, accounting for two third of the bacteria, outcompeted by other bacteria in the digester and played important roles in thermophilic hydrogen fermentation in this study.
3.3.2. Comparison of Archaeal Community Dynamics in MR1 and MR2
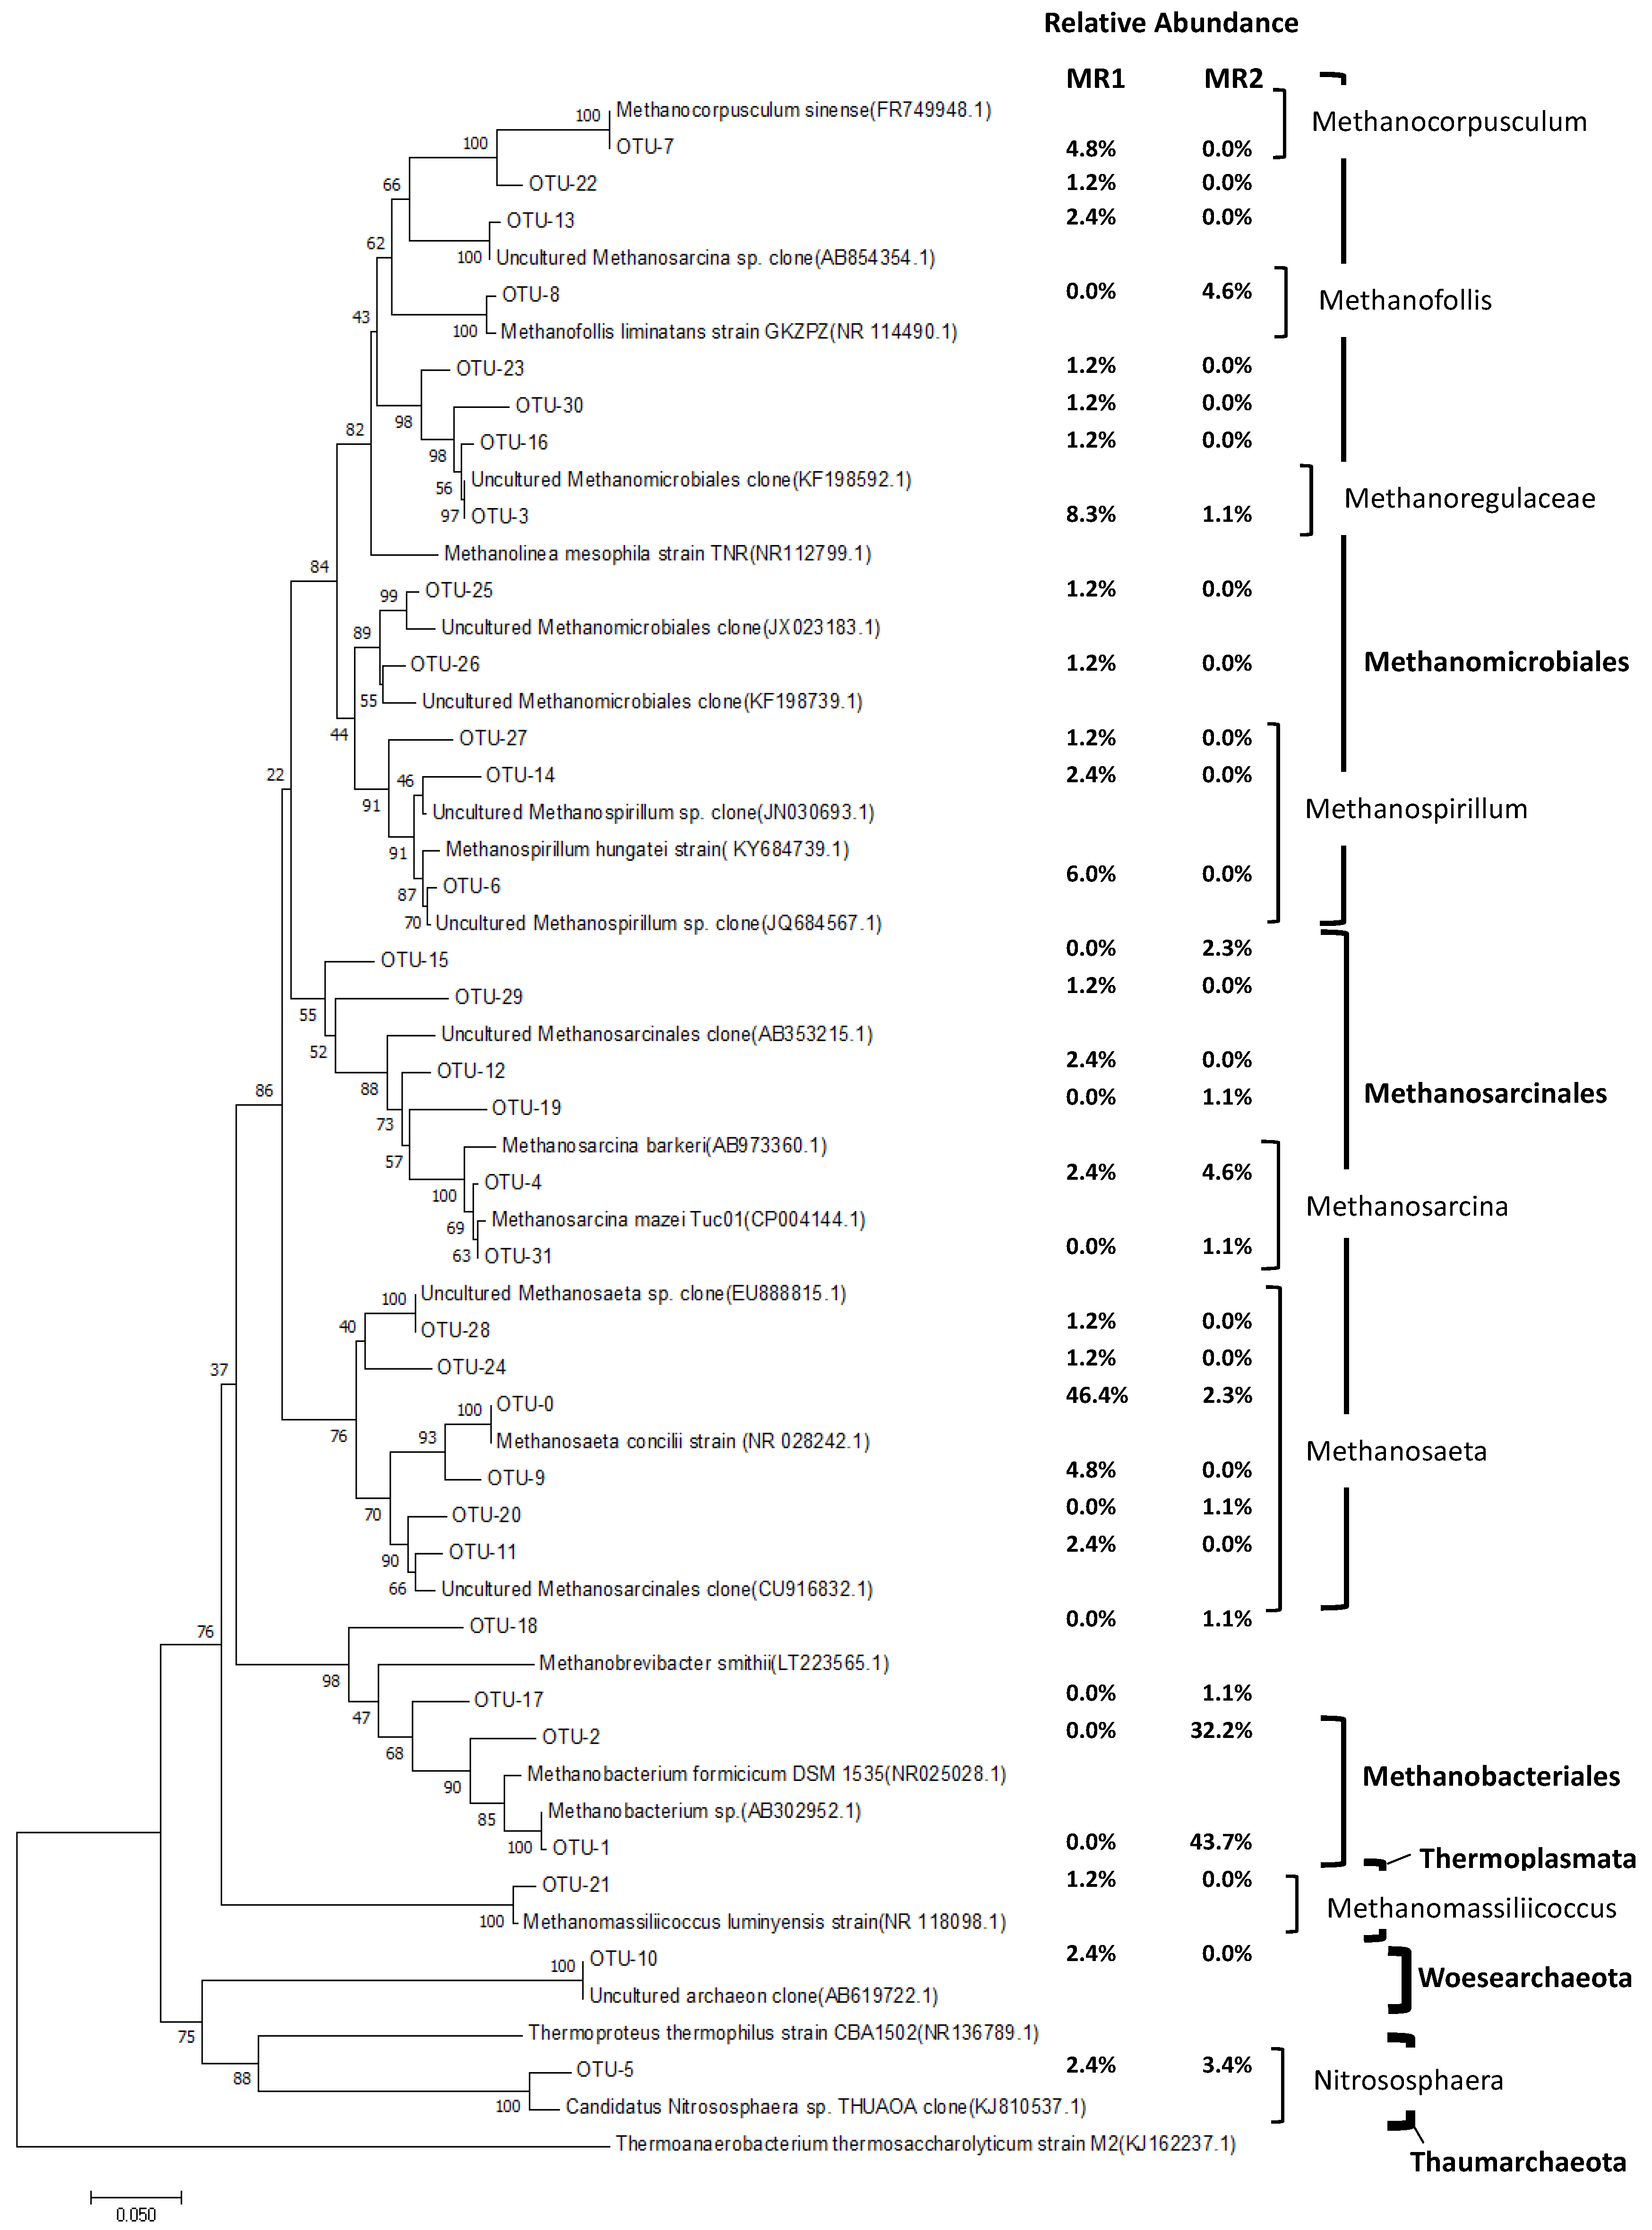
The majority of archaeal clone sequences was affiliated with Euryarchaeota in phylum basis, while the archaeal community in MR1 and MR2 showed notable variety in class basis, as indicated in Table S2. The class Methanomicrobia and Methanobacteria were the major population in MR1 and MR2 with RA of 94.0% and 75.9%, respectively. All the clone sequences obtained from MR1 and MR2 were classified into 32 OTUs, the abundance of each OTU and the phylogenetic tree of the archaeal OTUs and their closest relatives are shown in Figure 6. It could be obviously observed that the archaea in MR1 had abundant population of the order Methanosarcinales (RA of 62.0%) and Methanomicrobiales (RA of 32.3%), while the archaea in MR2 was rich in the order Methanobacteriales (RA of 75.9%). The results demonstrate that the pre-acidification by thermophilic H2-reactor had great impact on the archaeal community structure in CH4-reactor.
As illustrated in Figure 6, five OTUs with total abundance up to 56.0% were affiliated to genus Methanosaeta, and thus it was predominant genus in MR1. The genus Methanosaeta is inability to use H2 to produce CH4 and thus recognized as obligatory acetotrophic methanogens. Recent research found a new metabolic pathways of genus Methanosaeta, by which CH4 is produced by reducing CO2 through direct interspecies electron transfer [40]. Nearly 46.6% of clone sequences was highly closed to species Methanosaeta concilii, which was also found to be dominant in mesophilic AD process treating Brazilian waterweed under low VFA content [41]. Other dominant genera/families in MR1 were the genus Methanospirillum (RA of 9.6%), genus Methanocorpusculum (RA of 4.8%), and family Methanoregulaceae (RA of 8.3%), which presumably use H2/CO2 for methane production. Different from MR1, most of clones (RA of 75.9%, classified as OTU-1 and OTU-2) in MR2 was closely related to Methanobacterium sp. (similarity of above 97%), which is able to grow on H2/CO2 and known as hydrogenotrophic methanogens. Followed by genus Methanobacterium, the acetate-utilizing methanogens genus Methanosarcina and Methanosaeta had the abundance of 5.6% and 3.4% in MR2. It was reported that high acetate concentration favored genus Methanosarcina, whereas low acetate concentration was suitable to genus Methanosaeta [42], which is consistent with the distribution of genus Methanosarcina and Methanosaeta in two-stage and single-stage CH4-reactors in this study. The genus Methanofollis was found in MR2 with abundance of 4.6%, which is also hydrogenotrophic methanogens with favorite temperature of 37–40 °C and optimum pH of 7.0 [43]. Besides, the genus Nitrososphaera, belonged to phylum Thermoplasmata, had been observed in archaeal composition of MR1 (RA of 2.4%) and MR2 (RA of 3.4%). Characterized species of the genus Nitrososphaera is capable of gaining energy by oxidizing ammonia to nitrite and converting CO2 to organic matters, it is aerobic but could survive in very low oxygen levels [44]. The presence of genus Nitrososphaera in CH4-reactors in two-stage and single-stage AD system might contribute to the low NH4+-N concentration in digestate and low CO2 content in biogas.
4. Discussion
The differences on COD conversion efficiency, energy yield, operational stability and additional alkalinity between single-stage and two-stage AD systems at various operation conditions are further compared in Figure 7. The COD for the produced CH4 and H2 is calculated according to their complete combustion oxygen demand and the input COD was the COD in daily feedstock. The COD in biogas (CH4 and H2) from HR, two-stage and single-stage AD system at various input COD (fed in Operation 1–4) is illustrated in Figure 7a. In a linear regression, the slope of two-stage AD system is 0.379, which means the biogas conversion efficiency on COD basis is 37.9%. In the case of single-stage AD system, the slope indicates that 11.9% of input COD was collected as biogas. Compared with single-stage AD system, the biogas conversion efficiency improved by 2.18 times by two-stage AD system. Energy collected in AD systems is calculated based on the heating values of 10.8 kJ/l-H2 and 35.8 kJ/l-CH4 [9]. As shown in Figure 7b, the energy yield increased from 4.8 kJ/g-VS (Operation 1) to 6.2 kJ/g-VS (Operation 3) in two-stage AD system and had no significant difference between Operation 3 and Operation 4 (n = 22, p > 0.05), while the downward trends in energy yield (from 4.5 kJ/g-VS to 2.7 kJ/g-VS) was found in single-stage AD system. It should be noticed that there was no significant difference on energy yield (n = 22, p > 0.05) and COD conversion efficiency (n = 26, p > 0.05) between two-stage and single-stage AD system in Operation 1, which demonstrates the single-stage and two-stage AD system had similar performance at the sufficient HRT and low OLR. In fact, considering the investment costs, design and operation complexity in the industrial scale, the single-stage AD system is widely used in practice, accounting for more than 95% of full-scale plants in Europe [45]. Meanwhile, based on the operational performance results from this study, the single-stage was recommended for low OLR condition. In Operation 2–4, the energy yields in single-stage AD system accounted for 61.1%, 45.2% and 44.2% of those in two-stage AD system, indicating the superiority of two-stage AD system on energy production, especially at high OLRs. For two-stage AD system, the total energy was 20.7–106.4 kJ/d but only 7.2–13.6% of them were derived from hydrogen. This result agrees with the reported two-stage thermophilic AD process, from which the hydrogen energy was lower than 15% [14,46]. It could be concluded that the two-stage AD system has great development potential due to its stability and high-efficiency on combined hydrogen and methane production in high OLR condition.
The operational stability in MR1 and MR2 is evaluated by TVFA/alkalinity, as illustrated in Figure 7c. The additional alkali (K2HPO4 and Na2CO3) was dosed to improve the alkalinity in Operation 2–4, the amount of additional alkalinity is also shown in Figure 7c. The alkalinity of K2HPO4 is calculated as the [H+] demand for the complete conversion from K2HPO4 to KH2PO4, since H2PO4-/HPO42- is the majority in speciation of phosphate at the pH of 4.0–7.0, while each mole of Na2CO3 is calculated as the alkalinity of 100 g-CaCO3. The MR1 and MR2 were stable in most cases as the average TVFA/alkalinity is below 0.4. However, the MR2 could not maintain steady operation in Operation 4, when the average TVFA/alkalinity was as high as 0.53. In Operation 1, both two-stage and single-stage AD system were stable without additional alkali, implying the system reached the metabolism balance by itself at low OLR. By comparison, the TVFA/alkalinity in MR2 was much higher than MR1 although the additional alkalinity in MR2 was nearly twice of that in MR1 in Operation 3–4. This result verifies that the two-stage AD system is easier to achieve operational stability for methane production at high OLR than single-stage AD system. It was reported that the effluent recycling not only diluted the acidic digestate in HR but also promoted protein degradation and NH4+-N releasing, and both of them will be benefit for pH balance in two-stage AD system [19]. For hydrogen production in two-stage AD system, the methods of co-digestion and effluent recycling were still insufficient for stable operation in this study based on the pH variation as illustrated in Figure 2. However, the additional alkalinity of 672.5 mg-CaCO3/L/d for co-digestion process at the OLR of 39.6 g-VS/L/d is much lower than 3.1 g-CaCO3/L/d at the OLR around 34.8 g-TS/L/d from sole FW digestion at recirculation ratio of 1:1 [18], indicating the co-digestion process is effective in reducing the quantity of additional alkalinity, which is accordant with the previous study [21].
5. Conclusions
Two-stage and single-stage anaerobic digestion system was compared at various HRTs and OLRs feeding identical co-substrate of FW and WAS. Results indicate that the single-stage and two-stage AD system had similar performance on energy yield, COD conversion and VS removal at the sufficient HRT and low OLR, whereas the two-stage AD system showed superiority on biogas quality, energy production, operational stability and organics removal at high OLR. Considering investment costs, design and operation complexity in the industrial scale, the single-stage AD system is recommended for low OLR condition. Thermophilic hydrogen and mesophilic methane production in two-stage AD system reached the highest biogas and energy yield of 76.8 mL-H2/g-VS, 154.1 mL-CH4/g-VS and 6.2 kJ/g-VS, which were much higher than 122.0 mL-CH4/g-VS and 4.5 kJ/g-VS in mesophilic single-stage AD system. The co-digestion process was effective in reducing the amount of additional alkaline chemical agent compared with sole FW fermentation. The dominant clone sequence is affiliated to order Clostridiales in H2-reactor, and 34.2% and 33.0 % of them were closely related to species Clostridium sp. strain Z6 and species Thermoanaerobacterium thermosaccharolyticum, respectively. The order Methanosarcinales and Methanomicrobiales dominated in archaeal community in two-stage CH4-reactor, the order Methanobacteriales was the majority in single-stage CH4-reactor.
6. Patents
A Chinese patent resulting from the work “The invention relates to a hydrogen and methane method by co-digestion of sludge and kitchen waste” (Application No. CN201410557609.9) has been proposed to Patent Office of the People’s Republic of China.
Supplementary Materials
The following are available online at https://www.mdpi.com/1996-1073/12/14/2748/s1, Supplementary Information S1: Explanations for acetate and butyrate fluctuations affected by pH and operational situations in HR, Table S1: Results of ANOVA test for comparison of the performance between MR1 and MR2, Figure S1: Taxonomic classification and the relative abundances of the 94 quality-checked clone sequences obtained in thermophilic HR with phylum as basis, Table S2: Taxonomic classification and the relative abundances of the archaeal sequences by phyla and classes in MR1 and MR2.
Author Contributions
Conceptualization, R.L., X.L. and M.J.; methodology, R.L., X.L. and M.J.; formal analysis, X.L.; investigation, X.L.; data curation, X.L.; writing—original draft preparation, X.L.; writing—review and editing, R.L.; project administration, R.L., M.J.; funding acquisition, R.L., X.L. and M.J.
Funding
This research was funded by the National High Technology Research and Development Program (863 Program), China, grant number 2012AA063502, the Tianjin City Science and Technology Support Program Project, grant number 16YFZCSF00320, and Tianjin Research Program of Application Foundation and Advanced Technology, grant number 16JCQNJC08200.
Conflicts of Interest
The authors declare no conflict of interest. The funders had no role in the design of the study; in the collection, analyses, or interpretation of data; in the writing of the manuscript, or in the decision to publish the results.
References
- Guimarães, C.; Maia, D.; Serra, E. Construction of Biodigesters to Optimize the Production of Biogas from Anaerobic Co-Digestion of Food Waste and Sewage. Energies 2018, 11, 870. [Google Scholar] [CrossRef]
- Liu, X.; Li, R.; Ji, M.; Han, L. Hydrogen and methane production by co-digestion of waste activated sludge and food waste in the two-stage fermentation process: Substrate conversion and energy yield. Bioresour. Technol. 2013, 146, 317–323. [Google Scholar] [CrossRef]
- Gou, C.; Yang, Z.; Huang, J.; Wang, H.; Xu, H.; Wang, L. Effects of temperature and organic loading rate on the performance and microbial community of anaerobic co-digestion of waste activated sludge and food waste. Chemosphere 2014, 105, 146–151. [Google Scholar] [CrossRef]
- Fonoll, X.; Astals, S.; Dosta, J.; Mata-Alvarez, J. Anaerobic co-digestion of sewage sludge and fruit wastes: Evaluation of the transitory states when the co-substrate is changed. Chem. Eng. J. 2015, 262, 1268–1274. [Google Scholar] [CrossRef]
- Li, L.; Peng, X.; Wang, X.; Wu, D. Anaerobic digestion of food waste: A review focusing on process stability. Bioresour. Technol. 2018, 248, 20–28. [Google Scholar] [CrossRef]
- Ratanatamskul, C.; Wattanayommanaporn, O.; Yamamoto, K. An on-site prototype two-stage anaerobic digester for co-digestion of food waste and sewage sludge for biogas production from high-rise building. Int. Biodeterior. Biodegrad. 2015, 102, 143–148. [Google Scholar] [CrossRef]
- Cabbai, V.; De Bortoli, N.; Goi, D. Pilot plant experience on anaerobic codigestion of source selected OFMSW and sewage sludge. Waste Manag. 2016, 49, 47–54. [Google Scholar] [CrossRef]
- Guven, H.; Ersahin, M.E.; Dereli, R.K.; Ozgun, H.; Isik, I.; Ozturk, I. Energy recovery potential of anaerobic digestion of excess sludge from high-rate activated sludge systems co-treating municipal wastewater and food waste. Energy 2019, 172, 1027–1036. [Google Scholar] [CrossRef]
- Siddiqui, Z.; Horan, N.J.; Salter, M. Energy optimisation from co-digested waste using a two-phase process to generate hydrogen and methane. Int. J. Hydrogen Energy 2011, 36, 4792–4799. [Google Scholar] [CrossRef]
- Zhu, H.G.; Parker, W.; Conidi, D.; Basnar, R.; Seto, P. Eliminating methanogenic activity in hydrogen reactor to improve biogas production in a two-stage anaerobic digestion process co-digesting municipal food waste and sewage sludge. Bioresour. Technol. 2011, 102, 7086–7092. [Google Scholar] [CrossRef]
- Wu, L.-J.; Kobayashi, T.; Li, Y.-Y.; Xu, K.-Q. Comparison of single-stage and temperature-phased two-stage anaerobic digestion of oily food waste. Energy Convers. Manag. 2015, 106, 1174–1182. [Google Scholar] [CrossRef]
- Nasr, N.; Elbeshbishy, E.; Hafez, H.; Nakhla, G.; El Naggar, M.H. Comparative assessment of single-stage and two-stage anaerobic digestion for the treatment of thin stillage. Bioresour. Technol. 2012, 111, 122–126. [Google Scholar] [CrossRef] [PubMed] [Green Version]
- Nathao, C.; Sirisukpoka, U.; Pisutpaisal, N. Production of hydrogen and methane by one and two stage fermentation of food waste. Int. J. Hydrogen Energy 2013, 38, 15764–15769. [Google Scholar] [CrossRef]
- Schievano, A.; Alberto, T.; Scaglia, B.; Merlino, G.; Rizzi, A.; Daffonchio, D.; Oberti, R.; Adani, F. Two-stage vs single-stage thermophilic anaerobic digestion comparison of energy production and biodegradation efficiencies. Environ. Sci. Technol. 2012, 46, 8502–8510. [Google Scholar] [CrossRef] [PubMed]
- Sreela-or, C.; Plangklang, P.; Imai, T.; Reungsang, A. Co-digestion of food waste and sludge for hydrogen production by anaerobic mixed cultures: Statistical key factors optimization. Int. J. Hydrogen Energy 2011, 36, 14227–14237. [Google Scholar] [CrossRef]
- Zhang, T.; Mao, C.; Zhai, N.; Wang, X.; Yang, G. Influence of initial pH on thermophilic anaerobic co-digestion of swine manure and maize stalk. Waste Manag. 2015, 35, 119–126. [Google Scholar] [CrossRef] [PubMed]
- Ding, H.B.; Liu, X.Y.; Stabnikova, O.; Wang, J.Y. Effect of protein on biohydrogen production from starch of food waste. Water Sci. Technol. 2008, 57, 1031–1036. [Google Scholar] [CrossRef]
- Kobayashi, T.; Xu, K.Q.; Li, Y.Y.; Inamori, Y. Effect of sludge recirculation on characteristics of hydrogen production in a two-stage hydrogen–methane fermentation process treating food wastes. Int. J. Hydrogen Energy 2012, 37, 5602–5611. [Google Scholar] [CrossRef]
- Algapani, D.E.; Qiao, W.; Ricci, M.; Bianchi, D.; Wandera, S.M.; Adani, F.; Dong, R. Bio-hydrogen and bio-methane production from food waste in a two-stage anaerobic digestion process with digestate recirculation. Renew. Energy 2019, 130, 1108–1115. [Google Scholar] [CrossRef]
- Zhu, H.; Parker, W.; Basnar, R.; Proracki, A.; Falletta, P.; Beland, M.; Seto, P. Biohydrogen production by anaerobic co-digestion of municipal food waste and sewage sludges. Int. J. Hydrogen Energy 2008, 33, 3651–3659. [Google Scholar] [CrossRef]
- Baldi, F.; Pecorini, I.; Iannelli, R. Comparison of single-stage and two-stage anaerobic co-digestion of food waste and activated sludge for hydrogen and methane production. Renew. Energy 2019, 143, 1755–1765. [Google Scholar] [CrossRef]
- Ren, N.Q.; Guo, W.Q.; Wang, X.J.; Xiang, W.S.; Liu, B.F.; Wang, X.Z.; Ding, J.; Chen, Z.B. Effects of different pretreatment methods on fermentation types and dominant bacteria for hydrogen production. Int. J. Hydrogen Energy 2008, 33, 4318–4324. [Google Scholar] [CrossRef]
- Gaudy, A.F. Colorimetric determination of protein and carbohydrate. Ind. Water Wastes 1962, 7, 17–22. [Google Scholar]
- Lowery, O.H.; Rosebrough, N.J.; Farr, A.L.; Randall, R.J. Protein measurement with the Folin phenol reagent. J. Biol. Chem. 1951, 193, 265–275. [Google Scholar]
- APHA. Standard Methods for the Examination of Water and Wastewater, 21st ed.; APHA: Washington, DC, USA, 2005. [Google Scholar]
- Ritalahti, K.M.; Amos, B.K.; Sung, Y.; Wu, Q.Z.; Koenigsberg, S.S.; Loffler, F.E. Quantitative PCR targeting 16S rRNA and reductive dehalogenase genes simultaneously monitors multiple Dehalococcoides strains. Appl. Environ. Microb. 2006, 72, 2765–2774. [Google Scholar] [CrossRef]
- DeLong, E.F. Archaea in coastal marine environments. Proc. Natl. Acad. Sci. USA 1992, 89, 5685–5689. [Google Scholar] [CrossRef]
- Merlino, G.; Rizzi, A.; Schievano, A.; Tenca, A.; Scaglia, B.; Oberti, R.; Adani, F.; Daffonchio, D. Microbial community structure and dynamics in two-stage vs single-stage thermophilic anaerobic digestion of mixed swine slurry and market bio-waste. Water Res. 2013, 47, 1983–1995. [Google Scholar] [CrossRef]
- Ueno, Y.; Fukui, H.; Goto, M. Operation of a Two-Stage Fermentation Process Producing Hydrogen and Methane from Organic Waste. Environ. Sci. Technol. 2007, 41, 1413–1419. [Google Scholar] [CrossRef]
- Buitrón, G.; Carvajal, C. Biohydrogen production from tequila vinasses in an anaerobic sequencing batch reactor: Effect of initial substrate concentration, temperature and hydraulic retention time. Bioresour. Technol. 2010, 101, 9071–9077. [Google Scholar] [CrossRef]
- Llirós, M.; Trias, R.; Borrego, C.; Bañeras, L. Specific Archaeal communities are selected on the root surfaces of Ruppia spp. and Phragmites australis. Wetlands 2013, 34, 403–411. [Google Scholar] [CrossRef]
- Lay, J. Influence of chemical nature of organic wastes on their conversion to hydrogen by heat-shock digested sludge. Int. J. Hydrogen Energy 2003, 28, 1361–1367. [Google Scholar] [CrossRef]
- Chu, C.F.; Li, Y.Y.; Xu, K.Q.; Ebie, Y.; Inamori, Y.; Kong, H.N. A PH-and temperature-phased two-stage process for hydrogen and methane production from food waste. Int. J. Hydrogen Energy 2008, 33, 4739–4746. [Google Scholar] [CrossRef]
- Wang, Y.Y.; Zhang, Y.L.; Wang, J.B.; Meng, L. Effect of volatile fatty acid concentrations on methane yield and methanogenic bacteria. Biomass Bioenerg. 2009, 33, 848–853. [Google Scholar] [CrossRef]
- Massanet-Nicolau, J.; Dinsdale, R.; Guwy, A.; Shipley, G. Utilising biohydrogen to increase methane production, energy yields and process efficiency via two stage anaerobic digestion of grass. Bioresour. Technol. 2015, 189, 379–383. [Google Scholar] [CrossRef] [PubMed]
- Kim, H.W.; Nam, J.Y.; Shin, H.S. A comparison study on the high-rate co-digestion of sewage sludge and food waste using a temperature-phased anaerobic sequencing batch reactor system. Bioresour. Technol. 2011, 102, 7272–7279. [Google Scholar] [CrossRef] [PubMed]
- Park, J.H.; Lee, S.H.; Yoon, J.J.; Kim, S.H.; Park, H.D. Predominance of cluster I Clostridium in hydrogen fermentation of galactose seeded with various heat-treated anaerobic sludges. Bioresour. Technol. 2014, 157, 98–106. [Google Scholar] [CrossRef]
- Lee, Z.-K.; Li, S.-L.; Kuo, P.-C.; Chen, I.C.; Tien, Y.-M.; Huang, Y.-J.; Chuang, C.-P.; Wong, S.-C.; Cheng, S.-S. Thermophilic bio-energy process study on hydrogen fermentation with vegetable kitchen waste. Int. J. Hydrogen Energy 2010, 35, 13458–13466. [Google Scholar] [CrossRef]
- Lee, D.-Y.; Xu, K.-Q.; Kobayashi, T.; Li, Y.-Y.; Inamori, Y. Effect of organic loading rate on continuous hydrogen production from food waste in submerged anaerobic membrane bioreactor. Int. J. Hydrogen Energy 2014, 39, 16863–16871. [Google Scholar] [CrossRef]
- Rotaru, A.-E.; Shrestha, P.M.; Liu, F.; Shrestha, M.; Shrestha, D.; Embree, M.; Zengler, K.; Wardman, C.; Nevin, K.P.; Lovley, D.R. A new model for electron flow during anaerobic digestion: Direct interspecies electron transfer to Methanosaeta for the reduction of carbon dioxide to methane. Energy Environ. Sci. 2014, 7, 408–415. [Google Scholar] [CrossRef]
- Watanabe, K.; Koyama, M.; Ueda, J.; Ban, S.; Kurosawa, N.; Toda, T. Effect of operating temperature on anaerobic digestion of the Brazilian waterweed Egeria densa and its microbial community. Anaerobe 2017, 47, 8–17. [Google Scholar] [CrossRef]
- Demirel, B.; Scherer, P. The roles of acetotrophic and hydrogenotrophic methanogens during anaerobic conversion of biomass to methane: A review. Rev. Environ. Sci. BioTechnol. 2008, 7, 173–190. [Google Scholar] [CrossRef]
- Zellner, G.; Boone, D.R. Methanofollis. In Bergey’s Manual of Systematics of Archaea and Bacteria; John Wiley and Sons: Hoboken, NJ, USA, 2015. [Google Scholar]
- Kerou, M.; Schleper, C. Nitrososphaera. In Bergey’s Manual of Systematics of Archaea and Bacteria; John Wiley and Sons: Hoboken, NJ, USA, 2015. [Google Scholar]
- Ren, Y.; Yu, M.; Wu, C.; Wang, Q.; Gao, M.; Huang, Q.; Liu, Y. A comprehensive review on food waste anaerobic digestion: Research updates and tendencies. Bioresour. Technol. 2018, 247, 1069–1076. [Google Scholar] [CrossRef] [PubMed]
- Kongjan, P.; O-Thong, S.; Angelidaki, I. Performance and microbial community analysis of two-stage process with extreme thermophilic hydrogen and thermophilic methane production from hydrolysate in UASB reactors. Bioresour. Technol. 2011, 102, 4028–4035. [Google Scholar] [CrossRef] [PubMed]
Figure 1.
Schematic diagrams of experimental apparatus. (a) Two-stage fermentation process; (b) single-stage fermentation process.
Figure 1.
Schematic diagrams of experimental apparatus. (a) Two-stage fermentation process; (b) single-stage fermentation process.


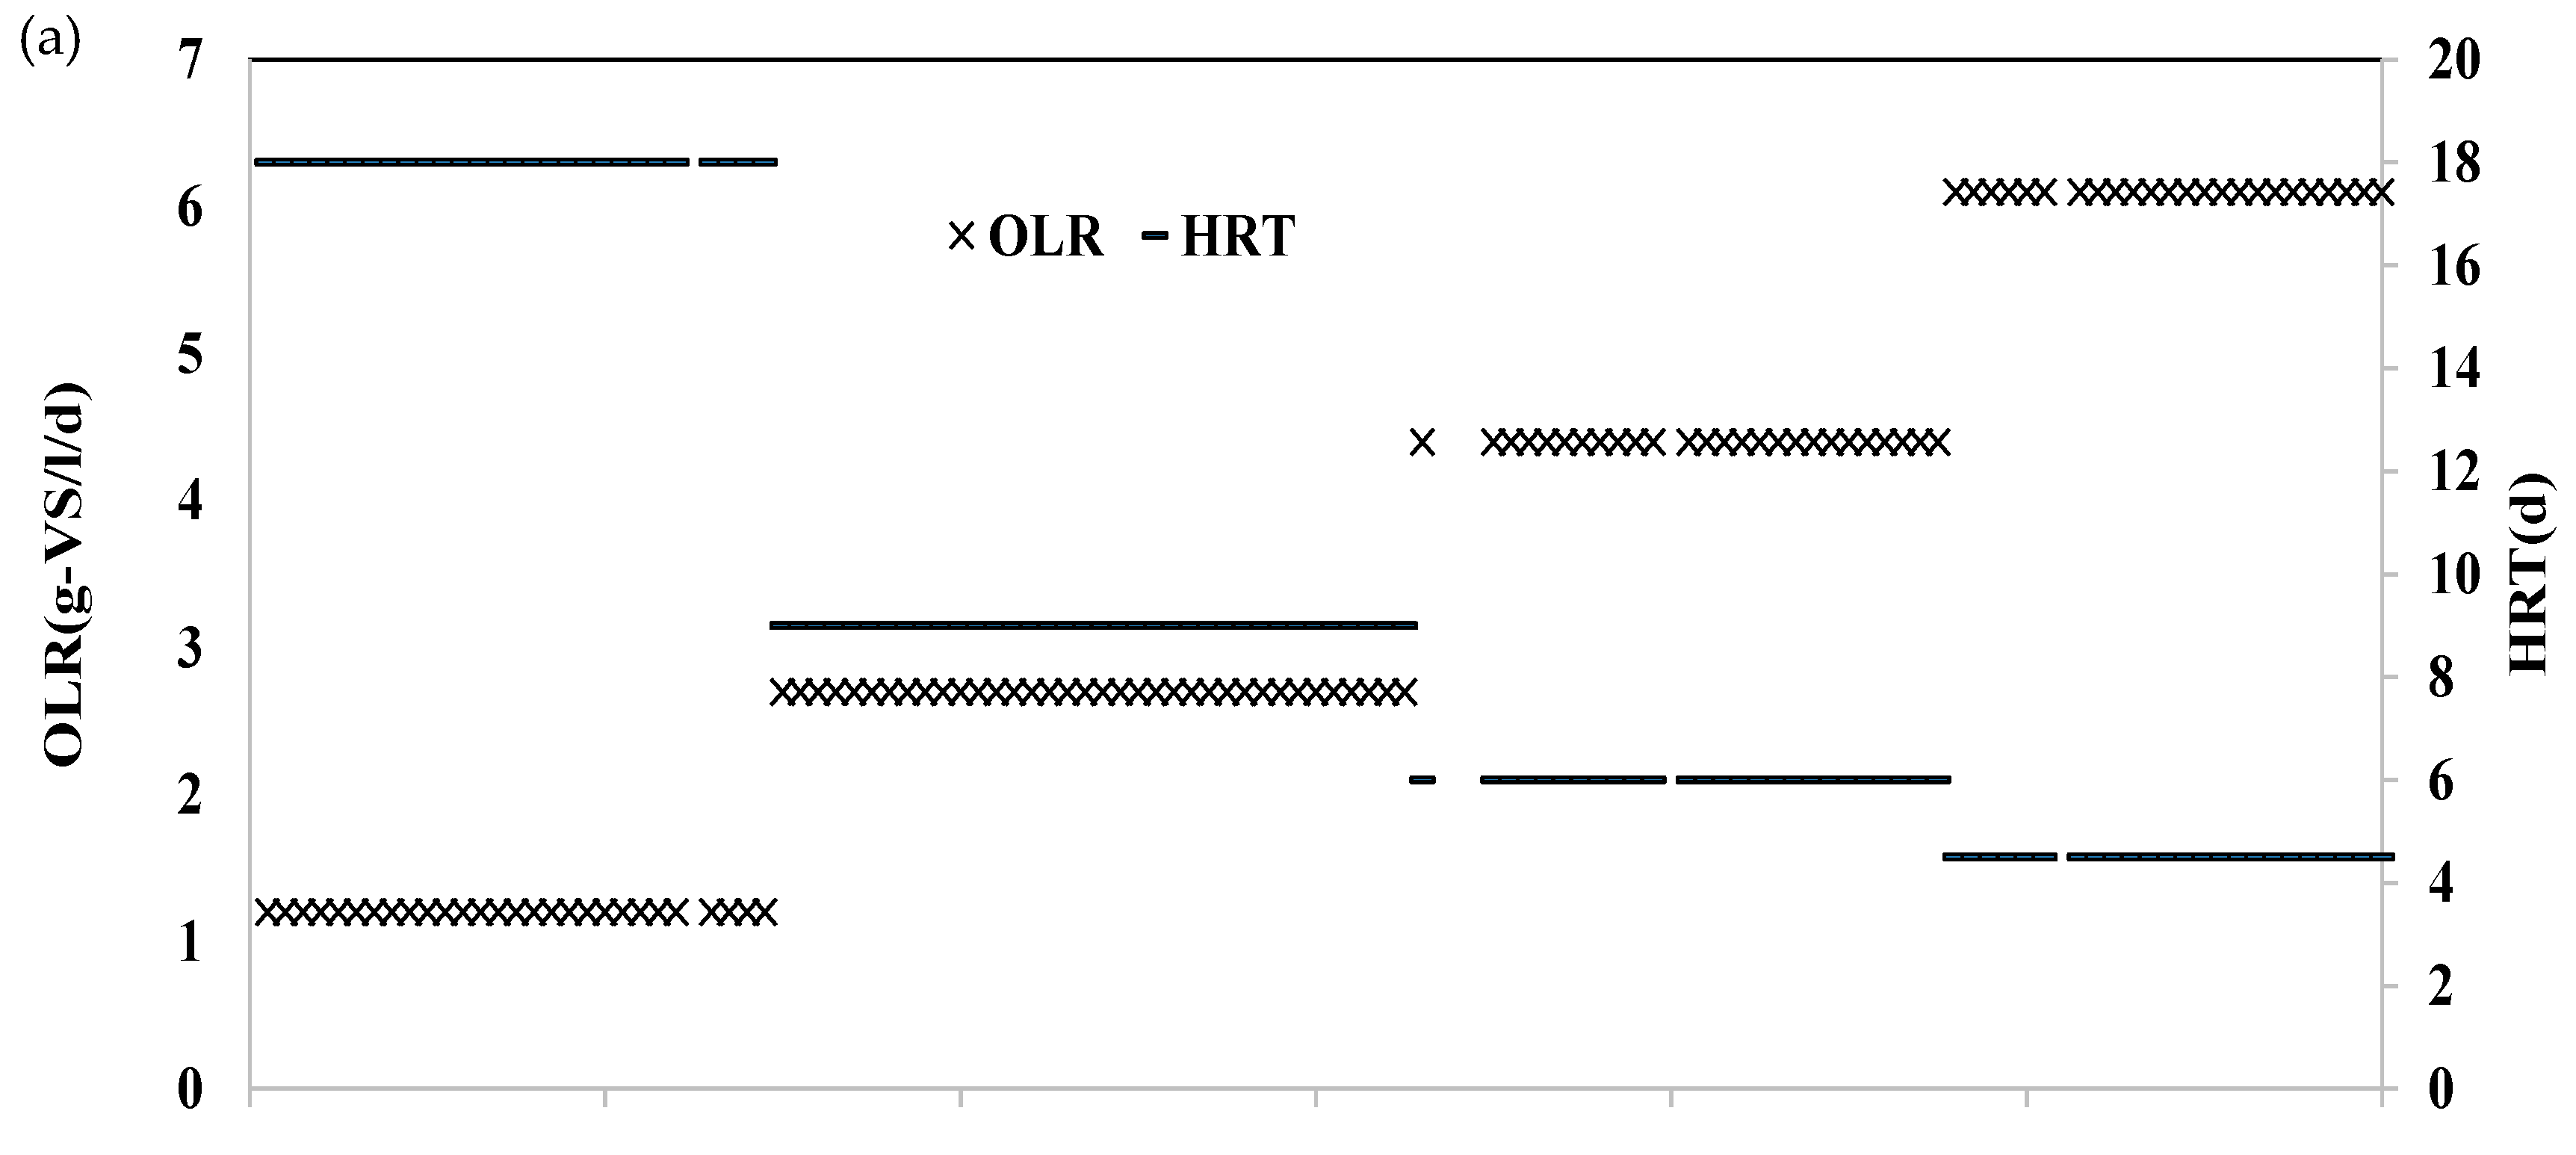
Figure 2.
Time courses of biogas production rate, volatile solid (VS), pH, acetate and butyrate in H2-reactor (HR) at various hydraulic retention times (HRT) and organic loading rates (OLR). (a) HRT and OLR conditions in HR; (b) Hydrogen, carbon dioxide and methane production rates in HR; (c) VS concentration in HR; (d) Acetate content, butyrate content and pH in HR.

Figure 3.
Time courses of biogas production rate, VS, pH and volatile fatty acid (VFA) in MR1 at various HRT and OLR. (a) HRT and OLR conditions in MR1; (b) Methane and carbon dioxide production rate in MR1; (c) VS concentration in MR1; (d) TVFA content and pH in MR1.
Figure 3.
Time courses of biogas production rate, VS, pH and volatile fatty acid (VFA) in MR1 at various HRT and OLR. (a) HRT and OLR conditions in MR1; (b) Methane and carbon dioxide production rate in MR1; (c) VS concentration in MR1; (d) TVFA content and pH in MR1.


Figure 4.
Time courses of biogas production rate, VS, pH, acetate, propionate and VFA in MR2 at various HRT and OLR. (a) HRT and OLR conditions in MR2; (b) Methane and carbon dioxide production rates in MR2; (c) VS concentration in MR2; (d) acetate, propionate and TVFA contents, and pH in MR2.
Figure 4.
Time courses of biogas production rate, VS, pH, acetate, propionate and VFA in MR2 at various HRT and OLR. (a) HRT and OLR conditions in MR2; (b) Methane and carbon dioxide production rates in MR2; (c) VS concentration in MR2; (d) acetate, propionate and TVFA contents, and pH in MR2.

Figure 5.
Phylogenetic tree of the bacterial operational taxonomic units (OTUs) in the thermophilic hydrogen production reactor and their close relatives retrieved in GenBank database based on 16S rRNA gene sequences. The relative abundance of each OTU are shown on the right. Numbers at nodes represent bootstrap values. The scale bar represents 0.05 substitution per nucleotide position. The confidence thresholds of the taxonomic classification for most OTUs illustrated on the right were above 98%, whereas the confidence threshold for OTU-H11 affiliated with phylum Latescibacteria was 87%.

Figure 6.
Phylogenetic tree of the Archaeal OTUs in the CH4-reactors in two-stage and single-stage anaerobic digestion (AD) system and their close relatives retrieved in GenBank database based on 16S rRNA gene sequences. The relative abundance of each OTU are shown on the right. Numbers at nodes represent bootstrap values. The scale bar represents 0.05 substitution per nucleotide position. The confidence thresholds of the taxonomic classification for most OTUs illustrated on the right were above 98%, whereas the confidence threshold for OTU-15, OTU-27 and OTU-28 affiliated with order Methanosarcinales, genus Methanospirillum and genus Methanosaeta were 86%, 94% and 92%, respectively.

Figure 7.
The chemical oxygen demand (COD) conversion efficiency, energy yield, TVFA/alkalinity and additional alkalinity in single-stage and two-stage AD system at various operation conditions. (a) COD conversion efficiency; (b) Energy yield; (c) TVFA/alkalinity and additional alkalinity.
Figure 7.
The chemical oxygen demand (COD) conversion efficiency, energy yield, TVFA/alkalinity and additional alkalinity in single-stage and two-stage AD system at various operation conditions. (a) COD conversion efficiency; (b) Energy yield; (c) TVFA/alkalinity and additional alkalinity.


Table 1.
Characteristics of the substrates and feedstock.
| Parameters | Waste Activated Sludge | Food Waste | Feedstock |
|---|---|---|---|
| pH | 7.1 (0.3) | 5.7 (0.8) | 6.7 (0.5) |
| VS/TS (%) | 69.6 (1.5) | 97.4 (1.8) | 82.3 (1.2) |
| NH4+-N (mg/g-VS) | 0.1 (0.2) | 0.9 (0.6) | 0.6 (0.3) |
| Soluble COD (mg/g-VS) | 9.6 (11.4) | 549.3 (95.7) | 310.0 (51.9) |
| Soluble Protein (mg/g-VS) | 0.2 (0.4) | 18.8 (6.5) | 10.2 (3.5) |
| Soluble Carbohydrate (mg/g-VS) | 0.3 (0.2) | 287.2 (45.6) | 155.3 (24.6) |
| Total COD (mg/g-VS) | 1514.9 (153.1) | 1129.9 (78.0) | 1307.0 (82.0) |
| Total Carbohydrate (mg/g-VS) | 138.2 (18.3) | 647.6 (79.7) | 413.3 (43.9) |
| Alkalinity (mg-CaCO3/g-VS) | 8.6 (2.1) | 0.2 (0.1) | 4.1 (1.0) |
Standard deviations are shown in brackets, number of samples is 11.
Table 2.
The operating conditions in the experiment.
| H2-Reactor | Two-Stage CH4-Reactor | Single-Stage CH4-Reactor | Running Time (d) | ||||
|---|---|---|---|---|---|---|---|
| HRT (d) | OLR (g-VS/L/d) | HRT (d) | OLR (g-VS/L/d) | HRT (d) | OLR (g-VS/L/d) | ||
| Operation 1 | 3.3 | 9.1 | 18 | 1.2 | 36 | 1.2 | 1~30 |
| Operation 2 | 1.6 | 19.0 | 9 | 2.7 | 18 | 2.4 | 31~66 |
| Operation 3 | 1.1 | 29.3 | 6 | 4.4 | 12 | 3.6 | 67~96 |
| Operation 4 | 0.8 | 39.6 | 4.5 | 6.1 | 9 | 4.5 | 97~120 |
Table 3.
The operational performances in H2-reactor at various hydraulic retention times (HRT) and organic loading rates (OLR).
Table 3.
The operational performances in H2-reactor at various hydraulic retention times (HRT) and organic loading rates (OLR).
| Items | Unit | Operation 1 | Operation 2 | Operation 3 | Operation 4 | |
|---|---|---|---|---|---|---|
| Biogas | H2 production rate | mL-H2/L/d | 211.6 (66.5) | 574.8 (198.8) | 1294.8 (396.8) | 2057.1 (349.8) |
| H2 yield | mL/g-VS | 31.6 (2.3) | 42.9 (1.7) | 64.5 (1.5) | 76.8 (0.7) | |
| H2 content | % | 60.0% (5.0%) | 60.9% (7.8%) | 60.0% (4.3%) | 54.5% (5.6%) | |
| CH4 content | % | a | 0.09% (0.2%) | 1.0% (1.3%) | 0.3% (0.4%) | |
| CO2 content | % | 40.0% (5.0%) | 39.4% (7.9%) | 49.9% (4.4%) | 35.5% (5.0%) | |
| Digestate | pH | 5.24 (0.21) | 5.29 (0.39) | 5.21 (0.19) | 5.19 (0.15) | |
| TVFA | mg/L | 3988.1 (893.2) | 3642.5 (556.2) | 5326.7 (1384.1) | 4858 (965.8) | |
| NH4+-N | mg-N/L | 208.5 (29.8) | 147.0 (23.2) | 115.1 (44.0) | 80.9 (15.3) | |
| Alkalinity | g-CaCO3/d | 1.44 (0.27) | 1.45 (0.22) | 2.18 (0.37) | 2.28 (0.56) | |
| VS | g/L | 22.29 (3.06) | 24.14 (3.77) | 25.94 (2.08) | 27.39 (1.45) | |
| Total COD | g/L | 34.7 (4.5) | 38.7 (6.3) | 44.9 (2.9) | 47.0 (4.4) | |
| Soluble COD | g/L | 9.2 (3.2) | 9.6 (3.1) | 12.5 (1.7) | 13.4 (5.7) | |
| Total carbohydrate | g/L | 2.2 (0.4) | 2.6 (0.7) | 2.8 (1.5) | 4.0 (0.7) | |
| Soluble carbohydrate | g/L | 0.16 (0.04) | 0.17 (0.07) | 0.22 (0.5) | 0.41 (0.05) | |
| Soluble protein | g/L | 0.31 (0.07) | 0.39 (0.1) | 0.53 (0.1) | 0.53 (0.1) | |
a Not detectable; (): Standard deviation. Biogas, pH, VFA and VS were determined every day and the other liquid samples were determined every four days.
Table 4.
The operational performances in two-stage and single-stage CH4-reactor at various HRT and OLR.
Table 4.
The operational performances in two-stage and single-stage CH4-reactor at various HRT and OLR.
| Items | Unit | Operation 1 | Operation 2 | Operation 3 | Operation 4 | ||||
|---|---|---|---|---|---|---|---|---|---|
| MR1 | MR2 | MR1 | MR2 | MR1 | MR2 | MR1 | MR2 | ||
| Biogas | |||||||||
| CH4 production rate | mL-CH4/L/d | 149.43 (38.6) I | 150.3 (25.2) I | 332.4 (84.7) S | 222.9 (29.9) S | 558.5 (100.9) S | 286.2 (138.6) S | 713.6 (73.9) S | 357.8 (62.2) |
| CH4 yield | mL/g-VS | 122.1 (2.1) I | 122.0 (4.8) I | 137.6 (1.1) S | 92.2 (0.8) S | 154.1 (0.6) S | 79.9 (2.9) S | 147.6 (0.2) S | 74.4 (0.7) |
| CH4 content | % | 81.3% (3.8%) S | 64.1% (3.3%) S | 76.6% (5.1%) S | 56.3% (3.4%) S | 80.6% (3.0%) S | 57.4% (6.6%) S | 71.5% (5.3%) S | 53.4% (4.1%) S |
| CO2 content | % | 18.7% (4.1%) S | 35.9% (3.3%) S | 23.4% (5.3%) S | 43.7% (3.4%) S | 19.4% (3.1%) S | 42.6% (6.9%) S | 28.5% (5.9%) S | 46.6% (4.3%) S |
| Digestate | |||||||||
| pH | 7.23 (0.16) S | 7.05 (0.12) S | 7.40 (0.23) S | 7.11 (0.24) S | 7.08 (0.19) S | 6.79 (0.22) S | 7.02 (0.08) S | 6.76 (0.14) S | |
| TVFA | mg/L | 16.9 (58.7) I | 5.4 (6.4) I | 113.0 (222.5) S | 16.1 (24.9) S | 40.8 (48.0) S | 1387.9 (676.6) S | 156.5 (118.7) S | 1981 (525.9) S |
| NH4+-N | mg-N/L | 462.8 (37.4) S | 250.6 (22.1) S | 300.4 (69.7) S | 87.8 (61.4) S | 269.0 (33.0) S | 13.0 (18.3) S | 224.3 (26.7) S | a |
| Alkalinity | g-CaCO3/d | 2.83 (0.28) S | 2.06 (0.37) S | 2.44 (0.41) S | 1.66 (0.49) S | 3.84 (0.51) S | 4.14 (0.60) S | 3.96 (0.47) I | 3.77 (0.75) I |
| VS | g/L | 15.74 (0.54) S | 17.42 (0.39) S | 18.42 (1.27) S | 21.18 (1.49) S | 19.89 (0.60) S | 24.08 (1.21) S | 20.63 (0.77) S | 25.01 (0.93) S |
| Total COD | g/L | 22.9 (2.2) I | 26.8 (3.0) I | 27.9 (2.2) I | 30.1 (5.0) I | 31.4 (4.0) S | 41.2 (6.0) S | 34.7 (2.5) S | 42.5 (1.5) S |
| Soluble COD | g/L | 1.3 (1.6) I | 1.6 (0.9) I | 1.8 (0.7) S | 3.2 (1.1) S | 1.7 (0.7) S | 6.1 (2.3) S | 2.7 (0.6) S | 7.4 (0.7) S |
| Total carbohydrate | g/L | 1.9 (0.2) I | 2.1 (0.1) I | 2.4 (0.3) S | 2.5 (0.5) S | 2.5 (0.4) S | 2.6 (0.5) S | 3.4 (0.5) S | 3.8 (0.5) S |
| Soluble carbohydrate | g/L | 0.06 (0.01) S | 0.09 (0.01) S | 0.14 (0.2) I | 0.27 (0.2) I | 0.1 (0.04) I | 0.2 (0.1) I | 0.14 (0.04) I | 0.37 (0.1) I |
| Soluble protein | g/L | 0.23 (0.05) I | 0.29 (0.1) I | 0.28 (0.1) S | 0.62 (0.1) S | 0.34 (0.1) I | 0.84 (0.5) I | 0.53 (0.2) S | 1.57 (0.3) S |
a: Not detectable; (): Standard deviation. Biogas, pH, VFA and VS were sampled every day and the other liquid samples were sampled every four days; S and I respectively represent to the significant difference (p < 0.05) and insignificant difference (p > 0.05) between MR1 and MR2. The samples for ANOVA were selected from the later period of each stage when the performance was stable, and result data was shown in Table S1.
© 2019 by the authors. Licensee MDPI, Basel, Switzerland. This article is an open access article distributed under the terms and conditions of the Creative Commons Attribution (CC BY) license (http://creativecommons.org/licenses/by/4.0/).
Share and Cite
MDPI and ACS Style
Liu, X.; Li, R.; Ji, M. Effects of Two-Stage Operation on Stability and Efficiency in Co-Digestion of Food Waste and Waste Activated Sludge. Energies 2019, 12, 2748. https://doi.org/10.3390/en12142748
AMA Style
Liu X, Li R, Ji M. Effects of Two-Stage Operation on Stability and Efficiency in Co-Digestion of Food Waste and Waste Activated Sludge. Energies. 2019; 12(14):2748. https://doi.org/10.3390/en12142748
Chicago/Turabian StyleLiu, Xinyuan, Ruying Li, and Min Ji. 2019. "Effects of Two-Stage Operation on Stability and Efficiency in Co-Digestion of Food Waste and Waste Activated Sludge" Energies 12, no. 14: 2748. https://doi.org/10.3390/en12142748
Note that from the first issue of 2016, this journal uses article numbers instead of page numbers. See further details here.