1. Introduction
The use of solar systems based on evacuated-tube collectors (ETC) to supply hot water has experienced rapid growth in recent years, highlighting its use in the residential sector. This expansion has been especially significant in China, Europe and Japan as a result of the increase in the supply of evacuated-tube collectors [
1], with the consequent drop in prices.
The advantages of evacuated-tube collectors compared to other collectors have contributed to their expansion and generalization. Evacuated-tube collectors can operate at higher temperatures than flat solar collectors (FPC) [
2,
3]. In addition, the vacuum reduces the losses by convection and conduction, presents better performance when the conditions become unfavourable during the cold, cloudy and windy days [
4]. According to Sokhansefat et al. [
5], the performance of an ETC system is 41% better than a FPC system, and the yearly useful energy gain of ETC is 30% more than that of FPC in cold climates.
Solar Water Heating Systems (SWHS) with ETC collectors have been widely studied for their use in the residential sector. In the case of heating systems with natural circulation by thermosyphon, circulation rate through evacuated tube solar collector is influenced by two main factors: the amount of solar radiation received by the absorber surface and the inlet fluid temperature from the tank (the circulation rate can oscillate between 20 kg/h for a tank temperature of 17 °C and up to 35 kg/h when the tank is at 60 °C) [
6]. The circulation flow rate can be correlated in terms of solar input, tank temperature, inclination collector, and tube aspect ratio [
7]. Nevertheless, in this type of system it is the temperature difference that induces the movement of the fluid and enables the heating of the water tank. Thus, the conclusions drawn are not applicable to active systems.
In active systems, several studies analyse the variation of the system performance according to temperatures of the tank typical in residential uses, like for example, at 37 °C, 45 °C, and 55 °C [
8], at 40 °C, 45 °C, 50 °C and 55 °C [
9], etc.
Despite the advantages of SWHS with ETC, its implantation in the industrial sector is much more limited than in the residential sector. For example, in Spain, 80% of solar thermal energy is concentrated in the residential sector, 19% in commerce, services and public administration, leaving industrial use relegated to less than 1% [
10]. This is due, to a large extent, to the fact that in the industrial sector large volumes of water are usually required at higher temperatures than in the residential sector.
In 2015, the final energy sector of the industrial sector and the residential sector in EU-28 were practically the same, with just over 25% each [
11]. To increase the urban generation of renewable energy and energy saving in cities, efforts should be redoubled in the industrial sector, given their importance and location in the periphery of cities.
Research to produce water at a higher temperature is scarce. Pei et al. analyse the performance in meeting different temperature requirements (26.9 °C, 55 °C, 65 °C, 75 °C, 85 °C, and 95 °C) of a compound parabolic concentrator (CPC) solar water-heater system in winter [
12] and a comparison without a mini-CPC reflector [
13]. In the case of systems without a concentrator, Porras-Prieto et al. [
14] and Mazarron et al. [
15] analysed the variations of performance and profitability of a SWHS-ETC depending on the water temperature required (40 °C, 50 °C, 60 °C, 70 °C and 80 °C), showing that the drop in performance is triggered in the higher temperature range.
Among the wide casuistry of demand for hot water in industry, there are numerous processes that require water at a temperature equal to or greater than 90 °C. For example, in agri-food industries (warehouses, meat industries, dairy industry, etc.) for thermal treatments of food, as well as for cleaning and disinfecting tanks and barrels, machinery and pipes, bottles, and so on; in washing operations in the recycling of plastic materials; in desalination processes, and so on.
Given the existing knowledge gap, the present work characterizes the behaviour of a SWHS-ETC with active circulation to produce hot water at 90 °C, determining its performance, energy saving and potential profitability in different scenarios in Europe.
2. Material and Methods
In the first place, it has been necessary to design an experimental solar system, monitoring its operation in water production at 90 °C. The designed system would be equivalent to an installation in which the number of solar collectors was designed so that the tank water reaches 90 °C on the days of the highest irradiation and temperature of the year, supplying all the necessary energy. Thus, it is intended to reduce the energy contribution of a conventional supply system as much as possible but avoid the oversizing of the system.
The data obtained allowed us to carry out the energy characterization of the SWHS, quantifying its efficiency and the capacity of the system to reach 90 °C in the tank.
After the characterization of the solar system in the experimental location, a model based on the UNE-EN12975-2 standard is proposed that allows estimating the potential energy saving of the SWHS depending on the irradiation and the ambient temperature. It has been assumed that the behaviour of the system will be reproduced in larger facilities as long as the ratio between collector area and tank volume is maintained.
To have an overview of the profitability of the SWHS, six European capitals with different irradiation, ambient temperature and energy price have been analysed. In each location, the energy saving has been estimated using the proposed model. Starting from energy saving, the profitabilityof the system has been determined considering 3 conventional energy supply systems used in the industrial sector (electricity, gas and diesel).
In each of the locations, a sensitivity analysis has been performed, calculating the variations in profitability by changing key parameters (installation cost, conventional energy price, etc.). The results obtained synthesize the analysis of thousands of cases.
2.1. Solar Water Heating System
In order to achieve the objectives, the programming of an experimental solar system used in previous works [
14,
15,
16] has been modified. The SWHS is installed on the roof of the building of the Higher Technical School of Agronomic, Food and Biosystems Engineering of the Polytechnic University of Madrid and reproduces the current commercial systems with active circulation.
Figure 1 shows the main components of the experimental system, consisting of an energy capture subsystem, a distribution and accumulation subsystem, a control subsystem and a monitoring subsystem.
The selected ETC collector is model SP-S58/1800-24 of WesTech Solar. This collector has 24 vacuum tubes, a net collection area of 2 m2.
The tank installed is of the brand THERMOR model IAV 80/100 with exchange system through coil (0.53 m2 exchange surface and interior volume of 3.5 L exchanger) and 80 L capacity. It presents high density thermal insulation and a glazed stainless steel container. The copper pipes have an inner diameter of 20 mm and a thickness of 1 mm and are coated with 13 mm-thick insulation materials (0.040 W m−1 °C−1, at 20 °C). The pump used was the Wilo-Star-ST 15/6 ECO-3 submerged rotor model (4.5 m head, 0.2 m3 h−1). Water has been used as a heat transfer fluid.
The control subsystem installed consists of two regulatory subunits: a controller Allegro 453 of the firm Sonder Control, responsible for controlling the operation of the pump of the collector circuit (original controller of the system) and an automat SIEMENS PLC logo that controls the emptying of the tank. Control probes (SC1-SC3) are of type PTC 1000, temperature range −50 °C +150 °C and accuracy of ±0.15 °C at 0 °C. The controller 1 turns the pump of the circuit of the collector when there is a temperature difference of 4 °C between the sensor in the collector (SC1) and the sensor at the bottom of the tank, near the exchanger (SC2). The controller 1 stops the pump when the difference drops below 2 °C.
The system was programmed to produce water at 90 °C, maximizing the energy savings achieved, but without oversizing the system. It is intended to determine the maximum production potential of the system. For this, the controller 2 opens the emptying electro-valve when it detects the sensor SC3 in the top of the tank near the exit-registers a temperature of 92 °C. The download ends when the controller 2 detects that the temperature sensor SC3 has reaches 88 °C, closing the electro-valve. This condition ensures obtaining a volume of water approximate to the desired temperature.
The hot water outlet at the top is produced by the pressure of the supply network, with the input of the same volume of cold water through the connection to the supply pipe at the bottom thereof, provided with a diffuser to avoid breaking the stratification of the water in the tank.
Moreover, every day before sunrise the tank is completely emptied and filled with cold water from the supply network; the maximum water production potential at 90 °C of the system is monitored. The controller keeps the valve open for 15 min, enough to completely evacuate the volume of the tank and replacing it with the same volume of cold water from the supply network. Thus, the temperature recorded by the three sensors located inside the tank (T6, T7 and T8) tends to equalize. The complete filling of the tank ensures daily similar starting conditions for the experiment.
The programming of the experiment, designed to achieve maximum energy savings without oversizing the system, would reproduce, for example, the operation of an optimized SWHS in an industry with a demand for hot water at high temperature; concentrated late in the afternoon (such as cleaning activities in the food industry). For this, the number of solar collectors would have to be designed to reach 90 °C on the days of highest irradiation and temperature of the year. The model for estimating energy savings that will be proposed in the next section allows us to carry out this optimization, based on the energy required to heat the water to 90 °C and the irradiation and temperature data. It is assumed that the relationship between the collector area and the volume of the selected tank (2 m2 for 80 L) will remain constant.
Sensors and data loggers have been installed to obtain and store all the necessary information about the collection, accumulation, and control subsystems. For monitoring the temperature, we used 10 probes (T1-T10) PTC 100 type, with temperature range from −50 °C to 150 °C and accuracy of ±0.15 °C at 0 °C. The probes have been placed at strategic points in the installation, directly in contact with the fluid through holes designed for this purpose, hermetically sealed.
For flow monitoring, two mechanical flowmeters with digital readout were installed: one near the inlet of the collector, which measures the flow of the primary circuit; and one on the hot water tank, which records the volume of hot water provided.
To record data from the previously mentioned parameters two units of data acquisition equipment Datataker signature mod DT50 have been used, being placed in a sealed box.
The meteorological parameters were recorded using a Micro Weather Station HOBO Micro-HWS. Solar radiation is measured using a pyranometer HOBO Weather Station Smart Silicon Pyranometer Sensor for Total Solar radiation. This self-powered sensor measures the radiation between 300 and 1100 nanometres. The pyranometer has a measuring range between 0 and 1280 W m−2, with accuracy of ±10 W m−2 or ±5%. The pyranometer was installed with the same angle of inclination as the vacuum tubes.
The monitoring period was carried out every day of a year, with an interval of 2 min. Due to the failure of a sensor, the analysed data cover from July 2016 to May 2017.
2.2. Energy Characterization of the SWHS
Variables widely used by several authors (for example, [
17,
18,
19]) for the energy characterization of the SWHS have been calculated from the experimental data, such as the useful energy captured by the collector and its efficiency, the useful energy transferred to the tank and its efficiency and the losses in the supply pipes.
(a) Useful power extracted from the collector
The useful power captured by the collector and assigned to the heat transfer fluid has been calculated as the temperature difference of the fluid at the inlet and outlet of the collector:
(b) Efficiency of the collector
The efficiency of the collector has been calculated from the monitored data, considering the useful power extracted from the collector and the solar irradiation:
(c) Useful power transferred to the tank
The power transferred to the tank through the exchanger has been calculated as the temperature difference of the flow at the inlet and outlet of the tank:
(d) Efficiency of the system
The efficiency of the system was calculated considering the energy transferred to the tank as a useful energy, dividing the useful power transferred to the tank by the solar irradiation:
(e) Power losses in the supply pipes of the primary circuit
The losses in the pipes were calculated as the difference between the useful power extracted from the collector and the power transferred to the tank:
The energy has been calculated from the power equations, multiplying said power by the time interval corresponding to the measurement, expressing said energy in electric billing units (Wh and kWh).
The energy values calculated have been expressed with respect to the effective area of the collector, that is, dividing the values by 2 m2. Although in some cases the variable does not depend directly on the surface of the collector, as in the case of losses in the pipes, these values facilitate comparison with those obtained by other authors with different collector surfaces.
2.3. Validation of a Model to Estimate Energy Savings
For the estimation of the useful energy supplied by the SWHS during a whole year in different locations, a system performance model based on the one used to characterize the solar collectors in the standard UNE-EN12975-2 has been taken [
20]:
where
is the reduced temperature difference (T
m − T
a) G
−1.
Taking into account that it is intended to determine the energy savings of the solar system as a whole (energy available in the tank), and not the energy captured by the collector (Qc), the collector temperature (T
m) has been replaced by the required temperature (90 °C). Multiplying all the terms by the irradiation (G), the useful power that will be transformed into energy saving is estimated:
The constants of the system equation (
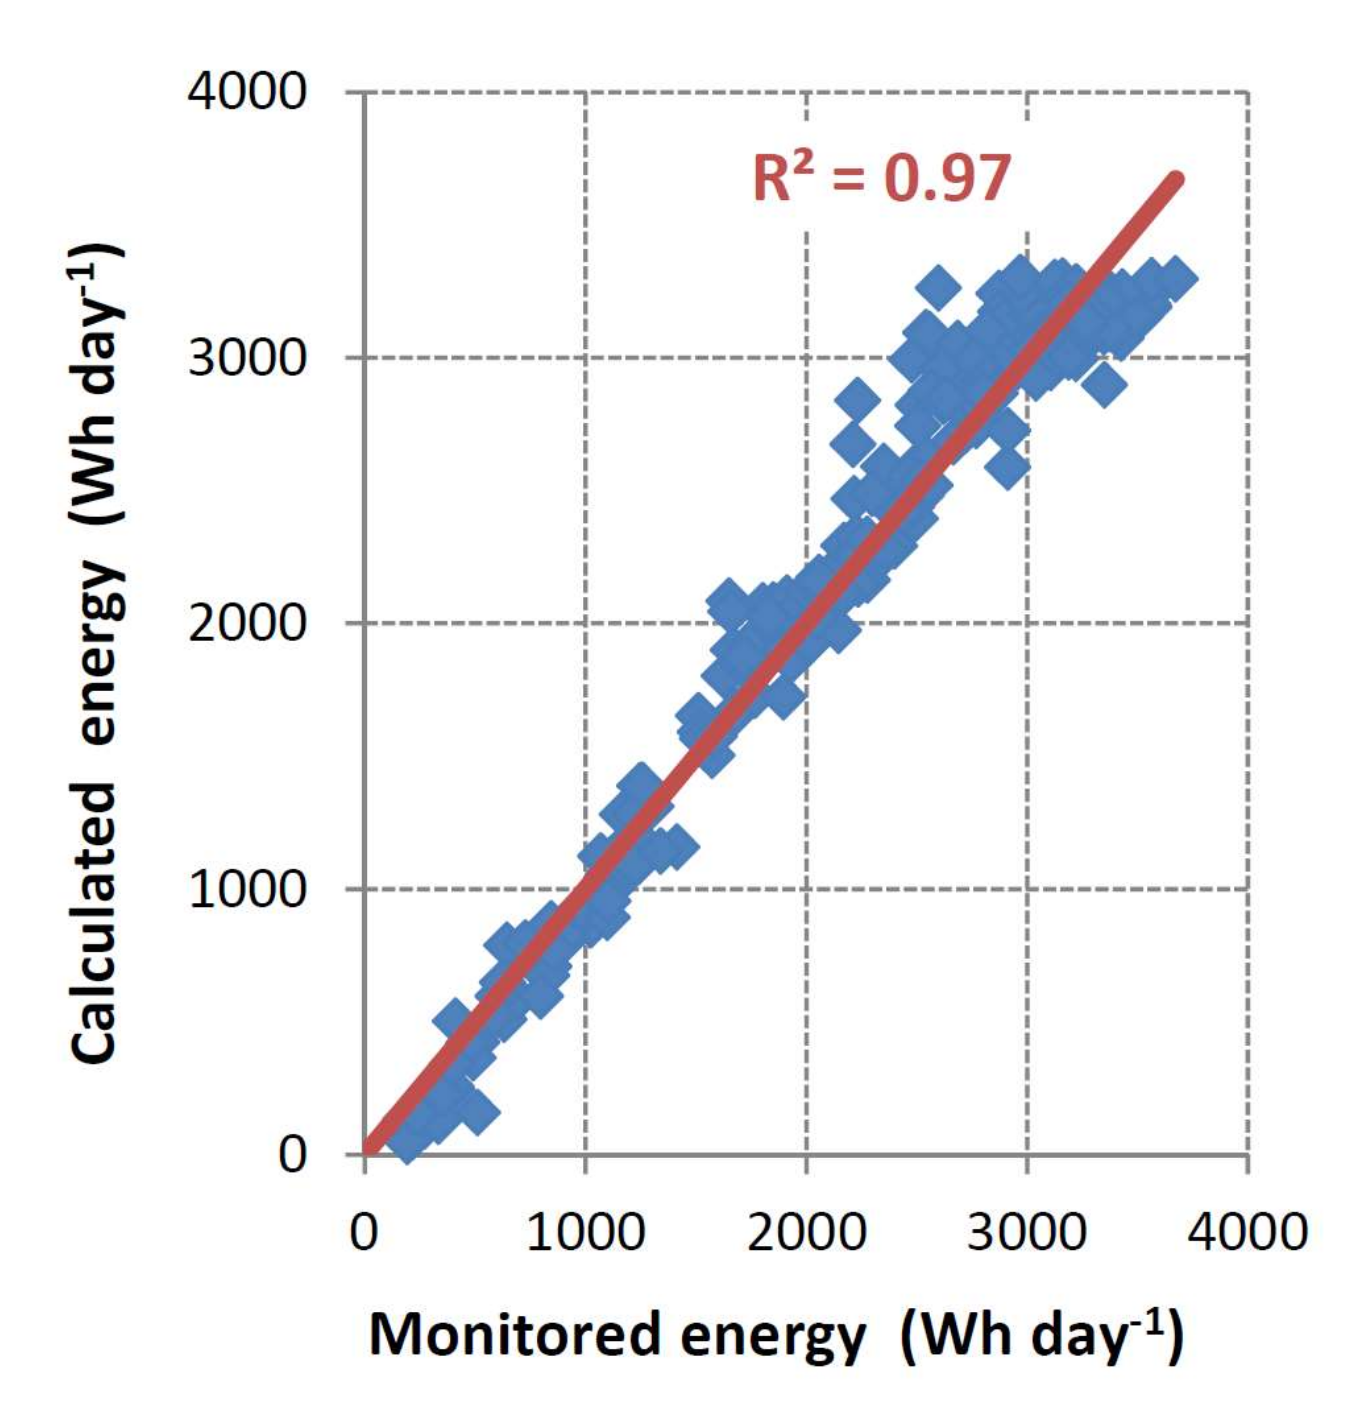
) have been calculated to obtain the lowest annual average error compared to the monitoring data, being
,
and
. The accuracy of the model against the experimental data has been satisfactory, with an R
2 of 0.97, an average error of the absolute values of 143 Wh m
−2 d
−1, being the absolute value of the sum of the errors (taking into account the sign) equal to zero (
Figure 2).
2.4. Financial Evaluation
The profitability study will be carried out in the event of a complementary supply system, since the SWHS is not capable of supplying a certain demand every day of the year. Given the great casuistry existing in the industry, three types of conventional supply will be analysed: 100% efficiency electric boiler, diesel boiler of 90.9% (at nominal heat power and high temperature regime) and gas boiler of 97.4% (at nominal heat power and high temperature regime).
The profitability of the SWHS has been evaluated in 6 European capitals with different irradiation, ambient temperature and energy price, in particular, Athens, Berlin, London, Madrid, Paris and Rome. To maximize the irradiation received, the collectors have been oriented to the south, using the approximate latitude of the place as the inclination of the collectors [
21], specifically, 38°, 52°, 51°, 40°, 49° and 42° respectively for the cities mentioned previously. The ambient temperature and the solar radiation incident in the plane of the collector have been determined using the EnergyPlus program, using data from its climatological files (* epw).
The return on investment has been calculated based on annual cash flows. Payment differences between the solar installation (responsible for the payments after the investment in the same) and the conventional supply alternative (installation responsible for the payments before the investment) will allow quantification of the savings generated by the investment, through the payback and the net present value (NPV)/investment ratio.
For the calculation of the profitability indicators, the following parameters have been assumed for a reference scenario:
Investment: 700 m−2, including assembly (indicative price for a medium-sized installation based on values published in recent papers and data obtained from manufacturers and distributors of solar equipment). The price of conventional supply facilities will not be taken into account, since it is assumed that these facilities are present in the industry.
The useful life of the facility has been set at 20 years.
Discount rate: a value of 1.5% has been assumed, moderate risk for the purchase of 20-Year government bond in 2017 (German bond 0.9%, French 1.5%, British 1.8%, Spanish 2.4%, etc.).
Maintenance: an annual SWHS maintenance cost of 2% of the investment has been assumed.
National energy prices, see
Table 1.
CO2 emissions: average emission values published by the Ministry of Agriculture, Fisheries and Food of Spain have been considered, specifically: 0.29 kg CO2 kWh−1 for electricity, 0.202 kg CO2 kWh−1 for natural gas and 2.868 kg CO2 L−1 for diesel.
In each of the locations, a sensitivity analysis will be performed on the reference scenario, calculating the variations in profitability by changing the installation cost, the price of conventional energy, the energy savings provided by the SWHS and the useful life of the installation. In the analysis of each of the parameters, between 50 and 300 different cases will be studied depending on the parameter, assuming that the rest of the variables remain constant. The results of the study show the variations in profitability in thousands of different cases.
3. Results and Discussion
3.1. Energy Characterization of the SWHS
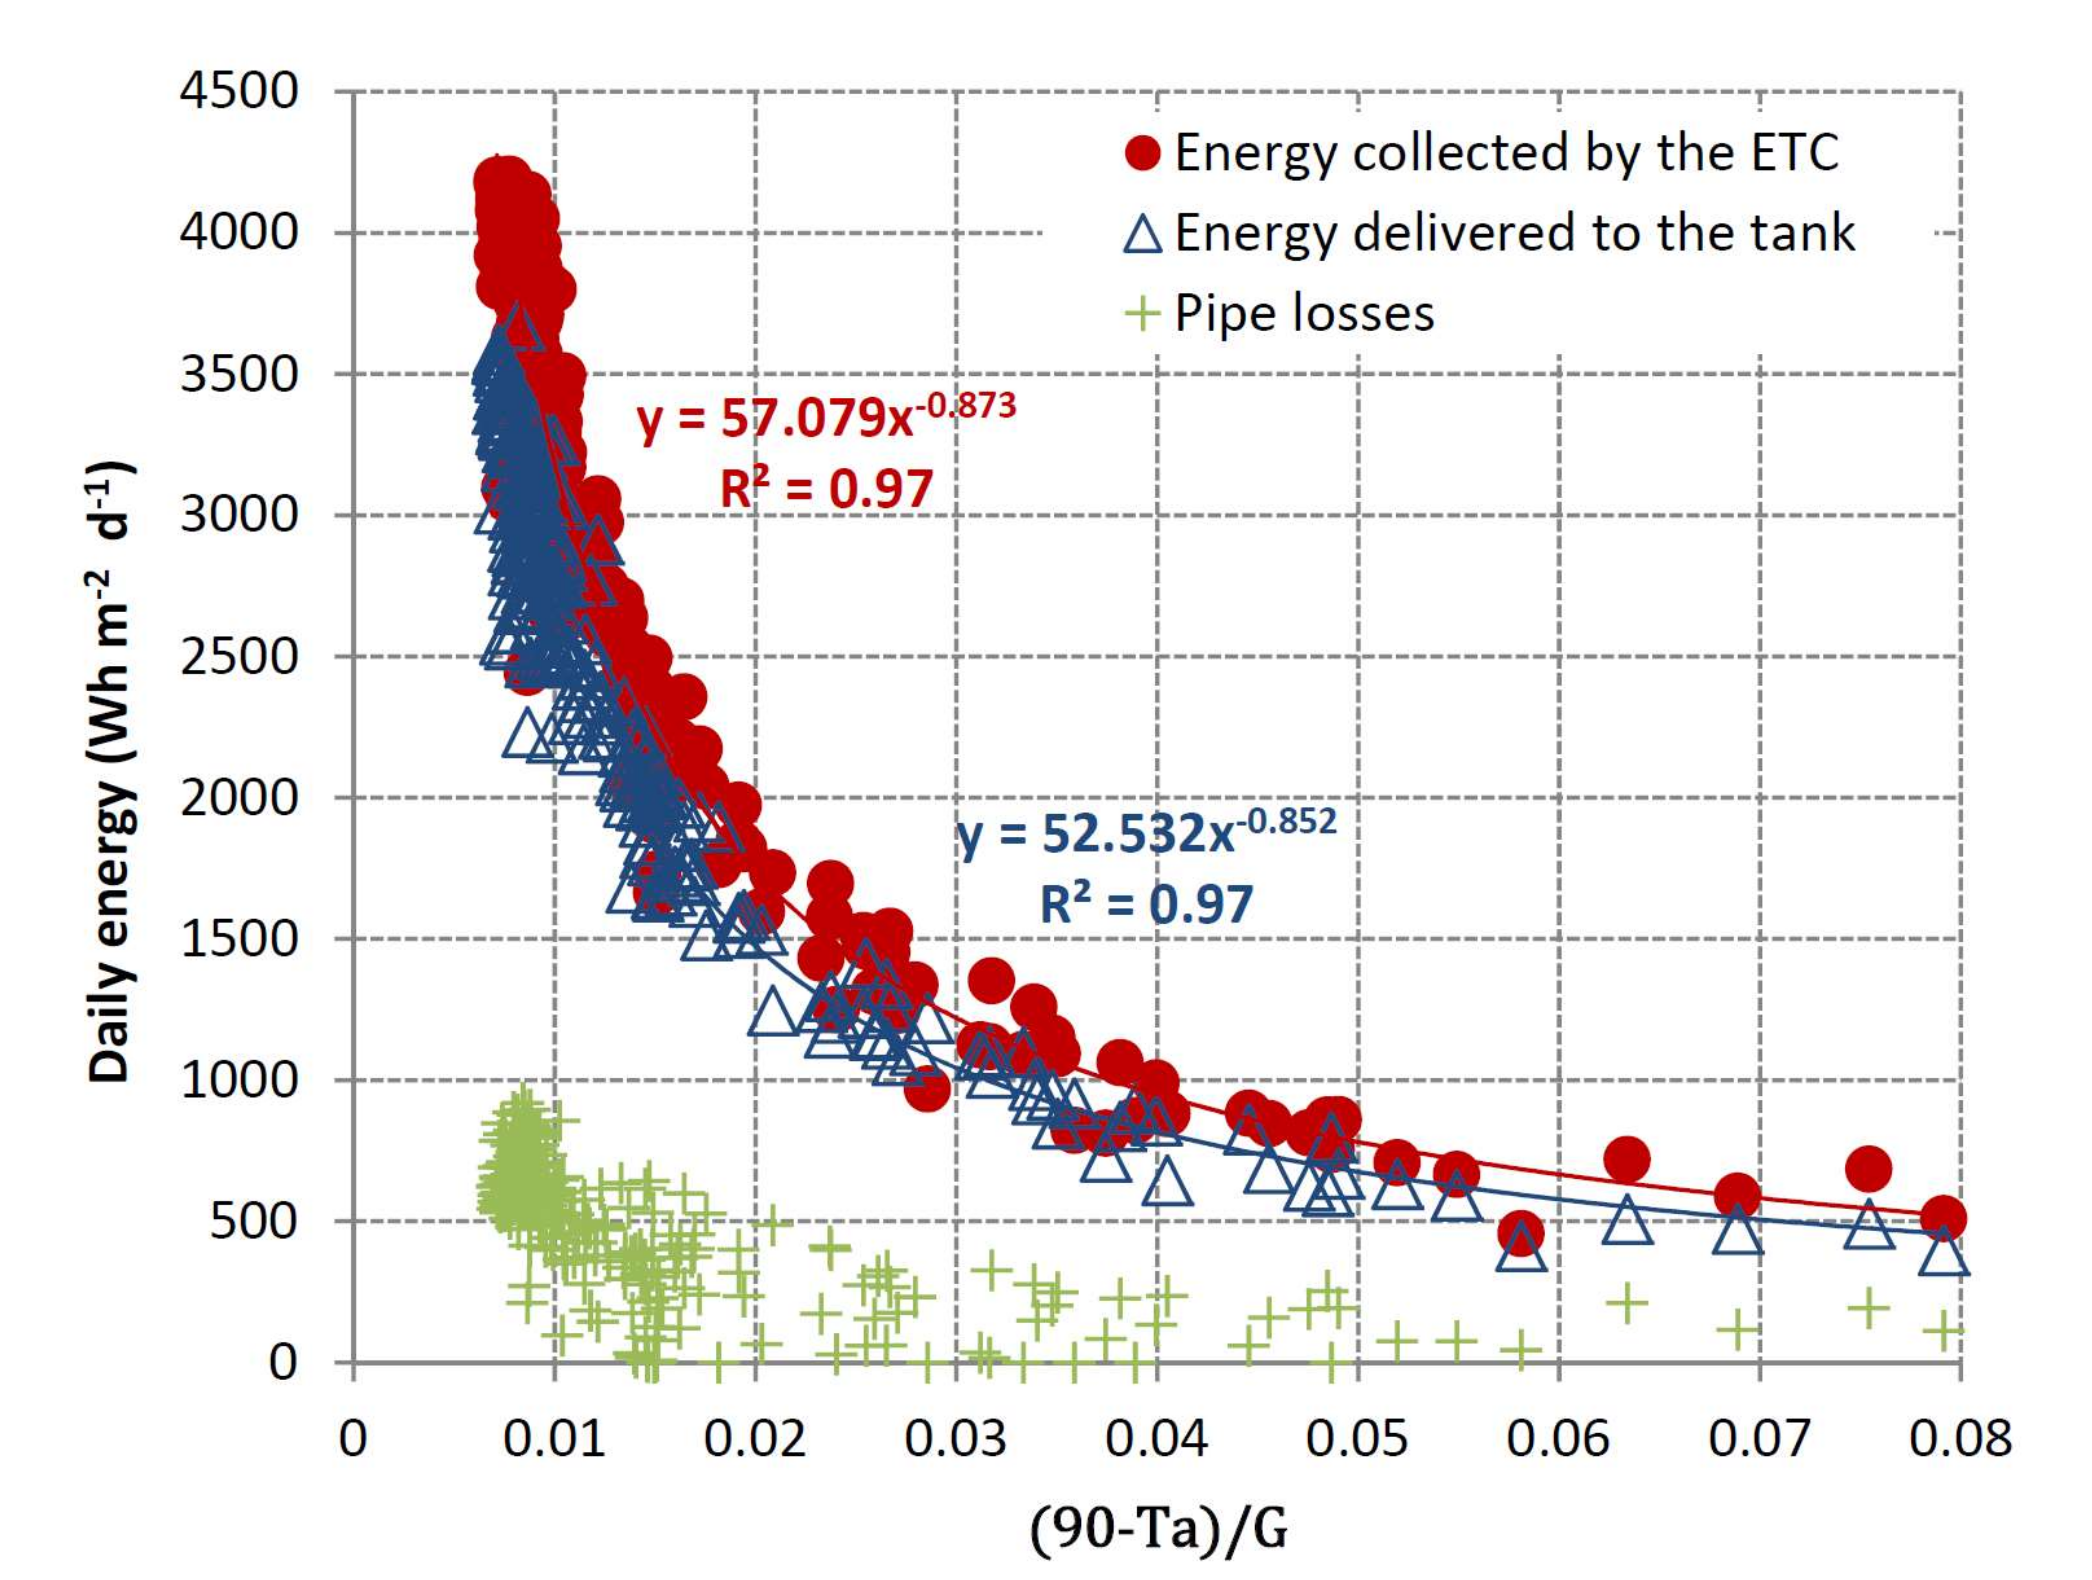
The useful energy extracted from the collector increases following a potential model, as the solar irradiation increases and the thermal jump decreases with respect to the required temperature (90 °C) (
Figure 3). The daily energy collected by the ETC reaches values above 4 kWh on the days of highest irradiation and temperature of the year. The annual efficiency for heating water to 90 °C is 48 ± 5% (
Figure 4).
When comparing these results with those obtained in previous works [
14,
15] which analyse lower required temperatures (from 40 °C to 80 °C), a drop in the collector’s efficiency due to the increase in temperature is observed. With respect to 80 °C the yield is 15% lower, reducing 25% compared to the production of water at 40 °C. At temperatures of the heat transfer fluid close to 90 °C, the operating hours of the system are reduced, since the controller stops the circulation before sunset because it does not reach a sufficient thermal gap.
On the other hand, the high temperature required leads to pipe losses that connect the collector and the tank, despite being adequately isolated, so that the energy transferred to the tank is also reduced compared to cases of lower required temperature. The maximum available useful energy values reach 3500 Wh m
−2 d
−1 (
Figure 3). This behaviour translates into relatively low efficiency values for the high irradiance of Madrid (40 ± 3%) (
Figure 4).
On the other hand, there are few days when a temperature of 90 °C is reached in the tank, taking into account a configuration of 80 L for 2 m
2 of collector (
Figure 5); These days correspond to those of higher irradiation and temperature of the year. Most days it would be necessary to use a complementary energy supply system to increase the water temperature to 90 °C.
The results shown refer to the scenario of maximum reduction of energy saving, without over-dimensioning the system. In industries that demand a large volume of water at 90 °C throughout the day, the temperature of the tank would be reduced at each discharge, and the system performance would increase. However, the contribution of the conventional supply system would have to be higher, so the overall energy savings generated in the industry would be reduced. The opposite case would be that of an industry in which the solar installation was over-sized; in this case the water in the tank would reach 90 °C much more frequently and the performance would be reduced with respect to the one calculated. The energy saving would be greater, but at the cost of reducing the performance and profitability of the solar installation.
3.2. Energy Saving
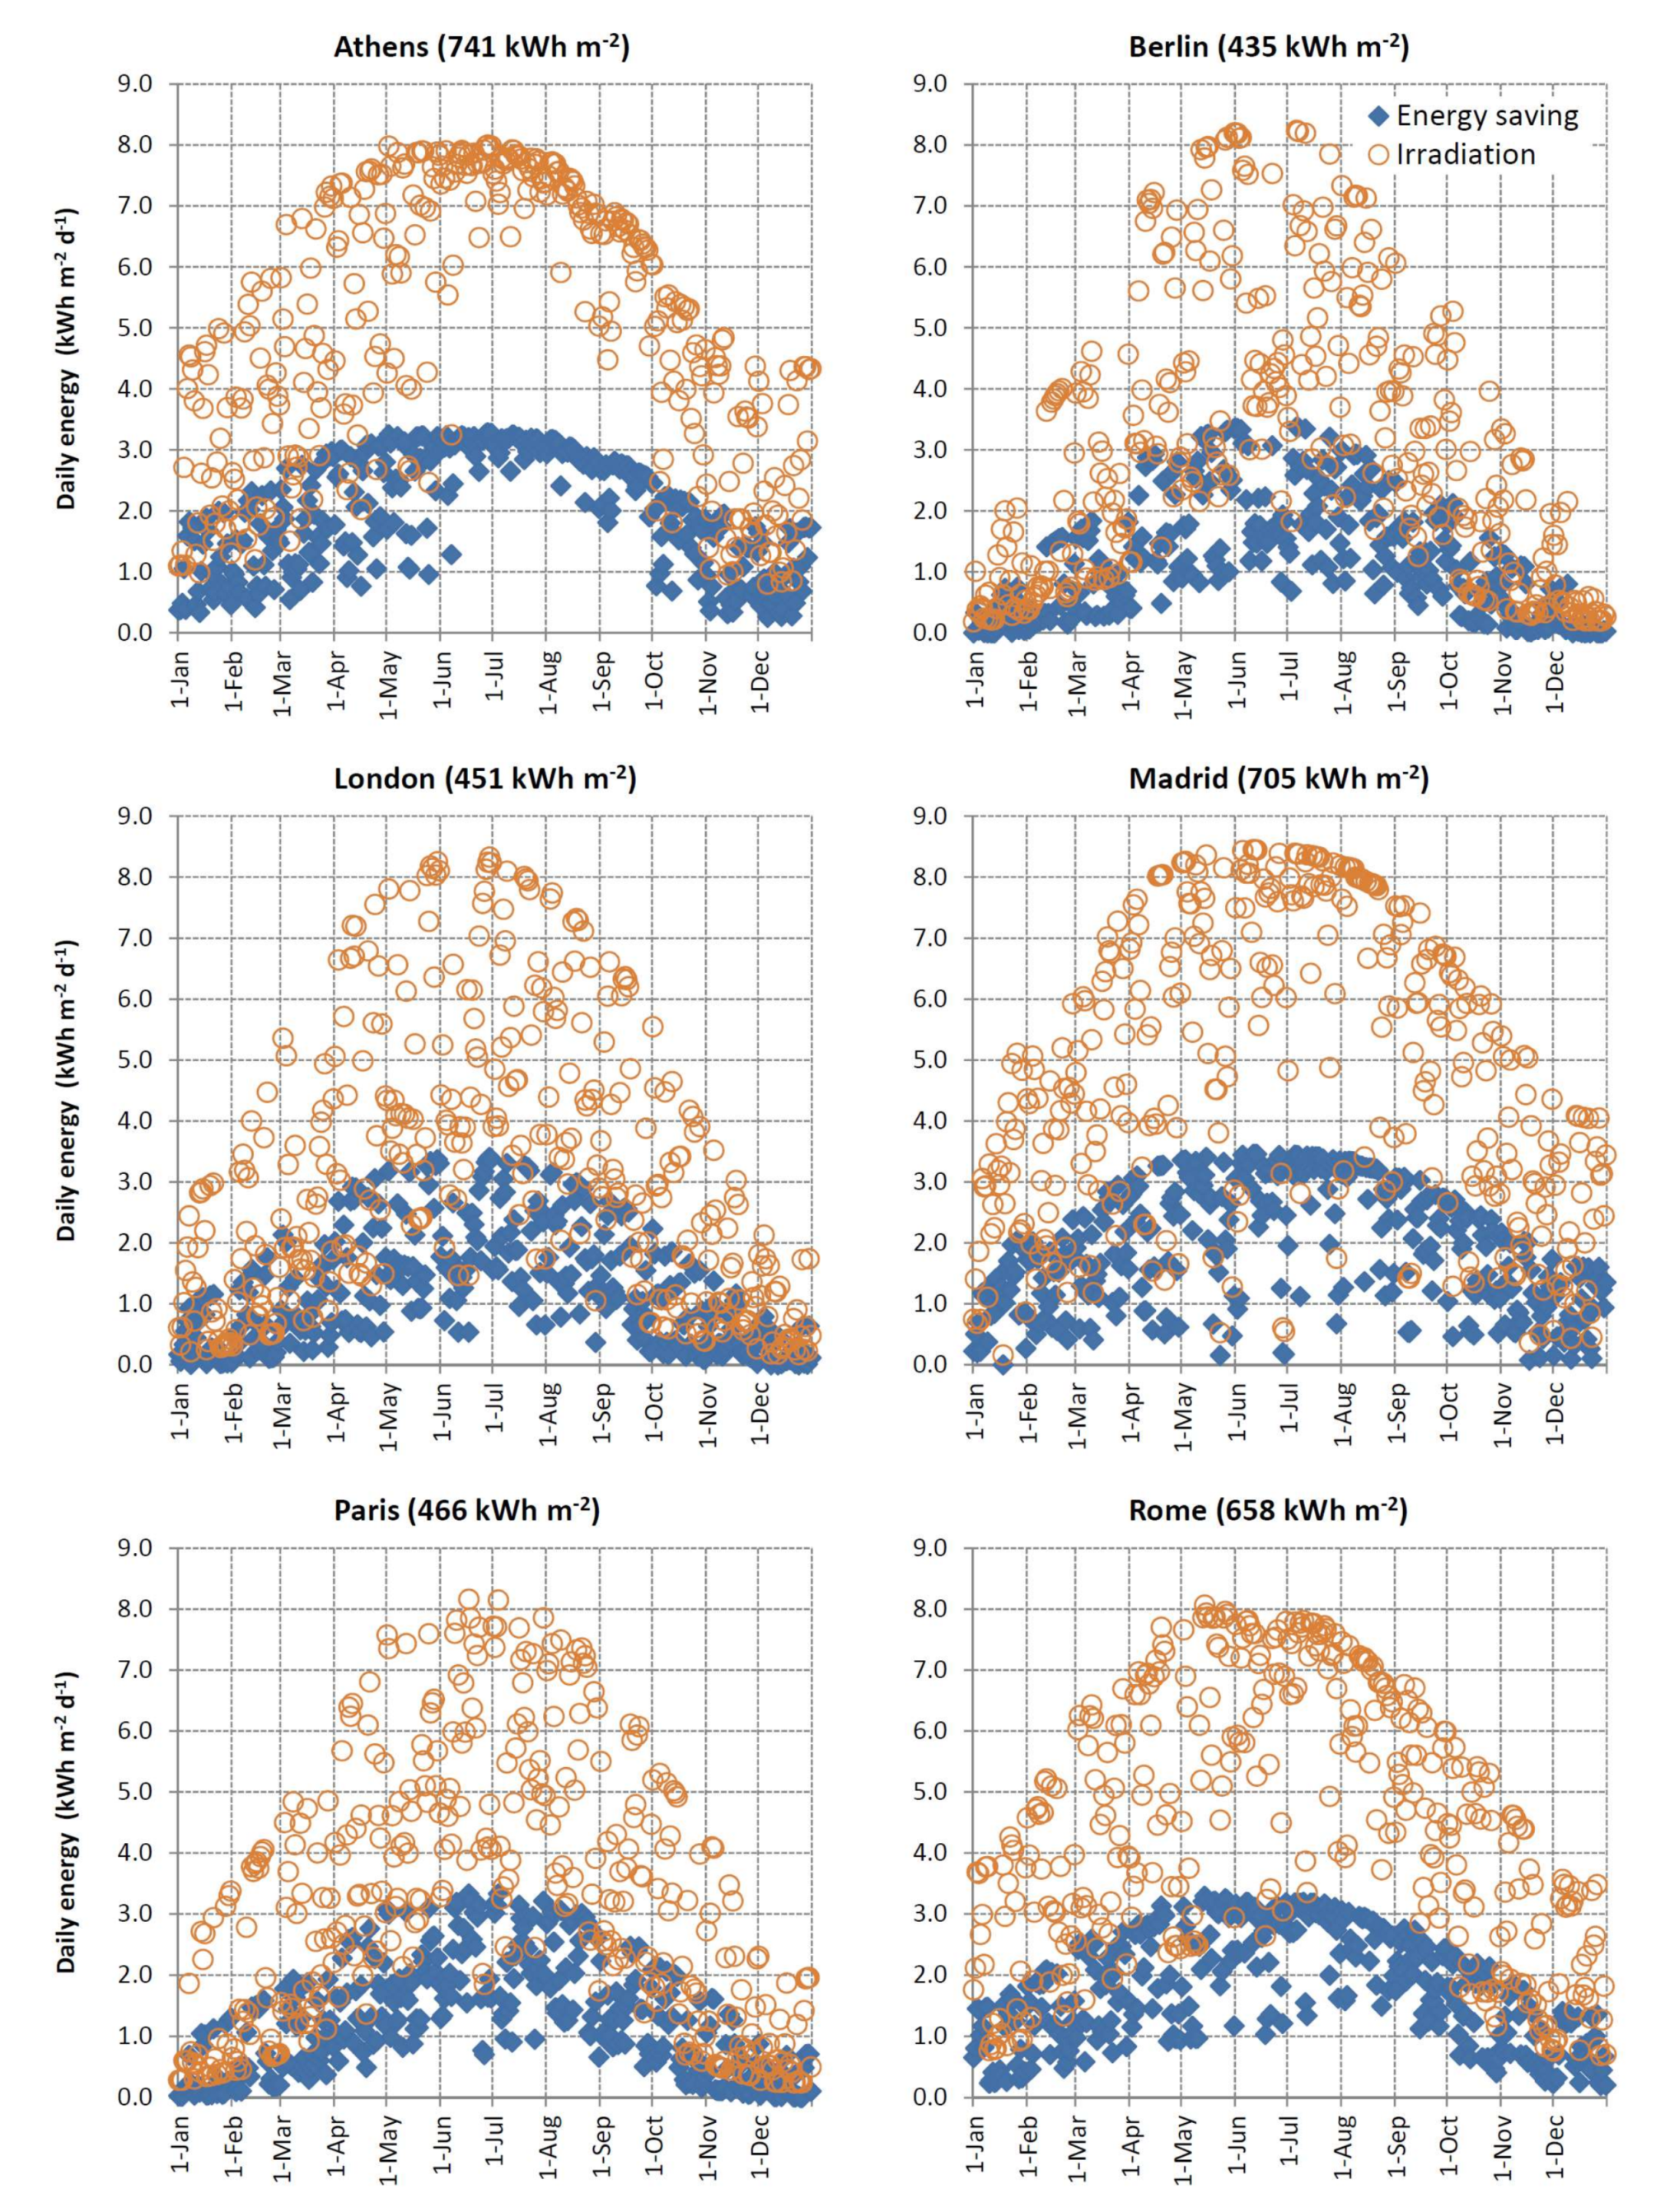
Based on the model proposed (Equation (7)), the energy savings that SWHS could generate over a full year in the six European capitals mentioned have been estimated (
Figure 6). For this, irradiation and ambient temperature data of a typical year have been used, available in the climatological files of the energy simulation program EnergyPlus.
The useful energy supplied annually by the SWHS would reach 741 kWh m−2 in Athens, 435 kWh m−2 in Berlin, 451 kWh m−2 in London, 705 kWh m−2 in Madrid, 466 kWh m−2 in Paris and 658 kWh m−2 in Rome. These values would translate into reductions in CO2 emissions per m2 of collector between 126 and 215 kg CO2 if the existing supply in the industry is through electric boilers, between 88 and 150 kg CO2 if it is by gas, and between 125 and 213 kg CO2 if it is through diesel boilers.
3.3. Profitability
The energy saving data have been used to determine the profitability of the system in the six selected capitals, considering in each one 3 types of conventional supply existing in the industry and thousands of possible changes in the main variables assumed (SWHS cost, useful life of installation, price of energy and energy saving).
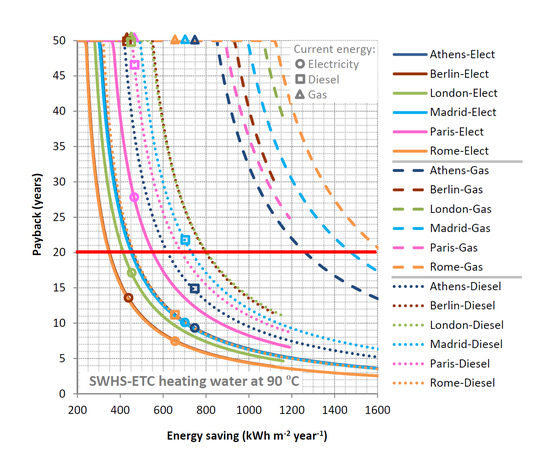
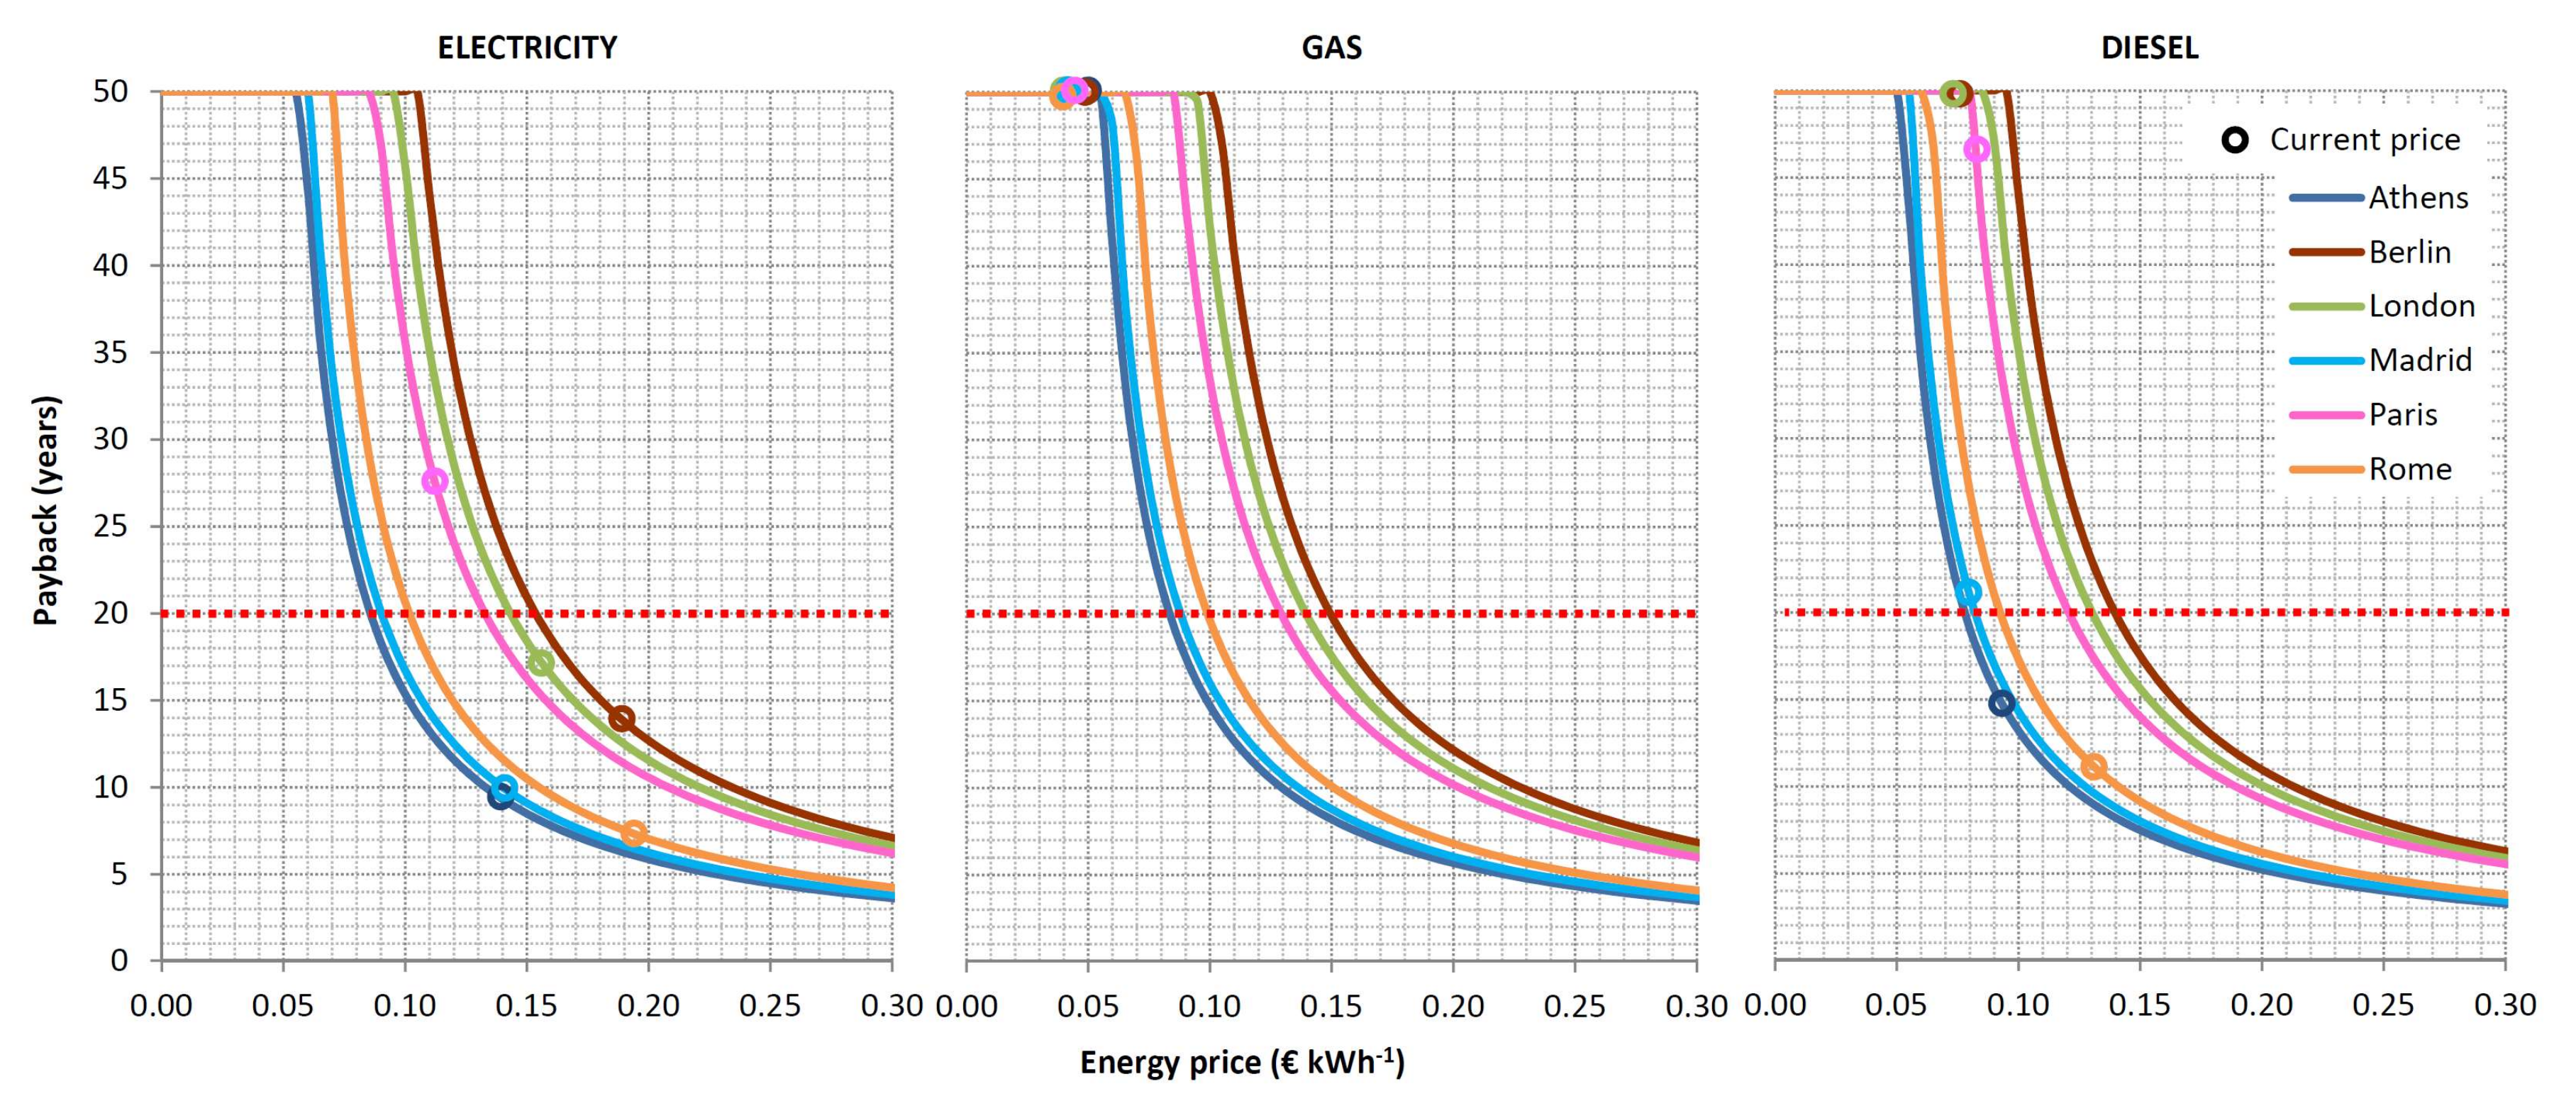
The results show that the energy price of the conventional supply system is the most determining factor for the investment in the SWHS to be profitable. In none of the six locations would the SWHS be profitable if the industry has a gas boiler, given the low price of kWh in all European countries (
Figure 7). Current gas prices (represented by triangles in
Figure 7) would have to double to reach the break-even point.
Instead, in most locations positive profitability values are reached if the existing supply in the industry is made by electric boilers (circles in
Figure 7). Thus, paybacks between 7 and 17 years are obtained, except in the case of Paris, where the low price of electricity raises the payback by more than 20 years.
In the diesel boiler scenarios, the SWHS would be profitable in the locations of higher irradiation and temperature (
Figure 7). However, moderate increases in the price of diesel would lead to significant reductions in the payback in scenarios such as Paris and Madrid (strong slopes of the profitability curves).
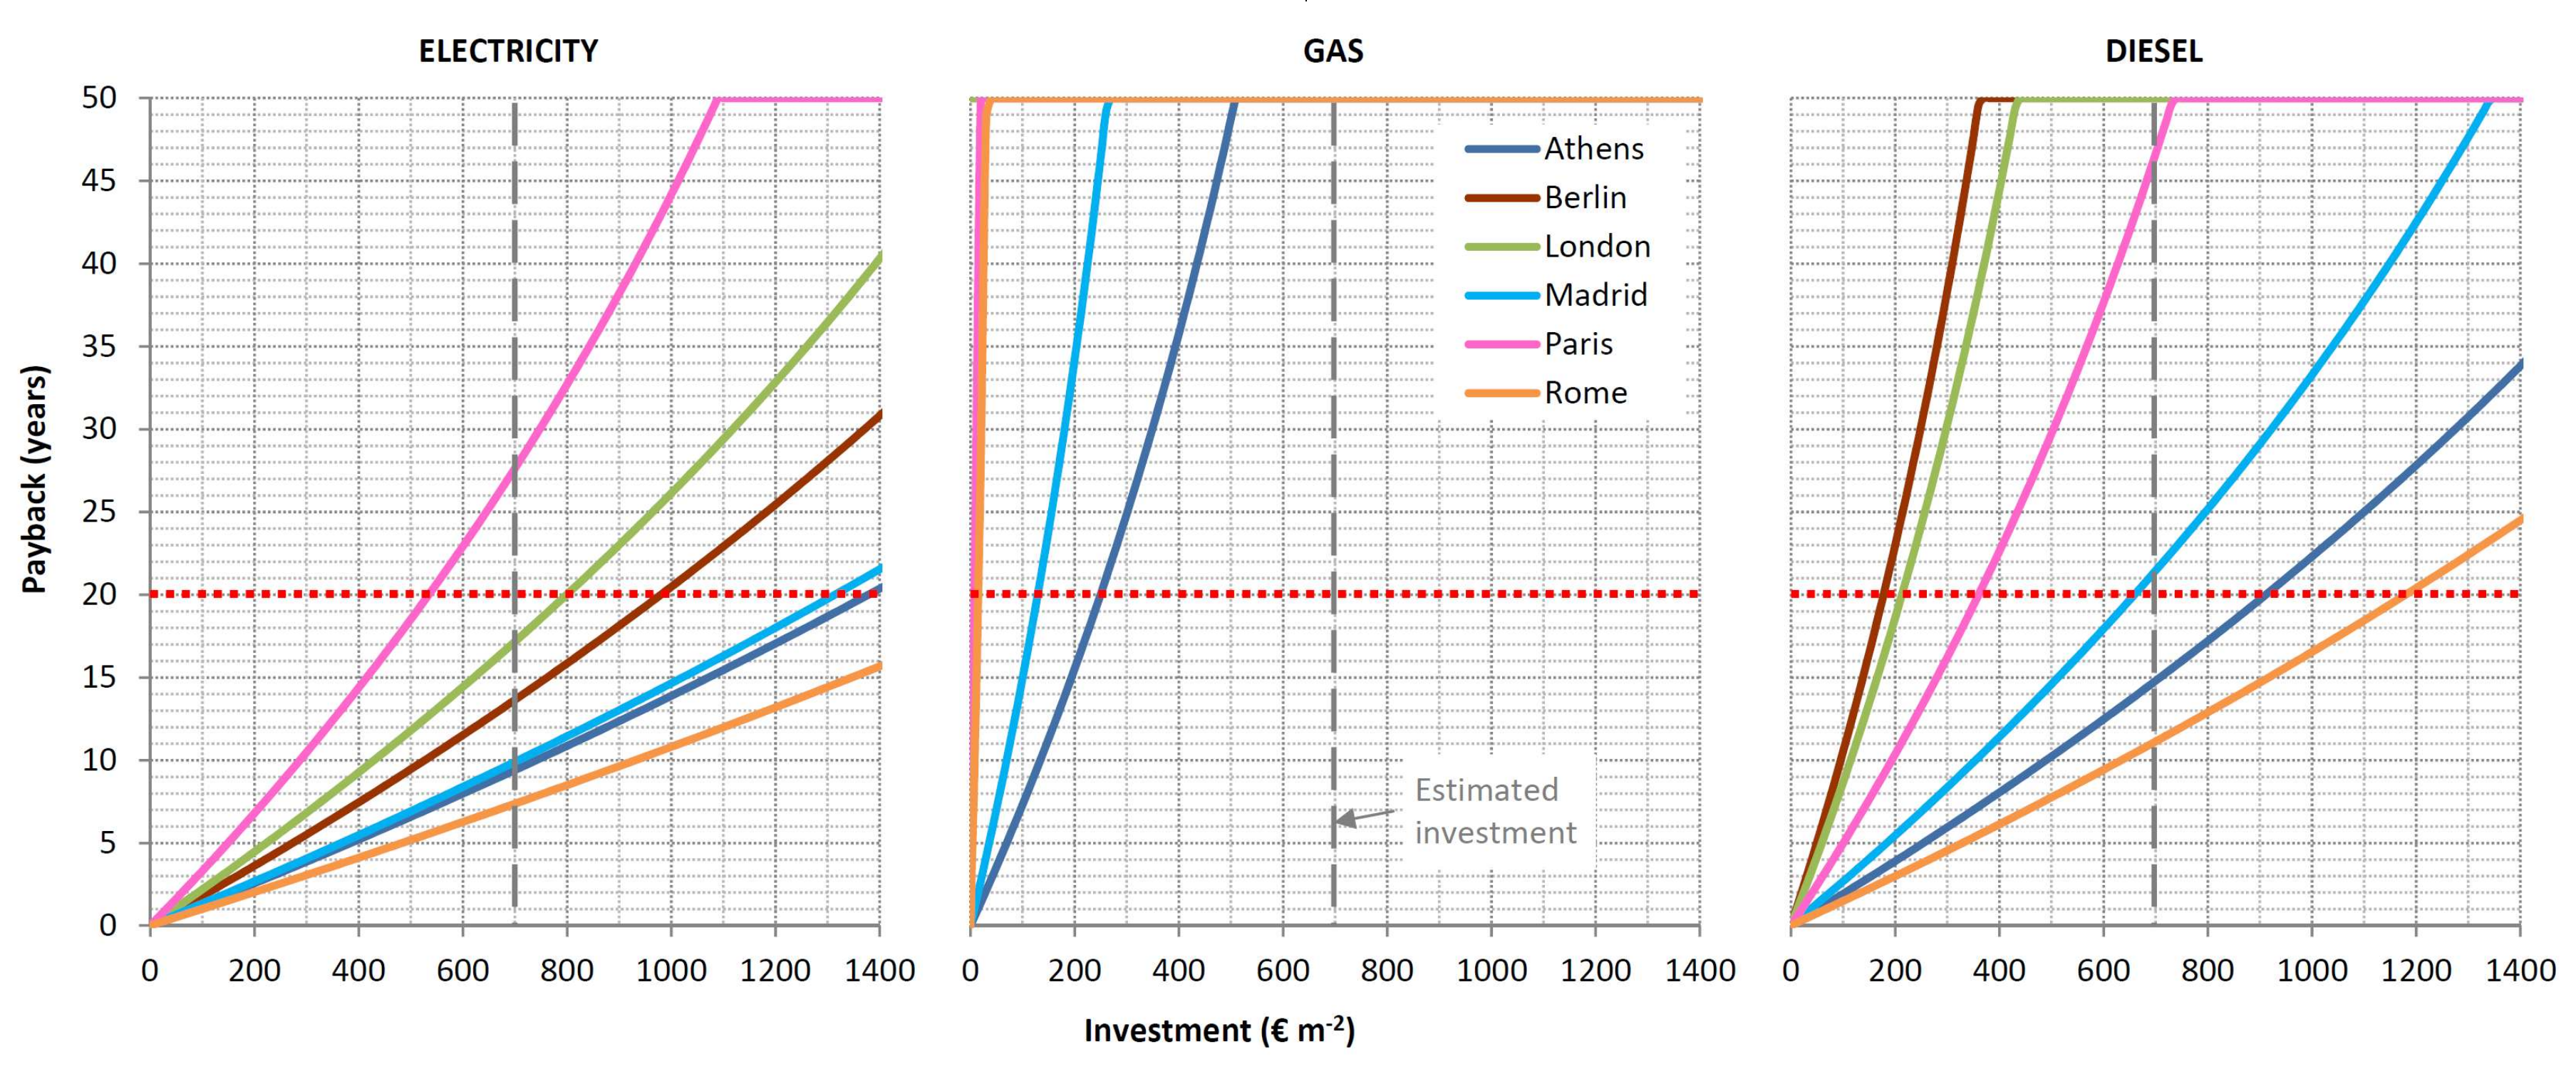
Reducing the investment cost of the SWHS could also increase the profitability of the system if the trend of recent years continues (
Figure 8). A reduction of €100 m
−2 against the assumed reference price would reduce the payback of all profitable cases by 1 or 2 years; in the case of Madrid with a diesel boiler, the payback would go down to 18 years.
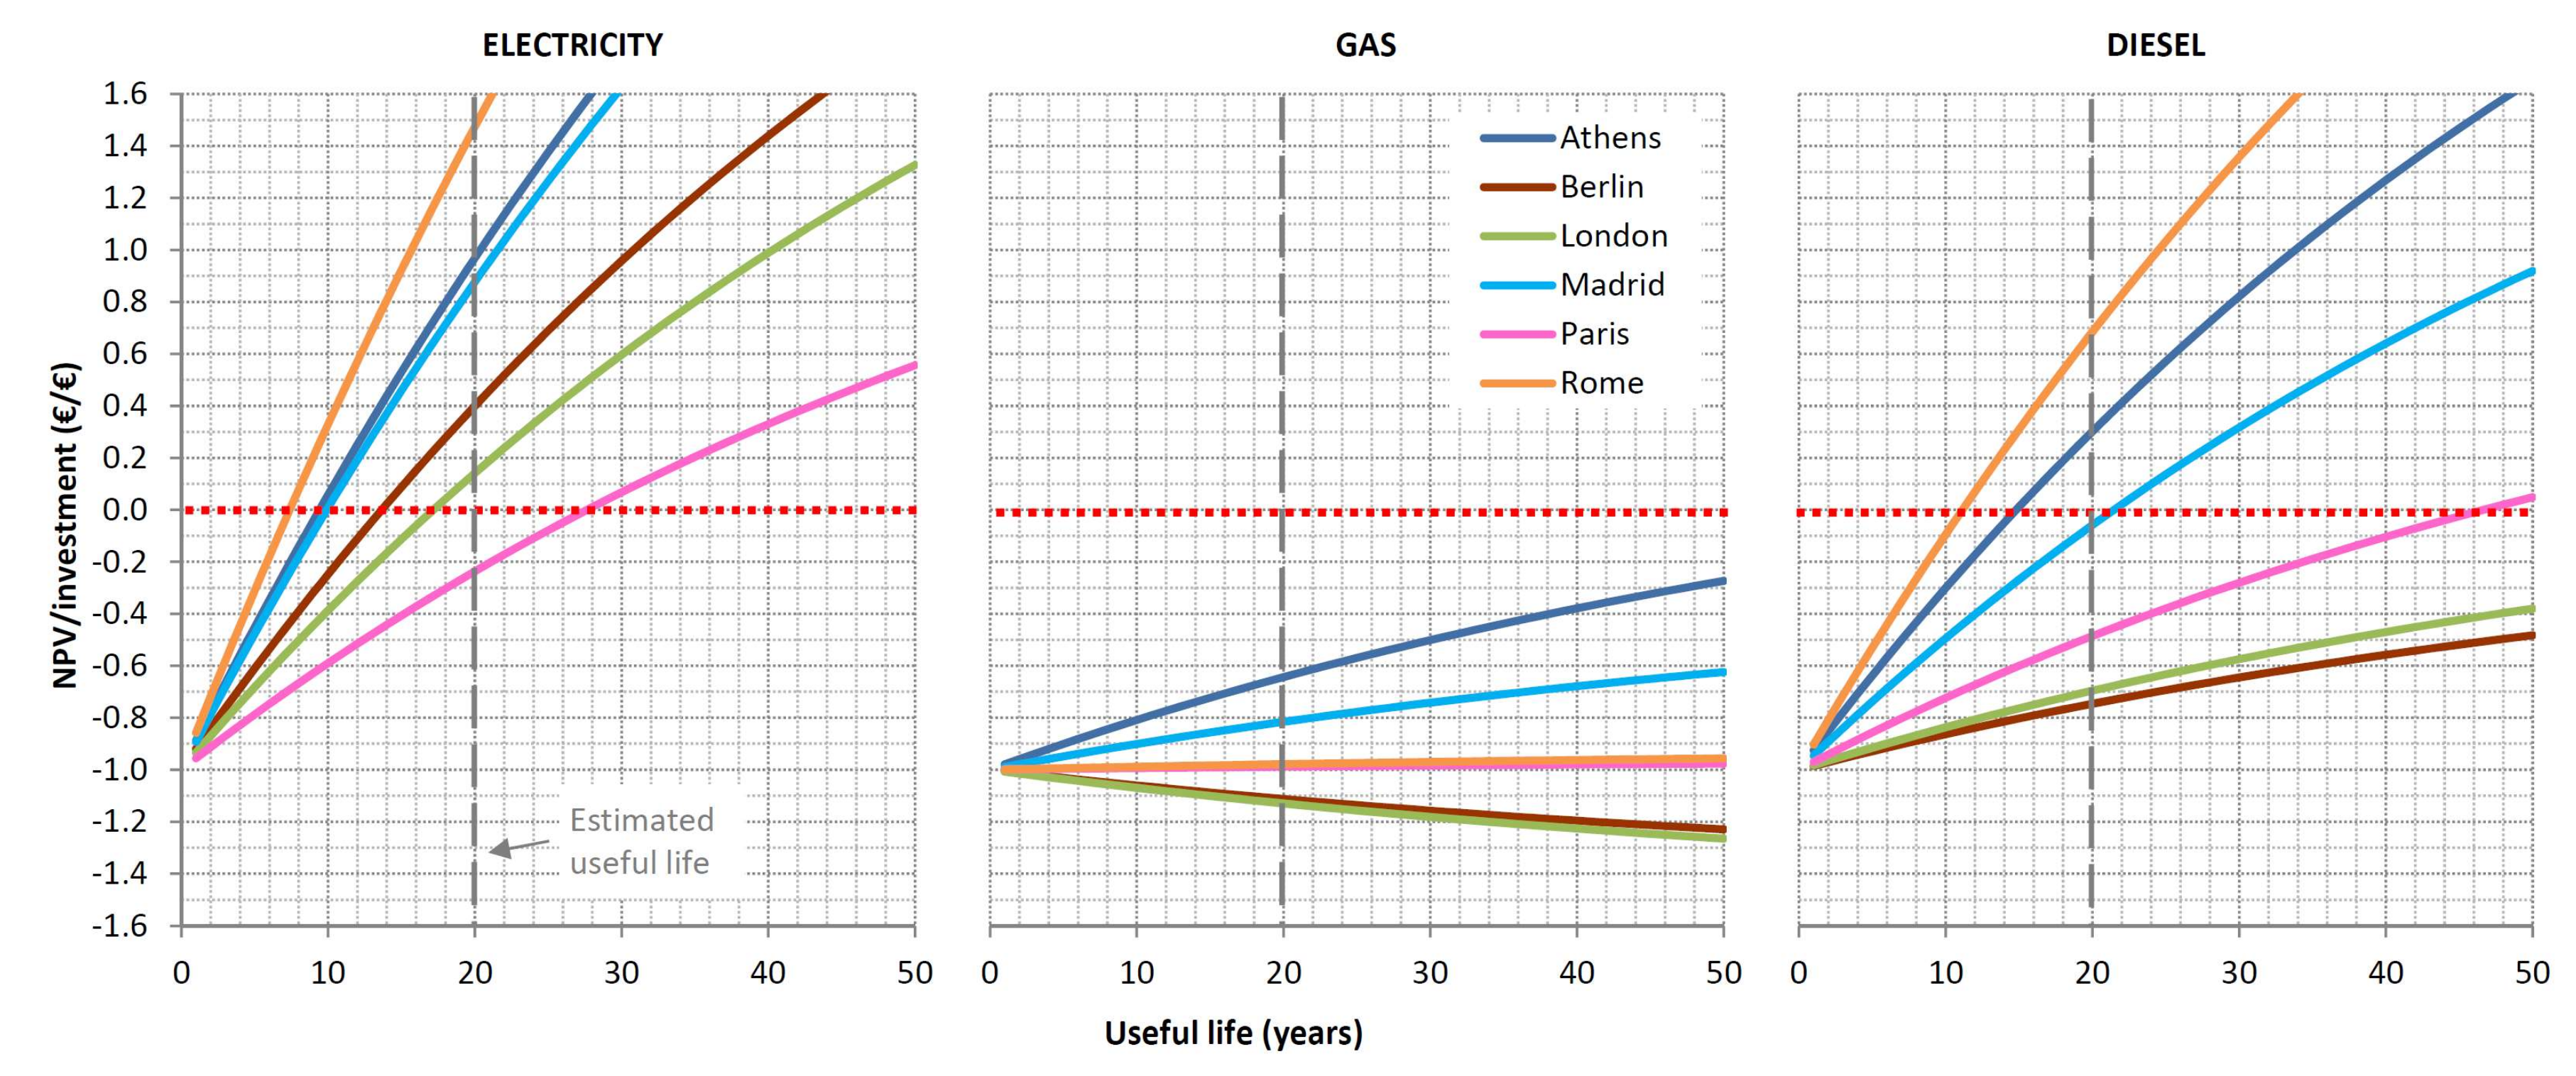
The useful life of the installation is also a very influential factor in the profitability of the investment. The estimation of the useful life on the part of the manufacturers and distributors of the solar equipment is very diverse, although usually it oscillates between 20 and 25 years. Although a relatively conservative value (20 years) has been taken as a reference value, it is necessary to analyse the variation in profitability in the event that the installation remains operational after that time, as many manufacturers point out. It is also necessary to analyse the scenarios in which the useful life does not reach 20 years, by unforeseen factors or by too optimistic information on the part of the manufacturers. It is assumed that SWHS will continue presenting a performance similar to that shown in the experiment, thanks to maintenance and repair work taken into account in the costs of the study.
A hypothetical increase in the useful life to 25 years would increase the benefit (NPV/investment) by at least €0.2 per € invested in all scenarios that were already profitable (
Figure 9). Instead, if the useful life was reduced to 15 years due to unforeseen factors, the profitability of many scenarios would be compromised; in the scenarios of higher irradiation it would be reduced by €0.5 per €1 invested. Some of the scenarios with gas boilers have a negative slope, so they would not be profitable no matter how much the useful life is increased.
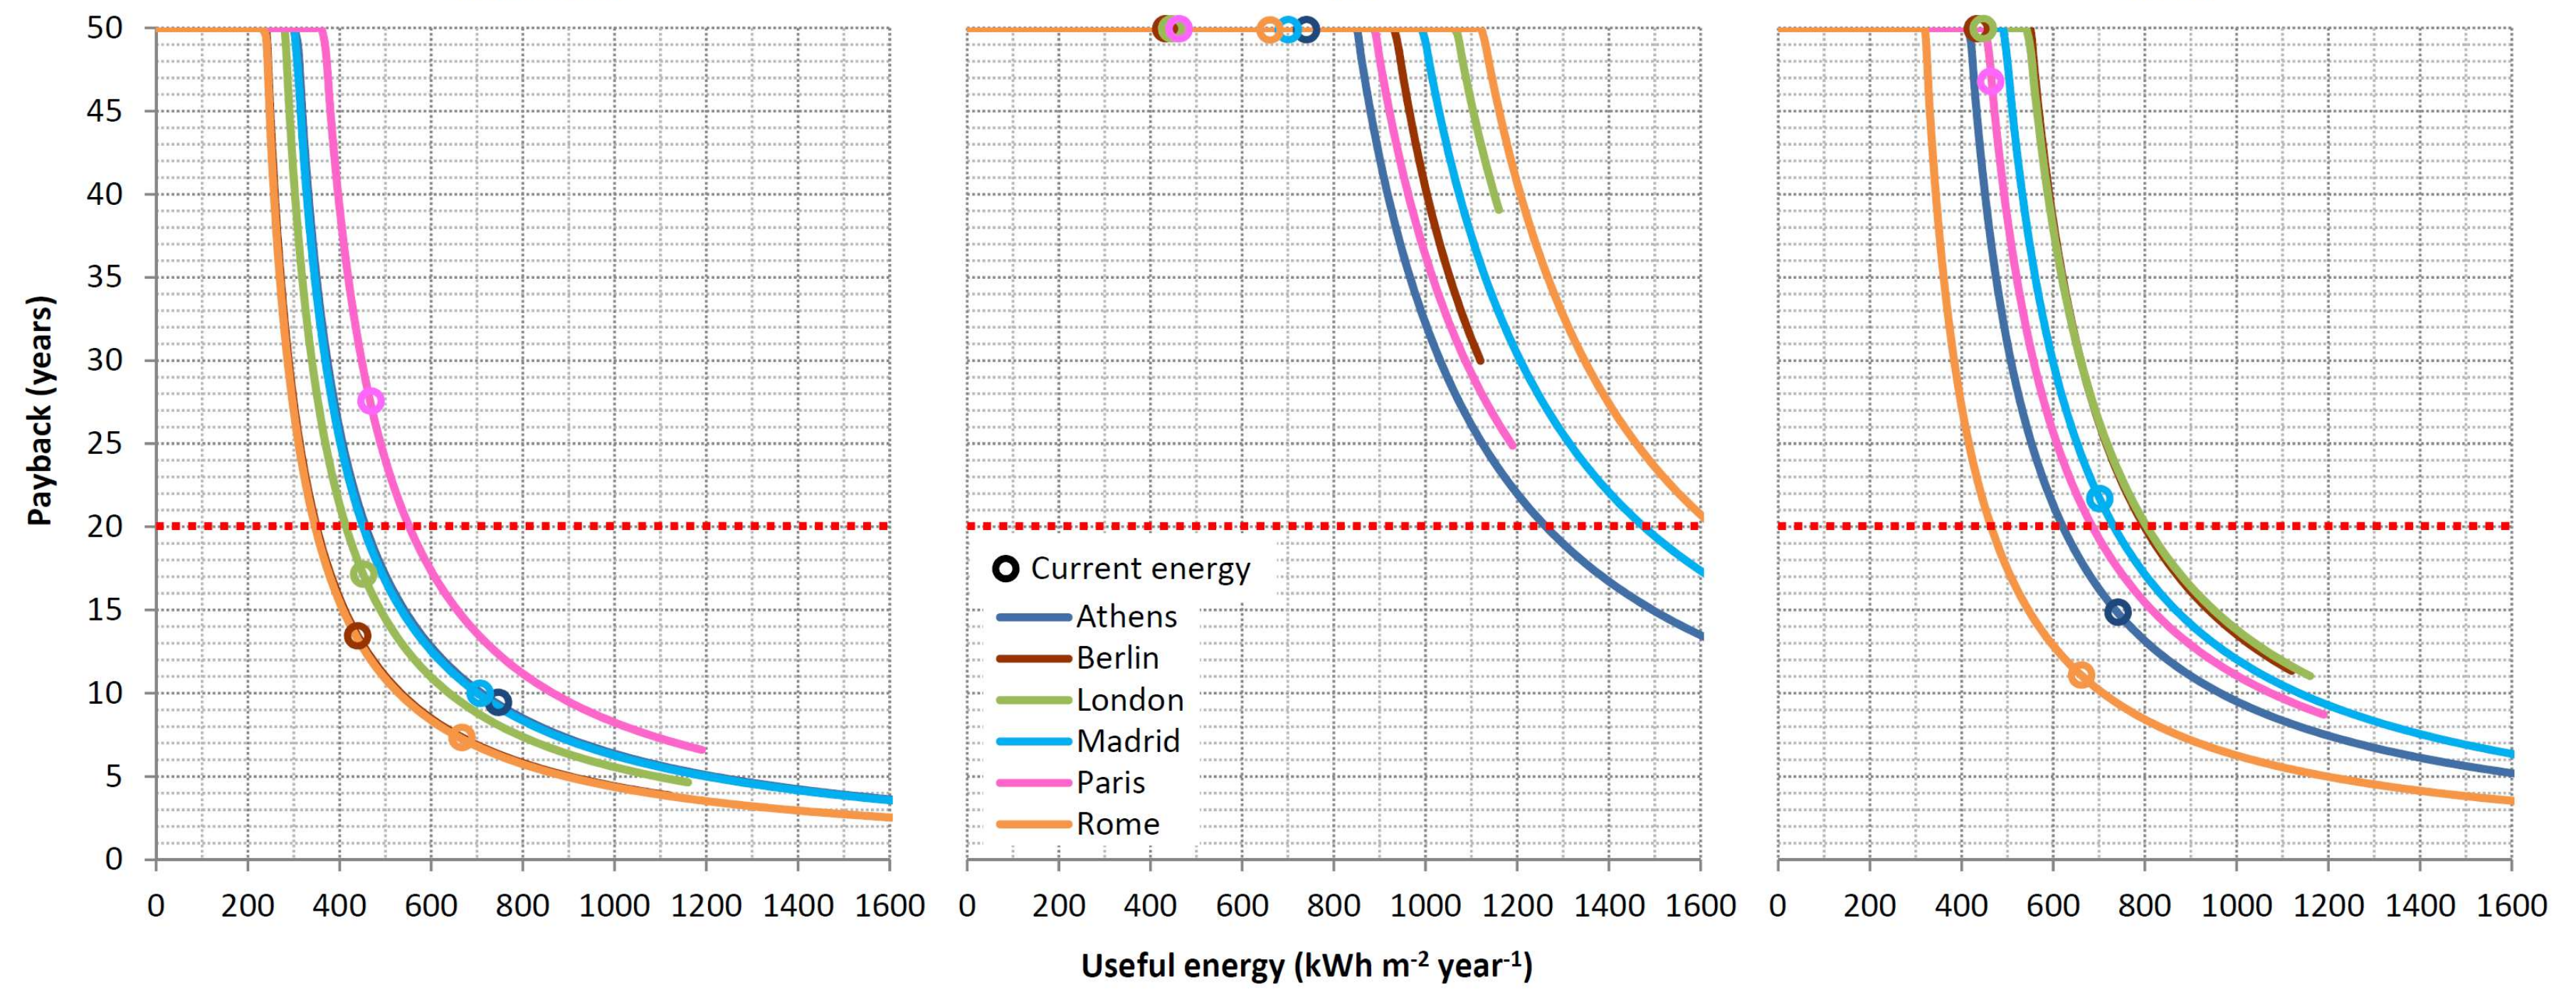
Once the SWHS is installed, changes in the demand pattern can affect the energy supplied by the SWHS throughout the year, and therefore its profitability. For example, if an industry increased its demand for hot water, the tank would empty more regularly, maintaining a lower temperature that would lead to an increase in efficiency and therefore in the useful energy captured. However, it must be borne in mind that, in this case, the energy expenditure of the conventional supply system would increase.
Increases of 15% of the energy supplied would lead to reductions in the payback between 1 and 3 years in the scenarios that were already profitable, reaching reductions greater than 15 years in some scenarios of low profitability (
Figure 10).
4. Conclusions
The results of the study show that solar systems with evacuated-tube collectors are capable of supplying water at 90 °C for industrial use. However, except for days with very high irradiation and ambient temperature, the temperature of the tank does not reach the required temperature (assuming a typical configuration of 80 L and 2 m−2 collector); so, a conventional power supply system is necessary.
The comparison of the results with those obtained in previous works, where the production of water at a lower temperature was analysed, shows that the production of water at 90 °C leads to a significant loss of efficiency of the system (annual average of 40 ± 3%), due to the reduction of the hours of operation of the system (the controller stops the circulation before the sunset because of not reaching a sufficient thermal gap), as well as by the increase of the losses in the pipes.
The annual energy savings generated by the SWHS would oscillate between 741 kWh m−2 in Athens and 435 kWh m−2 in Berlin, which means reductions in CO2 emissions by m2 of collector between 88 and 215 kg CO2 depending on the conventional supply system existing in the industry.
The energy price of the conventional supply system is the most determining factor for the investment in the SWHS to be profitable. In none of the six locations analysed would the SWHS be profitable if the industry has a gas boiler. On the contrary, in most locations paybacks of less than 20 years (between 7 and 17 years) are reached if the existing supply is made by electric boilers. In the case of a diesel boiler, intermediate casuistry occurs.
Other factors such as the cost of the investment, the useful life of the installation or the energy supplied by the SWHS also have a great influence on profitability; small variations in them cause large variations of the payback in certain scenarios. The results of the sensitivity analysis carried out, synthesizing thousands of different scenarios, are a valuable tool for correct decision making.
The results of the study can be very useful to increase the implementation of these systems in the industrial sector, contributing to the urban generation of renewable energy and energy saving in cities.


