A Unique Failure Mechanism in the Nexus 6P Lithium-Ion Battery


Center for Advanced Life Cycle Engineering, University of Maryland, College Park, MD 20742, USA
*
Author to whom correspondence should be addressed.
Energies 2018, 11(4), 841; https://doi.org/10.3390/en11040841
Submission received: 5 March 2018
/
Revised: 1 April 2018
/
Accepted: 30 March 2018
/
Published: 4 April 2018
Abstract
:Nexus 6P smartphones have been beset by battery drain issues, which have been causing premature shutdown of the phone even when the charge indicator displays a significant remaining runtime. To investigate the premature battery drain issue, two Nexus 6P smartphones (one new and one used) were disassembled and their batteries were evaluated using computerized tomography (CT) scan analysis, electrical performance (capacity, resistance, and impedance) tests, and cycle life capacity fade tests. The “used” smartphone battery delivered only 20% of the rated capacity when tested in a first capacity cycle and then 15% of the rated capacity in a second cycle. The new smartphone battery exceeded the rated capacity when first taken out of the box, but exhibited an accelerated capacity fade under C/2 rate cycling and decreased to 10% of its initial capacity in just 50 cycles. The CT scan results revealed the presence of contaminant materials inside the used battery, raising questions about the quality of the manufacturing process.
1. Introduction
Li-ion technologies, first commercialized in 1991, have become highly used for energy storage batteries due to the high energy density and high voltage compared to other battery technologies. The Li-ion battery consists of negative and positive electrodes which are typically made of graphite and lithium metal oxide active materials, respectively. These electrode active material particles are coated on metallic current collectors and held together with the help of binders to provide electrical conductivity and mechanical integrity. The negative current collector is typically made of copper and the positive current collector is made of aluminium. The two electrodes are electrically insulated from each other by means of an electrolyte-soaked separator. Separators are usually made of polymeric materials, such as polyethylene and polypropylene. Li-ion batteries are commercially packaged in different form factors, such as pouch, prismatic and cylindrical.
The Nexus 6P smartphone, released in September 2015, is an Android based phone powered by a 3450 mAh rated Li-ion battery [1]. There have been numerous reports of these phones having battery drain issues causing premature shutdown of the phone even when there appears to be significant battery runtime remaining [2,3,4,5,6,7]. In fact, as of 29 November 2017, over 5000 people have starred this issue on the AOSP Issue Tracker (The Android Open-Source Project (AOSP) Issue Tracker contains a list of pending technical tasks across a variety of topics, information relevant to those tasks, and information about progress on those tasks, including which ones might get worked on in the short term. [https://source.android.com/source/report-bugs]) and more than 2000 users have shared their experiences, screenshots, and comments on the problem [6], highlighting the widespread nature of the problem. Reports of the battery dying from a charge as high as 67% to as low as 15% on both Android Marshmallow and Android Nougat have suggested that the problem is not related to the Android update [5]. In particular, in reply to the query of XDA user “rbrenart”, Google support confirmed that the problem was the result of a faulty battery [5,7].
Li-ion batteries degrade over time, losing their capacity, defined as the maximum amount of charge (ampere-hours) the battery can hold, as a result of various electrochemical-mechanical mechanisms, including solid electrolyte interphase (SEI) layer formation, lithium plating, electrode particle cracking, and gas generation [8,9,10,11]. These mechanisms also increase battery internal resistance and impedance and will reduce the rate capability, defined as the capacity retention ability of the battery at high discharge currents. Battery degradation can be further accelerated if there are manufacturing defects present in the battery [12,13].
This paper presents an assessment of the battery issues associated with Nexus 6P smartphones. To study the problem, two Nexus 6P smartphones (one new and one used) were assessed. The used phone came from a user who had the premature battery drain problem. Each phone was disassembled to remove the batteries for testing and inspection. The testing procedure for Li-ion batteries included electrical parameters (capacity, internal resistance, and impedance) characterization, CT-scan inspection and cycle life (capacity fade) tests. Electrical tests are conducted to assess the battery performance and to evaluate its ability to meet the manufacturer’s specified ratings. CT-scans help to identify the internal structure of the battery and are useful in detecting design and manufacturing defects, as well as signs of degradation such as gas generation and electrode ruffling. Cycle life tests are used to identify the degradation trends of battery in terms of capacity fade versus cycle curve, to reveal the capacity fade rate and to help predict the end of life of battery (defined as 20% capacity drop).
The rest of the paper is organized as follows: Section 2 presents the visual inspection observations from smartphone disassembly; Section 3, Section 4 and Section 5 present the testing procedure and measurements results from the electrical performance testing, CT scan inspection and cycle life test respectively; Section 6 discusses the insights from battery testing and measurements, followed by the conclusions in Section 7.
2. Smartphone Disassembly
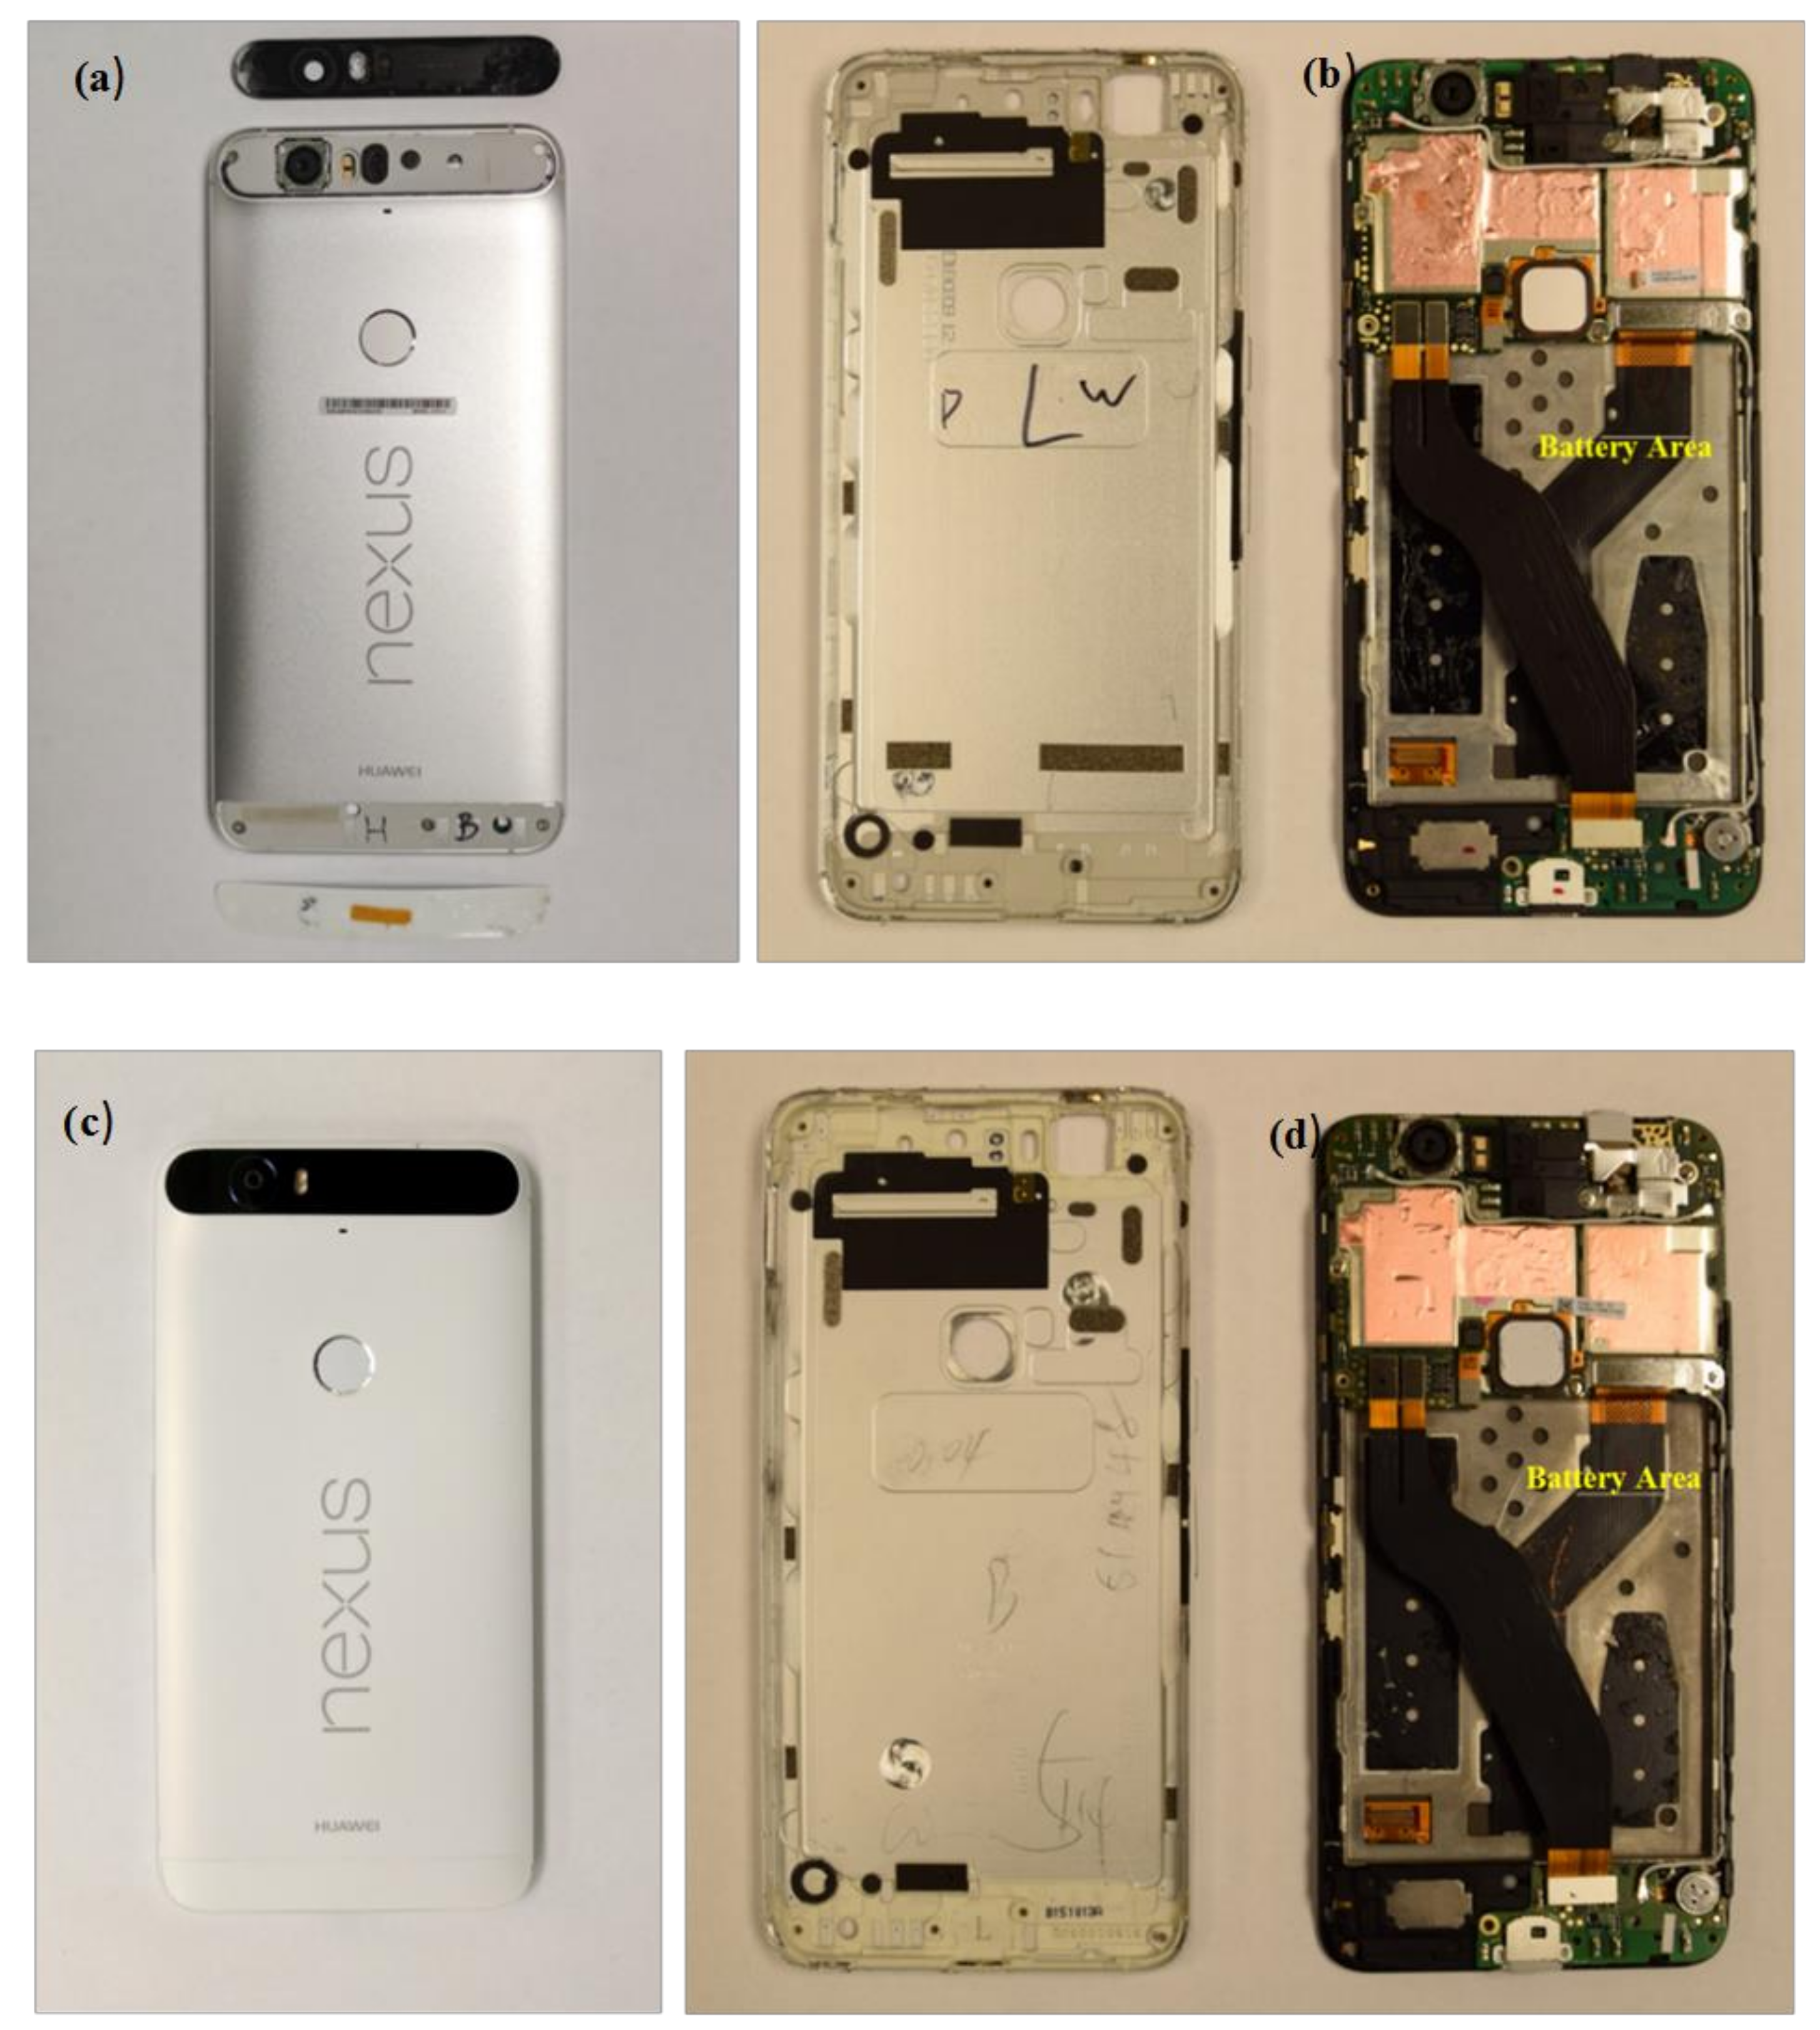
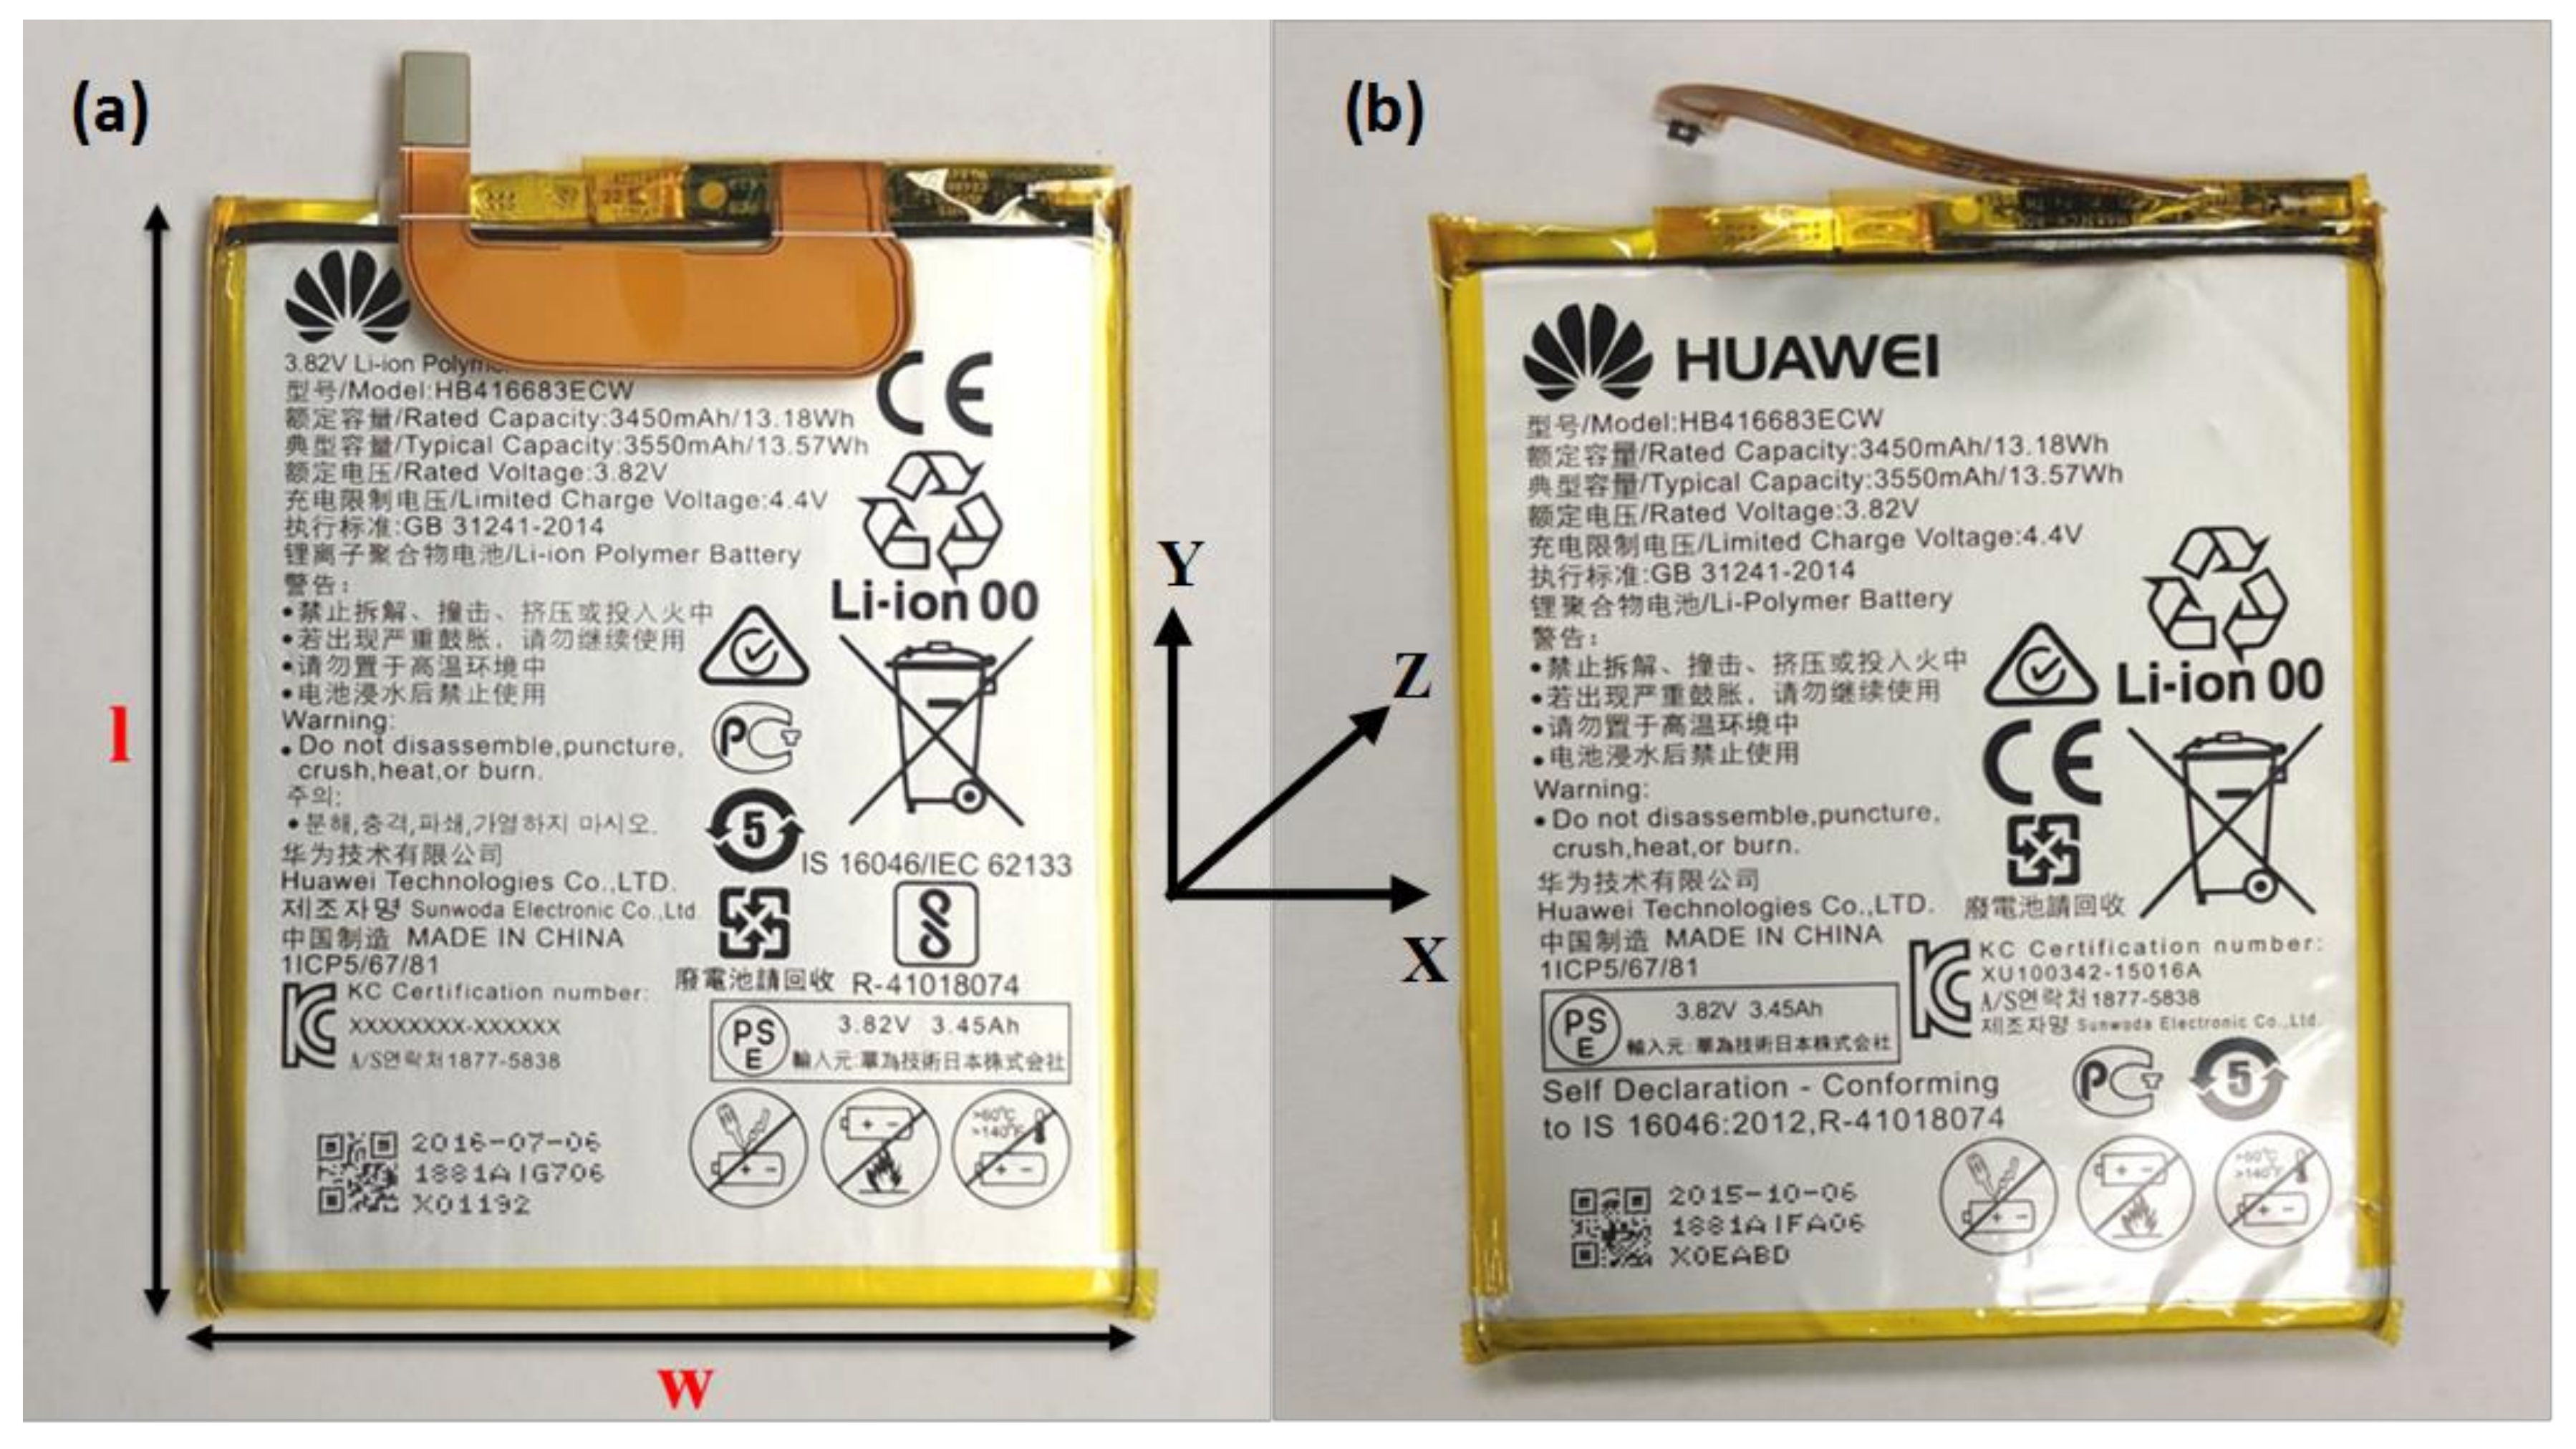
Both Nexus 6P phones were disassembled using the methodology described in the tear-down procedure of [14]. Figure 1 and Figure 2 show the disassembled phones and the removed Li-ion batteries. The battery area is shown in the front panel after removing the battery in Figure 1b,d. On the top side, ratings for the batteries are marked on the pouch in Figure 2. Both the batteries have a small circuit board attached to their terminals. The dimensions of the batteries have been measured using a calliper. If the top side face of battery in Figure 2a represents the X-Y plane, then the thickness was measured along the Z direction at the geometric center of the rectangular top face of the battery. The length was measured along Y-axis at the left edge without the circuit board, and width was measured along the X-axis at the bottom edge which is on the opposite side of the board. The length and width have been represented on Figure 2a by l and w respectively. The ratings and measured dimensions of the two batteries are given in Table 1.
3. Electrical Performance Testing
Electrical performance tests were conducted to measure the battery capacity, internal resistance and internal impedance at room temperature (20–24 °C). This section describes the electrical performance testing procedure and presents the electrical measurements conducted on the two batteries.
3.1. Capacity and Internal Resistance Testing
The capacity of a Li-ion battery is analogous to the gasoline tank in a car. The capacity of a gasoline tank is based on the maximum amount of fuel (gasoline) it can hold. In a Li-ion battery, the fuel is electrical quantity charge (ampere-hour), and the capacity is defined in terms of the maximum amount of charge a Li-ion battery can hold. However, with use, Li-ion batteries continuously suffer a reduction in capacity; something that does not occur in a vehicle (the gas tank does not get smaller with usage).
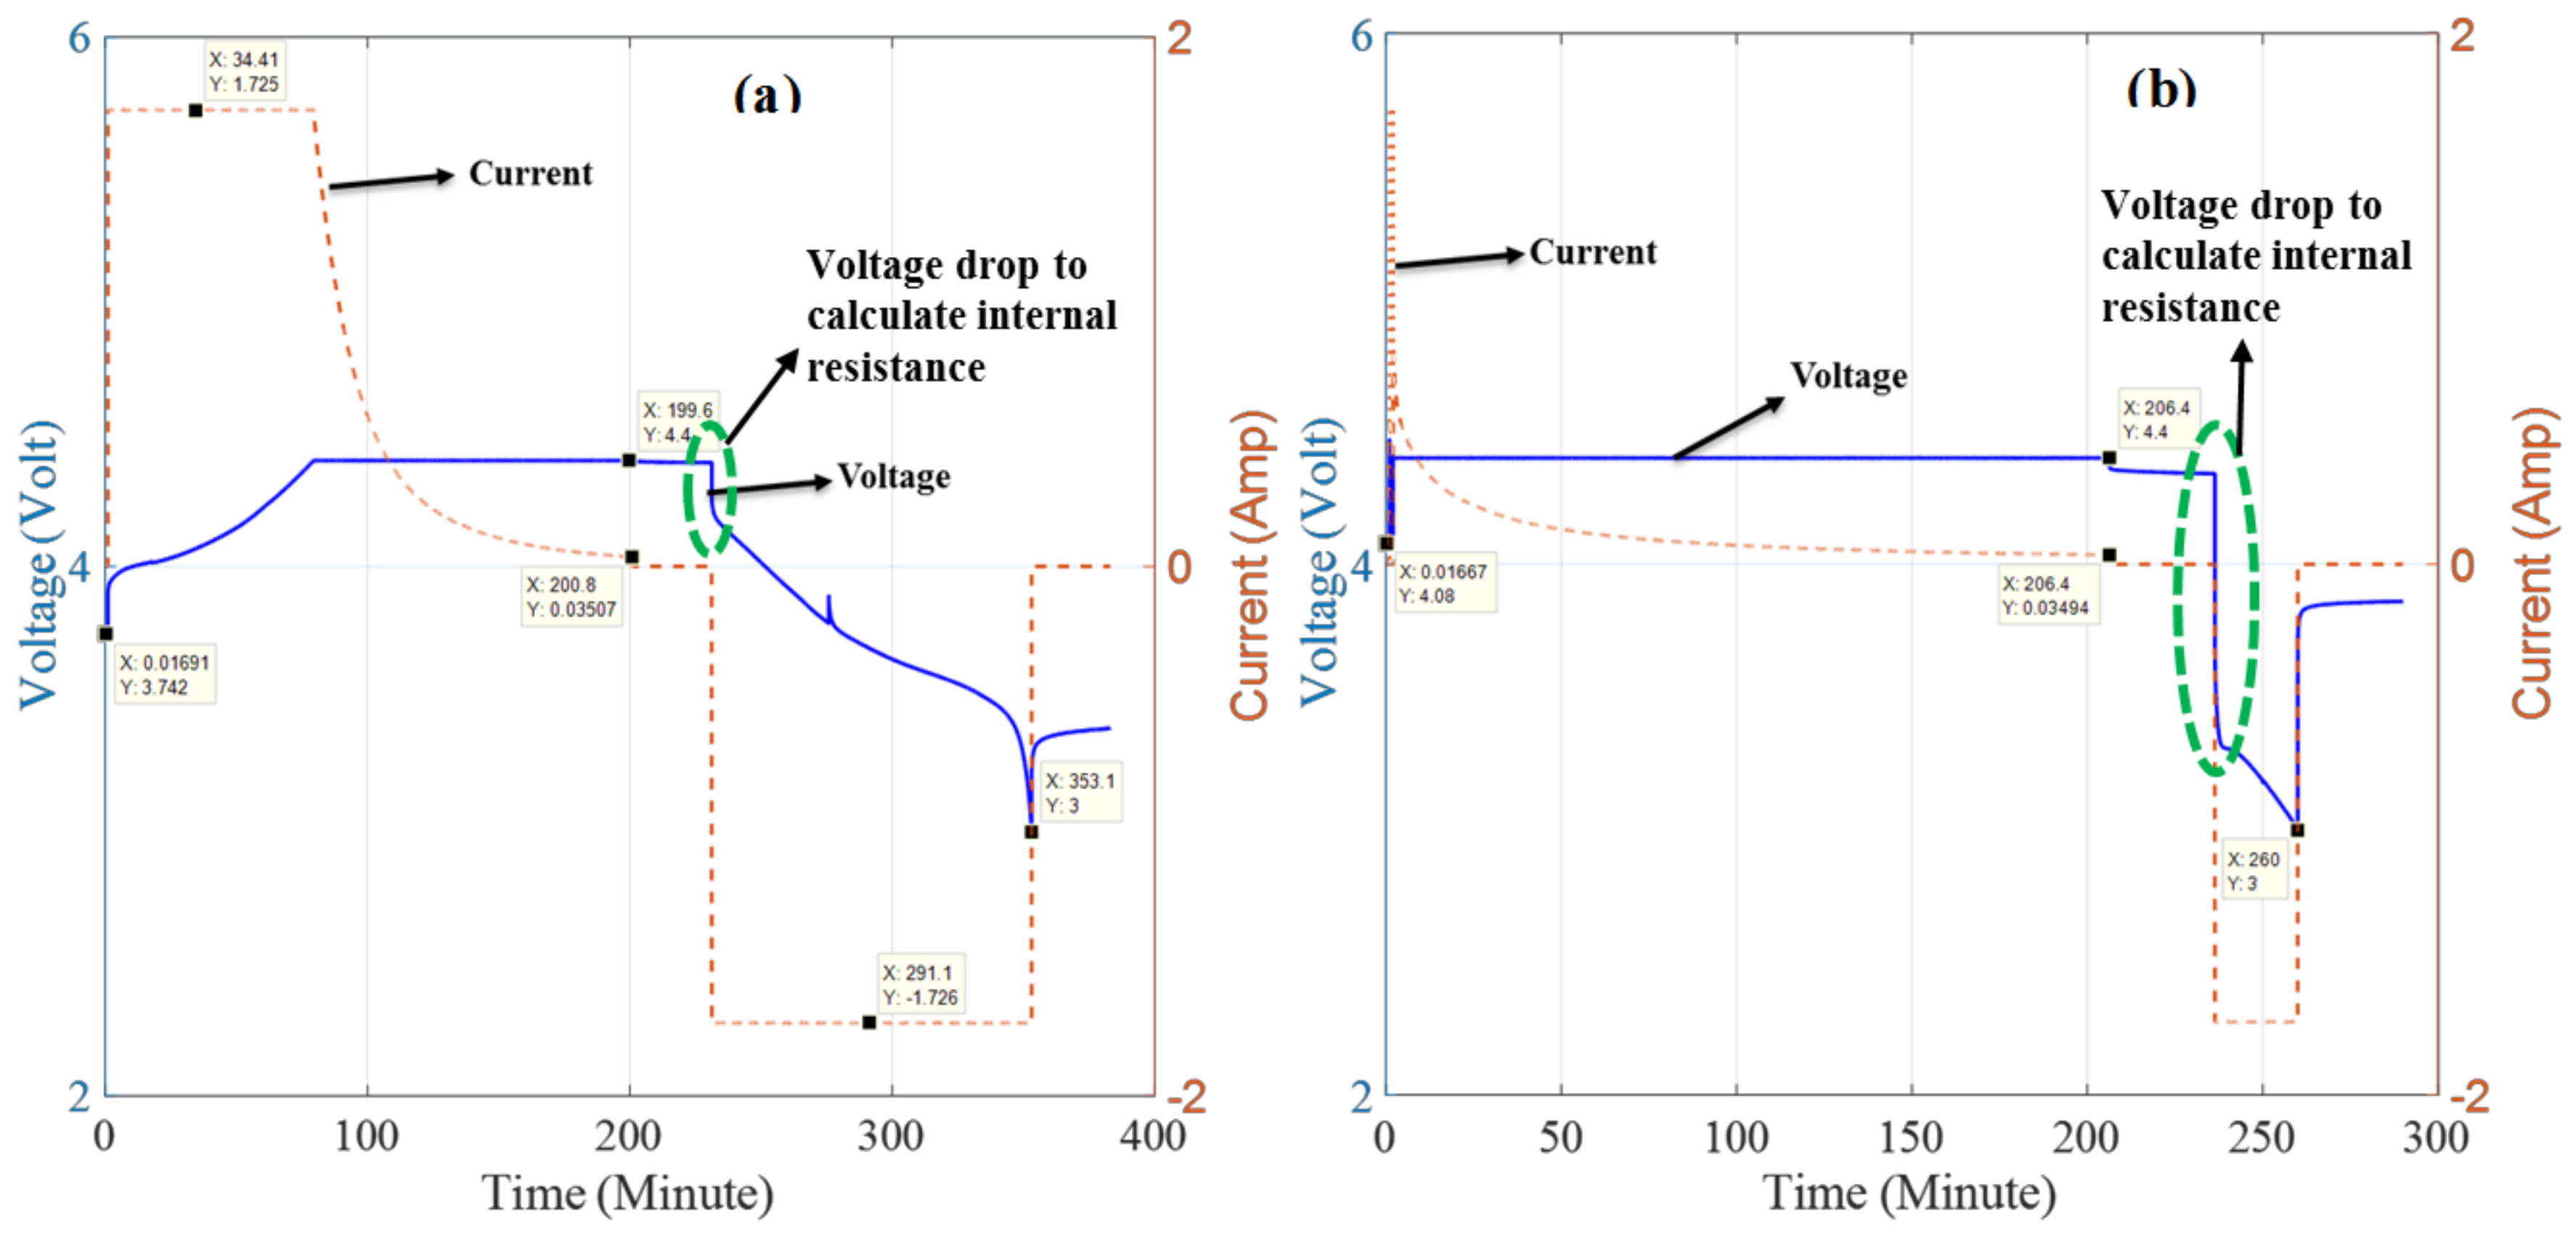
The rated capacity for the Li-ion batteries in this study is 3.4500 Ah. The limited charge voltage on the battery pouch is specified to be 4.4 V (Table 1). The capacity testing was conducted with an Arbin BT2000 Battery Tester, over the voltage range of 4.4–3.0 V to obtain the full cycle for the battery as per its specifications. The value 3.0 V was chosen to be the end of discharge voltage to avoid overdischarge. The battery was charged using a standard constant current—constant voltage charging algorithm. Firstly, a constant C/2 charge rate was applied until the battery terminal voltage reached 4.4 V, and after that, the 4.4 V voltage was maintained across the battery terminal until the current dropped down below C/100. After the charging operation, the battery was rested (no charge-discharge operation) for 30 min to attain thermal and Li-ion concentration equilibrium and then discharged to 3.0 volt again using a constant C/2 rate. Figure 3a,b shows the voltage and current profiles during charging and discharging of the two batteries. Positive and negative current values in the figures correspond to the charging and discharging operations, respectively. The amount of charge delivered by the battery during the discharge period is defined as the discharge capacity of the battery. The internal resistance values of the batteries were measured using the programmable facility of the Arbin BT2000 Battery Tester at 100% state of charge (SOC) condition after constant current—constant voltage charge. Three measurements were collected for each battery. The internal resistance measurements were also obtained using the instantaneous (1 s) voltage drop (marked by green ellipse in Figure 3a,b) after the application of discharge current at 100% SOC.
During the first discharge of the new battery (after taking it out from the box), it delivered a discharge capacity of 3.5076 Ah, which was slightly higher than the rated capacity (3.4500 Ah) of the battery. In the second cycle, a discharge capacity of 3.5050 Ah was recorded. The internal resistance was found to be 70 mΩ at 100% SOC using the programmable facility of the battery tester and 81 mΩ using the instantaneous voltage drop method. The value of resistance in the order of 100 mΩ is considered normal for Li-ion batteries.
The initial battery capacity measured for the used smartphone battery was 0.6795 Ah. Upon the application of a second cycle, the capacity was further reduced to 0.5024 Ah. This shows a nearly 5% capacity drop with respect to the rated capacity in just one cycle and hence highlights the accelerated capacity fade rate of the used battery. Given that this battery shows only 20% of its rated capacity, a value much below the usually defined end of life (EOL) threshold of 80%, in a first cycle, the subsequent 5% drop in second cycle may not be abnormal, as batteries often show an increased rate of capacity fade after crossing the EOL threshold. The capacity obtained in the first cycle is not acceptable given that the used smartphone is still within its expected operation life of 2–3 years. The internal resistance for this battery was found to be 184 mΩ at 100% SOC using the programmable facility of the battery tester and 375 mΩ using instantaneous voltage drop method. These values confirm the increased levels of degradation in the used smartphone battery. Table 2 presents the electrical measurement data for the two batteries.
3.2. Impedance Testing
Impedance testing allows the characterization of battery impedance at different frequencies. This method provides the impedance values corresponding to different physical phenomena in batteries, including ohmic voltage drop, charge transfer and diffusion, occurring at different frequency values. Impedance spectrums of the batteries were obtained at room temperature (20–24 °C) in the frequency range of 0.0125–1638 Hz with 18 measurement frequencies using the Impedance Measurement Box (IMB) designed by Idaho National Laboratory (INL).
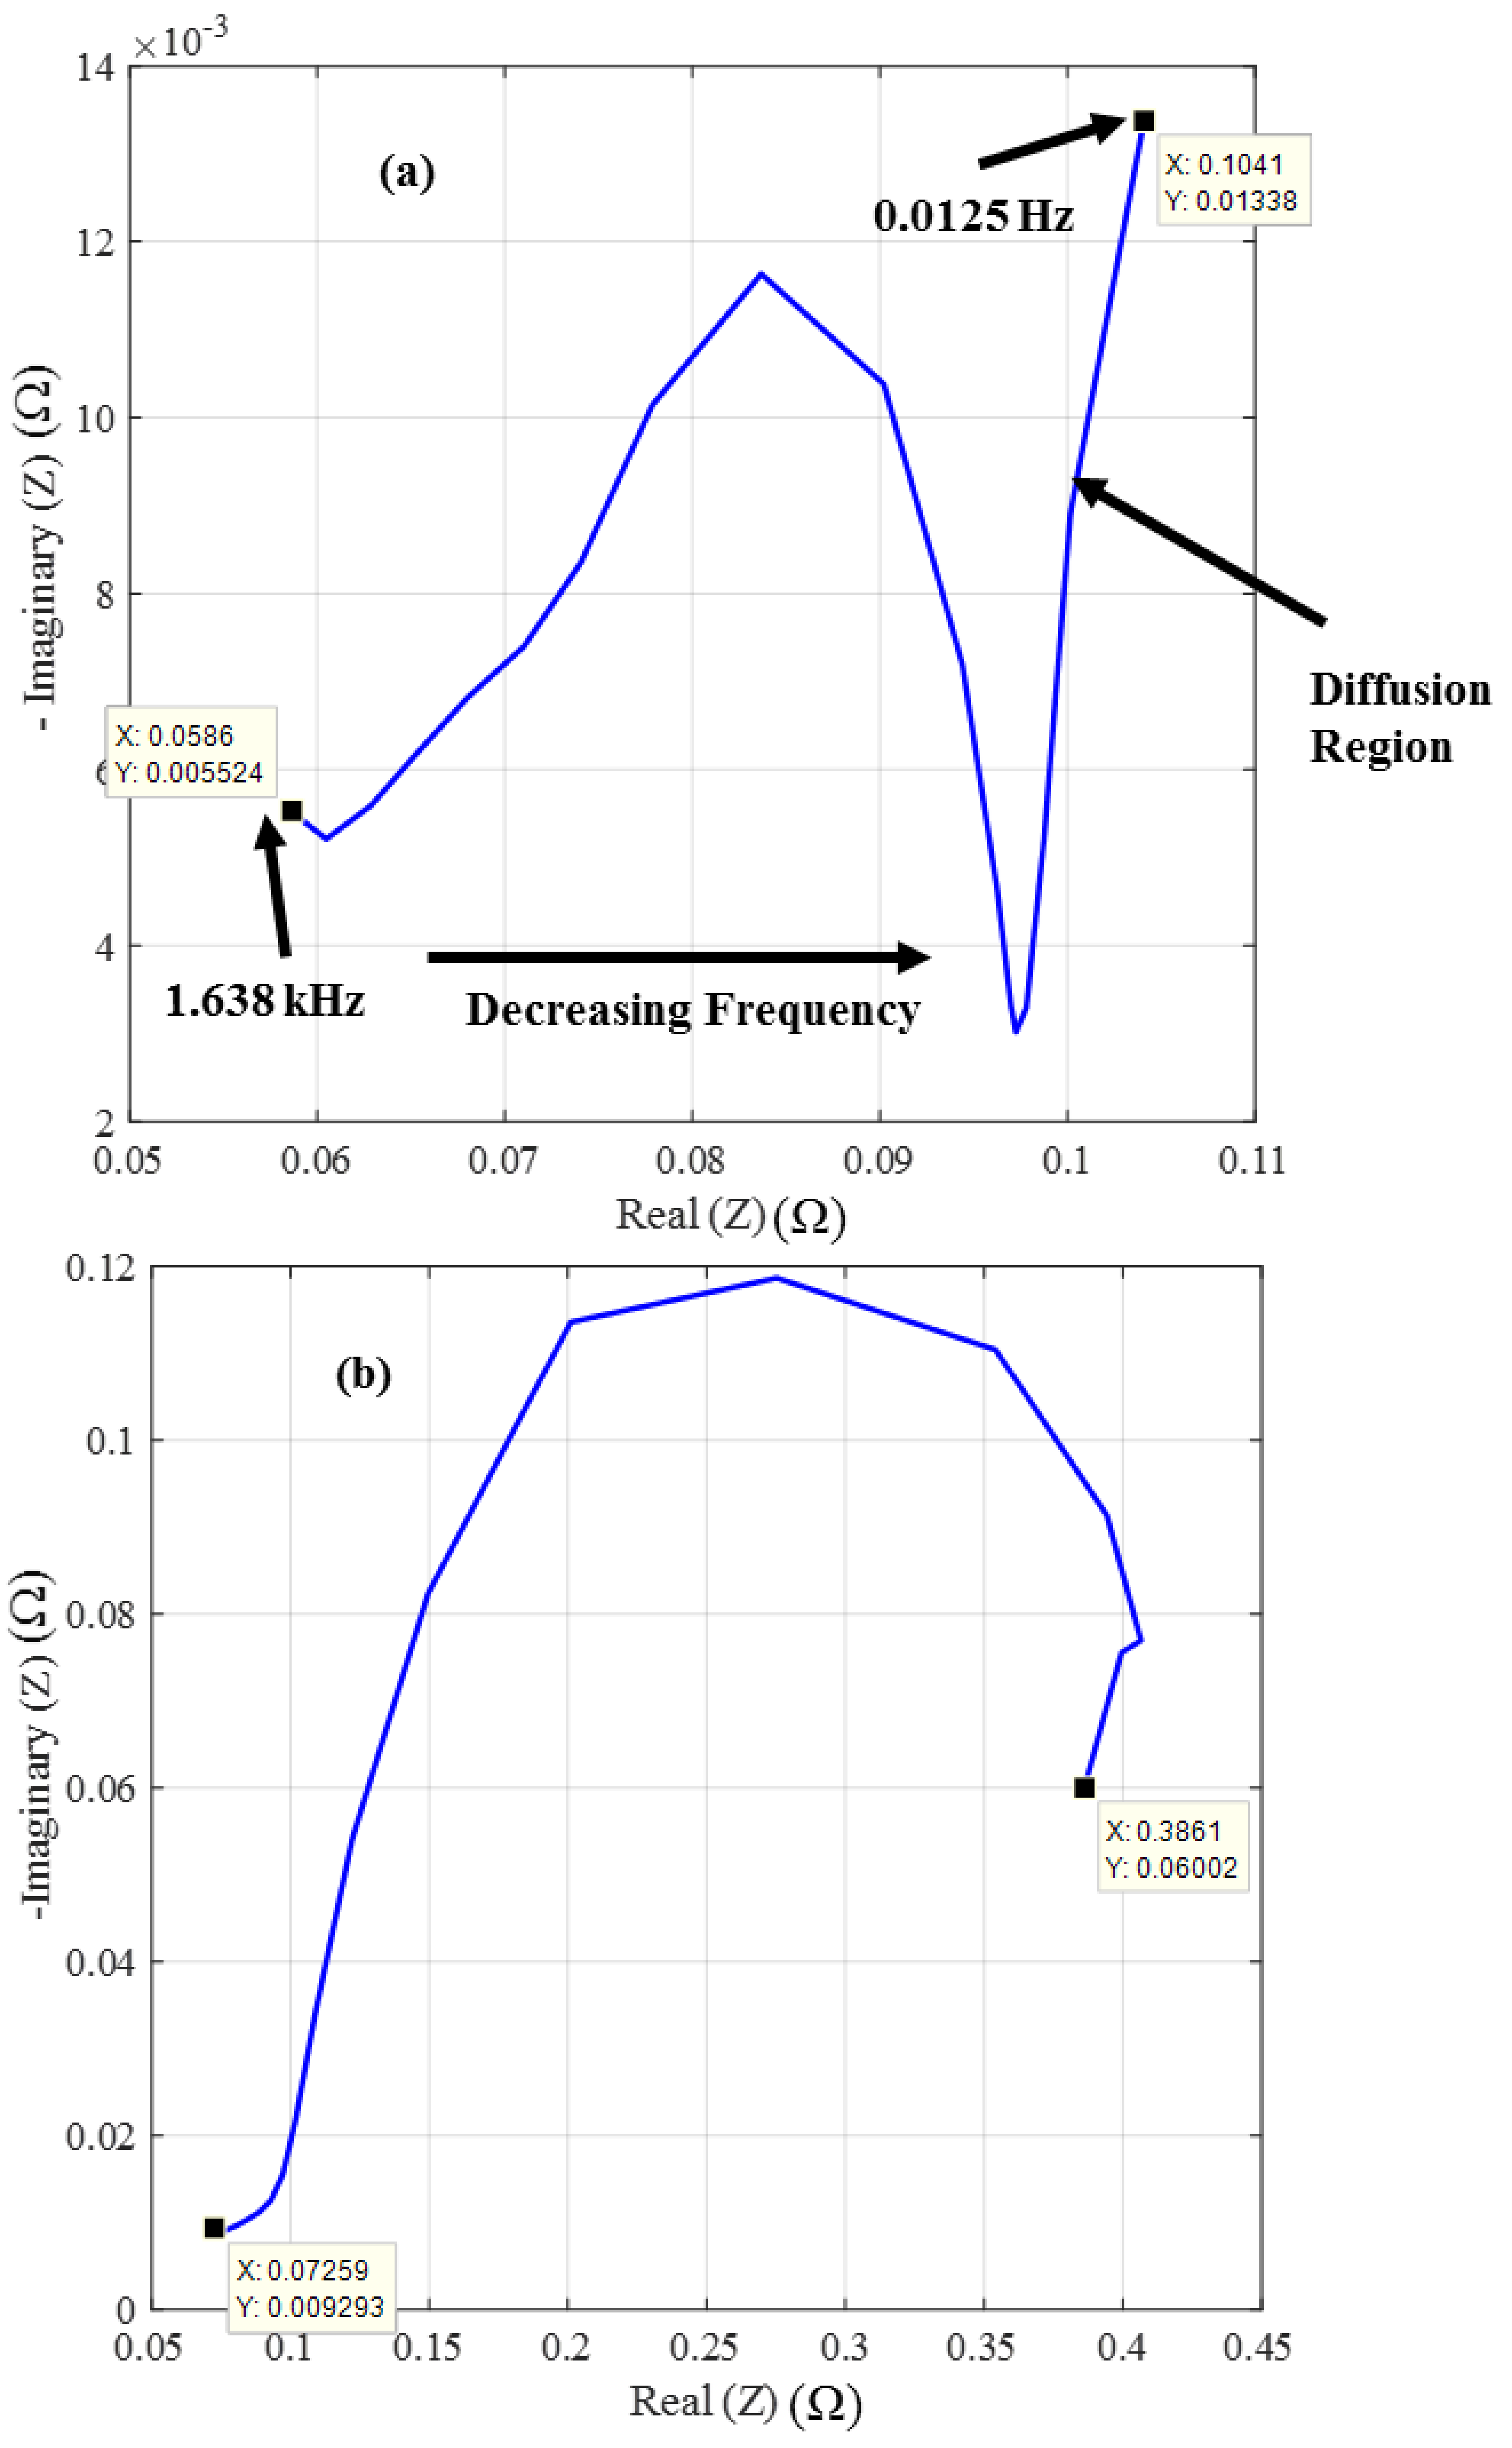
Three measurements for each battery were taken at 100% SOC (fully charged) with an interval of ~3 min between each measurement. Figure 4a,b shows the mean values of the three measurements for the two batteries after the second cycle. The maximum variance along the Real (Z) axis was and maximum variance along the Imaginary (Z) axis was , signifying small variations among impedance measurements.
In Figure 4a, for the new smartphone battery, the magnitude of impedance, |Z|, at the highest frequency, 1.638 KHz, is 59 mΩ and at the lowest frequency, 0.0125 Hz, is 105 mΩ. The impedance at the highest frequency is representative of the ohmic resistance and SEI layer impedance, while the impedance at the lowest frequency corresponds to lithium diffusion behavior. The semicircle region for the new battery consists of 14 different frequency measurements. Figure 4b shows that the magnitudes of impedance are 73 mΩ and 391 mΩ at the highest and lowest frequencies, respectively, for the used smartphone battery. Hence, similar to internal resistance values, the impedance magnitudes for the used smartphone battery are higher than that for the new smartphone battery, confirming the increased level of degradation.
The shape of the impedance spectrum for the used phone battery (see Figure 4b) differs significantly from conventional spectrums. The diffusion region slanted line represented by Warburg impedance in the low frequency region (see Figure 4a) for the new smartphone battery was not observed in the impedance spectrum of the used smartphone battery. Lithium diffusion into the electrode active material is central to the charge–discharge operation of the battery. The distorted diffusion region in the impedance curve of the used smartphone battery signifies the disrupted diffusion behaviour of the battery and can also explain the low capacity value of this battery.
4. CT Scan Inspection
X-ray computed tomography (CT) is a non-destructive tool used to acquire high-spatial resolution three-dimensional (3D) images of the interior features of complex objects [15]. A CT image is typically called a slice, as it corresponds to what the object being scanned would look like if it were sliced along a plane [15]. A CT slice corresponds to a certain thickness of the object being scanned. So, while a typical digital image is composed of pixels (picture elements), a CT slice image is composed of voxels (volume elements). Therefore, an object can be reconstituted by stacking all of its slices. A complete volumetric representation of an object is obtained by acquiring a contiguous set of CT slices. The voxel is just a 3D cube that represents the gray scale (density) at that location. The resolution is the size of that cube. In the CT images, the elements with high atomic numbers are typically displayed with a higher gray scale value compared to elements with low atomic numbers, thus enabling material distinction and identification. CT scans have been used for investigating Li-ion battery failures and for detecting copper current collector dissolution [16], jellyroll deformation [17], electrode layer separation [18], and thermal runaway induced internal structural damage [19]. The application of CT scans in detecting battery manufacturing defects has been recently shown by Samsung in the root cause analysis of fires and overheating issues in the Galaxy Note 7 smartphone batteries [20].
In this study, a Nikon 115 kV CT scanner was used, with scan settings of 115 kV and 40 Watts with a 50 microns resolution (e.g., a resolution of 50 μm/voxel), contrast enhanced using Volume Graphics VGStudio MAX 3.0.
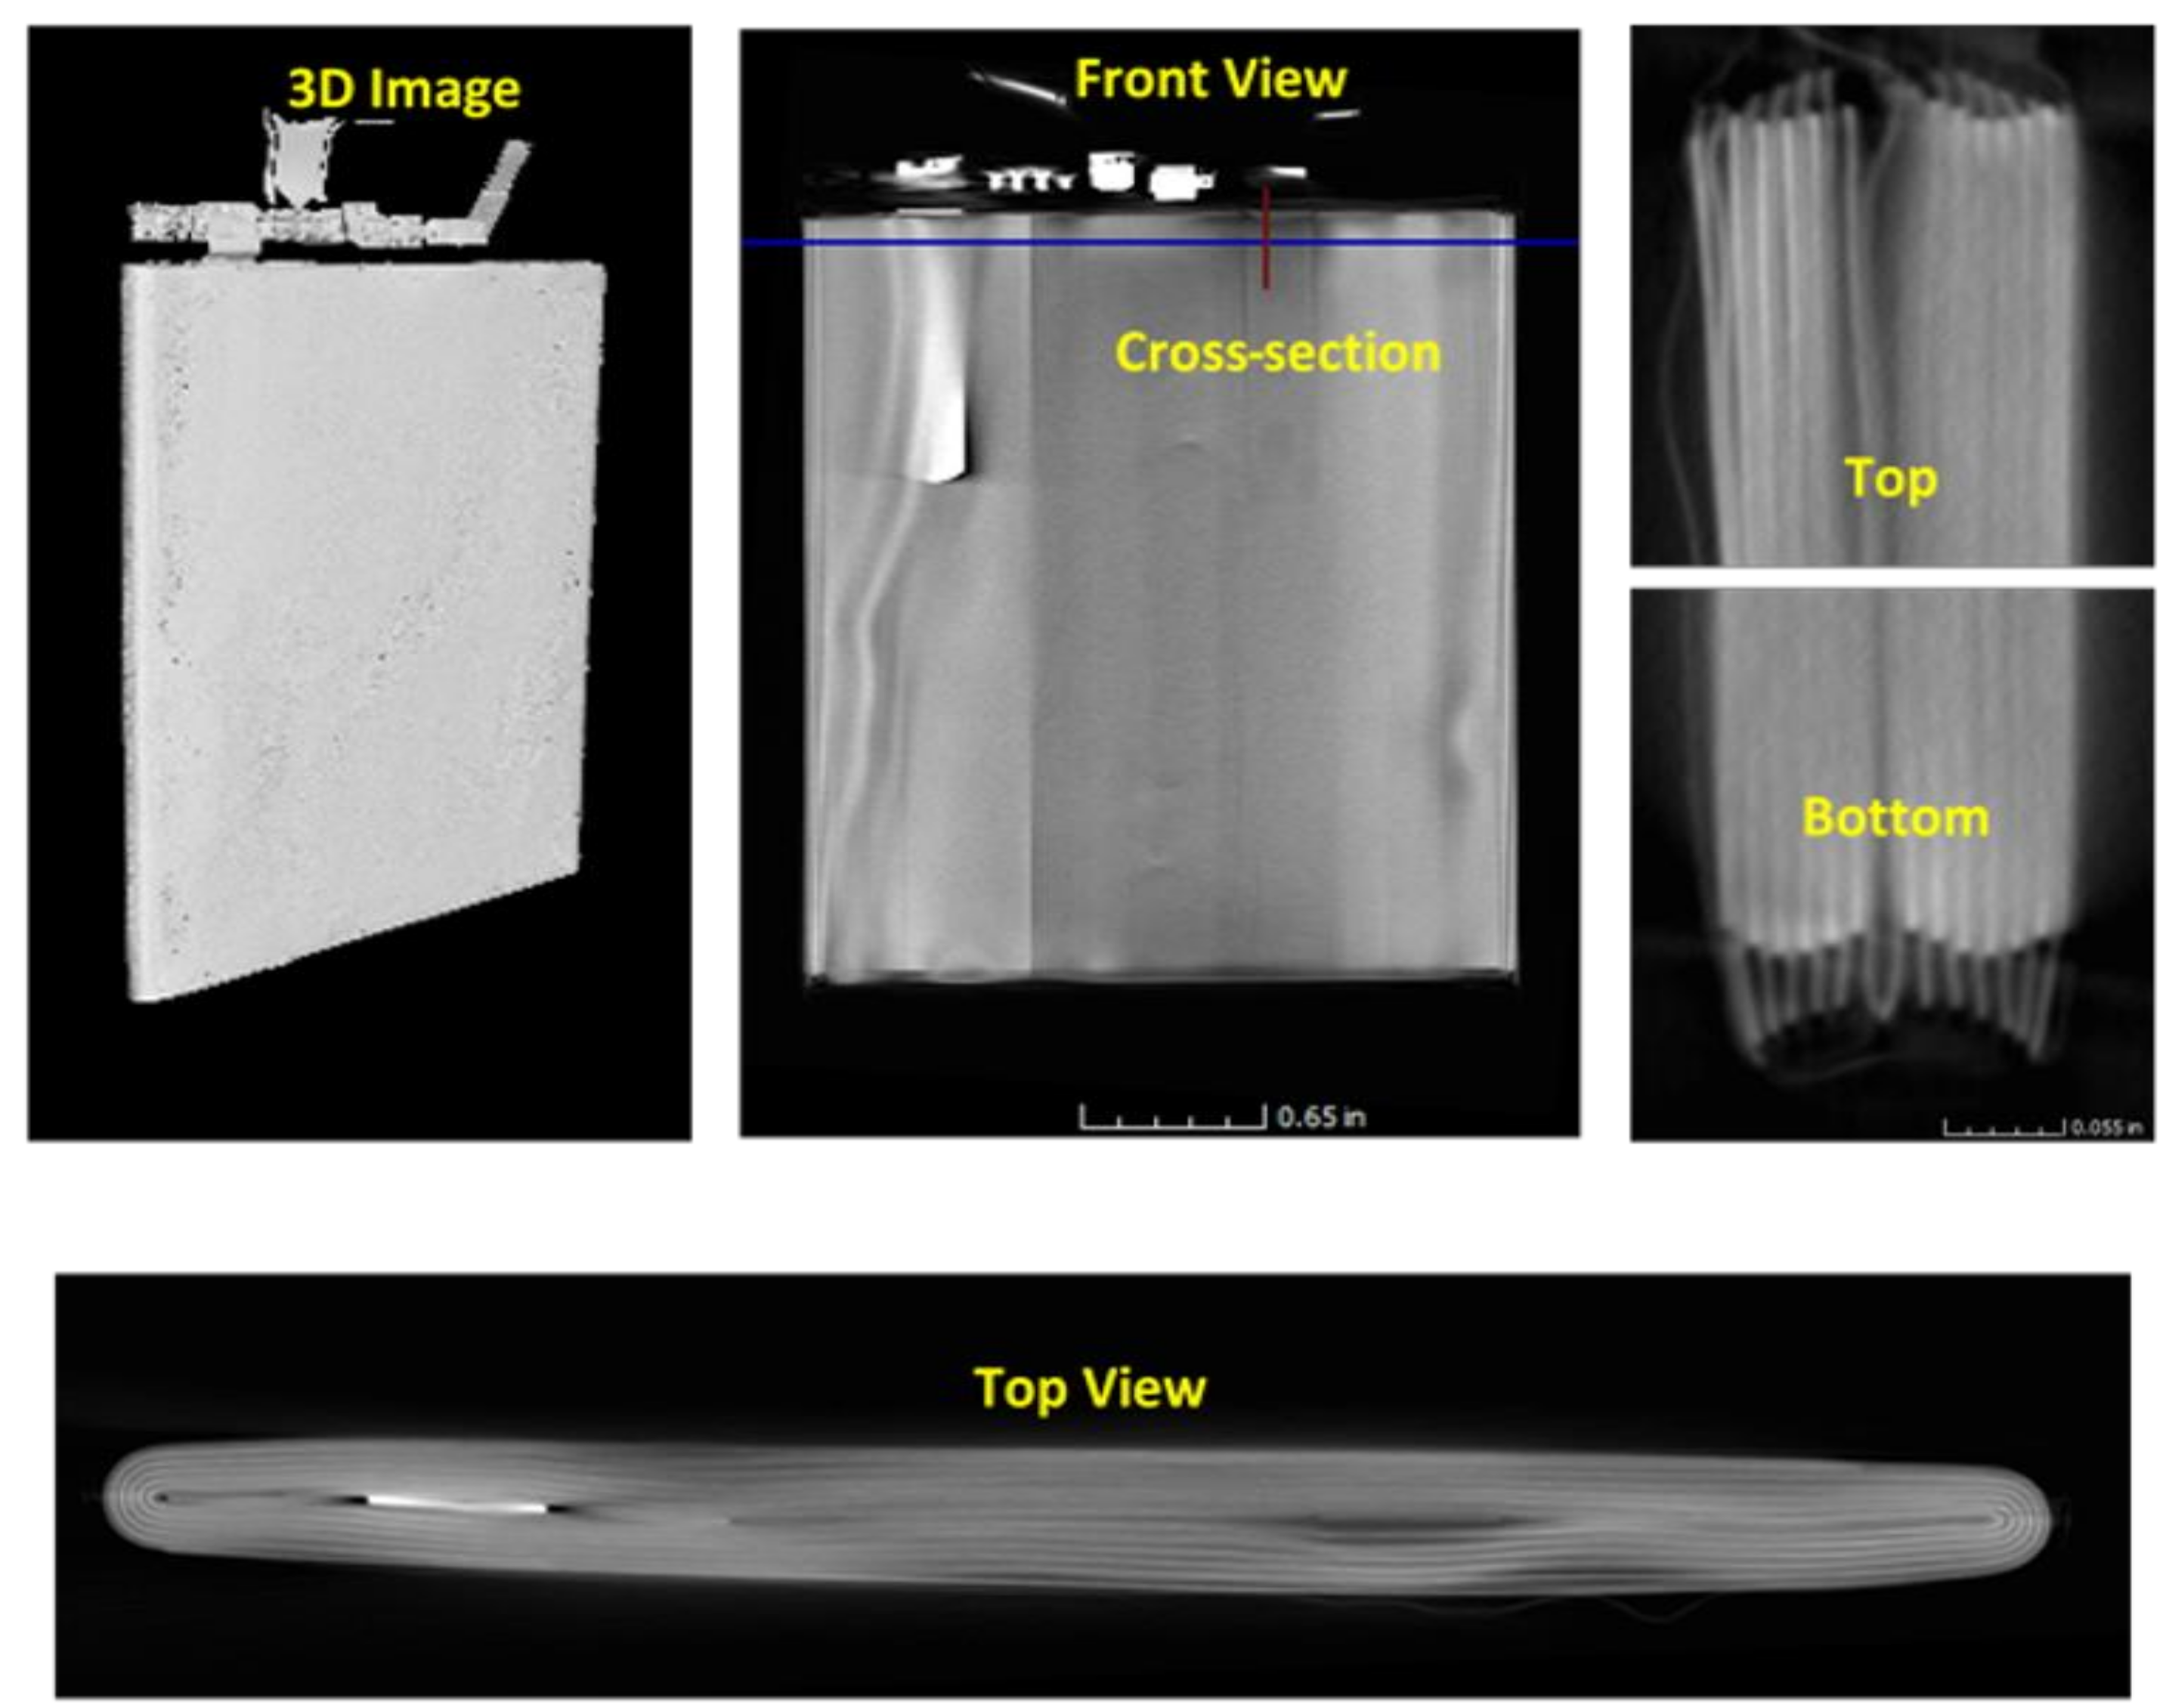
Figure 5 is a 3D CT image (front view, side view and top view) of the battery from the new smartphone after it had completed 20 charge–discharge cycles. The figure shows that the electrodes are uniformly arranged and there are no signs of ruffling or degradation. The CT scan analysis did not reveal any material contaminants or design defects in the new smartphone battery. Figure 6 shows a significant amount of non-uniformity in the positioning of the electrode layers in the used battery. The non-uniform separation between electrode layers will cause non-uniform distribution of electrolyte between layers leading to localized spots of high and low ohmic resistances. Since the battery temperature is affected by the ohmic heating during the charge–discharge operation, the non-uniform resistance distribution will cause uneven temperature distribution. This uneven temperature distribution is highly detrimental for battery performance and can lead to accelerated degradation of the battery. Also, the regions of small separation between electrode layers will be prone to internal short-circuiting through lithium dendrites.
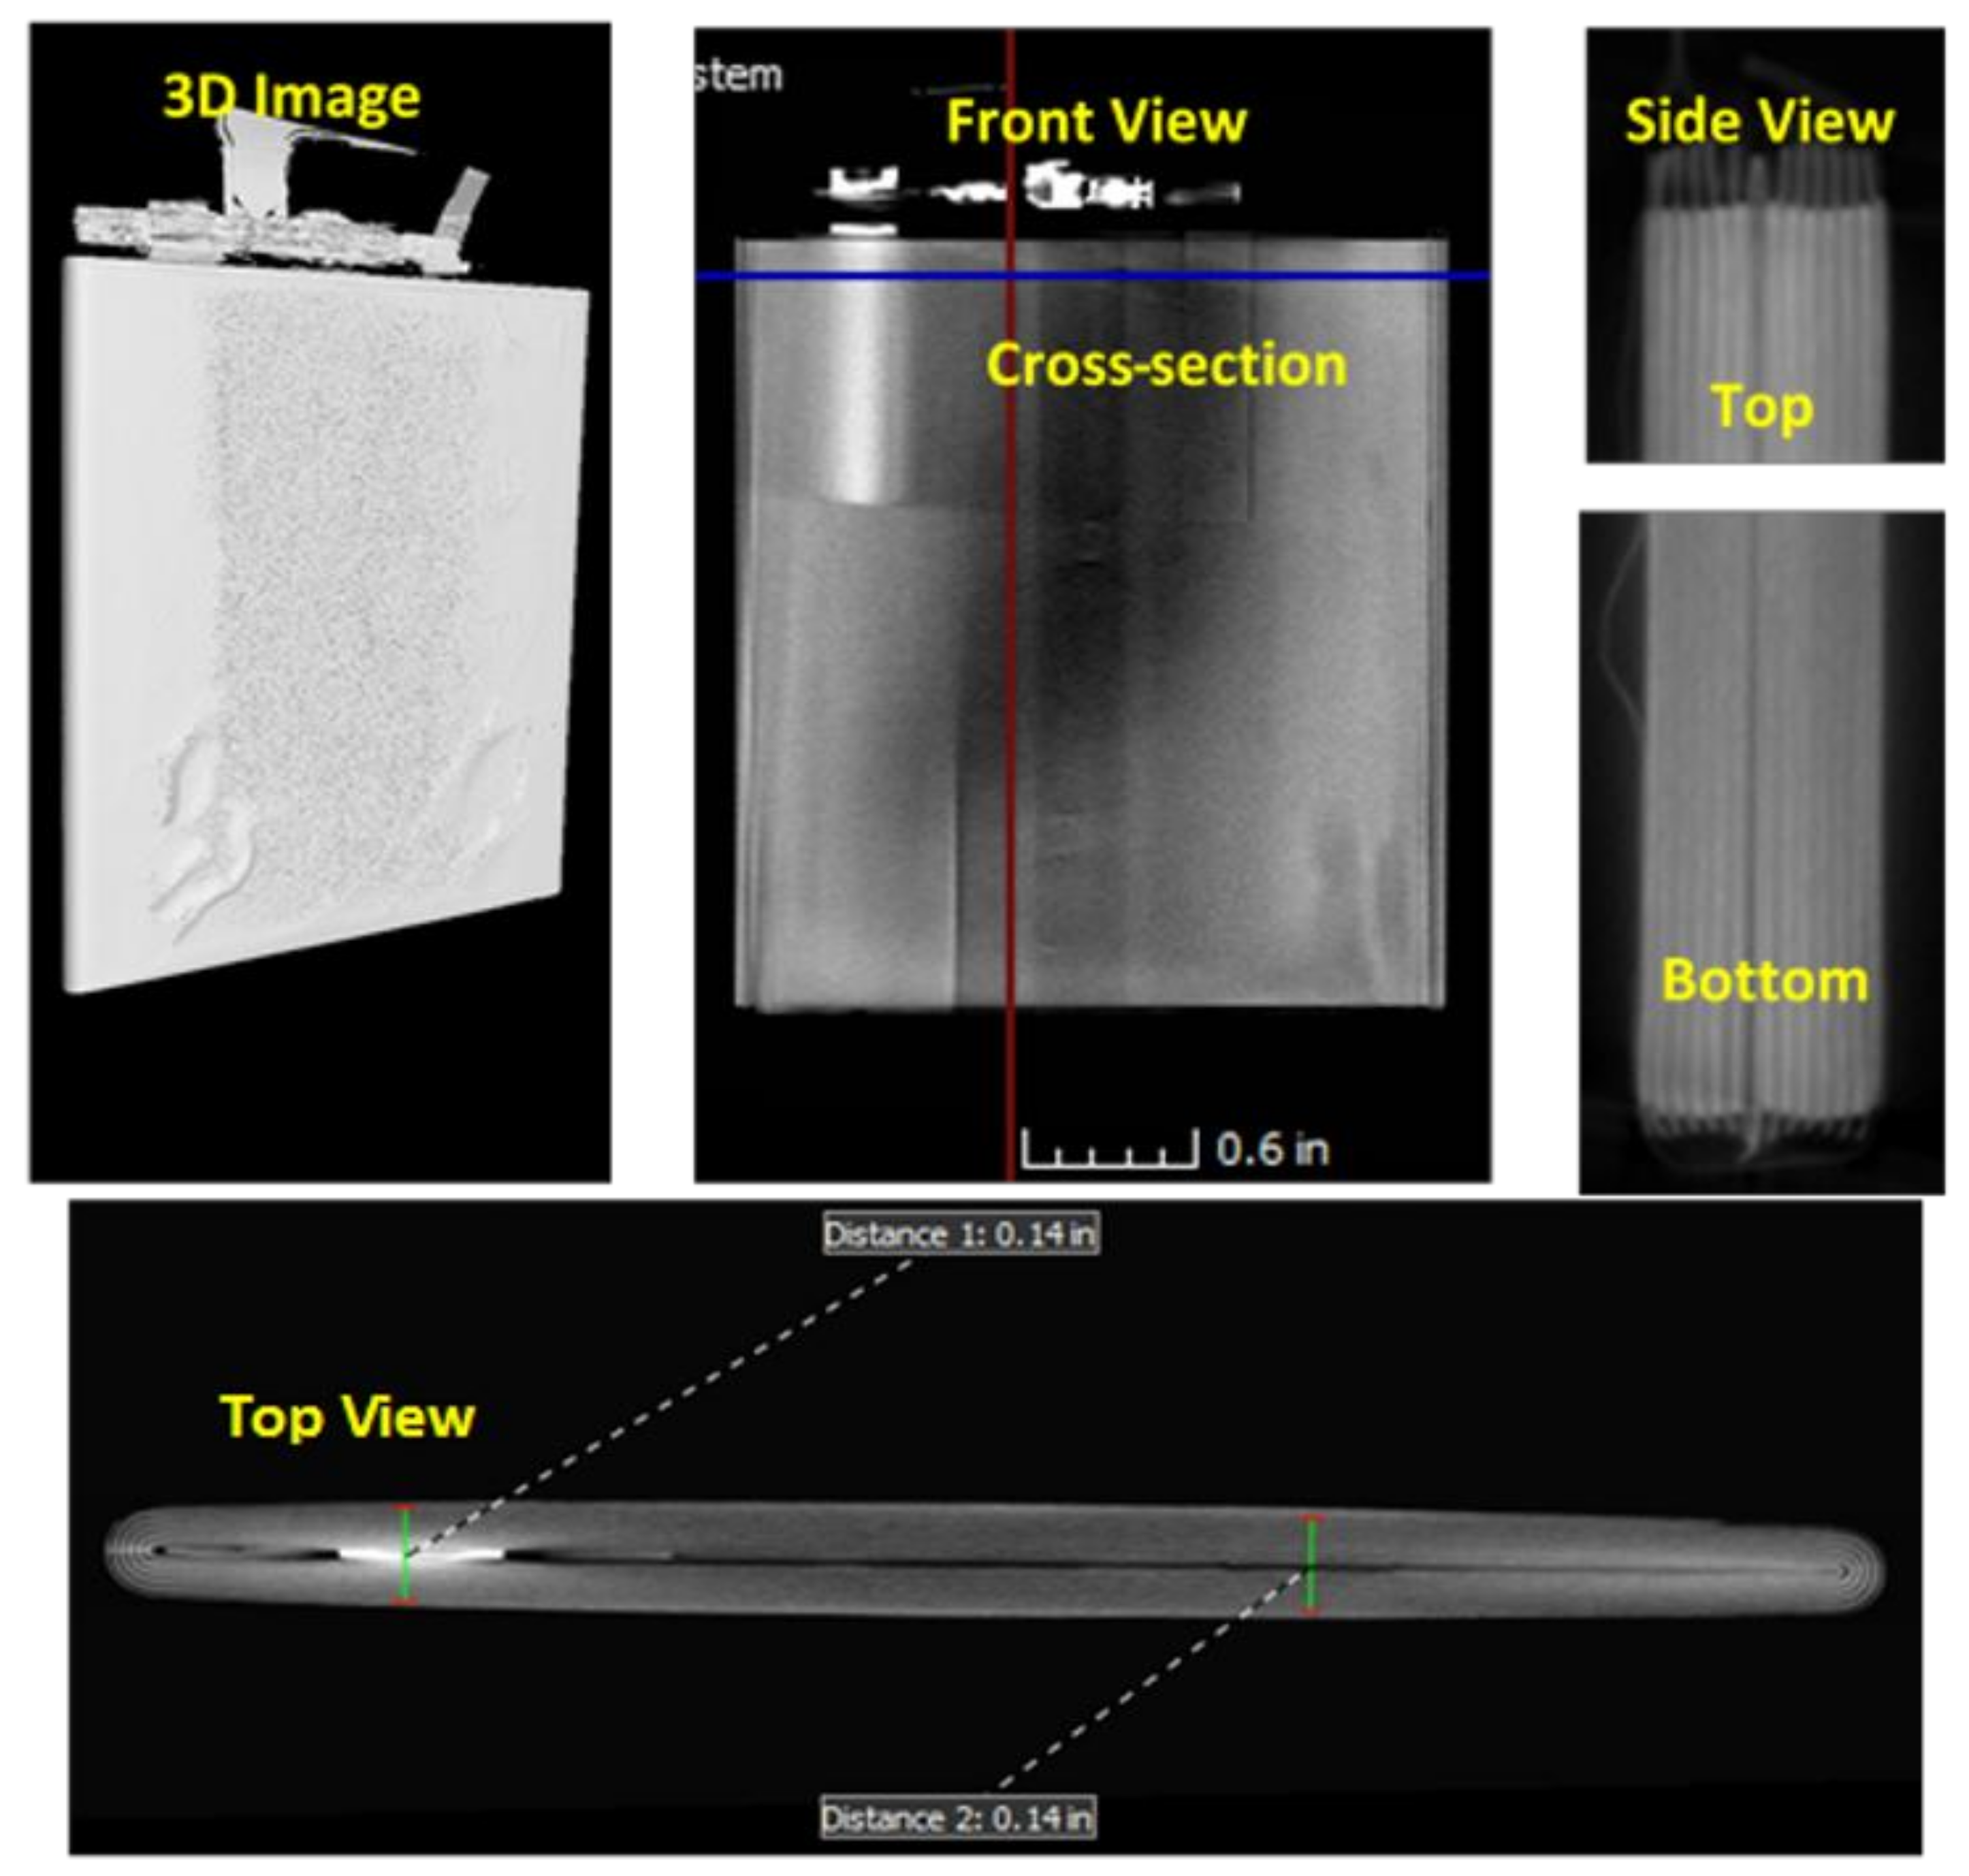
Figure 7 shows two areas with higher grayscale values compared to the nearby jellyroll material inside the used battery. The grayscale values along the (green) lines passing through two points were measured (Figure 7b,d). The CT scan images (Figure 7a,c) indicate the possibility of contaminant particles inside the jellyroll. However, the composition and nature (metallic or non-metallic) of these particles could not be confirmed using CT scanning.
5. Cycle Life Testing
Cycle life testing was carried out only on new smartphone battery at room temperature (20–24 °C) to determine its capacity fade trend. The used battery delivered only 20% of its rated capacity, well below the usually defined end of life threshold of 80% capacity, during the first cycle after the receipt of phone. It also exhibited a sharp drop of 5% capacity in the next cycle. Hence the cycle life testing of this battery will not provide any useful information on the capacity fade trend.
After the first two initial electrical performance (capacity, impedance and resistance) characterization cycles on the new smartphone battery (Section 3), the battery was subjected to an additional 400 cycles during this testing. A full cycle was defined as the charge—discharge operation within the voltage range of 4.4–3.0 V. The charging operation was conducted using the constant current constant voltage (CCCV) standard charge algorithm. The battery was charged using a constant C/2 rate up to 4.4 V, followed by a ‘top-up’ using constant voltage (4.4 V) charging until the charging current dropped below the charge cut-off of C/100. Immediately after the charge operation, the battery was discharged at a constant rate of C/2. A rest period of 10 min after the discharge step was provided before starting the charge operation of the next cycle. The rest period was provided to reduce the temperature and concentration gradients inside the battery, which can affect the measurements of capacity in subsequent cycles during cycle life testing. The cycle life testing was also paused at a few instances for impedance measurements and CT scan testing.
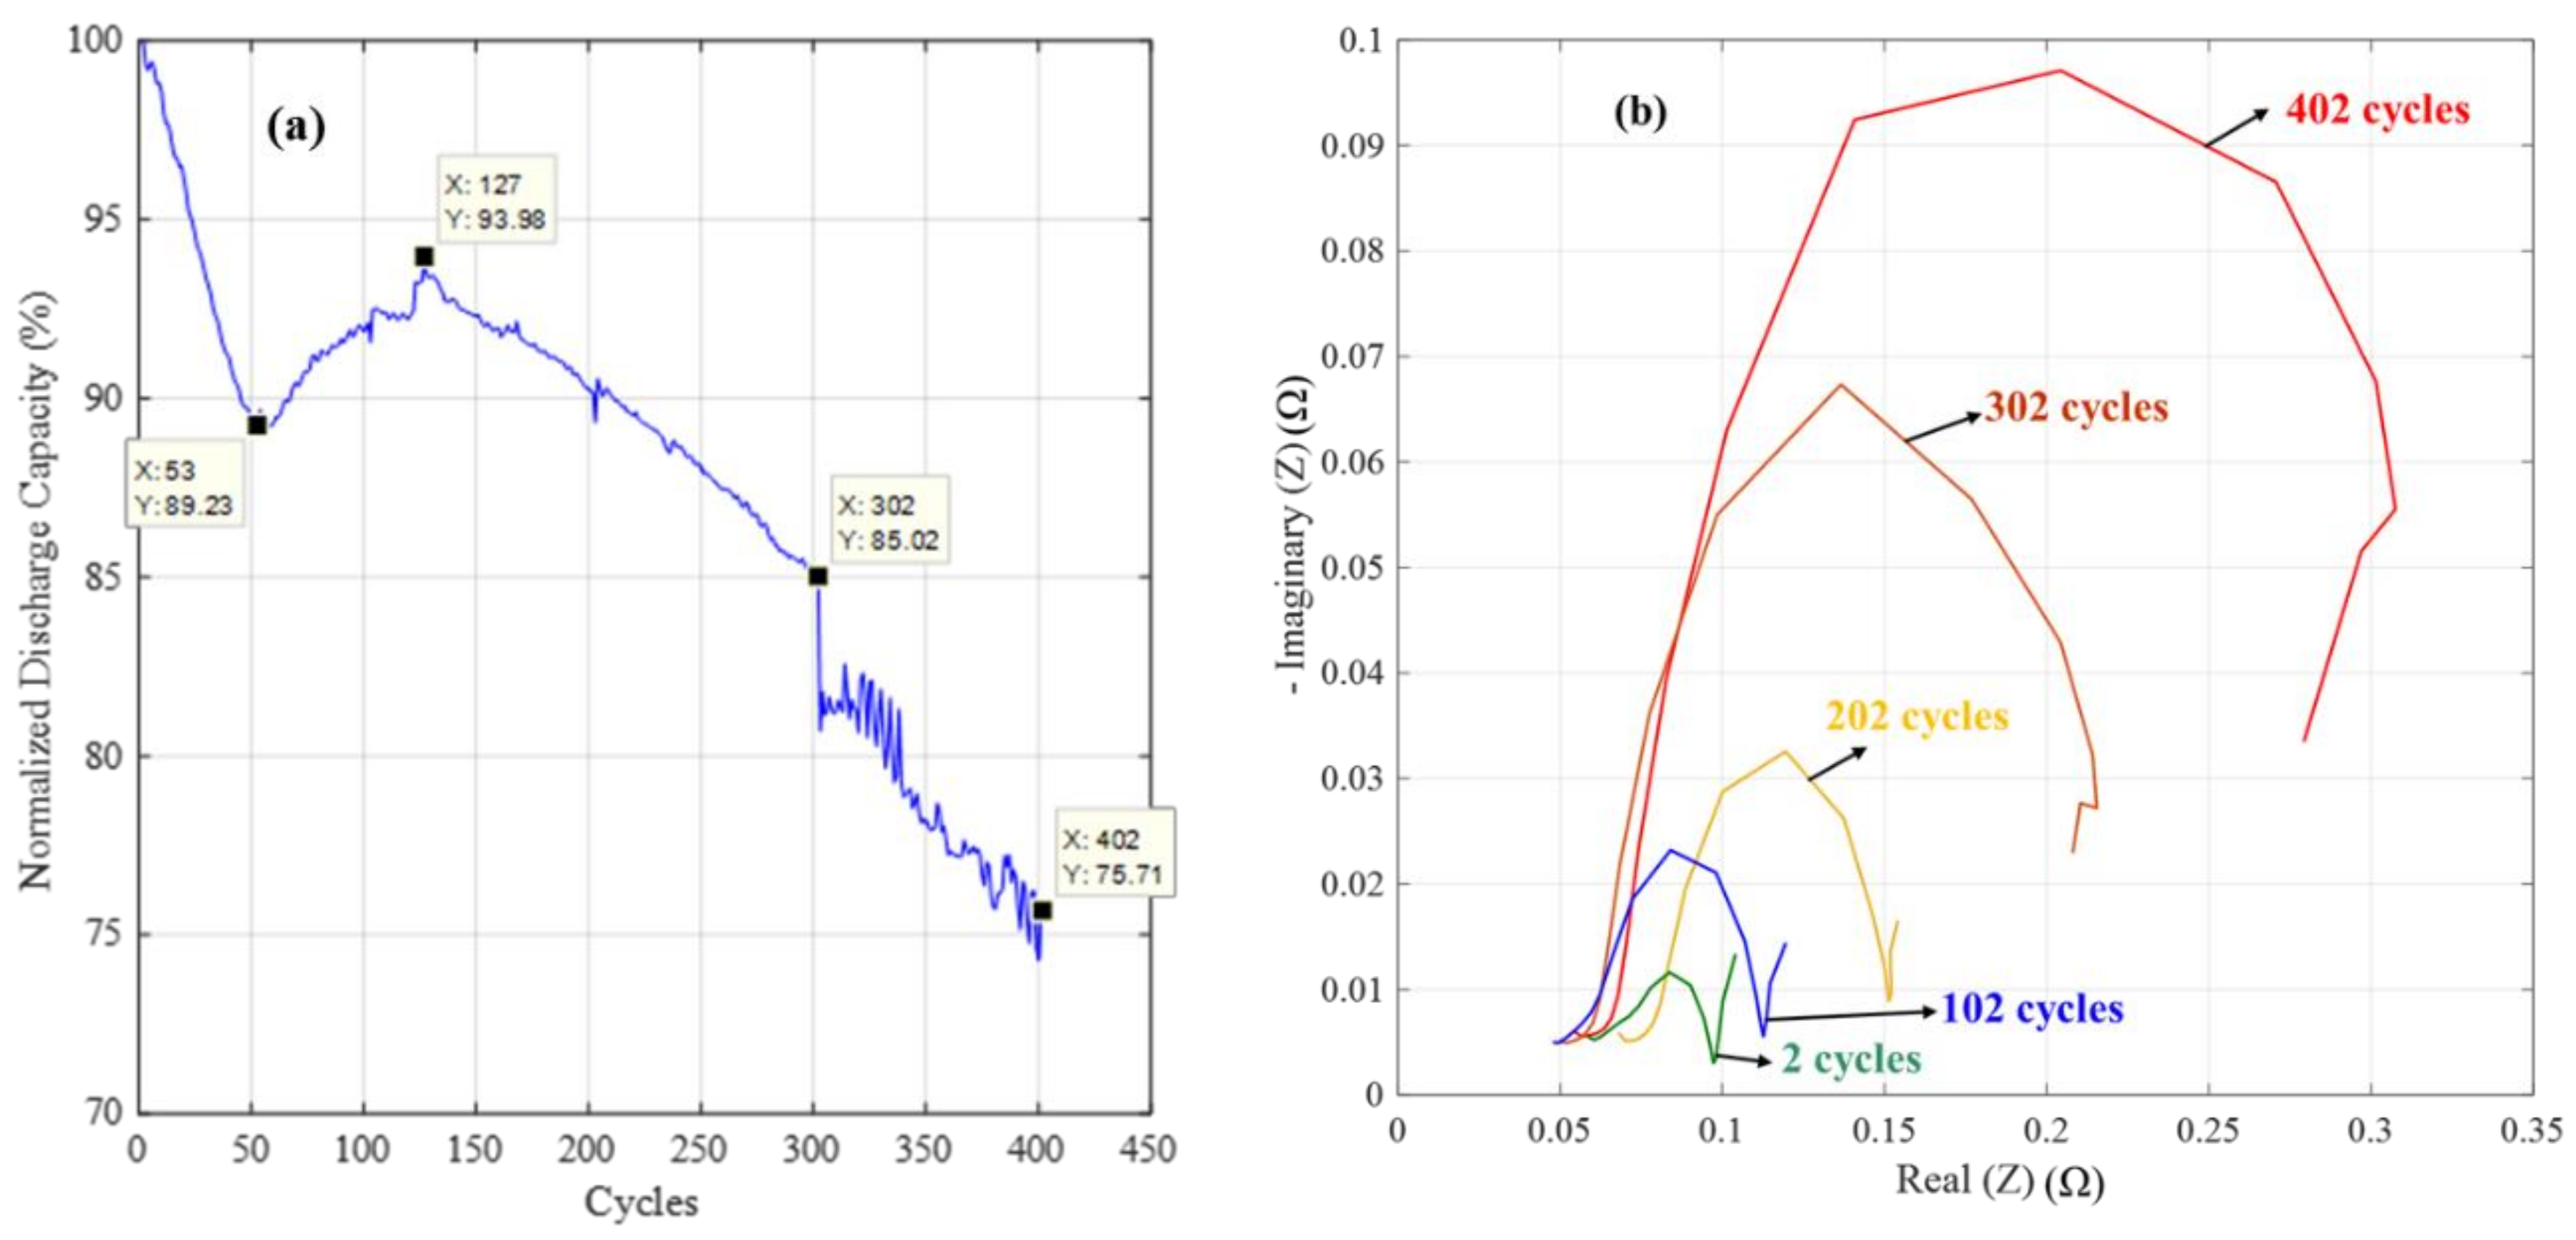
Figure 8a shows the capacity fade curve for the new smartphone battery. On the y-axis, the normalized percentage value of discharge capacity with respect to the first cycle (initial) discharge capacity is shown. The capacity of the new smartphone battery falls to 89% of its initial capacity just after 53 cycles, indicating poor cycle life performance of the battery. However, after 53 cycles, the battery capacity surprisingly starts to increase nearly monotonically until 127 cycles, reaching 94% of its initial capacity. After 127 cycles, the battery capacity again starts to decrease nearly monotonically up until 302 cycles, followed by a non-monotonic decreasing trend until 402 cycles, the end of testing. After 402 cycles, the battery retains nearly 76% of its initial capacity, which is below the widely used 80% capacity-based end of life threshold for Li-ion batteries.
During the cycle life testing, after every 100 cycles, the impedance and internal resistance measurements were recorded for the new smartphone battery. Three measurements for both parameters were collected for each battery. Table 3 summarizes the means and standard deviations of impedance and resistance measurements taken during the cycle life testing. The impedance at 0.0125 Hz, which is representative of lithium diffusion phenomenon, increased monotonically during the cycle life testing. The impedance at 1.638 KHz, which is representative of ohmic resistance and SEI layer impedance, did not show any definite trend or significant change in value during the cycling operation. The internal resistance after 402 cycles was 156 mΩ, higher than the initial value of 70 mΩ, but the trend did not monotonically increase. This non-monotonic resistance behaviour is also contradictory to the normal aging behaviour of a Li-ion battery. Figure 8b shows the evolution of impedance measurements for the new smartphone battery during cycle life testing. The magnitude of impedance, |Z| at the highest frequency, 1.638 KHz, was 55 mΩ and at the lowest frequency, 0.0125 Hz, it was 281 mΩ after 402 cycles. Interestingly, the shape of the impedance curve for the new smartphone battery after 402 cycles had become similar to that of the impedance curve obtained for the used smartphone battery after the second cycle (Figure 4b), with a distorted diffusion region causing an increase in the impedance corresponding to 0.0125 Hz. The curve confirms the increased level of degradation in the battery, as already shown by the capacity fade trend of the battery. A similar distorted diffusion region was also observed in the impedance curve of the new smartphone battery after 302 cycles. However, up until 202 cycles, the new smartphone battery followed the standard impedance curve shape (Figure 4a), suggesting that somewhere between 202 and 302 cycles, the diffusion phenomenon inside the battery was severely affected. Also, it can be observed in Figure 8b that the impedance of the battery increases with cycles at all of the frequencies, except at a few higher ones.
6. Discussion
Three different types of tests—electrical performance tests, CT scan inspection, and cycle life tests—were conducted on two Li-ion batteries, obtained from one new and one used Nexus 6P smartphone. After the electrical and CT scan testing, the used smartphone battery was disassembled to identify the battery chemistry. An energy-dispersive X-ray spectroscopy (EDS) analysis of battery electrodes showed large quantities of carbon (C) on the negative electrode and cobalt (Co) and oxygen (O) on the positive electrode, suggesting graphite–LiCoO2 chemistry. Electrical performance tests were conducted to record initial measurements for the batteries in the condition that they were received in and to evaluate their adherence to manufacturer-specified ratings. The first cycle measurements showed that the new battery not only outperformed the used battery in all three metrics of discharge capacity, internal resistance, and impedance, but also delivered more discharge capacity than the specified rated capacity. Although the used battery was not expected to deliver its rated capacity since aging reduces a battery’s available capacity, the capacity delivered, which was just ~20% of the rated capacity, indicated severe degradation. This severe degradation points to the possibility of either manufacturing defects or abusive operation of the battery. The impedance measurements for the used battery showed a distorted diffusion region, a deviation from the standard battery impedance spectrum, thus confirming the battery’s severe degradation. When a second cycle of charge/discharge operations was conducted on these batteries, the new battery maintained its capacity while the used battery lost nearly 5% of capacity with respect to the rated capacity. This showed that the capacity fade rate was very high for the used battery when it was received for the testing.
CT scan images of the used battery showed the presence of contaminant particles within the windings of the jellyroll. This result raises questions about the quality of manufacturing. These contaminants can affect the localized resistance and, in worst cases, provide possible paths for short circuiting between the layers. The CT scan images did not reveal any contaminants or any issue with the placement of electrodes in the new battery as all the layers were uniformly arranged. The cycle life test was conducted to find the capacity fade trend of the new battery. After the first two electrical performance characterization cycles, the new battery experienced ~10% capacity loss in just 50 cycles, which indicates poor cycle life performance and accelerated degradation. Usually, the time required for completing 50 cycles of the smartphone battery is even less than the warranty period provided for the smartphone. After 53 cycles, the new battery started showing an unexpected increase in capacity, with nearly 5% of capacity recovered over the next 74 cycles. However, the capacity started decreasing again after 127 cycles, reaching 76% of its initial value after the end of testing at 402 cycles. This non-monotonic capacity fade trend with high capacity change rates points to a design flaw in the battery. This kind of degradation or failure behavior is very unique to this battery and is usually not expected during normal battery aging. After 302 cycles, the new battery also started showing a severe level of degradation, with a distorted impedance spectrum and a high value of impedance at the lowest frequency of 0.0125 Hz, similar to the behavior of the used smartphone battery after two cycles. Large increases in impedance with the number of cycles (Figure 8b) will limit the rate capability of the battery. In this condition, if the battery is subjected to discharge current levels greater than C/2, a likely condition during intense smartphone usage, then it will deliver a much lower capacity than what is shown in Figure 8a, and this may cause unexpected shutdown.
7. Conclusions
The premature battery drain issue in Nexus 6P smartphones has been causing the interruption of phone operation and erratic shutdown, despite the charge indicator showing a significant remaining battery runtime. This study investigated the premature battery drain issue by testing Li-ion batteries from two Nexus 6P smartphones (one new and one used) to reveal their degradation characteristics and trends. The used battery initially delivered only 20% of its rated capacity in the first cycle, resulting in reduction of runtime by a factor of 5. The capacity reduced further to 15% in the subsequent cycle. This level of degradation is not acceptable within the expected operational life (2–3 years) of a smartphone. The impedance and resistance measurements also confirmed the poor performance of the used battery with the impedance spectrum not following the standard battery impedance diffusion behavior, which is central to the Li-ion battery working mechanism. Though the new battery showed superior electrical performance in the beginning, it started degrading at an accelerated rate and exhibiting erratic and unique degradation behaviour, characterized by a non-monotonic capacity fade trend and distorted diffusion impedance when subjected to the cycle life testing for 400 cycles. The CT scan observation confirmed the presence of contaminant particles inside the used smartphone battery raising question about the manufacturing quality.
Given a product should be designed to reliably perform under its life cycle operating conditions for its specified operational life, the erratic and highly accelerated capacity fade behaviour of Nexus batteries, that occur within the operation life of the smartphone, cannot be explained even under intense smartphone usage. The highly accelerated nature of the degradation suggests a problem with the battery. As this study confirms the problem with Nexus batteries, an open, detailed and collaborative investigation of the premature drain problem by all stakeholders is required to find the solution
Acknowledgments
The authors are supported by the Center for Advanced Life Cycle Engineering (CALCE) at the University of Maryland, which is funded by more than 150 companies and organizations concerned with electronics reliability and safety. CALCE is a recipient of the NSF Innovation Award for its research into electronics reliability. The CALCE battery team explores battery design, test methods, life cycle reliability and safety (See https://calce.umd.edu/batteries).
Author Contributions
Saurabh Saxena and Michael Pecht conceived and designed the experiments; Saurabh Saxena and Yinjiao Xing performed the experiments and analyzed the data; Saurabh Saxena, Yinjiao Xing and Michael Pecht wrote the paper.
Conflicts of Interest
The authors declare no conflict of interest.
References
- GSMArena, Huawei Nexus 6P. Available online: http://www.gsmarena.com/huawei_nexus_6p-7588.php (accessed on 12 July 2017).
- England, J. Bootloops and Battery Issues Ruined the Nexus 6P and Are Definitely Cause for a Lawsuit, Your Tech Explained, 2 May 2017. Available online: https://yourtechexplained.com/2017/05/02/nexus-6p-bootloop-battery-issue-lawsuit/ (accessed on 12 July 2017).
- Behar, R. Google and Huawei Sued over Nexus 6P bootloop and Battery Drain Issues, MobileSyrup.com, 20 April 2017. Available online: http://mobilesyrup.com/2017/04/20/google-and-huawei-sued-over-nexus-6p-bootloop-and-battery-drain-issues/ (accessed on 12 July 2017).
- Wang, J. Nexus 6P Charge State Bug Persists on Android Nougat, Pocketnow.com, 21 December 2016. Available online: http://pocketnow.com/2016/12/21/nexus-6p-charge-state-bug-persists (accessed on 12 July 2017).
- Kevin Nexus 6P Battery Randomly Dying? It’s Not just You, Gadget Hacks.com, 22 December 2016. Available online: https://android.gadgethacks.com/news/nexus-6p-battery-randomly-dying-its-not-just-you-0175625/ (accessed on 12 July 2017).
- Google Issue Tracker, Nexus 6P Shutdown before Battery Is Discharged. Available online: https://issuetracker.google.com/issues/37126855 (accessed on 29 November 2017).
- Ozzman54, Nexus 6P Randomly Shutting down under 50%—You’re Not Alone! XDA-Developers.com, 22 December 2016. Available online: https://forum.xda-developers.com/nexus-6p/general/nexus-6p-randomly-shutting-50-youre-t3522911 (accessed on 12 July 2017).
- Vetter, J.; Novak, P.; Wagner, M.R.; Veit, C.; Moller, K.C.; Besenhard, J.O.; Winter, M.; Wohlfahrt-Mehrens, M.; Vogler, C.; Hammouche, A. Ageing mechanisms in lithium-ion batteries. J. Power Sources 2005, 147, 269–281. [Google Scholar]
- Broussely, M.; Biensan, P.; Bonhomme, F.; Blanchard, P.; Herreyre, S.; Nechev, K.; Staniewicz, R.J. Main aging mechanisms in Li ion batteries. J. Power Sources 2005, 146, 90–96. [Google Scholar] [CrossRef]
- Hendricks, C.; Williard, N.; Mathew, S.; Pecht, M. A failure modes, mechanisms, and effects analysis (FMMEA) of lithium-ion batteries. J. Power Sources 2015, 297, 113–120. [Google Scholar] [CrossRef]
- Christensen, J.; Newman, J. Stress generation and fracture in lithium insertion materials. J. Solid State Electrochem. 2006, 10, 293–319. [Google Scholar] [CrossRef]
- Mohanty, D.; Hockaday, E.; Li, J.; Hensley, D.K.; Daniel, C.; Wood, D.L. Effect of electrode manufacturing defects on electrochemical performance of lithium-ion batteries: Cognizance of the battery failure sources. J. Power Sources 2016, 312, 70–79. [Google Scholar] [CrossRef]
- Cannarella, J.; Arnold, C.B. The effects of defects on localized plating in lithium-ion batteries. J. Electrochem. Soc. 2015, 162, A1365–A1373. [Google Scholar] [CrossRef]
- Lionheart, S.; Noronha, E.; Suovanen, J.; Kelsea, B.; McCrigler, A.O.; Goldberg, R.; Davis, G.; Wacker, W.; Galan, J. Nexus 6P Teardown, iFixit.com, 28 October 2015. Available online: https://www.ifixit.com/Teardown/Nexus+6P+Teardown/51660 (accessed on 12 July 2017).
- Ketcham, R. X-ray Computed Tomography (CT), Science Education Resource Center Carleton College. Available online: https://serc.carleton.edu/research_education/geochemsheets/techniques/CT.html (accessed on 12 July 2017).
- Carter, R.; Huhman, B.; Love, C.T.; Zenyuk, I.V. X-ray computed tomography comparison of individual and parallel assembled commercial lithium iron phosphate batteries at end of life after high rate cycling. J. Power Sources 2018, 381, 46–55. [Google Scholar] [CrossRef]
- Waldmann, T.; Gorse, S.; Samtleben, T.; Schneider, G.; Knoblauch, V.; Wohlfahrt-Mehrens, M. A mechanical aging mechanism in lithium-ion batteries. J. Electrochem. Soc. 2014, 161, A1742–A1747. [Google Scholar] [CrossRef]
- Yufit, V.; Shearing, P.; Hamilton, R.W.; Lee, P.D.; Wu, M.; Brandon, N.P. Investigation of lithium-ion polymer battery cell failure using X-ray computed tomography. Electrochem. Commun. 2011, 13, 608–610. [Google Scholar] [CrossRef]
- Finegan, D.P.; Scheel, M.; Robinson, J.B.; Tjaden, B.; Hunt, I.; Mason, T.J.; Millichamp, J.; Di Michiel, M.; Offer, G.J.; Hinds, G.; et al. In-operando high-speed tomography of lithium-ion batteries during thermal runaway. Nat. Commun. 2015, 6, 6924. [Google Scholar] [CrossRef] [PubMed]
- Samsung. Samsung Announces Cause of Galaxy Note7 Incidents in Press Conference. 2017. Available online: https://news.samsung.com/us/Samsung-Electronics-Announces-Cause-of-Galaxy-Note7-Incidents-in-Press-Conference (accessed on 24 March 2018).
Figure 1.
(a) Back cover of the new smartphone; (b) separated back and front panels of the new smartphone; (c) back cover of the used smartphone; (d) separated back and front panels of used smartphone.
Figure 1.
(a) Back cover of the new smartphone; (b) separated back and front panels of the new smartphone; (c) back cover of the used smartphone; (d) separated back and front panels of used smartphone.

Figure 2.
Li-ion batteries of (a) new smartphone and (b) used smartphone.

Figure 3.
Voltage and current profiles for batteries from (a) the new smartphone and (b) the used smartphone during the first cycle charge–discharge operations.
Figure 3.
Voltage and current profiles for batteries from (a) the new smartphone and (b) the used smartphone during the first cycle charge–discharge operations.

Figure 4.
Impedance spectrum for the (a) new smartphone battery and (b) the used smartphone battery after the second cycle.
Figure 4.
Impedance spectrum for the (a) new smartphone battery and (b) the used smartphone battery after the second cycle.

Figure 5.
The CT scan images of the new smartphone battery.

Figure 6.
The CT scan images of the used smartphone battery.

Figure 7.
(a,c) Points with high brightness inside the used sample at two different locations and (b,d) the gray values of the (green) line crossing the points.
Figure 7.
(a,c) Points with high brightness inside the used sample at two different locations and (b,d) the gray values of the (green) line crossing the points.

Figure 8.
(a) Capacity fade curve of the new smartphone battery and (b) impedance spectrum evolution for the new smartphone battery during cycle life testing.
Figure 8.
(a) Capacity fade curve of the new smartphone battery and (b) impedance spectrum evolution for the new smartphone battery during cycle life testing.


Table 1.
Li-ion battery parameters of two smartphones.
| Parameters | New Smartphone Battery | Used Smartphone Battery |
|---|---|---|
| Rated Capacity | 3.4500 Ah | 3.4500 Ah |
| Rated Voltage | 3.82 V | 3.82 V |
| Limited Charge Voltage | 4.40 V | 4.40 V |
| Measured Thickness | 3.90 ± 0.01 mm | 4.10 ± 0.01 mm |
| Measured Width | 65.89 ± 0.01 mm | 65.96 ± 0.01 mm |
| Measured Length | 78.53 ± 0.01 mm | 78.74 ± 0.01 mm |
Table 2.
Electrical measurements of batteries from two smartphones.
| Parameter | New Smartphone Battery | Used Smartphone Battery |
|---|---|---|
| Discharge Capacity in 1st Cycle (4.4–3.0 V, C/2) | 3.5076 Ah | 0.6795 Ah |
| Discharge Capacity in 2nd Cycle (4.4–3.0 V, C/2) | 3.5050 Ah | 0.5024 Ah |
| Internal Resistance * (using battery cycler, at 100% SOC, after 2nd cycle) | 70 mΩ (SD = 9 mΩ) | 184 mΩ (SD = 19 mΩ) |
| Internal Resistance (using voltage drop, at 100% SOC, after 2nd cycle) | 81 mΩ | 375 mΩ |
| Impedance Magnitude *, |Z| (at 1.638 KHz, at 100% SOC, after 2nd cycle) | 59 mΩ (SD = 4 mΩ) | 73 mΩ (SD = 1 mΩ) |
| Impedance Magnitude *, |Z| (at 0.0125 Hz, at 100% SOC, after 2nd cycle) | 105 mΩ (SD = 6 mΩ) | 391 mΩ (SD = 5 mΩ) |
* The values for this parameter indicate mean and standard deviation (SD) of three measurements.
Table 3.
Means and standard deviations of impedance and resistance measurements of the new smartphone battery after different numbers of cycles.
Table 3.
Means and standard deviations of impedance and resistance measurements of the new smartphone battery after different numbers of cycles.
| Cycles | Impedance Magnitude +, |Z| (at 1.638 KHz and 100% SOC) | Impedance Magnitude +, |Z| (at 0.0125 Hz and 100% SOC) | Internal Resistance + (Using Battery Cycler and 100% SOC) |
|---|---|---|---|
| 2 * | 59 mΩ (SD = 4 mΩ) | 105 mΩ (SD = 6 mΩ) | 70 mΩ (SD = 9 mΩ) |
| 102 | 48 mΩ (SD = 0 mΩ) | 120 mΩ (SD = 4 mΩ) | 59 mΩ (SD = 9 mΩ) |
| 202 | 68 mΩ (SD = 6 mΩ) | 155 mΩ (SD = 8 mΩ) | 70 mΩ (SD = 19 mΩ) |
| 302 | 50 mΩ (SD = 2 mΩ) | 209 mΩ (SD = 1 mΩ) | 59 mΩ (SD = 9 mΩ) |
| 402 | 55 mΩ (SD = 2 mΩ) | 281 mΩ (SD = 2 mΩ) | 156 mΩ (SD = 9 mΩ) |
* Represents the first two electrical performance characterization cycles. + The values for this parameter indicate the mean and standard deviation (SD) of three measurements.
© 2018 by the authors. Licensee MDPI, Basel, Switzerland. This article is an open access article distributed under the terms and conditions of the Creative Commons Attribution (CC BY) license (http://creativecommons.org/licenses/by/4.0/).
Share and Cite
MDPI and ACS Style
Saxena, S.; Xing, Y.; Pecht, M. A Unique Failure Mechanism in the Nexus 6P Lithium-Ion Battery. Energies 2018, 11, 841. https://doi.org/10.3390/en11040841
AMA Style
Saxena S, Xing Y, Pecht M. A Unique Failure Mechanism in the Nexus 6P Lithium-Ion Battery. Energies. 2018; 11(4):841. https://doi.org/10.3390/en11040841
Chicago/Turabian StyleSaxena, Saurabh, Yinjiao Xing, and Michael Pecht. 2018. "A Unique Failure Mechanism in the Nexus 6P Lithium-Ion Battery" Energies 11, no. 4: 841. https://doi.org/10.3390/en11040841
Note that from the first issue of 2016, this journal uses article numbers instead of page numbers. See further details here.