1. Introduction
According to the 2015 report published by the research and consulting firm Northeast Group (Plattsburgh, NY, USA) [
1], there are currently 304 million streetlights in the world and this number will increase up to 352 million by 2025. The electricity cost of public lighting is a major cost factor in local government budgets. For example, in Germany, this factor accounts for almost one third of the total amount of its municipality’s funds [
2].
This fact provides a strong incentive for municipalities to take the lead in using more efficient technologies; the 2010 Covenant of Mayors agreement (signed by 4400 EU municipality partners) promoted working on sustainable energy action plans, with the objective of reaching the 3 × 20 goals by the year 2020 [
3]. The public outdoor lighting market is undergoing a period of change, where conventional streetlights are being replaced with new and more efficient technologies like LEDs, to optimize electrical costs, improve the reliability of the lighting facilities and to obtain political credit through environmental awareness [
4].
It is estimated that the transition to LED luminaires can reduce electricity consumption in public lighting up to 50%, while maintaining equivalent levels of illumination [
5] and improving the ability to regulate light and the quality of color reproduction [
6]. Valentová and others [
7] published a report of the status of 106 LED test cases from 17 European countries with an average energy saving of 55% compared with that of the original installation. Thus, it is common to justify LED investments economically due to their effective amortization periods of less than three years [
8]. In this situation, with expectations of cost reduction in LEDs and with improved energy efficiencies (currently up to 200 lm/W in commercial encapsulations [
9,
10]), countries are expected to invest
$53.7 billion in LED street lighting from 2015 to 2025 [
1].
Kostic and Djokic [
11] published a study that indicated that people consider “
Illuminance uniformity, color of light and the feeling of comfort as most important aspects for their preference of lighting”. Glare is a fundamental part of the measure of comfort. It is defined as the subjective evaluation of the degree of discomfort or impairment of view of an object whose brightness is greater than that of the surroundings. This phenomenon is neuro-physiological and consequently, is complex to evaluate.
In outdoor lighting, polycarbonate is one of the most used materials for manufacturing diffuse covers for luminaires. Its high transparency allows high-efficiency light transmission and several compounds can be added to absorb ultraviolet radiation. Besides, it is a material with good dimensional stability and with a high impact resistance; additionally, it provides protection to their lamps against adverse weather or vandalism -increasing the overall IK an IP- and is a good flame retardant. [
12]
However, Tashiro and others [
13] have stated that “
with the rapid increase in high-power LED usage in general lighting, the relationship between a LED light source and discomfort glare has been reported by many researchers: Two major advantages of LEDs as color variety and freedom of directional design can become important demerits if they are not used properly. Several studies of LED installations have reported that the new effect of LED color and spatial non-uniformity create unpleasant discomfort glare”. This effect has been detected using open configurations or transparent polycarbonate covers that allow a direct view of the emitters, primarily in lighting installations with low height luminaires where photometric distributions that have wide emissions angles are installed to achieve proper uniformities. This is a very wide ranging configuration in low and medium size municipalities worldwide and common in large ones. Hence, additional works that investigate new materials to solve this problem with industrially manufacturable solutions that do not increment the price of this type of equipment are required. Nevertheless, performance requirements of standards, which seek minimum safety values, should not be a restraint when looking for better quality solutions that improve the user’s satisfaction beyond normative scales.
Many studies have investigated the transmittance of several polymer-based films among the large amount of materials and manufacturing processes available. The most used material in the lighting industry is polycarbonate [
14]. However, recently, polyamide is being proposed as an alternative for this purpose [
15] and it is the material analyzed in this study. Wang and others [
16] determined the light reflectance and the transmittance properties of polypropylene, polycarbonate, and polyamide. These authors concluded that a polyamide plate exhibited the highest reflectance values at wavelengths between 500 and 1000 nm compared with those of similar thickness samples made with the other two materials.
We have designed, conformed, and tested several polyamide cover closures for lantern type LED luminaires with different thicknesses, inclusions and manufacturing processes. In this paper, we present the results of the comparison evaluation process of three different solutions: one high-impact transparent polycarbonate (as reference of the most common commercial solution) and two translucent polyamide-based developments: one initial basic solution generated and the solution manufactured that offers the best results under the considerations of minimizing glare, as well as energy efficiency losses.
2. Analysis of Glare in Public Lighting
Generally, three different types of glare are considered: discomfort, disability, and irreversible. In public lighting installations, only the first two types of glare are considered by standards and regulations. Usually, empirical experiments have shown that discomfort glare typically occurs at a lower light level than that with disability glare. “
Thus, if the source luminance is set below the threshold for discomfort glare, it could also prevent disability glare” [
13].
The physiological origins of discomfort glare are a subject of study to understand the processes of the human visual system that result in the sensation of discomfort glare. Recently, Clear [
17] explained: “
There is a general agreement about the factors that cause glare (source intensity, which is determined by the source luminance, size, location and the adaptation state of the observer)”. Hence, several equations have been developed to quantify glare despite the subjective premise. In these formulas, the observer variability is addressed expressing the degree of glare in terms of the percentile of observers who consider it at or above a fixed reference level [
18].
Traditional lighting systems use optical closures to reduce the effect of glare. These systems use materials that prevent reflections and strong contrasts in luminance and with systems to generate indirect or reflected light, which allow hiding the light sources from the field of view and consider the position of the luminaires with respect to the users. This second solution involves large lighting losses, which make them inefficient. Current studies of LED luminaires indicate that their glare effect is significantly different than the one produced by conventional technologies lamps “
because of their non-uniform luminance distribution with alternating areas of high and low luminance” and conventional glare measurement indices, such as the UGR (Unified Glare Rating) of the CIE (International Comission on Illumination), are not appropriate for this latest type of light sources [
19]. Thus, Liu and others [
20] indicate that the most appropriate solution to avoid glare with this technology is to act with an outer diffuse optical cover to improve the lighting performance.
This paper analyzes several polymer-based diffuse cover designs for LED light sources, developed to minimize the effect of glare from these lights and to improve the overall uniformity of the light distribution. Both effects must be achieved by minimizing light losses in the luminaire so that the installed light output does not substantially decrease [
21,
22].
Different indexes to evaluate road lighting installations from international standards have been used in this study. As a result, these values can be compared with many others from luminaires and installations that have already been characterized using these metrics. The specific indexes used are described in the following subsections.
2.1. Discomfort Glare
The discomfort glare effect produces a sensation of excess light in the eye of the observer that hinders the clear view of objects and generates a feeling of discomfort. It does not necessarily impair visual performance but can produce psychological effects, such as stress and headaches. Two different recognized systems have been used to evaluate and catalogue this type of glare.
The first one, used for public lighting luminaires with luminous diffuse surfaces installed at low heights, is based on the assignation of a “
D” index, which is determined as a function of the range of values of maximum glare obtained by using Equation (1):
where “
I” is the maximum value of the luminous intensity (cd) in any direction that forms an 85° angle with the vertical axis and “
A” is the apparent area (m
2) of the luminous parts of the luminaire in a plane perpendicular to the direction of intensity “
I”.
Table 1 assigns an index to the following ranges of cd/m
2 calculated (CIE 115:2010 & EN 13201-2:2015).
The second system used to evaluate discomfort glare is based in the Visual Comfort Probability (VCP), developed by S.K. Guth in 1971 and adopted officially in the USA. This evaluation system assesses subjective reduction in the comfort of people for performing a task considering a given visual environment (closely linked to fatigue and loss of visual acuity) [
23].
In this case, a sensation index of the glare source “
M” is established [
24], which is calculated with Equation (2):
where
Ls (cd/m
2) is the luminance of the glare source,
F (cd/m
2) is the mean luminance of the visual field,
P is the position index of the source, and
Q is the function of the solid angle
Ws (sr) that subtends the source in an average observer’s eye. See Equation (3):
The M index is logarithmically inverse translated to a de Boer scale [
25] and is described by nine states that evaluate installations with range from unacceptable “1” with a maximum
M index (10,000) to negligible glare “9” with a minimum value (70).
2.2. Disability Glare
Disability glare is defined as the phase in which the amount of light reaching the human eye makes it impossible to distinguish details in the field of view, thereby producing eyestrain. With the cessation of the effect from the light source, normal vision is recovered. Disability glare can be assessed with the increasing threshold increment (fTI —according to the EN 13201-2 2015 standard—) or with the type of luminous intensity (G).
The
fTI system was first established by the CIE in 1977 and measures the contrast threshold which expresses the loss of visibility caused by the disturbing glare. This value, expressed as a percentage, approximates the amount of extra contrast with respect to the real value that is needed to clearly perceive an object once glare appeared. It is directly proportional to the veiling luminance (
Lv) and inversely proportional to the mean luminance of the road (
Lm) powered by 0.8 [
26].
The second system is the “
G” index—defined also by the EN 13201-2:2015. Road lighting; performance requirements. This type of glare is evaluated trough a scale of classes using the luminous intensity emitted by the luminaires as the reference value, which is easier to measure with laboratory equipment. A specific index is calculated using
Table 2.
3. Materials
In this chapter, we present the materials used to make a comparative study of light performance with an LED light source.
3.1. Characteristics of the LED Light Source (LED Lamp)
The characteristics of the LED light source used throughout the comparison process are detailed in
Table 3. These values were measured with an AR6-type CIRCUTOR network analyzer with a stabilized voltage of 230 V
AC and KYURITSU ammeter clamps (K2413R model). Its lighting parameters were measured with a goniophotometer to make photometric measurements (described in
Section 4.1) and an UPRTEK spectrometer (MK350S model) that allows calculating the irradiance diagram and color parameters of light sources.
The complete LED lamp is built with this matrix that includes 24 CREE XP-G2 LED packages and eight PMMA (PolyMethyl MethAcrylate) optics coupled with the emitters (their effect is not evaluated in
Table 3). The former change the natural hemispheric emission diagram of the LEDs to an asymmetric photometric output adequate for roadway illumination. This photometry will be analyzed in
Section 5.
3.2. Description of the Tested Optic Covers for Luminaires
We have used three different cover designs. The three of them have been made with a fiberglass substrate coated with reinforced thin semi-crystalline polyamide polymers sheets. This is a low-density high rupture strength organic compound based on a NH–C=O functional group and it has been shaped by thermomechanical extrusion at high pressure.
The reflectance in this type of polymer is caused by the generation of multiple phases inside the layer structure (crystalline polymer, amorphous polymer, reinforcements, etc.). The number of phases are associated with different levels of refraction and, consequently, with its translucent appearance. To maximize the light transmittance, the thickness of the polyamide sheet is below 0.4 mm.
The selection of this material has also been based on the analysis of the rest of their properties, which allowed optimizing multiple technical criteria and to lighting applications (this material has very slight optical variations with solar radiation and temperature changes [
27]), mechanical, economic, and ecological factors [
28,
29]. As a basic specification, the three covers are required to have a good degree of protection against impact, equal to or greater that IK10, which offers the maximum guarantees of safety and protection of the equipment. This parameter is directly related with the total thickness of the cover and relay in the mechanical properties of both the fiberglass and the polyamide.
Considering the economic matter, a mass production of this type of covers using the manufacturing process indicated, will not be a significant cost increment compared to the use of conventional polycarbonate covers. Consequently, they would not be a cause of increase in the price of the luminaire.
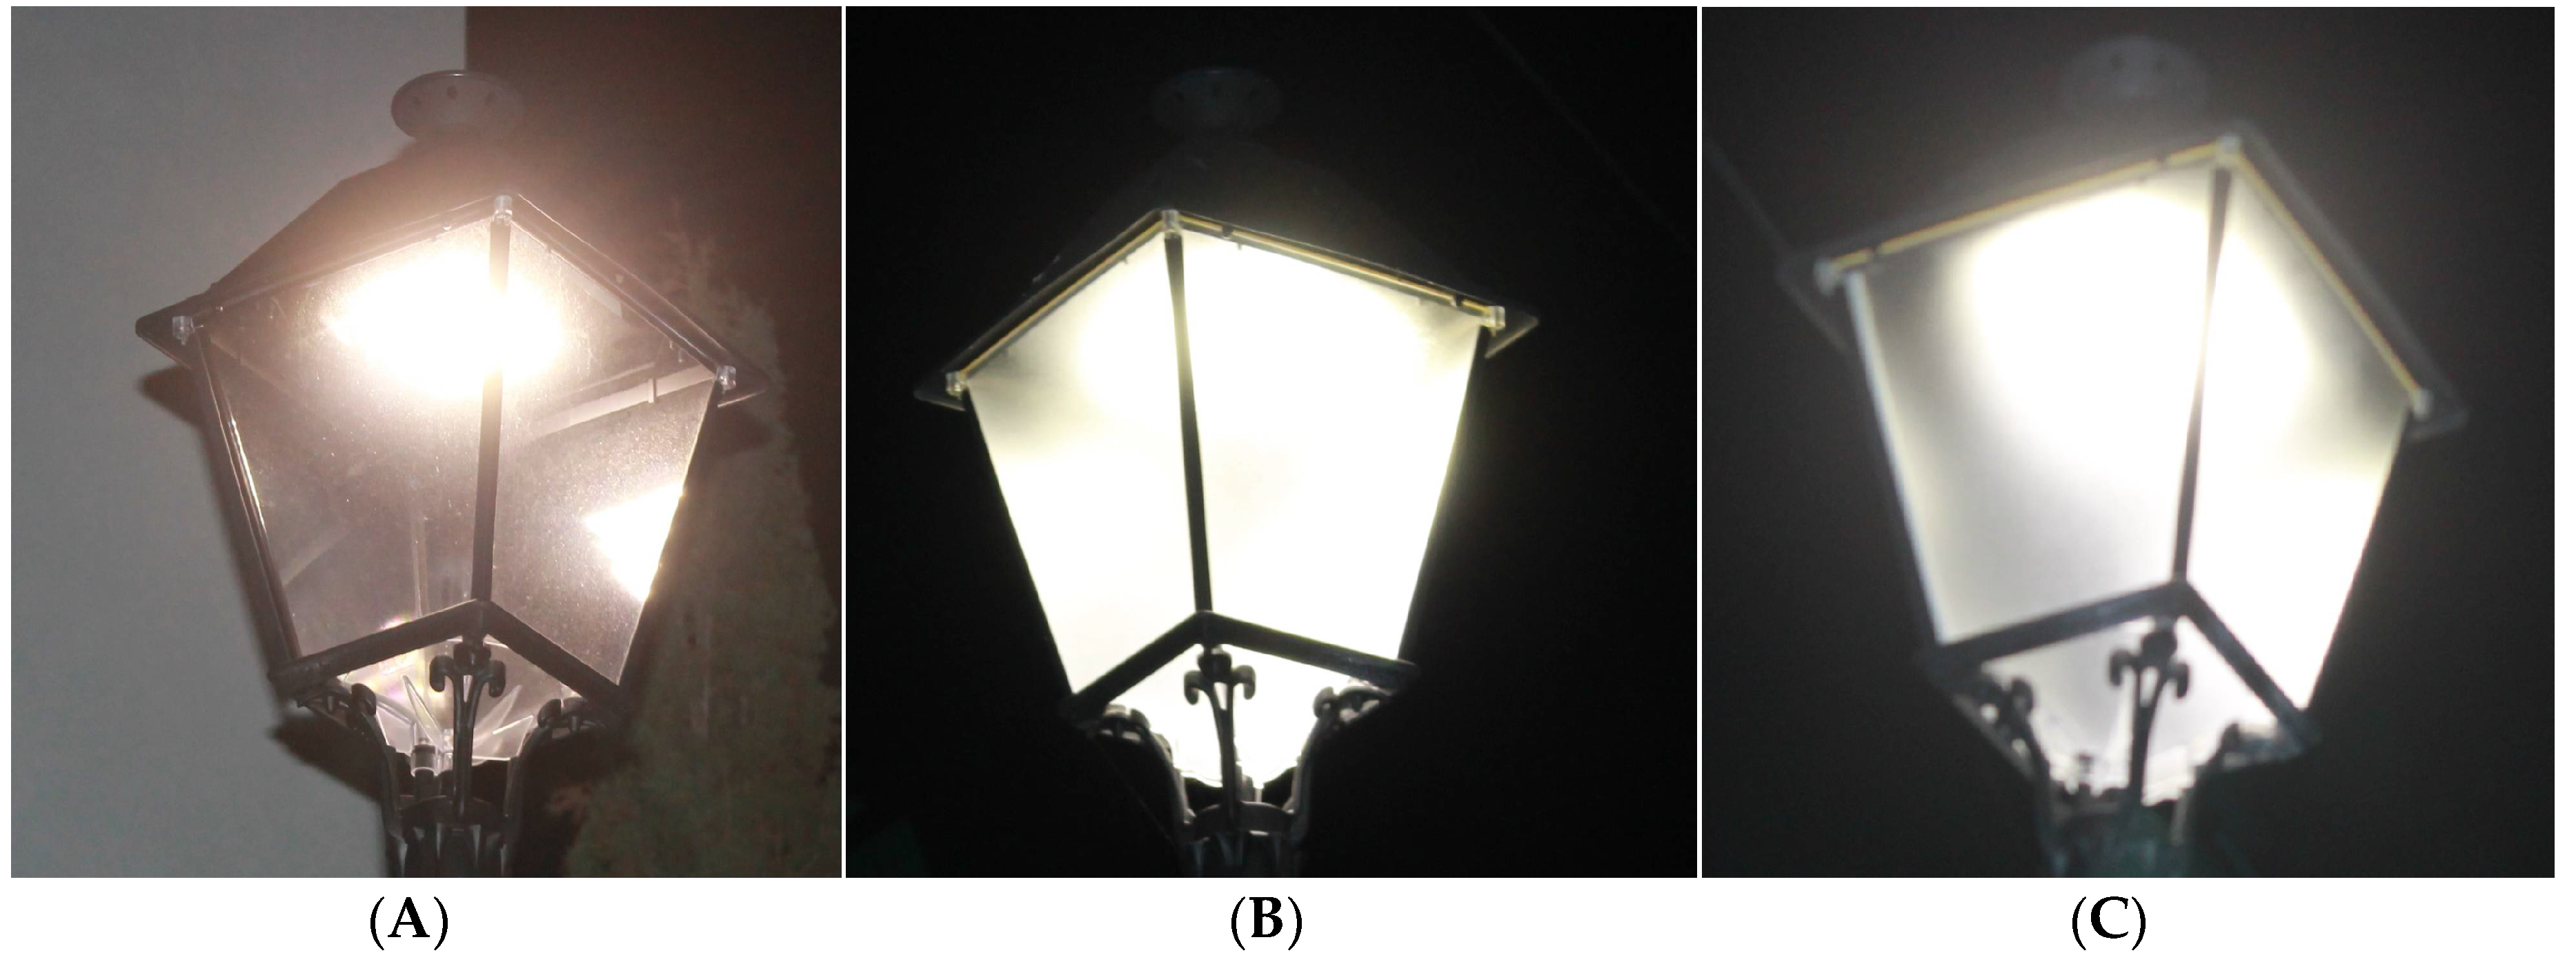
All three sets of covers were manufactured to be installed in streetlight lanterns (model: Villa; Width: 430 mm, Height: 800 mm), as presented in
Figure 1. Before being used in this experiment, they were subjected to a 3000 h endurance and aging process in a UV chamber using the standard procedure of the UNE 53104:1986 to simulate aging from normal use on public roadways.
3.2.1. Transparent Cover (A)
Smooth transparent polyamide-based layers combined with a 6 mm thick extrusion fiberglass base. The result is a thermoplastic, tropicalized, high-impact resistant, and UV-stabilized sheet. See
Figure 1A.
3.2.2. High Thickness Translucent Cover (B)
This is a tropicalized thermoplastic material that improves impact resistance and is UV-stabilized. It is built combining two thin polyamide translucent surfaces generated by adding granular polymers with a 6 mm thick transparent tempered fiberglass safety base. See
Figure 1B.
3.2.3. Low Thickness Enhanced Translucent Cover (C)
Its composition is similar to the previous material but its thickness is reduced to 3 mm with the same IK values. This is possible thanks to an accurate thermal control additive laser-sintered polymer manufacturing process that generates improved mechanical and optically translucent properties of the polyamide, as detailed by Diller and others [
30]. Over a preheated initial fiberglass substrate, a layer of polyamide is deposited and heated for a sintered process, while a laser beam melts circular patterns all over the surface. After this process finishes, a new thin layer of the thermoplastic material is deposited and heated again. This process can be repeated several times to achieve a desired thickness. Finally, smooth cooling in situ is required before removal. A fast process can lead to large geometric distortion. The final result can be seen in
Figure 1C.
4. Methodology
Evaluating the properties of translucent material is a complex task. Unlike transparent materials that transmit light with no appreciable attenuation or absorption, translucent materials include physical structures that cause the light emitted to become scattered as it passes through them. To measure parameters as the transmission of translucent materials is a challenge as regular transmission measurement procedures are not applicable. Hence, for this purpose, laboratory tests were performed with the three covers described above. Luminous intensity, luminous flux and light output performance, and disability and discomfort glare were measured using a goniphotometer and, furthermore, a field test was conducted on a real urban street, comparing the light levels found on the road expressed in terms of mean illuminance and mean and extreme uniformity.
4.1. Laboratory Tests
We used a reflection goniophotometer to measure the luminaire photometric distribution and glare-related associated parameters and indices mounted with the three optical covers:
Photometric distribution and total flux in lumens (lm)
Light Output Ratio (LOR) (%): Ratio of the luminous flux of the luminaire and the lumens of the lamps used (EN 13032-2:2015)
“D” and “M”: discomfort glare indexes
“SLI”: specific glare luminaire index
“G” index: disturbing glare or luminous intensity
The goniophotometer used is a highly accurate piece of equipment designed according to the recommendations of the CIE 70:1987 (type 2 and 3; rotation of the luminaire). The measures are obtained according to the IES LM-79-08, the EN 13032-1:2004, the EN 5489:2012, and the ILP PLG-03 (2012) standards. The tests used the C-range assessed for public lighting luminaires [
31,
32]. This method ensures the whole visual field around the lighting source is analyzed and evaluates the comfort and discomfort of a lighting environment based on the glare sensation [
33].
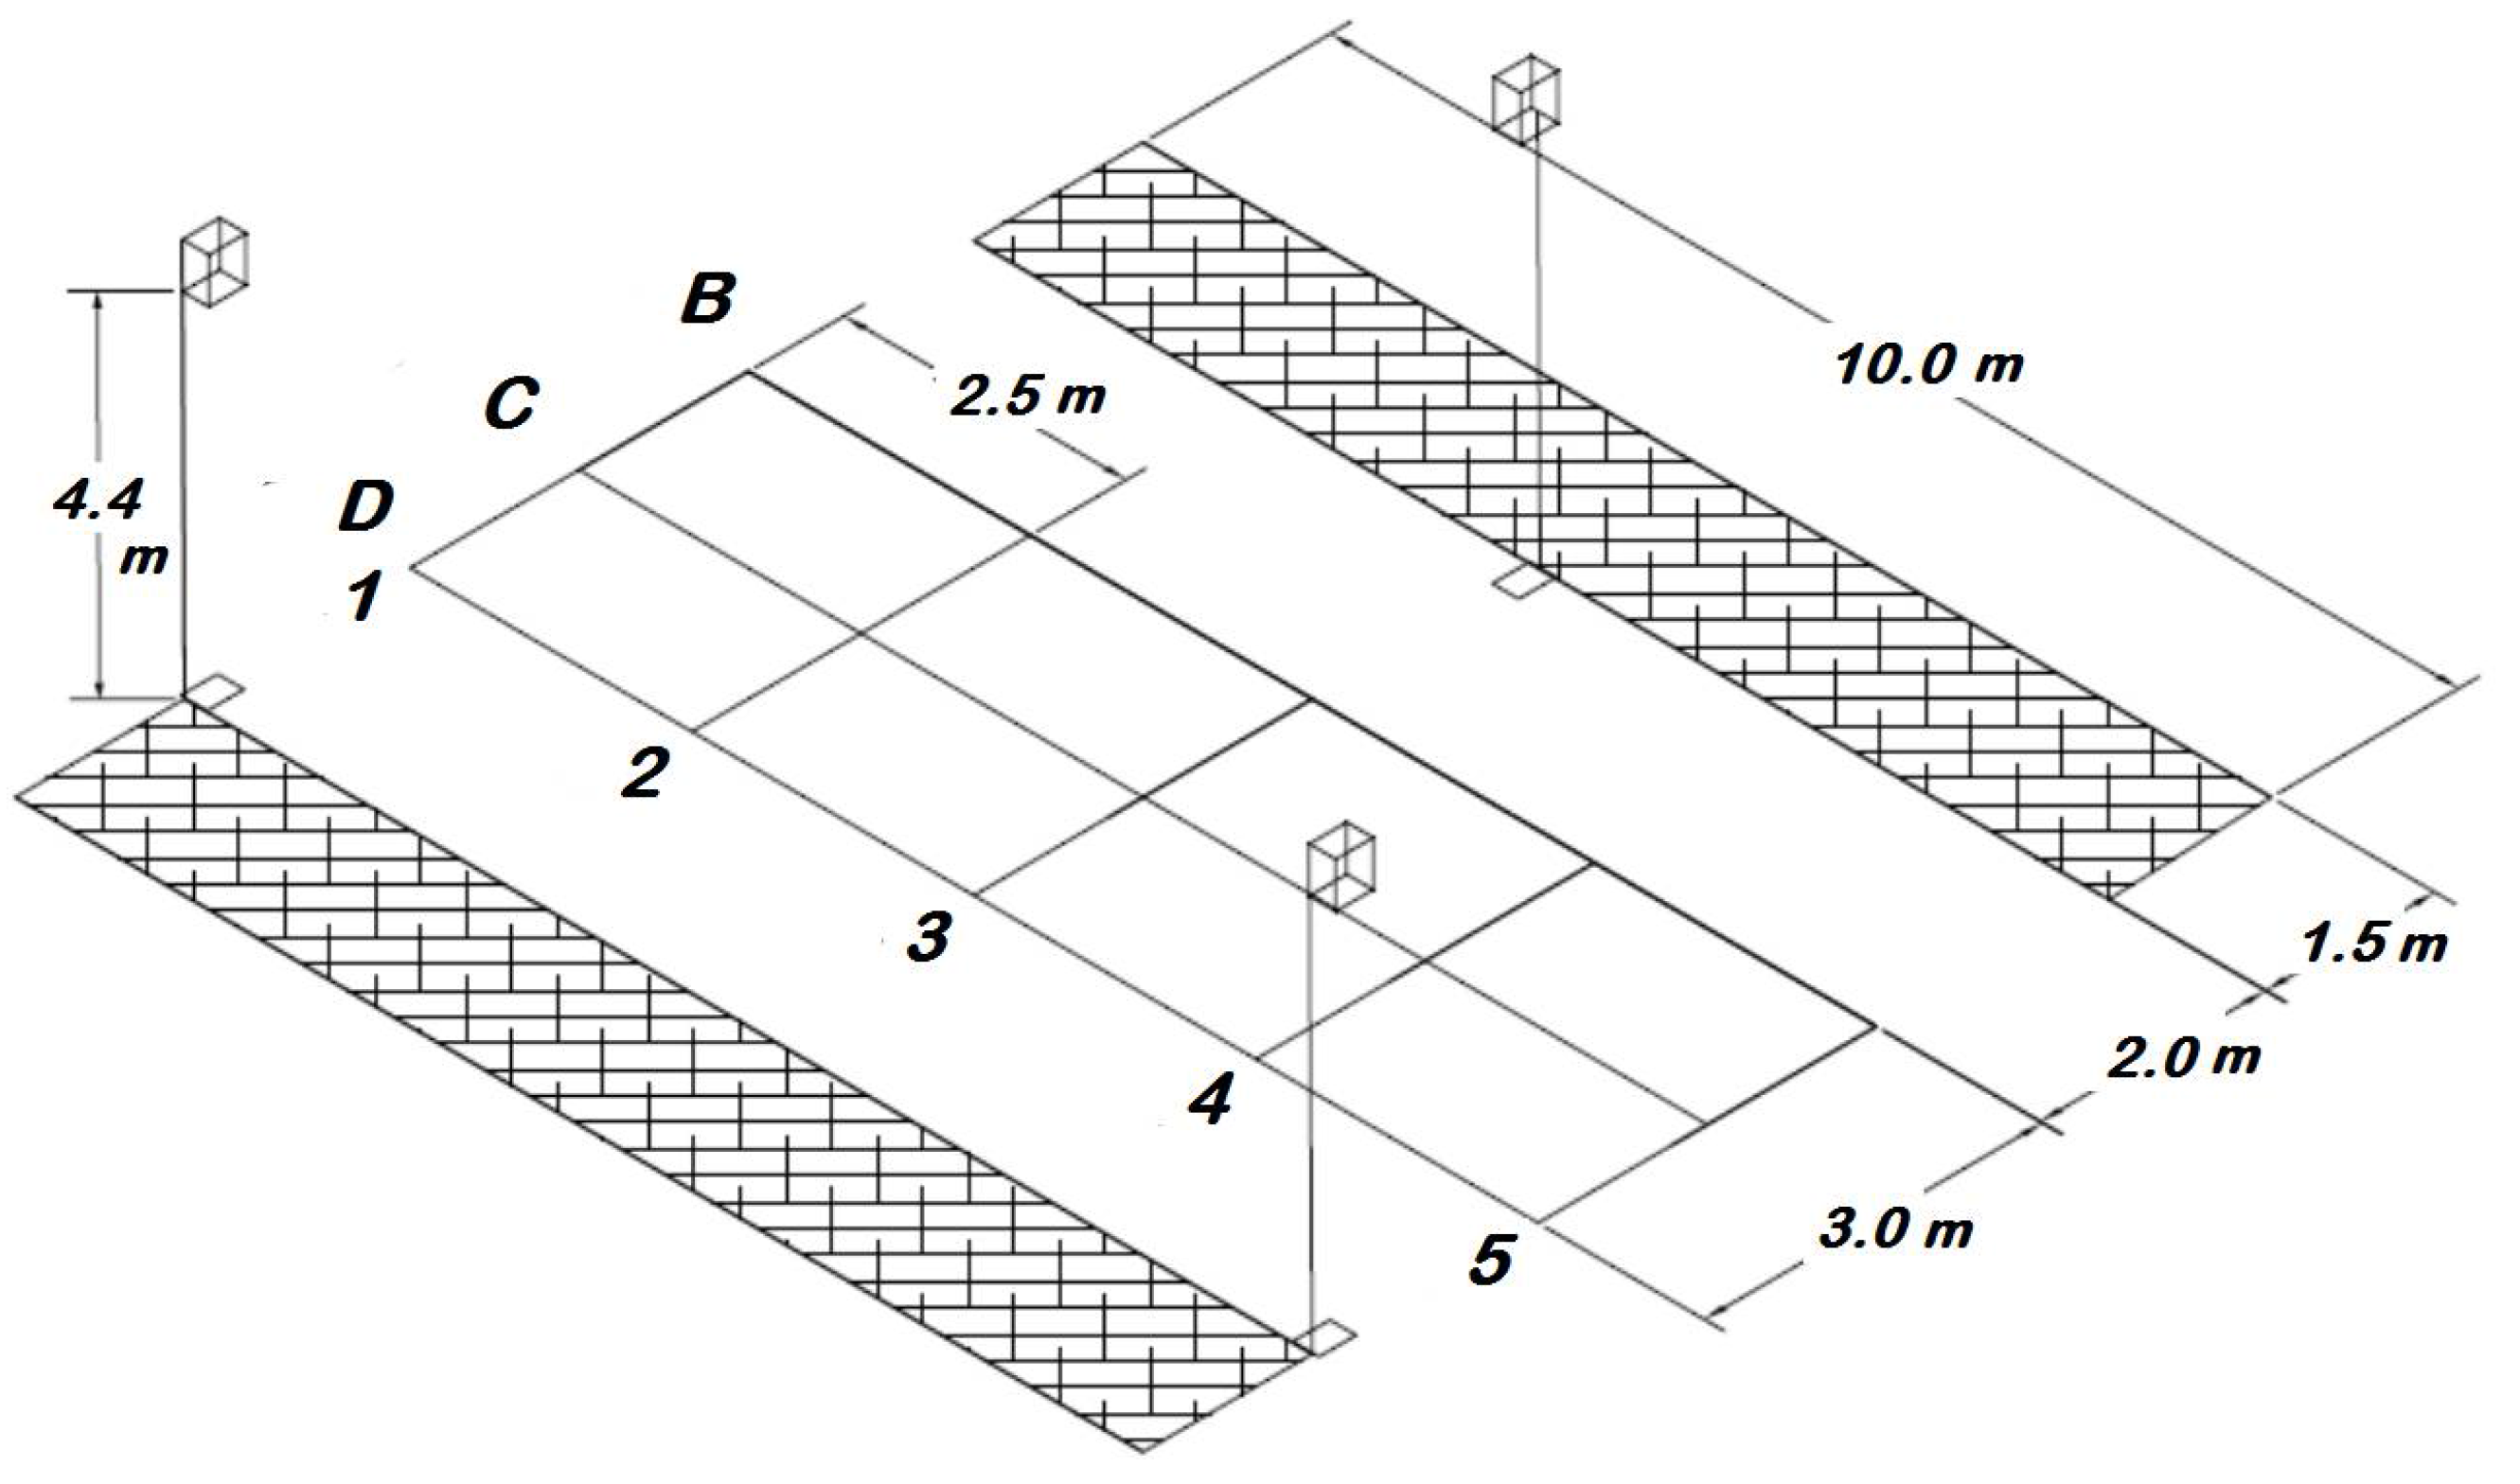
4.2. Test Methodology for Field Tests
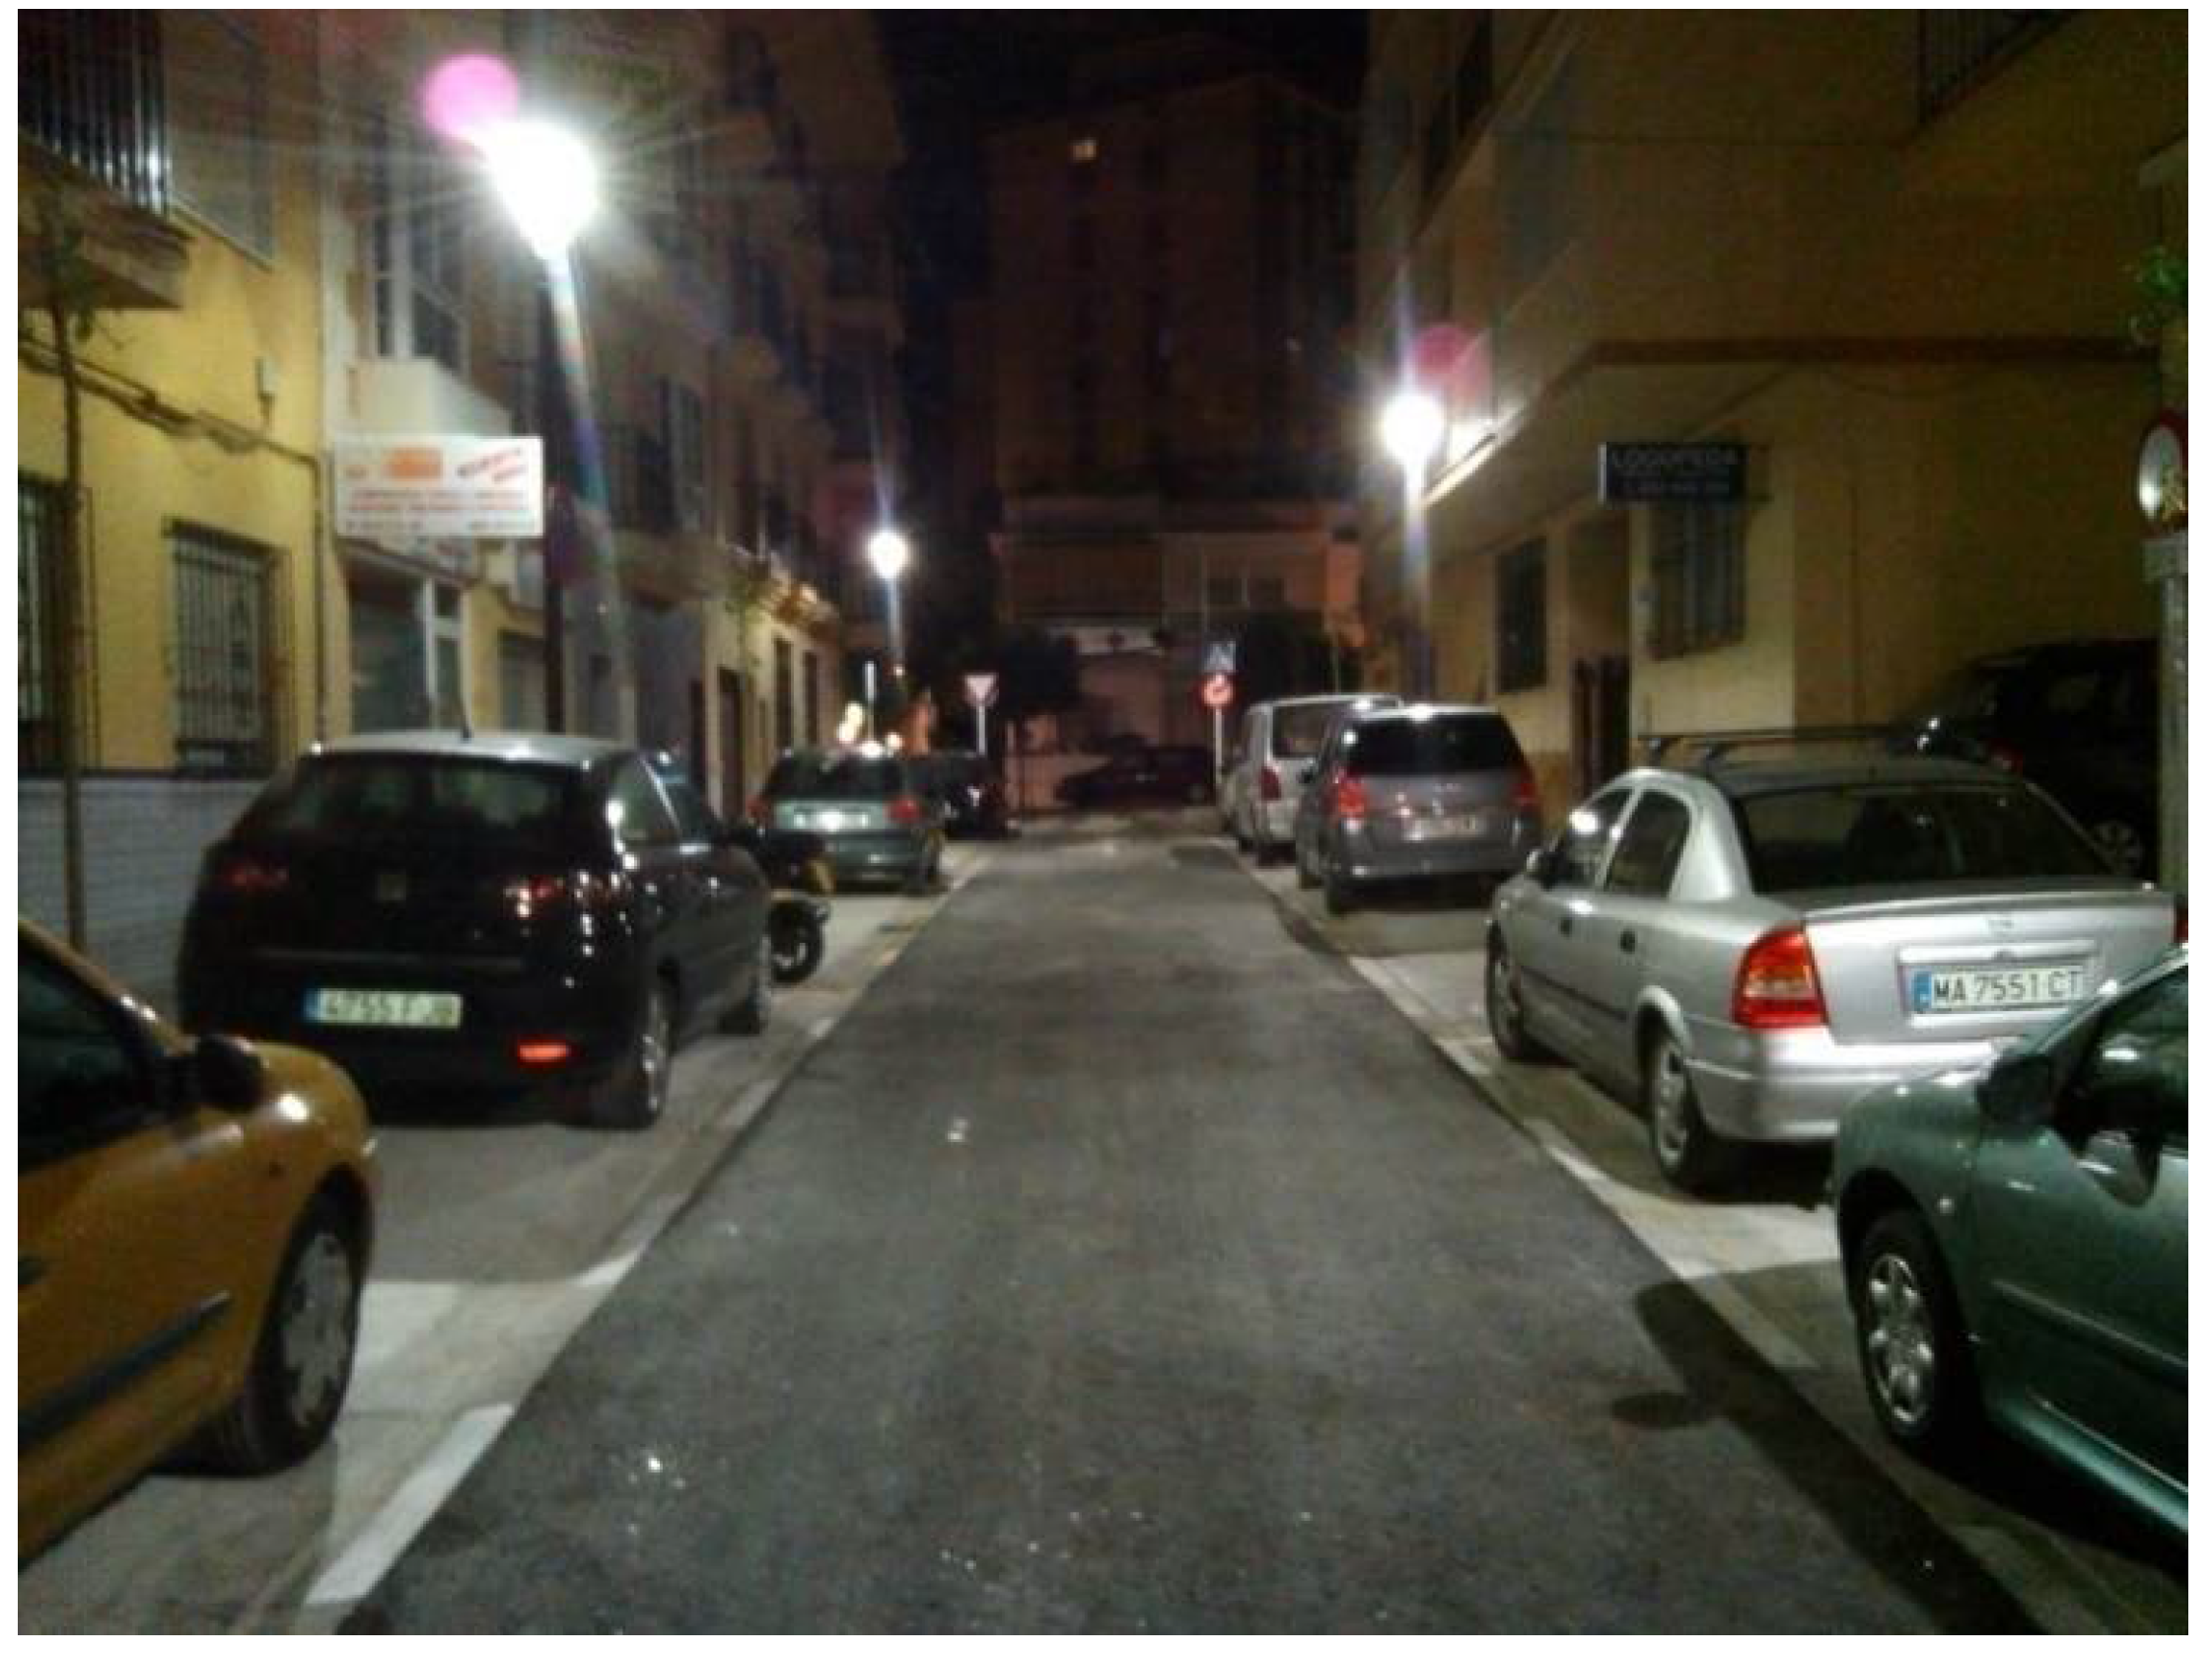
For the field study, the urban Chile street (Fuengirola, Malaga, Spain) was selected as our test area (coordinates: latitude 36.540961, longitude −4.625889). The street is a 10 m width, with a single traffic lane (3 m wide), two parallel parking areas (2 m wide), and two sidewalks (1.5 m wide) on each side. The points of light have been arranged in quincunx staggered rows with 15 m spacing between opposing luminaires in a symmetric repetitive pattern. The height of the light sources is 4.4 m (see
Figure 2).
According to the EN 13201-1:2015 standard, which establishes the different categories of roadway installations, this segment is classified as a P3 (suburban residential road with sidewalks for pedestrians along the road, zones of very limited traffic speed <30 km/h) and class S3 normal lighting. It must have a mean illuminance (Em) of 7.5 lx and a minimum illuminance (Emin) of 1.5 lx in the road area.
A 30 m test axis was used, in which three identical luminaires were installed according to the detailed specifications and positioned in staggered rows. Three independent tests were performed on the same night and with equal environmental conditions (parked cars, atmospheric conditions, etc.), and each of them had a different set of covers installed: transparent, high-thickness translucent, and low-thickness translucent.
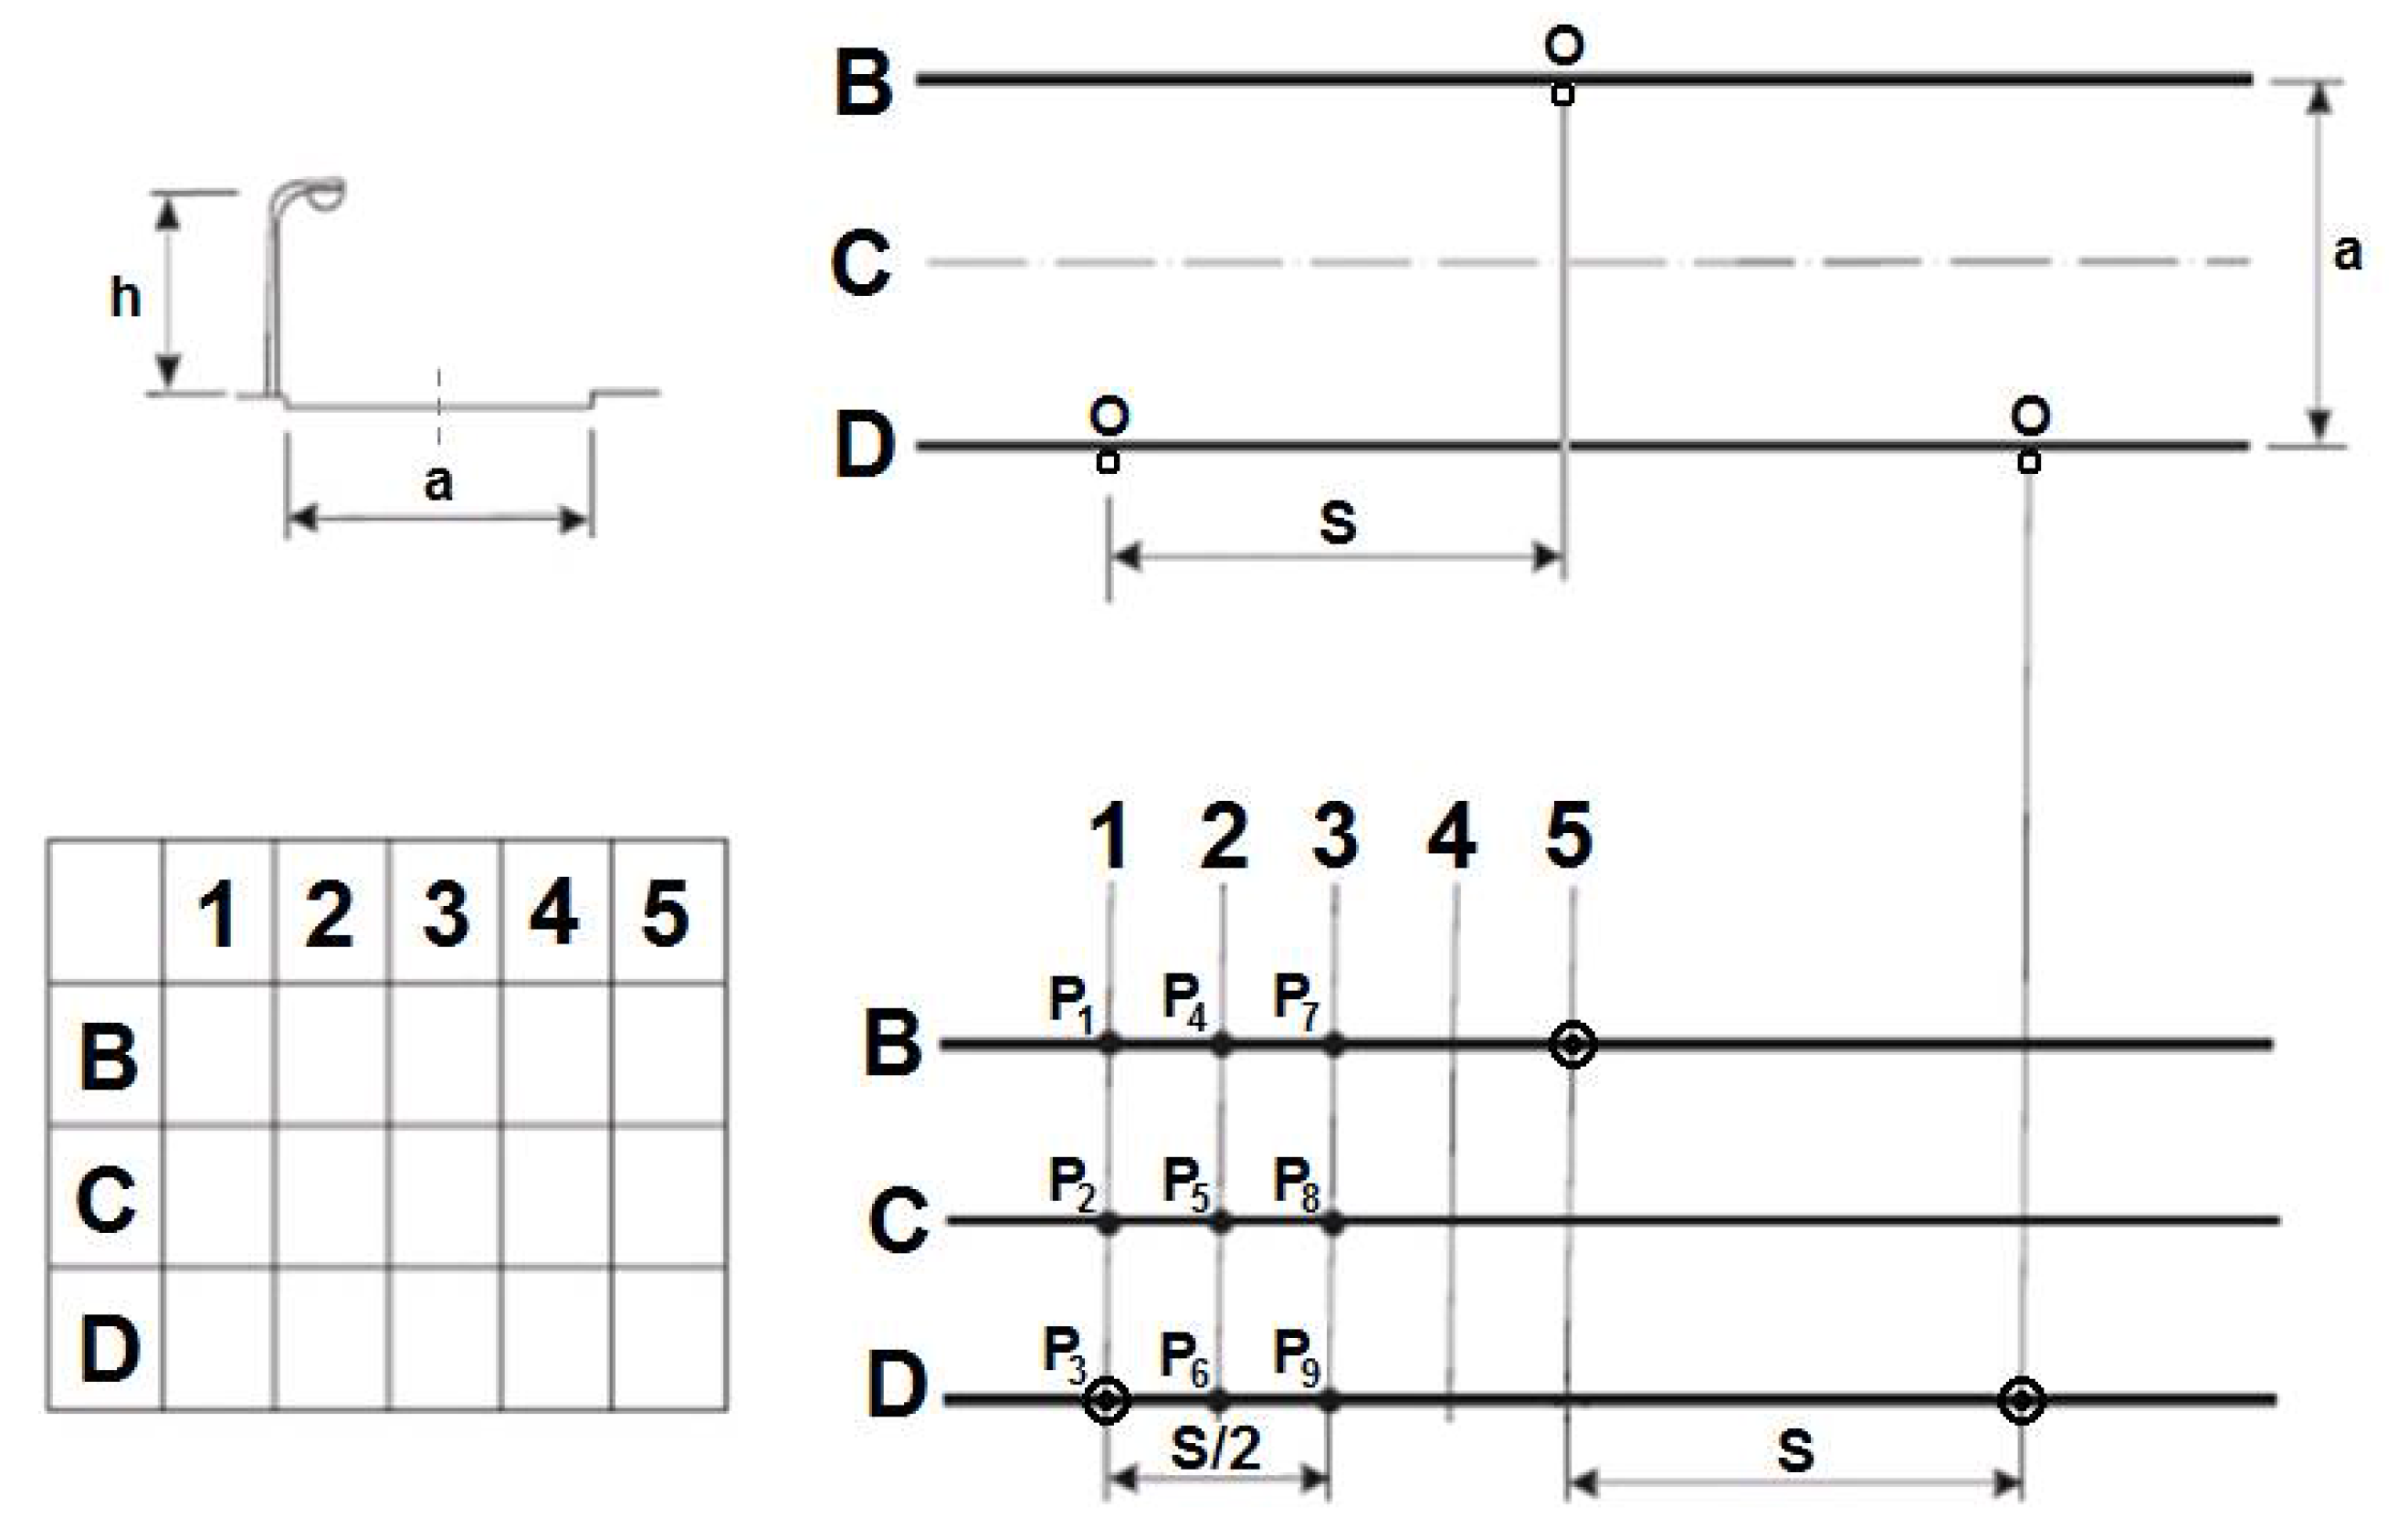
The Illumination values were measured in the field following the recommendations described in the IESNA RP-8-00, CIE 140:2000 standards using a 3 × 3 matrix (nine points) that result from the intersection of the B, C, and D abscissas with the 1, 2, and 3 ordinates of the road, as shown in
Figure 3. These standards indicate that the
Em should be calculated using a weighted averaged of each of the measured illuminances at each matrix point as in
Figure 2 (
EXN, where
and
are the specific point coordinates), as in Equation (4) and subsequently (4a) to (4i).
Ep1 to
Ep6 are the average of the illuminance of two symmetric points that, ideally, should have the same value. The
Ep5 has the highest weight as it represents the midpoints of the segment of the road. The points that represent the four corners have the lower weights.
The mean uniformity (
Um) of illuminance is the quotient of the minimum value of the measured
Epi,
, as in Equations (4a) to (4i) (
Emin) and the mean illuminance (
Em). See Equation (5):
The general or extreme uniformity (
Ug) is calculated by dividing the value of
Emin by the maximum value of these illuminances as expressed in Equation (6):
We used two precision luxometers to take the measurements employing MAVOLUX 5032C/B by GOSSEN and a Digital KL-1330 by KOBAN. The measures taken with both instruments were compared to verify that the dispersion in illuminance on the same point was lower than 3%. The objective of this test is to have a comparative set of measures of the three models of covers with the same conditions rather than offering absolute values that must not be used to compare with any other lighting installation.
5. Results
5.1. Results of the Laboratory Test. Photometry and Lighting Study
The laboratory tests with the goniophotometer were performed under the conditions required by the standard EN13032-1:2006. The specific values of the experiment were a stabilized voltage of 230.00 V
AC, room temperature of 25 °C, and relative humidity of 33%.
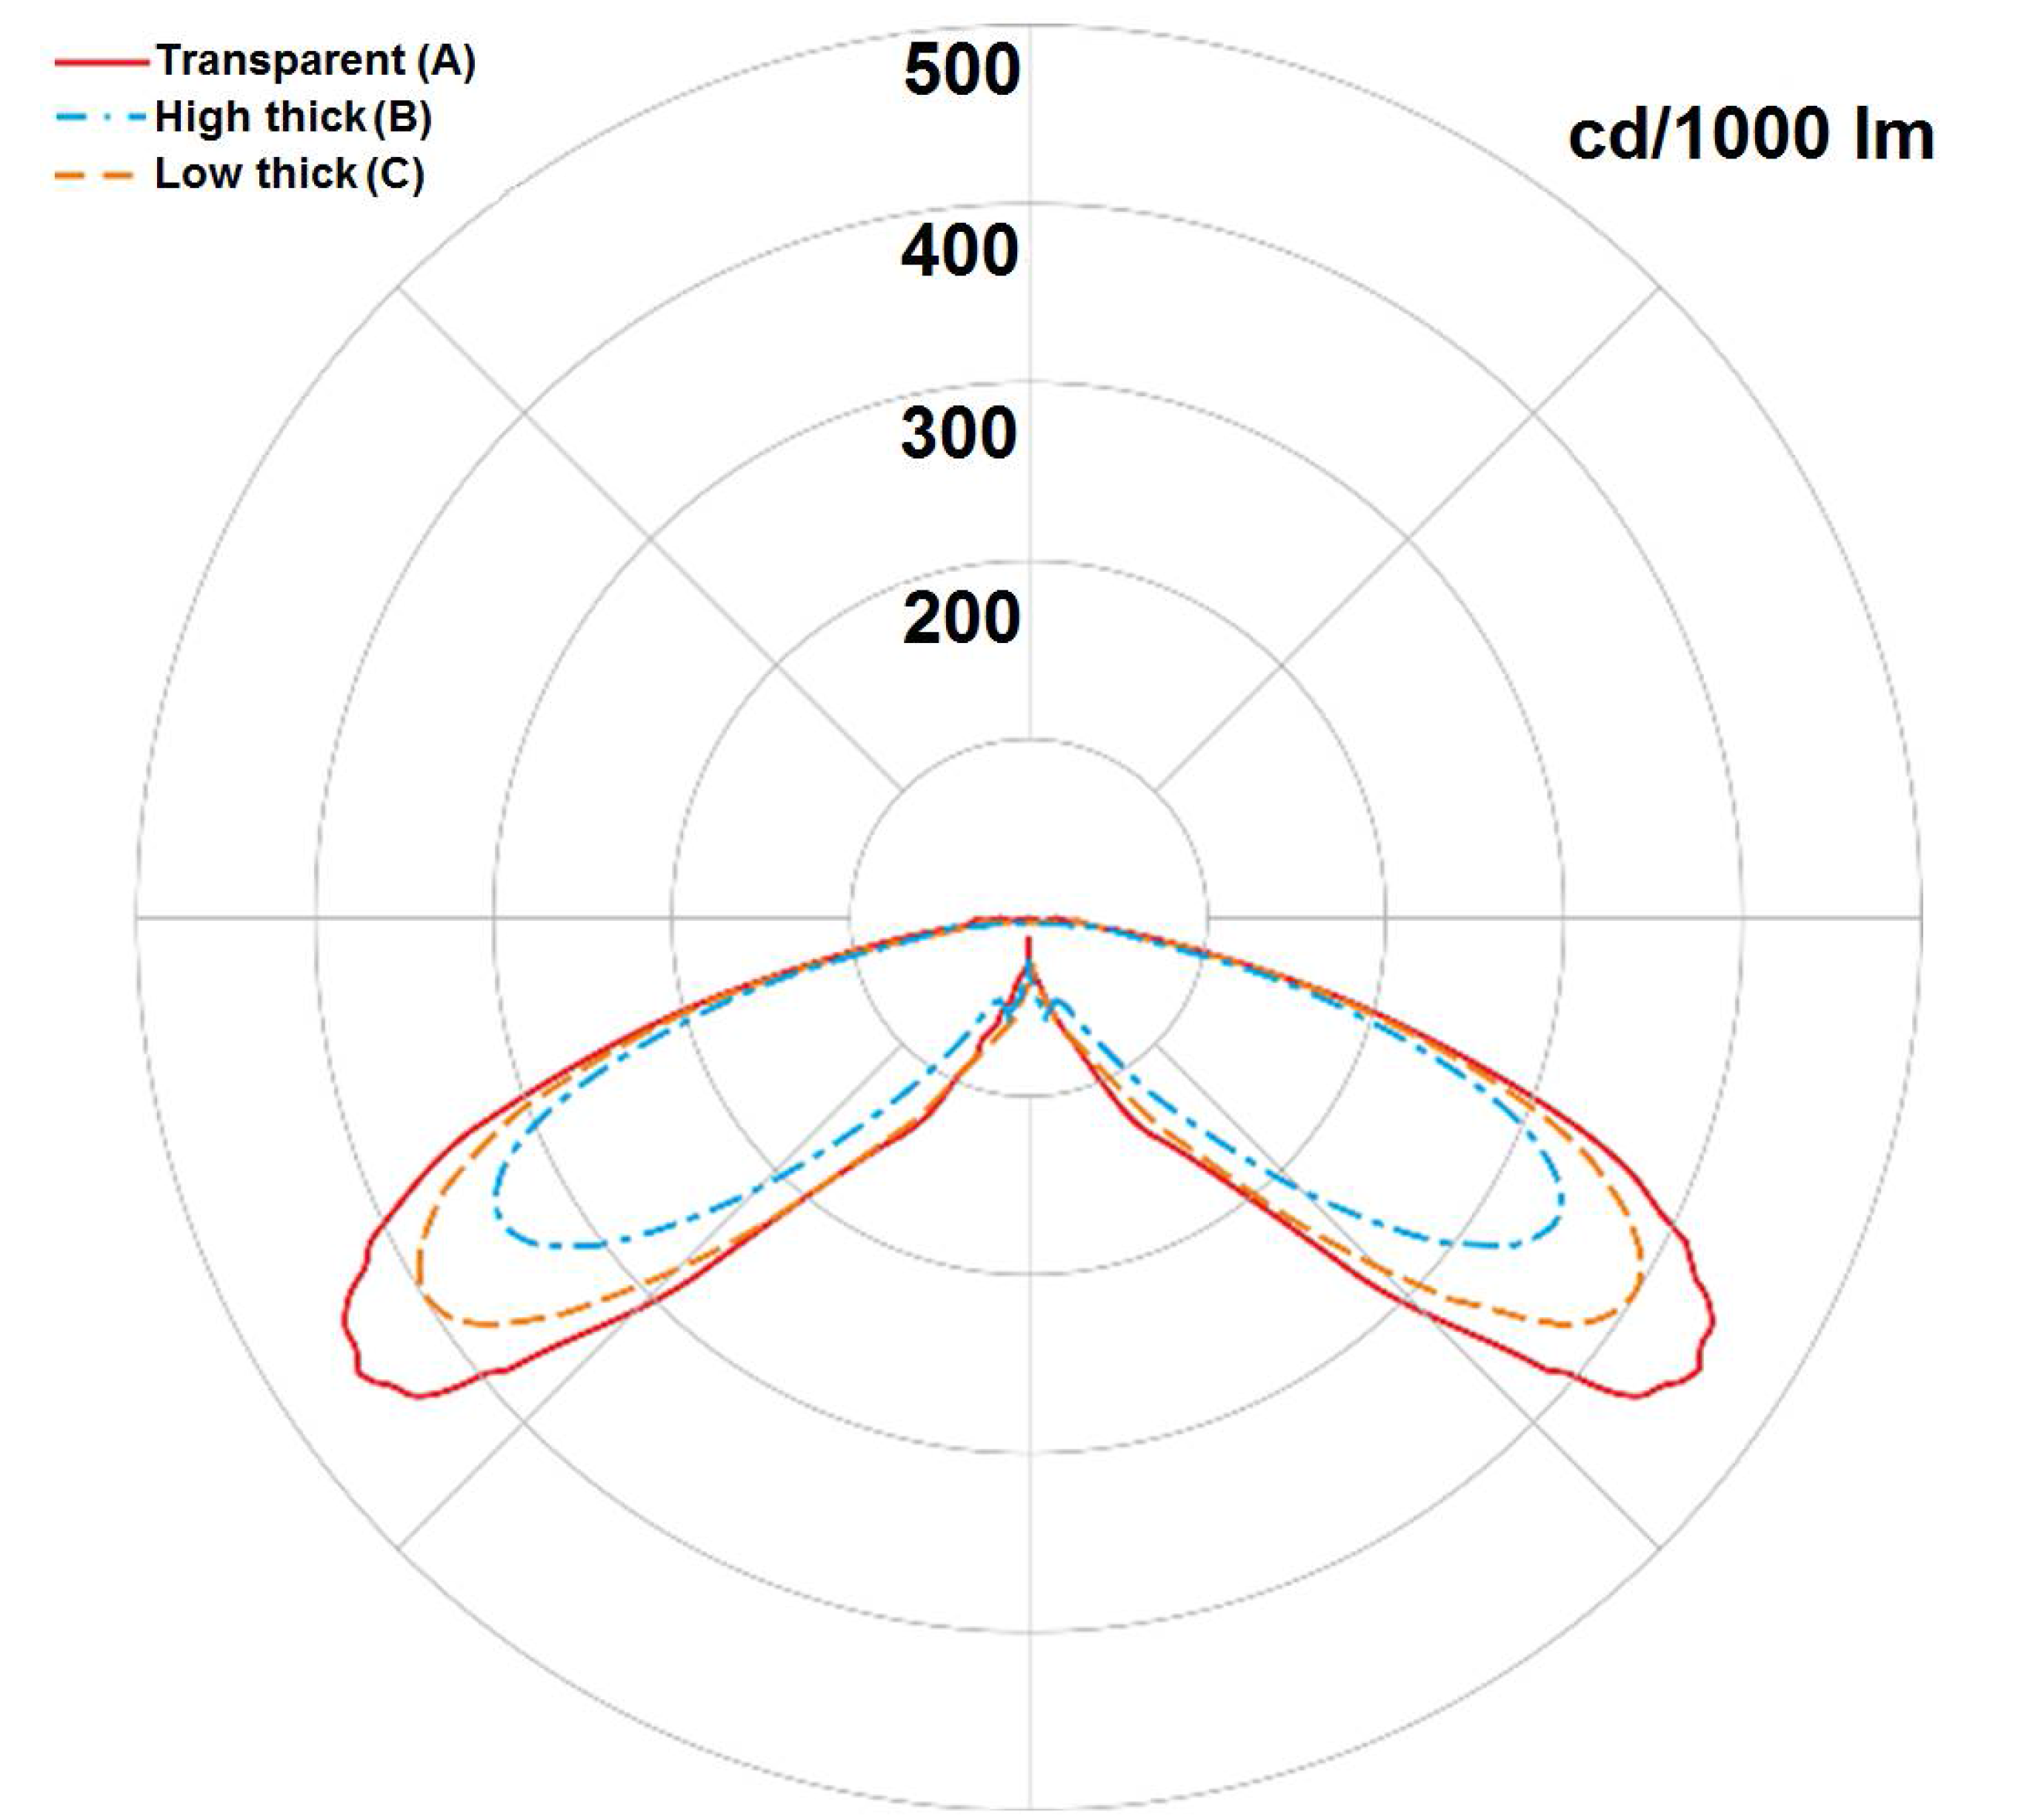
Figure 4 (C0–C180 planes) and
Figure 5 (C90–C270 planes) show one section each of the photometric diagrams from the analysis of the luminaire and the model lamp obtained with the goniphotometer for the three proposed diffusors.
Table 4 shows the values of the luminous emission in each segment of the space according to the luminaire classification system (LCS) of the IESNA document TM-15-07: Luminaire Classification System for Outdoor Luminaires and
Table 5 summarizes the fundamental results for glare evaluation as detailed in chapter 4.
Table 4 also shows the energy efficiency obtained with the three solutions. The (A) cover offers the lowest loses from the efficiency obtained in the led matrix, as indicated in
Table 3 (−15.9%). Considering the polyamide options, while (B) has a poor result (−25.7%), that from (C) (−17.5%) is similar to the first PC option. Moreover, it is possible to calculate the total amount of luminous flux (lm) emitted upper hemisphere (Up Low + Up High). This value conditions how this equipment may affect light pollution. With the diffuse covers, the amount of light emitted up to the sky is bigger than with the diffuse covers (4.1% (B) and 2.6% (C)) than with the transparent element (0.9% (A)). However, all those values are adequate for municipal or urban environments as the polyamide covers keep this value under a restricted amount of light (<5%).
Translucent covers improve the glare indexes of a luminaire in two steps in both cases (from D2 & M3 to D4 & M5) at the cost of performance and total emitted flux reduction. Therefore, a correct design of this type of elements is essential to avoid such large losses. This would affect whether using this type of component is efficient or cost-effective, as an increase of electrical power would be needed to achieve similar illuminance results.
The case of the high-thickness translucent covers decreases the glare compared to the transparent solution, but this occurs in return of a large loss of flux. The translucent cover design has been improved by reducing its total thickness and improving the optical properties of their polyamide external layers. They allow minimizing the discomfort glare at the same rate while introducing smaller output flux losses and, thereby, improving the performance of the luminaire.
Considering the photometric diagrams obtained with the goniophotometer:
In the longitudinal plane (C0–C180), the translucent covers soften the emissions of the optical lens used for the LEDs and generate a transmission diagram with fewer edges.
In the transverse emission plane (C90–C270) of the luminaire, there are bigger differences between the different covers. In the first two cases (transparent and high thick translucent), there is a vertical emission peak near the zenith axis generated by the PMMA lenses used with the LEDs. It is interesting to note that this peak is even more abrupt with the high thickness translucent cover. This point-like ray is an important factor of glare that also minimizes the lighting results generated by luminaires as they are projecting a significant amount of light near the pole where the luminaire is placed: There is less illuminance on the traffic lanes and the uniformity is conditioned.
5.2. Results of the Field Test
Figure 6 presents the spatial configuration of the luminaries related to the reference roadway of the field test in our study.
Table 6,
Table 7 and
Table 8 show the illuminance values measured for each set of covers tested as programmed in
Figure 2 and
Figure 3. The symbols used to define and identify the different points where measures have been taken and the calculation elements [
Ep1–
Ep9] to obtain the
Em,
Um, and
Ug values of the installation keep the same nomenclature also used in
Figure 1 and
Figure 2 and Equation (4). The point measurements of illuminance with a horizontal axis are given to represent the longitudinal distance to the street, where samples were taken at intervals of 2.5 m and along the vertical axis for the transverse distance, where measurements were taken every 1.5 m, for a 3 m wide road lane.
The calculated results of the lighting parameters for the street test are given in
Table 9. The reduction in
Em upon installing the low-thickness enhanced translucent (C) cover is significant compared with the transparent (C) unit. In this case, there is an
Em loss of approximately 10%, which is much lower than the one measured with the high-thickness translucent (B) covers, which reached almost 30%. However, in this case, the calculated mean and extreme uniformities were improved with increases in both parameters of approximately 10%.
These results are similar to the results obtained with the goniophotometer, i.e., a
D2 discomfort glare index for the luminaire with the transparent (A) cover and a
D4 for the low-thickness enhanced translucent (C) (see
Table 5). From a subjective opinion point of view, obtained from an interview with technicians, public workers and politicians responsible or related to public lighting installations with previous experience with Led lamps/luminaires that presence this test, this same result is a unanimous assessment that is observed when comparing the performance of the three covers. They were required to express the specific glare effect perceived observing each solution and its comparative opinion with the previous covers observed. With the transparent (A) cover, some discomfort reflections are perceived that increase the sensation of glare when the observer places himself in the middle of the road (see
Figure 6).
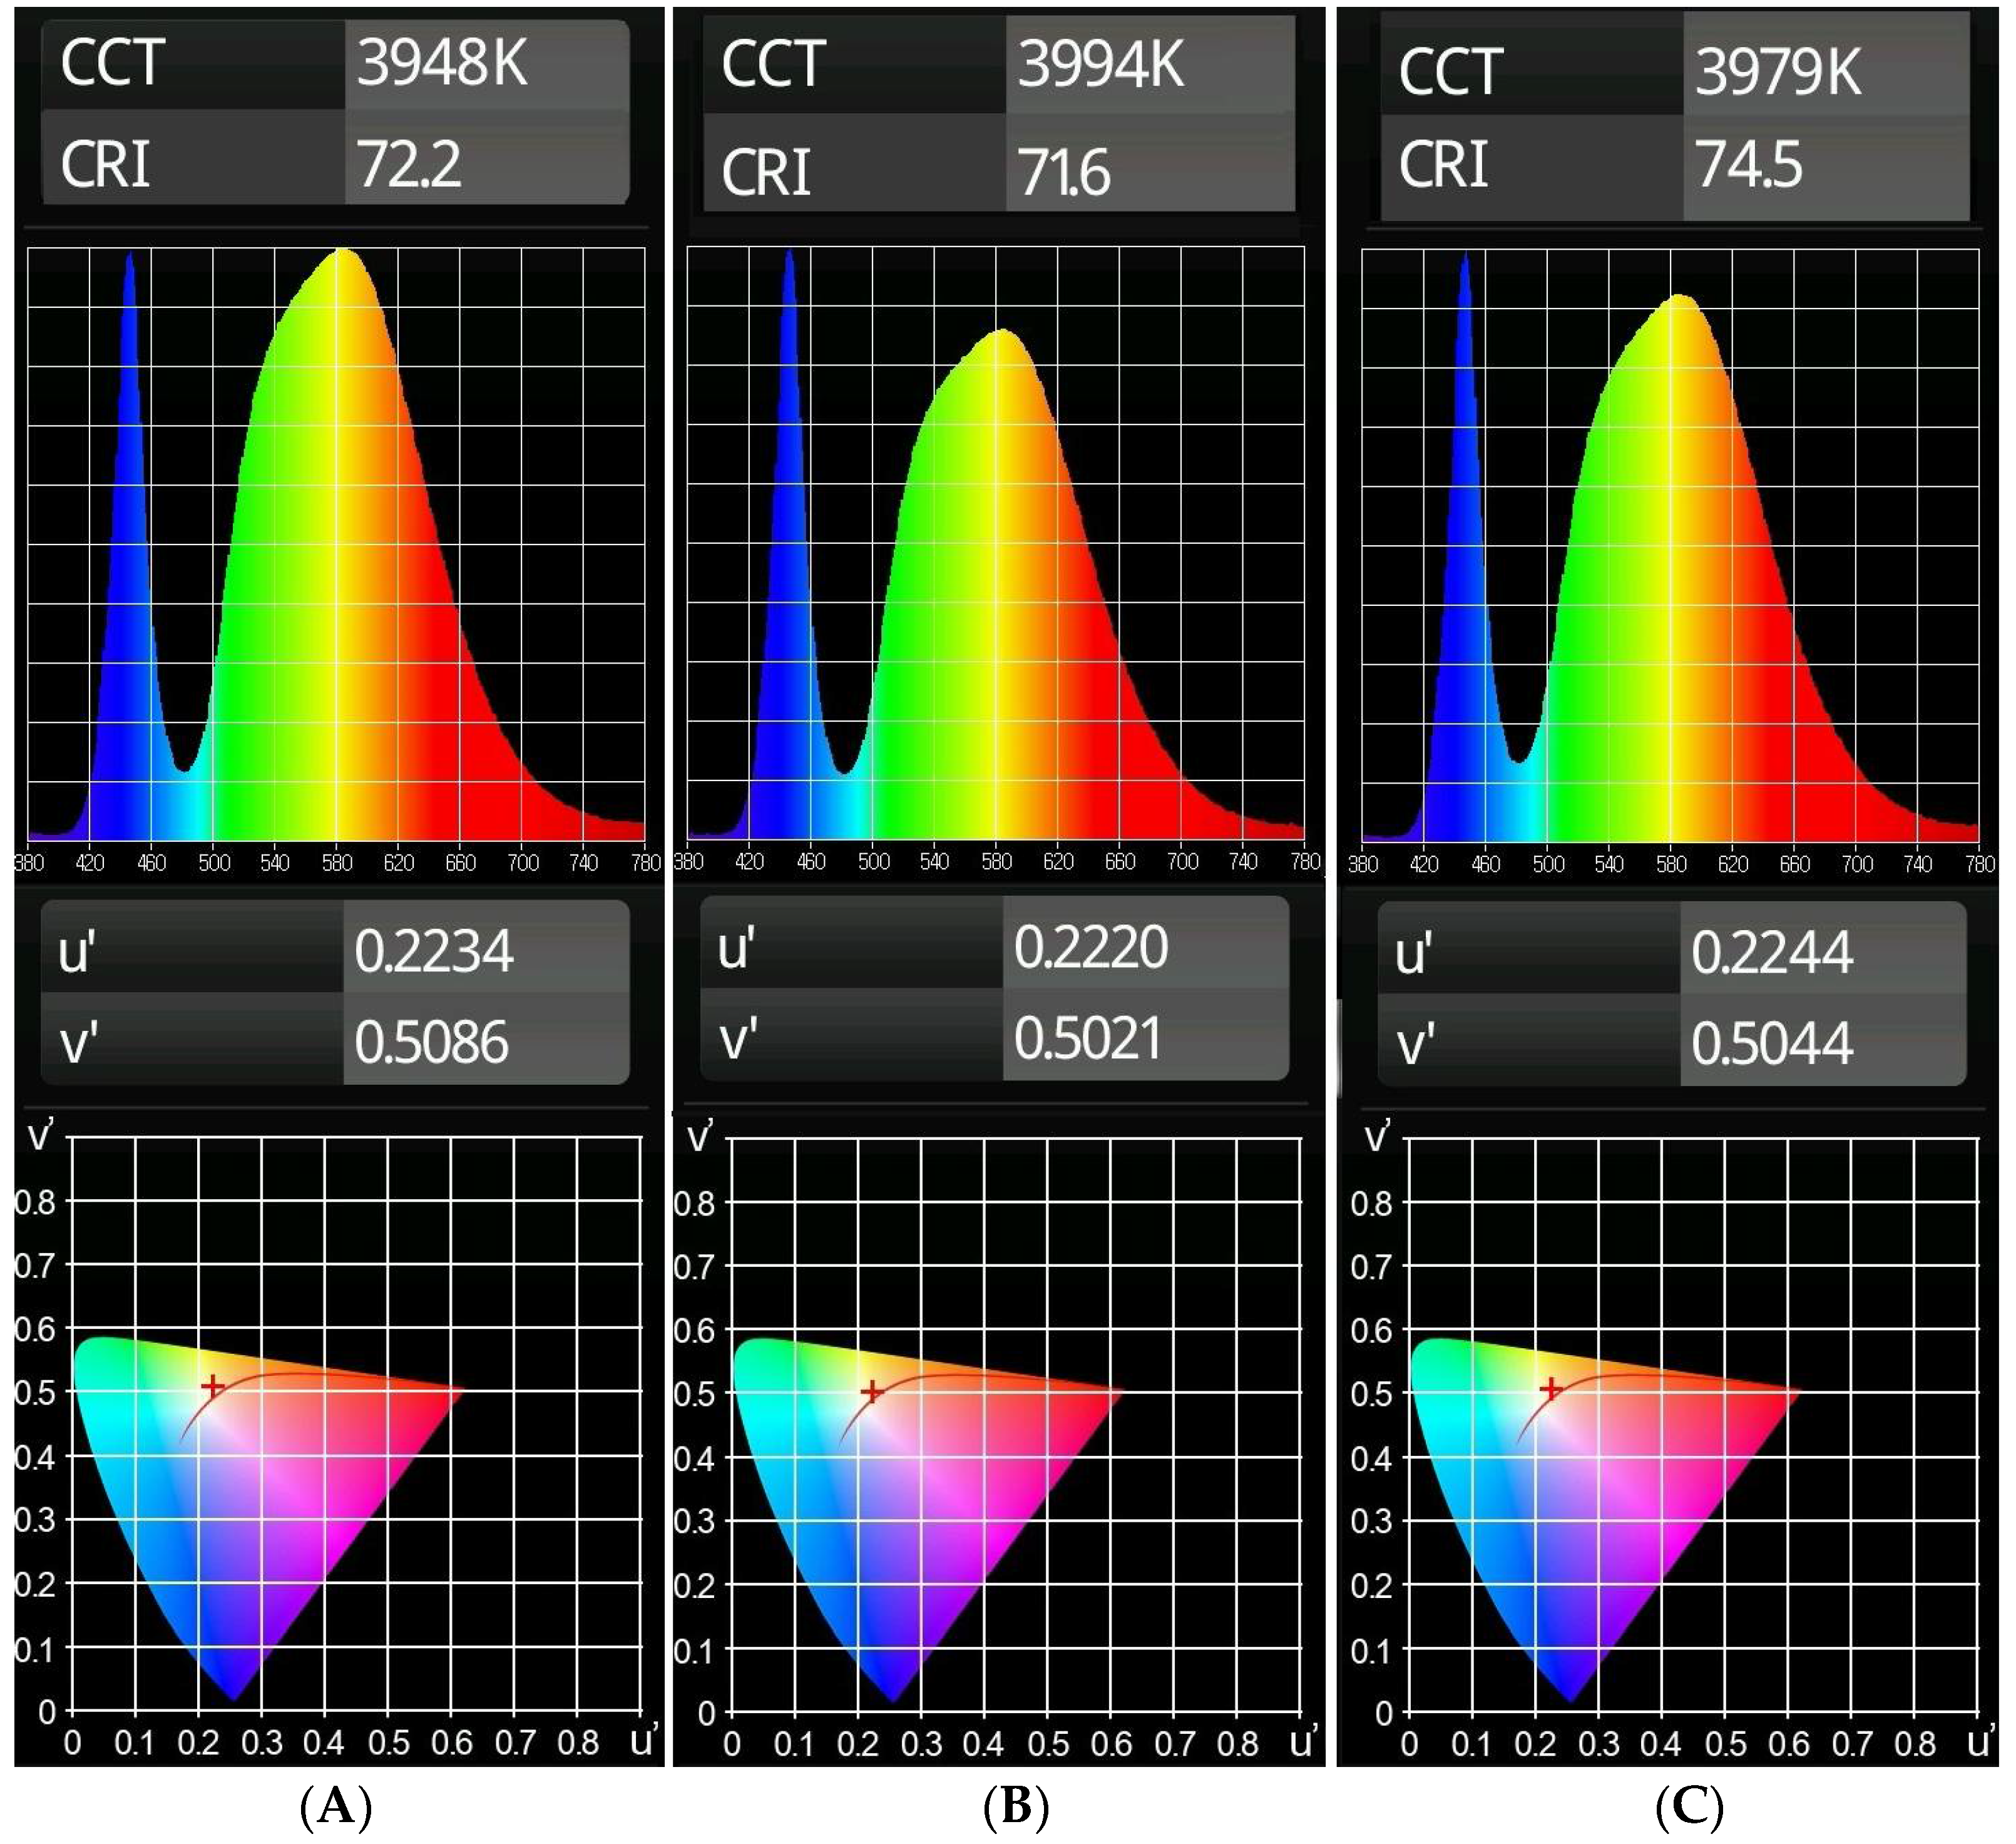
The effect of the analyzed covers on the spectrum of light emission from the luminaire was also analyzed in the field. A visible light wavelength emission diagram was obtained and RGB color (Red Green Blue) levels were calculated according to the CIE 1976 color space using an MK350S spectrometer for three covers. The comparison of these results, as show in
Figure 7, shows that there are no significant differences between the CIE chromaticity coordinates [maximum Δu′: 0.0024 and maximum Δv′: 0.0065], the correlated color temperature (
CCT) [mean: 3973.67 K; standard deviation: 19.15; difference (%) between the mean value and the most distant measure: 0.64%], or the color-rendering index (
CRI) [mean: 72.77; standard deviation: 1.25; difference (%) between the mean value and the most distant measure: 2.38%] obtained with the same LED light source using transparent polycarbonate and translucent polyamide closures. The highest wavelengths suffer the biggest losses with the translucent covers, in the same proportion as found in
Table 9. The better
CCT is achieved with the low-thickness enhanced translucent [C] cover as it seems to filter in a better relationship the blue, green, yellow, and red wavelength emissions.
The
CRI value of the LED matrix of lamp given in
Table 3 was obtained in the laboratory without PMMA lenses and covers in total absence of environmental light and with the sensor placed just a few centimeters from the emitters.
Figure 7 shows the
CRI results obtained with elements that have been proved that modify this value, as the PMMA lenses [
34] and in the real field condition. The measurement equipment was placed on the ground in the middle of the road and at half the distance between two consecutive luminaires. All these elements condition the measure obtained and provoke significant differences between the measurements of the light source (
Table 3) and the real result on the installations (
Figure 7). The differences in the materials and manufacturing processes of the proposed covers have an influence on the
CRI obtained, but this is not large according to the similar values measured in the three cases, as detailed in this figure and discussed in the previous paragraph.
6. Conclusions
In this study, several of the most relevant photometric properties of recent LED lamps for public lighting have been analyzed, with a particular emphasis on aspects related to the perception of quality by road users: illuminance levels, uniformity, and disability and discomfort glares [
35]. For this type of installations, special care must be taken when considering all these parameters, due to the discomfort generated by the directional effect of their light output and the reflections produced in the cover of the enclosure of luminaires that protect the discrete electronic emitters.
A major objective of LED lighting manufacturers is to maximize energy efficiency of the installations generated with their products, as it is the primary technical parameter for politicians and municipality technicians which have the responsibility of approving renewal projects. In many cases, this result in minimizing the number of components placed between the LEDs and the outside. However, this lack of filters causes unpleasant glare effects on persons. Present quality criteria of the lighting standards require taking care of a larger number of variables: energy efficiency, IP and IK protection, and other important perception aspects such as CRI or CCT.
Covers have been proved to be a good solution for this problem and translucent elements may be recommended instead of using transparent counterparts for luminaires with LED sources. In this work, we have analyzed polyamide translucent-based sheets manufactured with a laser sintering polymers addition process to create improved optical covers compared to PC transparent designs. They are used to reduce the levels of discomfort glare with the least amount of emitted light and illuminance losses. In our study, glare went from an index of D2, which is clearly uncomfortable, to a D4 index, which is less disturbing for both pedestrians and drivers. Other glare indexes were evaluated and demonstrated similar improvements, as well as the subjective opinion and perception of lighting installations responsible from field tests. Moreover, it has been shown how modifying the outer case of the luminaire with these translucent covers improves the mean uniformity (a 7%) and the extreme uniformity (a 12.5%) with a minimum reduction in illuminance results (3%) and, as a consequence, its overall luminous efficiency.
These parameters are being improved with this tested manufacturing process of the polyamide sheets, reducing the thickness of the resulting pieces while ensuring similar mechanical properties and better light transmittance and distribution by controlling the addition of materials.
Acknowledgments
The authors want to thank to the lighting service technical staff of the municipality of the city of Fuengirola (Spain) and to the A.T.P. Technical Lighting Public Company for providing the lighting equipment and the goniophotometer used to conduct this study.
Author Contributions
Alfonso Gago-Calderón and Manuel Jesús Hermoso-Orzáez carried out most of the work presented in this paper. Jose Ramon De Andres-Diaz contributed to the entire manuscript through critical revision and by improving the introduction, discussion, conclusions, and reference sections. Guillermo Redrado-Salvatierra, performed the manufacturing of the covers and the laboratory test with the Goniophotometer.
Conflicts of Interest
The authors declare no conflict of interest.
References
- Northeast Group. Global LED and Smart Street Lighting: Market Forecast (2015–2025); Northeast Group: Washington, DC, USA, 2015; Volume 2. [Google Scholar]
- Polzin, F.; Paschen, F.; Nolden, C. Exploring the Role of Servitization to Overcome Barriers for Innovative Energy Efficiency Technologies–The Case of Public LED Street Lighting in German Municipalities; (No. 2015-07); SPRU-Science and Technology Policy Research, University of Sussex: Brighton, UK, 2015. [Google Scholar]
- Radulovic, D.; Skok, S.; Kirincic, V. Energy efficiency public lighting management in the cities. Energy 2011, 36, 1908–1915. [Google Scholar] [CrossRef]
- Hermoso-Orzáez, M.J.; de Andrés-Díaz, J.R. Comparative study of energy-efficiency and conservation systems for ceramic metal-halide discharge lamps. Energy 2013, 52, 258–264. [Google Scholar] [CrossRef]
- Hermoso-Orzáez, M.J.; Gago-Calderon, A.; Rojas-Sola, J.I. Power Quality and Energy Efficiency in the Pre-Evaluation of an Outdoor Lighting Renewal with Light-Emitting Diode Technology: Experimental Study and Amortization Analysis. Energies 2017, 10, 836. [Google Scholar] [CrossRef]
- Villa, C.; Bremond, R.; Saint Jacques, E. Visibility and discomfort glare of LED road studs. Light. Res. Technol. 2015, 47, 945–963. [Google Scholar] [CrossRef]
- Valentová, M.; Quicheron, M.; Bertoldi, P. LED projects and economic test cases in Europe. Int. J. Green Energy 2015, 12, 843–851. [Google Scholar] [CrossRef]
- Lobão, J.A.; Devezas, T.; Catalão, J.P.S. Decision Support in the Investment Analysis on Efficient and Sustainable Street Lighting. In Proceedings of the 5th IFIP WG 5.5/SOCOLNET Doctoral Conference on Computing, Electrical and Industrial Systems (DoCEIS), Costa da Caparica, Portugal, 7–9 April 2014; Volume 423, pp. 345–352. [Google Scholar]
- Shatalov, M.; Jain, R.; Dobrinsky, A.; Sun, W.; Bilenko, Y.; Yang, J.; Gaska, R. High-Efficiency UV LEDs on Sapphire. In Proceedings of the SPIE 9363, Gallium Nitride Materials and Devices X, International Society for Optics and Photonics, San Francisco, CA, USA, 13 March 2015; Volume 9363. [Google Scholar]
- Lee, K.H.; Moon, Y.T.; Oh, S.K.; Kwak, J.S. High efficiency and ESD of GaN-based LEDs with patterned ion-damaged current blocking layer. IEEE Photonics Technol. Lett. 2015, 27, 149–152. [Google Scholar] [CrossRef]
- Kostic, A.; Djokic, L. Subjective impressions under LED and metal halide lighting. Light. Res. Technol. 2013, 46, 293–307. [Google Scholar] [CrossRef]
- Biron, M. Thermoplastics and Thermoplastic Composites, 2nd ed.; William Andrew, Elsevier: Oxford, UK, 2012; p. 77. [Google Scholar]
- Tashiro, T.; Kawanobe, S.; Kimura-Minoda, T.; Kohko, S.; Ishikawa, T.; Ayama, M. Discomfort glare for white LED light sources with different spatial arrangements. Light. Res. Technol. 2015, 47, 316–337. [Google Scholar] [CrossRef]
- Vasilakopoulou, K.; Synnefa, A.; Kolokotsa, D.; Karlessi, T.; Santamouris, M. Performance prediction and design optimisation of an integrated light pipe and artificial lighting system. Int. J. Sustain. Energy 2016, 35, 675–685. [Google Scholar] [CrossRef]
- Yuan, M.; Bourell, D.L. Optical properties of laser sintered polyamide 12. Rapid Prototyp. J. 2015, 21, 443–448. [Google Scholar] [CrossRef]
- Wang, C.Y.; Bates, P.J.; Zak, G. Optical Properties Characterization of Thermoplastics Used in Laser Transmission Welding: Transmittance and Reflectance. In Proceedings of the 67th Annual Technical Conference, Society of Plastics Engineers, Chicago, IL, USA, 22–26 June 2009; Volume 3, pp. 1278–1282. [Google Scholar]
- Clear, R.D. Discomfort glare: What do we actually know? Light. Res. Technol. 2013, 45, 141–158. [Google Scholar] [CrossRef]
- Suk, J.Y.; Schiler, M.; Kensek, K. Investigation of existing discomfort glare indices using human subject study data. Build. Environ. 2017, 113, 121–130. [Google Scholar] [CrossRef]
- Scheir, G.H.; Hanselaer, P.; Bracke, P.; Deconick, G. Calculation of the Unified Glare Rating on luminance maps for uniform and non-uniform light sources. Build. Environ. 2015, 84, 60–67. [Google Scholar] [CrossRef]
- Liu, F.; Chen, L.; Hu, Y.; Lin, Q.; Tang, B. An algorithm to minimise the beam angle of compound parabolic concentrators with LED sources. Light. Res. Technol. 2013, 45, 630–635. [Google Scholar] [CrossRef]
- Ding, Y.; Liu, X.; Zheng, Z.; Gu, P. Freeform LED lens for uniform illumination. Opt. Express 2008, 16, 12958–12966. [Google Scholar] [CrossRef] [PubMed]
- Liu, F.; Chen, L.; Tang, B.; Hu, Y.; Lin, Q.; Lei, L. A discontinuous surface reflector for high-power integrated LEDs. Light. Res. Technol. 2014, 46, 567–575. [Google Scholar] [CrossRef]
- Rubiño, M.; Cruz, A.; Garcia, J.A.; Hita, E. Discomfort glare indices: A comparative study. Appl. Opt. 1994, 33, 8001–8008. [Google Scholar] [CrossRef] [PubMed]
- Lee, J.H.; Moon, J.W.; Kim, S. Analysis of Occupants’ Visual Perception to Refine Indoor Lighting Environment for Office Tasks. Energies 2014, 7, 4116–4139. [Google Scholar] [CrossRef]
- Amirkhani, M.; Garcia-Hansen, V.; Isoardi, G.; Allan, A. An Energy Efficient Lighting Design Strategy to Enhance Visual Comfort in Offices with Windows. Energies 2017, 10, 1126. [Google Scholar] [CrossRef]
- Ylinen, A.M.; Tähkämö, L.; Puolakka, M.; Halonen, L. Road lighting quality, energy efficiency, and mesopic design–led street lighting case study. Leukos 2011, 8, 9–24. [Google Scholar] [CrossRef]
- Lu, G.; Mehr, M.Y.; Van Driel, W.D.; Fan, X.; Fan, J.; Jansen, K.M.B.; Zhang, G.Q. Color Shift Investigations for LED Secondary Optical Designs: Comparison between BPA-PC and PMMA. Opt. Mater. 2015, 45, 37–41. [Google Scholar] [CrossRef]
- Javierre, C.; Elduque, D.; Camañes, V.M.; Cuartero, J. A systematic material selection process applied to a luminaire diffuser. Light. Res. Technol. 2016, 48, 871–884. [Google Scholar] [CrossRef]
- Tähkämö, L.; Halonen, L. Life cycle assessment of road lighting luminaires. Comparison of light-emitting diode and high-pressure sodium technologies. J. Clean. Prod. 2015, 93, 234–242. [Google Scholar] [CrossRef]
- Diller, T.T.; Yuan, M.; Bourell, D.L.; Beaman, J.J. Thermal model and measurements of polymer laser sintering. Rapid Prototyp. J. 2015, 21, 2–13. [Google Scholar] [CrossRef]
- Bender, V.C.; Mendes, F.B.; Maggi, T.; Dalla-Costa, M.; Marchesan, T.B. Design methodology for street lighting luminaires based on a photometrical analysis. In Proceedings of the 2013 Brazilian Power Electronics Conference, Gramado, Brazil, 27–31 October 2013. [Google Scholar]
- Muñoz-Martínez, V.F.; Serón-Barba, J.; Molina-Mesa, R.; Gómez-de-Gabriel, J.M.; Fernández-Lozano, J.; García-Cerezo, A. Double reflection goniophotometer. Metrologia 2006, 43, 185–186. [Google Scholar] [CrossRef]
- Kim, W.; Kim, J.T. A distribution chart of glare sensation over the whole visual field. Build. Environ. 2010, 45, 922–928. [Google Scholar] [CrossRef]
- Zeng, K.; Li, Y.; Chang, J.; Hang, C.; Wang, C. Secondary optical design of LED lamps with high CRI and adjustable CCT. In Proceedings of the IEEE 15th International Conference on Electronic Packaging Technology (ICEPT), Chengdu, China, 12–15 August 2014; pp. 1472–1476. [Google Scholar] [CrossRef]
- Carter, D.J. Synthesis of artificial lighting to satisfy multiple design criteria. Build. Environ. 1983, 18, 129–134. [Google Scholar] [CrossRef]
Figure 1.
Villa lantern with the three covers involved in this study. Transparent (A) cover, high-thickness translucent (B) cover, and low-thickness enhanced translucent (C) cover.
Figure 1.
Villa lantern with the three covers involved in this study. Transparent (A) cover, high-thickness translucent (B) cover, and low-thickness enhanced translucent (C) cover.
Figure 2.
Testing 3D rendering sector in a road with quincunx staggered luminaires.
Figure 2.
Testing 3D rendering sector in a road with quincunx staggered luminaires.
Figure 3.
Determination of the mean illuminance and uniformities by a matrix of nine points (3 × 3).
Figure 3.
Determination of the mean illuminance and uniformities by a matrix of nine points (3 × 3).
Figure 4.
Comparative Photometric diagram of the C0–C180 planes for the test lamp with the 3 covers tested.
Figure 4.
Comparative Photometric diagram of the C0–C180 planes for the test lamp with the 3 covers tested.
Figure 5.
Comparative Photometric diagram of the C90–C270 planes for the test lamp with the 3 covers tested.
Figure 5.
Comparative Photometric diagram of the C90–C270 planes for the test lamp with the 3 covers tested.
Figure 6.
Spatial configuration of the luminaries related to the reference roadway of the field test in our study.
Figure 6.
Spatial configuration of the luminaries related to the reference roadway of the field test in our study.
Figure 7.
Comparative of the three spectrometer measurements of the transparent (A) cover, high-thickness translucent (B) cover, and low-thickness enhanced translucent (C) cover.
Figure 7.
Comparative of the three spectrometer measurements of the transparent (A) cover, high-thickness translucent (B) cover, and low-thickness enhanced translucent (C) cover.
Table 1.
“D” discomfort glare index.
Table 1.
“D” discomfort glare index.
| D Index | D0 | D1 | D2 | D3 | D4 | D5 | D6 |
|---|
| Maximum glare (cd/m2) | − | 7000 | 5500 | 4000 | 2000 | 1000 | 500 |
Table 2.
G classes of luminous intensities of luminaires according to EN 13201-2:2015 (road lighting; performance requirements).
Table 2.
G classes of luminous intensities of luminaires according to EN 13201-2:2015 (road lighting; performance requirements).
| Intensity Class “G” | Maximum Intensity in Candela (cd/klm)
(1) Intensities Proportional to the Flux from the lamp for 1000 lm |
|---|
| Glare | 70° ≤ Gamma ≤ 80° | 80° ≤ Gamma < 90° | Gamma ≥ 90° |
| G1 | - | 200 | 50 |
| G2 | - | 150 | 30 |
| G3 | - | 100 | 20 |
| G4 | 500 | 100 | 10 |
| G5 | 350 | 100 | 10 |
| G6 | 350 | 100 | 0 |
Table 3.
Characteristics of the LED matrix used for the tests in this study.
Table 3.
Characteristics of the LED matrix used for the tests in this study.
| LED Matrix | 24 CREE XP-G2 LED Units |
|---|
| Topology | 2 parallel branches of 12 LED powered with constant current (CC) |
| Electrical measurements | Total current of the driver | 1300 mA |
| Total current per LED | 650 mA |
| Operating voltage of the driver | 37.3 VDC |
| Total power | 53.74 WAC |
| Photometric measurements | Correlated Color Temperature (CCT) | 4087 K |
| Luminous flux | 5318 lm |
| Color Rendering Index (CRI) | 82 |
| Efficiency | 98.95 lm/W |
Table 4.
Luminaire Classification System (LCS) of the covers under study. Criteria: IESNA TM-15-07.
Table 4.
Luminaire Classification System (LCS) of the covers under study. Criteria: IESNA TM-15-07.
| Test | (A) Cover | (B) Cover | (C) Cover |
|---|
| LCS Zone | Luminous Flux (lm) | Percentage of Total (%) | Luminous Flux (lm) | Percentage of Total (%) | Luminous Flux (lm) | Percentage of Total (%) |
| Forward Low 0–30° | 166.6 | 3.7 | 122.0 | 3.1 | 175.5 | 4.0 |
| Forward Medium 30–60° | 1575.0 | 35.2 | 1082.1 | 27.4 | 1407.0 | 32.1 |
| Forward High 60–80° | 1324.0 | 29.6 | 1176.7 | 29.8 | 1273.4 | 29.0 |
| Forward Very High 80–90° | 107.4 | 2.4 | 176.9 | 4.5 | 149.7 | 3.4 |
| Back Low 0–30° | 94.5 | 2.1 | 76.2 | 1.9 | 101.4 | 2.3 |
| Back Medium 30–60° | 636.7 | 14.2 | 543.1 | 13.8 | 612.5 | 14.0 |
| Back High 60–80° | 467.4 | 10.5 | 499.6 | 12.7 | 473.5 | 10.8 |
| Back Very High 80–90° | 60.0 | 1.3 | 107.3 | 2.7 | 77.1 | 1.8 |
| Up Low 90–100° | 31.0 | 0.7 | 84.2 | 2.1 | 69.0 | 1.6 |
| Up High 100–180° | 8.9 | 0.2 | 80.9 | 2.0 | 44.8 | 1.0 |
| TOTAL | 4471.5 | 100 | 3949.1 | 100 | 4383.8 | 100 |
| Efficiency | 83.21 lm/W | 73.49 lm/W | 81.57 lm/W |
Table 5.
Comparative laboratory results.
Table 5.
Comparative laboratory results.
| Type of Luminaire Cover | Total Luminous Flux (lm) | LOR (%) | D Index Discomfort Glare | SLI (Specific Glare Luminaire Index) | M Index Discomfort Glare | G Index Disability Glare |
|---|
| Transparent (A) | 4471.5 | 84.05 | D2 | 3.1-Mean | 3-Discomfort | G1 |
| High-thickness translucent (B) | 3949.1 | 74.23 | D4 | 4.1-Concentrated | 5-Acceptable | G1 |
| Low-thickness enhanced translucent (C) | 4383.8 | 82.40 | D4 | 4.3-Concentrated | 5–Acceptable | G1 |
Table 6.
Transparent (A) cover field measurements and calculated parameters (Epi) used to obtain Em, Um, and Ug.
Table 6.
Transparent (A) cover field measurements and calculated parameters (Epi) used to obtain Em, Um, and Ug.
| Punctual Illuminances (lx) | 1 | 2 | 3 | 4 | 5 | Distance |
|---|
| B | 27.8 | 45.6 | 57.2 | 39.7 | 28.2 | 0 m |
| C | 35.4 | 46.2 | 58.8 | 45.5 | 35.9 | 1.5 m |
| D | 28.8 | 41.1 | 56.7 | 44.5 | 29.3 | 3 m |
| Distance | 0 m | 2.5 m | 5 m | 7.5 m | 10 m | - |
| Intermediate Illuminance Results (lx) | Ep1 | Ep2 | Ep3 | Ep4 | Ep5 | Ep6 | Ep7 | Ep8 | Ep9 |
| 28.55 | 35.65 | 28.50 | 45.05 | 45.85 | 40.40 | 57.20 | 58.80 | 56.70 |
Table 7.
High-thickness translucent (B) cover field measurements and calculated parameters (Epi) used to obtain Em, Um, and Ug.
Table 7.
High-thickness translucent (B) cover field measurements and calculated parameters (Epi) used to obtain Em, Um, and Ug.
| Punctual Illuminances (lx) | 1 | 2 | 3 | 4 | 5 | Distance |
|---|
| B | 26.5 | 29.9 | 38.6 | 31.9 | 25.7 | 0 m |
| C | 27.3 | 31.1 | 37.4 | 31.6 | 26.1 | 1.5 m |
| D | 24.6 | 30.6 | 38.9 | 28.7 | 28.3 | 3 m |
| Distance | 0 m | 2.5 m | 5 m | 7.5 m | 10 m | - |
| Intermediate Illuminance Results (lx) | Ep1 | Ep2 | Ep3 | Ep4 | Ep5 | Ep6 | Ep7 | Ep8 | Ep9 |
| 27.40 | 26.70 | 25.15 | 29.30 | 31.35 | 31.25 | 38.60 | 37.40 | 38.90 |
Table 8.
Low-thickness enhanced translucent (C) cover field measurements and calculated parameters (Epi) used to obtain Em, Um, and Ug.
Table 8.
Low-thickness enhanced translucent (C) cover field measurements and calculated parameters (Epi) used to obtain Em, Um, and Ug.
| Punctual Illuminances (lx) | 1 | 2 | 3 | 4 | 5 | Distance |
|---|
| B | 31.8 | 38.5 | 49.3 | 37.9 | 26.7 | 0 m |
| C | 34.5 | 40.7 | 50.8 | 41.4 | 33.7 | 1.5 m |
| D | 28.2 | 36.8 | 48.7 | 40.4 | 30.5 | 3 m |
| Distance | 0 m | 2.5 m | 5 m | 7.5 m | 10 m | - |
| Intermediate Illuminance Results (lx) | Ep1 | Ep2 | Ep3 | Ep4 | Ep5 | Ep6 | Ep7 | Ep8 | Ep9 |
| 31.15 | 34.10 | 27.45 | 39.45 | 41.05 | 37.35 | 49.30 | 50.80 | 48.70 |
Table 9.
Comparative summary of the lighting results in an urban roadway: mean illuminance (Em) and uniformities (Um and Ug).
Table 9.
Comparative summary of the lighting results in an urban roadway: mean illuminance (Em) and uniformities (Um and Ug).
| Light Parameters | Light Parameters | Transparent Cover (A) | High-Thickness Translucent Cover (B) | Low-Thickness Enhanced Translucent Cover (C) | Variation Transparent (A) Vs. Low Thickness (C) % |
|---|
| Mean illuminance | Em | 48.18 lx | 33.98 lx | 43.30 lx | −10.1% |
| Mean uniformity | Um | 0.59 | 0.74 | 0.63 | + 6.8% |
| Extreme uniformity | Ug | 0.48 | 0.64 | 0.54 | +12.5% |
© 2018 by the authors. Licensee MDPI, Basel, Switzerland. This article is an open access article distributed under the terms and conditions of the Creative Commons Attribution (CC BY) license (http://creativecommons.org/licenses/by/4.0/).

 ,
, 


