A Power System Network Splitting Strategy Based on Contingency Analysis
by
 ,
,
Nur Zawani Saharuddin
1,2,*, 
Izham Zainal Abidin
2,
Hazlie Mokhlis
3,
Abdul Rahim Abdullah
1 and
Kanendra Naidu
4 1
Faculty of Electrical Engineering, Universiti Teknikal Malaysia Melaka, 76100 Durian Tunggal, Melaka, Malaysia
2
Institute of Power Engineering, Universiti Tenaga Nasional, Jalan Ikram- Uniten, 43000 Kajang, Selangor, Malaysia
3
Department of Electrical Engineering, Faculty of Engineering, University of Malaya, 50603 Kuala Lumpur, Malaysia
4
Electrical Technology Section, Universiti Kuala Lumpur, British Malaysian Institute, 53100 Gombak, Kuala Lumpur, Malaysia
*
Author to whom correspondence should be addressed.
Energies 2018, 11(2), 434; https://doi.org/10.3390/en11020434
Submission received: 13 November 2017
/
Revised: 23 January 2018
/
Accepted: 31 January 2018
/
Published: 14 February 2018
(This article belongs to the Section F: Electrical Engineering)
Abstract
:This paper proposes a network splitting strategy following critical line outages based on N-1 contingency analysis. Network splitting is the best option for certain critical outages when the tendency of severe cascading failures is very high. Network splitting is executed by splitting the power system network into feasible set of islands. Thus, it is essential to identify the optimal splitting solution (in terms of minimal power flow disruption) that satisfies certain constraints. This paper determines the optimal splitting solution for each of the critical line outage using discrete evolutionary programming (DEP) optimization technique assisted by heuristic initialization approach. Heuristic initialization provides the best initial cutsets which will guide the optimization technique to find the optimal splitting solution. Generation–load balance and transmission line overloading analysis are carried out in each island to ensure the steady state stability is achieved. Load shedding scheme is initiated if the power balance criterion is violated in any island to sustain the generation–load balance. The proposed technique is validated on the IEEE 118 bus system. Results show that the proposed approach produces an optimal splitting solution with lower power flow disruption during network splitting execution.
1. Introduction
A reliable power system network is designed with the ability to withstand any contingency (single or multiple outages) occurring within the system. However, certain contingencies may contribute to severe cascading failures in the transmission line system that will cause the system to split and form few unbalanced islands. This phenomenon is known as unintentional islanding. Without proper planning of network splitting, such islanding will trigger instability issues in the system and consequently lead to partial or total system blackout. Most severe blackout cases which occur in many countries around the world are caused by cascading events initiated by single or multiple events [1,2,3]. For instance, severe disturbance that occurred in Northern Germany forced the system to split into three islands, and a significant imbalance between generation and load was noticed in each island [4]. This condition led to a severe instability problem in the system before it underwent system collapse. Therefore, network splitting (known as intentional islanding) is preferable to mitigate the occurrence of unintentional islanding due to cascading failures and system blackout. The implementation of this strategy was shown to be effective in various fault scenarios by mitigating further cascading tripping [5]. Network splitting is executed by splitting the network into several balanced and stable islands. Each of these islands should be able to operate on its own and continue supplying power to consumers even though the system is going through abnormal condition (due to the disconnected transmission lines). The most challenging part in the implementation of network splitting is to determine the suitable set of transmission lines to be disconnected to form balanced and stable islands. However, there are huge possible combinations of lines that can be considered to be disconnected. Furthermore, these combinations increase as the network size increases. This will cause the selection of a proper splitting point to become complicated and difficult. Therefore, finding optimal splitting points (cutsets) is important to avoid severe network imbalance after network splitting is implemented.
In recent years, various approaches to network splitting have been proposed. A popular method in identifying a suitable splitting strategy using ordered binary decision diagrams (OBDDs) together with a node simplification technique is introduced in [6,7]. Steady state constraints that include coherent groups of generators, generation–load balance, and transmission line capacity are considered in this approach. Another technique using a slow coherency method is presented in [8]. This approach groups several coherent generators with similar dynamic behaviors in the same group during the splitting execution. The concept in [8] has been used considering the generation–load balance and other constraints in minimal cutsets with minimal power flow [9] and has also been used in a graph partition and simplification technique in [10]. Numerical approaches that utilize mathematical tools such as linear programming have also been proposed [11,12]. The authors used mixed integer linear programming (MILP) [11] and a piecewise linear model of AC power flow [12], taking into account the affected areas. A heuristic technique using Ant Search, a probabilistic search method, has also been proposed [13]. Steady state stability was determined using generation–load balance and transmission line loading. Some authors [14,15] have proposed a meta-heuristic approach using conventional optimization to reduce computational complexity. The authors of [16] introduced an approach using a two-step controlled islanding algorithm. The proposed approach emphasizes minimal power flow disruption as an objective function. Another method that includes a list of possible control actions that can be executed during critical contingencies such as load shedding, generator rescheduling, and network splitting is presented in [17]. Through this approach, the operators can select the best scheme according to the level of the criticality of the contingency scenarios. However, this method does not consider the coherency of generators during splitting implementation. In addition, the approach uses manual contingency analysis to determine the critical contingency, which might be complicated and difficult as the system size increases.
The above-mentioned studies [8,9,10,11,12,13,14] provide network splitting solutions by combining offline and online calculation for real time implementation. These methods also simplify the original system before the splitting execution based on several rules and assumptions. Thus, the suitable solution for network splitting may not be able to be obtained. Worse still, the solution can lead to severe instability problems and system blackouts if the correct lines are not disconnected during network splitting execution. Since network splitting is a discrete problem in nature, the cutset lines for the splitting solution are represented by integer numbers (e.g., 1–2, 3–4, ..., etc.). Therefore, a continuous optimization technique [14,15] that involves floating numbers during the mutation process may not be suitable for the splitting problems. Several methods [8,9,10,11,12,13,14,15,16,17] use minimal power imbalance as their objective functions in determining the best splitting solution. However, it was stated in [16] that minimal power flow disruption is the important criterion for the island to survive the separation. Minimal power flow disruption improves the transient stability in each island during the network splitting execution.
Different from the previous work, this paper proposes a new approach. The network splitting strategy proposed in this work is obtained following critical line outages based on N-1 contingency analysis, where the overloading criterion proposed in [18] is used to determine the critical lines. A discrete evolutionary programming (DEP) optimization technique is employed to determine the optimal splitting strategy using total minimal power disruption as its objective function. An optimal splitting strategy (cutsets) based on this objective function helps to reduce the topology change in the system after the islanding execution. The lower the total power disruption of the total transmission lines to be disconnected is, the better the islanding implementation will be. In this work, a network splitting strategy using graph theory is utilized to represent the physical connection of the power system network by means of graph drawing and to determine the transmission line to be disconnected. In addition, an initial cutsets based on a heuristic approach is introduced to assist the DEP optimization technique to find the optimal network splitting strategy. Through this approach, the search space of the possible islanding solutions can be reduced without any simplification process on the original network. The DEP optimization technique goes a step further by including the post-splitting steady state stability verification. The power balance is calculated in each island, and network reordering is carried out. A load shedding scheme is performed if power imbalances are detected in any island. Then, transmission line overloading analysis is executed to ensure that the network splitting solution is feasible without violating the transmission line loading capacity. The proposed splitting strategy is prepared for planning and secure control system action, which can guide and assist the operators to simulate and plan successful network splitting implementation.
The remainder of the paper is organized as follows. Section 2 reviews power system security and network splitting implementation. A detailed explanation of the proposed approach to find the optimal network splitting solution is given in Section 3. In Section 4, the proposed algorithm is tested on IEEE 118-bus systems to verify its performance. Finally, conclusion remarks for this work are carried out in Section 5.
2. Power System Security and Network Splitting
Power system security is defined as the ability of the power system to operate continuously in a secure manner despite any contingency. In other words, it represents the robustness of the system against imminent contingency or disturbance considering the operating condition of the system [19]. Meanwhile, contingency refers to an act of losing one or two important components (such as generators, transmission lines, or transformers) or a sudden increase in loads due to any failures or outages [20].
The common assessment conducted for power system security is contingency analysis. In general, a power system is designed with N-1, N-2, or N-1-1 contingency. Hence, the system should continue to operate in a reliable way during a single component outage (N-1), two-component outage (N-2), or sequence outages (N-1-1) at a time. Nevertheless, certain severe outages may result in the violation of N-1, N-2 or N-1-1 contingency criterion, which will cause the system to experience system instability and system blackout problems. These outages may initiate cascading failures that eventually result in partial or total system blackouts.
Therefore, appropriate remedial actions such as protective devices tripping, load shedding schemes, generator rescheduling, and network splitting (intentional islanding) are carried out subject to the criticality of the contingency events to avoid further spreading of cascading failures. In certain cases, where the cascading failures can spread quickly due to critical component failures, network splitting will be the best option. Otherwise, the probability that the system experiences blackout is very high.
Network splitting is carried out by separating the system into islands. The main intention is to produce balanced and stable islands by disconnecting suitable transmission lines from the original network. Each island should be able to operate as a standalone island. It is important to ensure that network splitting implementation should not cause the islanded system to become unstable. Therefore, the following constraints must be fulfilled in order to produce balanced and stable islands [13]:
- (a)
- Integrity constraints: All buses in an island must be connected as an incorporated subsystem.
- (b)
- Steady state constraints:
- Generation–load balance—Each island must operate within a proper generation–load balance. If the load demand is more than the supplied power, suitable load shedding is required to be carried out, and if the generations are more than the load demand, an appropriate generator rescheduling is required.where Pi,gen is the generated active power for line i, and Pi,load is the supplied active power for line i.
- Transmission line overloading—Transmission line loading should not violate the maximum allowable limit during splitting execution, as indicated by Equation (2):where Pi,line is the active power flow for line i, and Pi,max is the maximum allowable limit of active power flow for line i.
- Voltage limit—The voltage value for all buses must be within the allowable limit.where Vline is the operating voltage in system, Vmin is the minimum voltage value, and Vmax is the maximum voltage value.
- (c)
- Dynamic constraints:
- Generator coherency—Generators in each island must be coherent and synchronized.
- Voltage stability—Voltage stability in each island must be dynamically maintained
- Frequency stability—Frequency stability in each island must be dynamically maintained.
3. The Proposed Approach
A new meta-heuristic approach in determining an optimal network splitting strategy following critical line outages based on N-1 contingency analysis is presented in this paper. The N-1 contingency analysis will provide a list of critical lines where, in the event of any failure on the line, serious cascading failures might occur. In this study, a DEP optimization technique is used to find the optimal splitting solution (cutsets) with the aid of initial cutsets obtained through a heuristic approach. A simple and practical load shedding scheme is introduced to ensure reliable island operation when any imbalance between generation and load is detected. The proposed strategy is illustrated in Figure 1. In general, the strategy is divided into four main steps: N-1 contingency analysis; network modeling based on graph theory approach; initial cutsets using a heuristic approach; DEP optimization for an optimal network splitting solution. Descriptions and formulations for each step are further presented in the next section.
3.1. N-1 Contingency Analysis
N-1 contingency analysis is performed to obtain the list of critical lines that will initiate cascading failures. An appropriate network splitting solution is provided for each critical line failure. The line is considered critical when it reaches its maximum overloads (MVA) of 130% [18]. This is expressed by Equation (4).
where Sij = critical loading on the edge between transmission line li and transmission line lj.
For example, the red line (Line 9–10) in the IEEE 14-bus system as shown in Figure 2 is one of the critical lines (exceed 130% of its maximum limit) obtained from the contingency analysis. Contingency analysis shows that, if this line is disconnected from the system due to any outages occurring on the line, multiple cascading failures will occur. Therefore, proper network splitting is needed to prevent cascading failures once this line is disconnected from the system.
3.2. Network Representation-Based Graph Theory Approach
In general, a graph G(V,E) illustrates the relationship between a set of edges, E, and a set of vertices, V. A power system network can be represented as a graph model using graph theory. In modeling a power system network, the vertices, V, represent the major electrical components node (e.g., generators, buses, and load buses) and the edges, E, depict the transmission lines. An example of graph theory implementation on the IEEE 5-bus system is illustrated in Figure 3 [6].
Referring to Figure 3a, the system contains five buses, three generators, four loads, and five transmission lines. The representation of an IEEE 5-bus system as a graph model is shown in Figure 3b. The vertices (v1, v2, v3, v4, and v5) refer to the bus nodes (generator or load) in the network, whereas the edges (e1, e2, e3, e4, e5 and e6) refer to the transmission lines. The two vertices are said to be adjacent if they are connected by the same edge. The adjacency matrix, A, can represent the connection of vertex i to vertex j, which is described as follows [21]:
where n = {1, 2, ..., le), le = the maximum number of edges in a system.
The network splitting strategy (for minimal power flow disruption) proposed in this study uses an undirected graph since the direction of the power flow is not considered; therefore, Aij = Aji = 1 if . As the connection between the buses in the network is described by the adjacency matrix, its use in solving the network splitting strategy is essential.
3.3. Initial Cutsets Using a Heuristic Approach
In this work, suitable initial cutsets that are close to the final optimal splitting solution are computed using the proposed heuristic approach. The proposed heuristic method considers the number of islands and coherent groups of generators during initial cutsets determination. Through the proposed method, the search space of possible lines to be disconnected can be reduced and the convergence process can be accelerated. The first step in implementing the proposed approach is creating the backbone of the network by grouping the coherent generators into particular groups using the shortest path approach. Next, the nearest vertices (line) is assigned to the nearest coherent groups of generators. The line that lies in between the different group of generators is the cutset candidate. The reason for making such a grouping is to ensure the easy coordination of coherent generators in controlling power generation for the loads in the island. Furthermore, this approach will group the coherent generators in the same island, which helps in maintaining the stability of each island after network splitting implementation. The shortest path between the vertices is found based on Djisktra’s algorithm [22]. The detailed implementation of the approach is presented in Figure 4.
For a better understanding, the IEEE 14-bus test system is used to illustrate the process of initial cutsets determination using a heuristic approach. In this example, the coherent groups of generators are assigned as cohg_1 = {1, 2, 6} and cohg_2 = {3, 8}. An example of backbone formation of the two groups of coherent generators is shown in Figure 5a, the edges between different coherent groups, cohg, is the cutset as shown by the dashed line in Figure 5b, and the cutsets, CS = {CS2–3, CS2–4, CS4–5, CS9–10, CS9–14}, obtained is illustrated in Figure 5c. The dashed line is the initial cutset for the discrete optimization technique.
3.4. DEP Optimization for Network Splitting Solution
The DEP optimization technique is employed in this work because network splitting is a discrete problem in nature. The number of transmission line to be disconnected during splitting involves integer numbers (e.g., 1–3, 4–6, ..., etc.); thus, a continuous evolutionary programming approach utilizing floating numbers is not suitable in this study. Figure 6 shows the flowchart for the DEP technique applied in this work.
Referring to Figure 6, a series of initial populations (parents), xi, is produced by manipulating the initial cutsets obtained using the heuristic approach explained in Section 3.3. The original initial cutsets is expended and reduced with a random edge value, A or B, from the solution space, S, as shown in Table 1. This process is performed based on the possibility that the final optimal solution might have more or fewer lines compared with the initial cutsets. The solution space, S, is represented by the edges, E = {Em}, of the interconnected system where m = 1, 2, …, total no. of edges.
The constraints considered in the optimization process are the coherent groups of generators and desired numbers of islands.
In this work, the minimal power flow disruption is used as the objective function to find the optimal network splitting strategy, as expressed in Equation (6). The selection of this objective function will produce islands with improved stability [16].
Pi is the active power flow on the transmission line (i) in the cutsets that form the islands, and nline defines the total number of cutsets (transmission lines to be disconnected). The objective function Equation (6) is calculated for each initial population.
Next, the new populations (offspring), xi’, are generated by the mutation process on the list of initial populations, xᵢ. For each candidate in the initial populations, the mutation process is performed by diagonally replacing the edge, Xi, with a random edge value, N, from the solution space, S, as shown in Table 2. This process helps to generate new offspring that are almost identical to the initial population. Then, the objective function for each offspring (cutsets) is calculated. Equation (6) is used and the constraints stated in the initialization part are utilized in the mutation part as well.
The new populations (offspring) produced will be combined with the initial populations (parents) to enable the best population selection process. In this work, the combined populations are sorted in ascending order according to their calculated objective function (minimal total power disruption, Pdisrup). The 10 best populations, x☐, will be selected as initial populations (parents) for the next iteration. The process of mutating the parents to produce the offspring continues until the maximum iteration is reached. The final list of the 10 best optimal solutions, x☐ will be selected based on the minimal total power disruption, Pdisrup.
3.4.1. Network Reordering
In each step of the process, when the possible splitting solution is found, the network reordering needs to be carried out to enable the load flow analysis to be evaluated. This is based on the fact that, when the system was split, only one island had the slack bus, while the other islands had only PV buses and load. As such, a slack bus should be selected from the existing PV buses. For this study, slack buses are determined based on the PV bus that has the highest power rating capacity. This selection will allow the buses to generate extra power when required.
3.4.2. The Load Shedding Algorithm
There are two significant events that may occur after the implementation of network splitting: excessive power generation and shortage of power generation. In any case, the generation–load equilibrium has to be maintained to ensure the stability in each island.
If the generated power in the island, Pgen, is greater than the load demand, Pload, the network reordering is executed and the generator will adjust accordingly to meet the power balance equilibrium. When load demand (Pload) is greater than the generated power, Pgen, the load shedding algorithm is initiated. The following steps describe the implementation of the load shedding algorithm:
- (a)
- The power imbalance, Pimb, in each island is calculated using Equation (7).where Pgen is the generated power in the island, and Pload is the aggregation of all load and line losses in that particular island.
- (b)
- If a power imbalance is noticed in the island where the load demand is more than the total generation, the slack bus is tasked to compensate the generation deficiency. The slack bus can be raised up to its maximum limit of power rating, Pmax(slack). However, after the slack bus power limit is raised to its maximum limit, and there are still power imbalances, then Pimb will be eventually supplied by other generators in the island. The imbalanced amount is divided equally among the generators.
- (c)
- A load shedding algorithm will be implemented if a power imbalance is still detected, even if all the generators have reached its maximum limit. In this work, the load shedding scheme is implemented by removing the best combination of loads that correspond to the identified power imbalances.
3.4.3. Transmission Line Overloading Analysis
The transmission line overloading analysis is executed to identify which line has violated its maximum limit, Pi,max, as expressed by Equation (2). The proposed solution is considered optimal if no lines exceed the permitted limits. However, if the transmission lines violate the maximum allowable limit, then the algorithm will search for the next best splitting solution (refer to Figure 5).
4. Simulation Results and Discussion
The proposed network splitting algorithm was tested using the IEEE 118 bus system. The IEEE 118 bus system consists of 19 generators and 186 transmission lines. In order to validate the effectiveness of the proposed algorithm, modification on the generators limit was carried out. The algorithm was coded using MATLAB 10 (R2015a) on an Intel® Core™ i7-5500U CPU at 2.40 GHz with 8 GB of RAM.
There were 13 critical cases obtained from the contingency analysis for the IEEE 118 bus system. However, only two cases of critical lines were taken as examples to be presented and discussed in this paper. The data on the coherent groups of generators was obtained from previously published work [14]. For each case, the system was divided into two islands with the coherent groups of generators: G1 = {10, 12, 25, 26, 31} and G2 = {46, 49, 54, 59, 61, 65, 66, 69, 80, 87, 89, 100, 103, 111} as shown in Table 3.
4.1. Case A: Outage of Line 4–5
One of the critical lines obtained from contingency analysis was Line 4–5. Failure of this line was due to any fault or disturbance that caused other transmission lines to be overloaded and tripped; Line 5–11 (loading at 130.3967%), Line 8–30 (loading at 120.0123%), Line 5–6 (loading at 114.4148%), Line 8–9 (104.3694%) exceeded their maximum limit. These conditions sometimes led to cascading failures if further outages occurred.
In order to avoid the cascading failure due to the outage of Line 4–5, the proposed network splitting method was applied. Table 4 shows the initial cutsets of network splitting and its total power disruption, Pdisrup. The result in Table 4 depicts that the proposed approach was able to reduce the large initial search space of 186 possible transmission line combinations, which is 2186 ≈ 9.80797 × 1055 to 6 lines as an initial cutsets in Case A. The initial cutsets was used as initial populations in DEP optimization technique to reduce the searching space and speed up the convergence.
In this case, the DEP optimization technique reached convergence within 10 iterations. Thirty tests were repeated to ensure the consistency of the optimal splitting solution. As per the results shown in Table 5, the system was divided into two islands: there were 46 buses on Island 1 and 72 buses on Island 2. The cutsets obtained in this case were 37–40, 39–40, 34–43, 38–65, 24–70, and 70–71, which resulted in the lowest minimal power disruption of 217.4137 MW. Generation–load balance in each island was essential after system splitting. In Island 1, although all generators reached a maximum power generation limit, the load demand could not be met. In other words, the total load demand was more than the total generation. As such, a load shedding scheme was initiated. The load shedding scheme was executed by shedding loads at Buses 11 and 20 (88 MW) to fulfill the generation–load demand balance in the island. This action was important to ensure the island was stable and balanced and can operate as a standalone island. In contrast to Island 1, the generation and load demand in Island 2 was balanced as their total Pgen was greater than the total power required Pload. Therefore, load shedding was not required, and power generation of all generators was adjusted to match the load demand. Finally, the transmission line overloading analysis was carried out for each island to ensure that transmission line overloading did not occur. The results obtained prove that the utilization of the discrete optimization technique helped to reduce the total power flow disruption from 240.8302 MW in the initial cutsets to 217.4137 MW in the final optimal splitting solution. The optimal network splitting solution for Case A is shown in Figure 7.
4.2. Case B: Outage of Line 38–65
Transmission line 38–65 is defined as one of the critical lines from contingency analysis conducted in this work. Tripping of this line caused other transmission lines to be overloaded and tripped; Line 30–38 (loading at 131.9215%), Line 23–32 (loading at 118.0462%), Line 23–32 (loading at 118.0462%), Line 8–30 (loading at 110.2112%), Line 42–49 (loading at 103.8735%), and Line 8–9 (loading at 103.5919%) exceeded their maximum limit. This scenario will initiate the cascading failures if further outages were to occur.
In preventing cascading failure due to the outage of Line 38–65, an approach similar to Case A was applied to Case B. By identifying the initial cutsets, the initial search space of 186 possible transmission line combinations, namely, 2186 ≈ 9.80797 × 1055, was reduced significantly to 5 lines as illustrated in Table 6.
In Case B, the DEP optimization technique reached convergence within 10 iterations. Thirty tests were repeated to ensure the consistency of the optimal splitting solution. The results (Table 7) show that the system split into two islands, where there were 42 buses on Island 1 and 76 buses on Island 2. The optimal network splitting solution (cutsets) obtained in this case was 23–24, 37–40, 39–40 and 34–43, which gave the lowest minimal power disruption of 116.6024 MW. It was essential to ensure that generation and load were balanced in each island after the system split. Although all generators in Island 1 reached the maximum power generation limit, load demand was higher than the total generation. As such, a load shedding scheme was initiated. The load shedding scheme was executed by shedding loads at Buses 13 and 16 (59 MW) to fulfill the generation–load-demand balance in the island. This action was important to ensure the island was stable and balanced and able to operate as a standalone island. In contrast to Island 1, the generation–load-demand in Island 2 was balanced, as their total Pgen was greater than the total power required Pload. Therefore, load shedding was not required. Utilization of the discrete optimization technique helped to reduce the total power flow disruption by 28% in the final optimal splitting solution. The optimal network splitting solution for Case B is as shown in Figure 8.
In order to validate the performance of the proposed algorithm, the results obtained from this work were compared with those obtained via the method proposed in [17]. All results are shown in Table 8. The proposed algorithm eventually found an optimal splitting solution with less power flow disruption compared with the method in [17]. Specifically, the proposed DEP optimization technique for network splitting reduced the total power flow disruption by 18% and 62% respectively, from that obtained using the method presented in [17]. Thus, it is demonstrated that the proposed technique managed to find a splitting solution (cutsets) with a lower total power disruption.
5. Conclusions
This paper presents a new strategy for power system network splitting subsequent to critical line outages based on N-1 contingency analysis. In the proposed strategy, the N-1 contingency analysis is conducted to identify a list of critical lines that can cause severe cascading failures. Graph theory is used to model the physical connection of the network and determine the splitting point, whereas a heuristic initialization approach is applied to reduce the search space of the possible splitting solution. Using this technique, the initial cutsets based on the coherent groups of generators available are identified. The initial cutsets goes through DEP optimization technique to determine the optimal network splitting solution while satisfying the stated constraints such as the generator’s coherency, generation–load balance, and transmission line overloading. The approach uses minimal power disruption as its objective function in finding the optimal network splitting solution. When islands are formed from the optimal cutsets, the network is checked based upon generation–load balance. A load shedding scheme is carried out if the power balance criterion in any island is violated. The proposed strategy was verified using an IEEE 118 bus system for two different cases. Numerical results show that the proposed splitting network algorithm has the ability to find an optimal solution with lower total power flow disruption, as highlighted in IEEE 118—Case B—where the algorithm was able to find an optimal splitting solution with lower total power disruption (62% lower) compared to the method presented in [17]. In conclusion, the proposed strategy was able to find an optimal network splitting solution for a large and complex power system and thus form balanced and stable islands.
Acknowledgments
The author would like to dedicate her appreciation to Universiti Teknikal Malaysia Melaka (UTeM), Universiti Tenaga Nasional (UNITEN) and Ministry of Education, Malaysia (MOE) for their continuous support in this research. This research is fully funded by the Universiti Tenaga Nasional Internal Grant (UNITEN/RMC/1/14-1685).
Author Contributions
Nur Zawani Saharuddin designed the study, performed all levels of analysis, and developed the heuristic intialization method and the DEP optimization technique for investigation and performance validation. She also wrote the first draft of the manuscript. Izham Zainal Abidin and Hazlie Mohklis contributed their expertise in the field and verified the obtained results based on theoretical concepts involved. Abdul Rahim Abdullah and Kanendra Naidu reviewed the work critically for important intellectual content. All authors were involved to revise and approve the final manuscript.
Conflicts of Interest
The authors declare no conflict of interest. The founding sponsors had no role in the design of the study; in the collection, analyses, or interpretation of data; in the writing of the manuscript; or in the decision to publish the results.
Abbreviations
| DEP | discrete evolutionary programming |
| N-1 | single component outage |
| N-2 | two-component outage |
| N-1-1 | sequence outage |
| Pgen | generated active power |
| Pload | supplied active power |
| Pi,line | active power flow for line i |
| Pi,max | maximum limit of active power flow for line i |
| Vline | voltage magnitude in system |
| Vmax | maximum voltage value |
| Vmin | minimum voltage value |
| Sij | critical loading on edge between transmission line li and transmission line lj |
| cohg_j | coherent groups of generators, j = 1, 2, ..., n, n = number of coherent groups of generators |
| CS | cutsets |
| G | graph theory |
| E | edges |
| V | Vertices |
| Aij | edge from vertex i to vertex j |
| f(x) | objective function |
| Pi | active power flow, for line i |
| nline | total number of disconnected lines |
| xi | initial populations |
| x☐ | 10 best populations |
| xp | final 10 best populations |
| PV | generator bus |
| S | solution space |
| Pimb | power imbalance |
| Pmax(slack) | maximum power rating for slack bus |
| load shed | load shedding |
| Pdisrup | power disruption |
References
- Larsson, S.; Ek, E. The black-out in southern Sweden and Eastern Denmark, September 23, 2003. In Proceedings of the IEEE Power Engineering Society General Meeting, Denver, CO, USA, 6–10 June 2004; pp. 1–5. [Google Scholar]
- Andersson, G.; Donalek, P.; Farmer, R.; Hatziargyriou, N.; Kamwa, I.; Kundur, P.; Martins, N.; Paserba, J.; Pourbeik, P.; Schulz, R.; et al. Causes of the 2003 Major Grid Blackouts in North America and Europe, and Recommended Means to Improve System Dynamic Performance. IEEE Trans. Power Syst. 2005, 20, 1922–1928. [Google Scholar] [CrossRef]
- Yamashita, K.; Li, J.; Zhang, P.; Liu, C. Analysis and Control of Major Blackout Events. In Proceedings of the Power Systems Conference and Exposition, 2009, PSCE’09, IEEE/PES, Seattle, WA, USA, 15–18 March 2009; pp. 2–5. [Google Scholar]
- Union for the Co-ordination of Transmission of Electricity. Final Report System Disturbance on 4 November 2006; Union for the Co-ordination of Transmission of Electricity: Copenhagen, Denmark, 2006. [Google Scholar]
- Kundur, P.; Taylor, C. Blackout Experiences and Lessons, Best Practices for System Dynamic Performance, and the Role of New Technologies; IEEE Task Force Report; IEEE: New York, NY, USA, 2007. [Google Scholar]
- Zhao, Q.; Sun, K.; Zheng, D.; Ma, J.; Lu, Q. A study of system splitting strategies for island operation of power system: A two-phase method based on OBDDs. IEEE Trans. Power Syst. 2003, 18, 1556–1565. [Google Scholar] [CrossRef]
- Sun, K.; Zheng, D.Z.; Lu, Q. Splitting strategies for islanding operation of large-scale power systems using OBDD-based methods. IEEE Trans. Power Syst. 2003, 18, 912–923. [Google Scholar] [CrossRef]
- You, H.; Vittal, V.; Wang, X. Slow Coherency-Based Islanding. IEEE Trans. Power Syst. 2004, 19, 483–491. [Google Scholar] [CrossRef]
- Wang, X.; Vittal, V. System Islanding Using Minimal Cutsets with Minimum Net Flow. In Proceedings of the Power System Conference and Exposition, New York, NY, USA, 10–13 October 2004; pp. 1–6. [Google Scholar]
- Xu, G.; Vittal, V. Slow Coherency Based Cutset Determination Algorithm for Large Power Systems. IEEE Trans. Power Syst. 2010, 25, 877–884. [Google Scholar] [CrossRef]
- Trodden, P.A.; Bukhsh, W.A.; Grothey, A.; Mckinnon, K.I.M. MILP Formulation for Islanding of Power Networks. IEEE Trans. Power Syst. 2014, 29, 1–8. [Google Scholar]
- Trodden, P.A.; Bukhsh, W.A.; Grothey, A.; McKinnon, K.I.M. Optimization-Based Islanding of Power Networks Using Piecewise Linear AC Power Flow. IEEE Trans. Power Syst. 2014, 29, 1212–1220. [Google Scholar] [CrossRef]
- Aghamohammadi, M.R.; Shahmohammadi, A. Electrical Power and Energy Systems Intentional islanding using a new algorithm based on ant search mechanism. Int. J. Electr. Power Energy Syst. 2012, 35, 138–147. [Google Scholar] [CrossRef]
- Liu, W.; Liu, L.; Cartes, D.A. Binary Particle Swarm Optimization Based Defensive Islanding of Large Scale Power Systems. Int. J. Comput. Sci. Appl. 2007, 4, 69–83. [Google Scholar]
- Liu, L.; Liu, W.; Cartes, D.A.; Chung, I. Slow coherency and Angle Modulated Particle Swarm Optimization based islanding of large-scale power systems. Adv. Eng. Inform. 2009, 23, 45–56. [Google Scholar] [CrossRef]
- Ding, L.; Gonzalez-longatt, F.M.; Wall, P.; Terzija, V. Two-Step Spectral Clustering Controlled Islanding Algorithm. IEEE Trans. Power Syst. 2013, 28, 75–84. [Google Scholar] [CrossRef]
- Dola, H.M.; Chowdhury, B.H. Intentional islanding and adaptive load shedding to avoid cascading outages Intentional Islanding and Adaptive Load Shedding to Avoid Cascading Outages. In Proceedings of the 2006 IEEE Power Engineering Society General Meeting, Montreal, QC, Canada, 18–22 June 2006. [Google Scholar]
- Force, I.P.C.T. Initial review of methods for cascading failure analysis in electric power transmission systems. In Proceedings of the IEEE Power & Energy Society 2008 General Meeting, Pittsburgh, PA, USA, 20–24 July 2008; pp. 1–8. [Google Scholar]
- Morison, K.; Wang, L.; Kundur, P. Power System Security Assessment. IEEE Power Energy Mag. 2004, 2, 30–39. [Google Scholar] [CrossRef]
- Nnonyelu, C.J.; Madueme, T.C. Power System Contingency Analysis: A Study of Nigeria’ s 330KV Transmission Grid. In Proceedings of the Energy Source for Power Generation Conference, Nsukka, Nigeria, 21–23 July 2013. [Google Scholar]
- Koren, Y. Drawing Graphs by Eigenvectors: Theory and Practice. Int. J. Comput. Math. Appl. 2005, 49, 1867–1888. [Google Scholar] [CrossRef]
- Skiena, S. Dijkstra’s algorithm. In Implementing Discrete Mathematics: Combinatorics and Graph Theory with Mathematica; Addison-Wesley: Reading, MA, USA, 1990; pp. 225–227. [Google Scholar]
Figure 1.
The flowchart of the proposed approach.
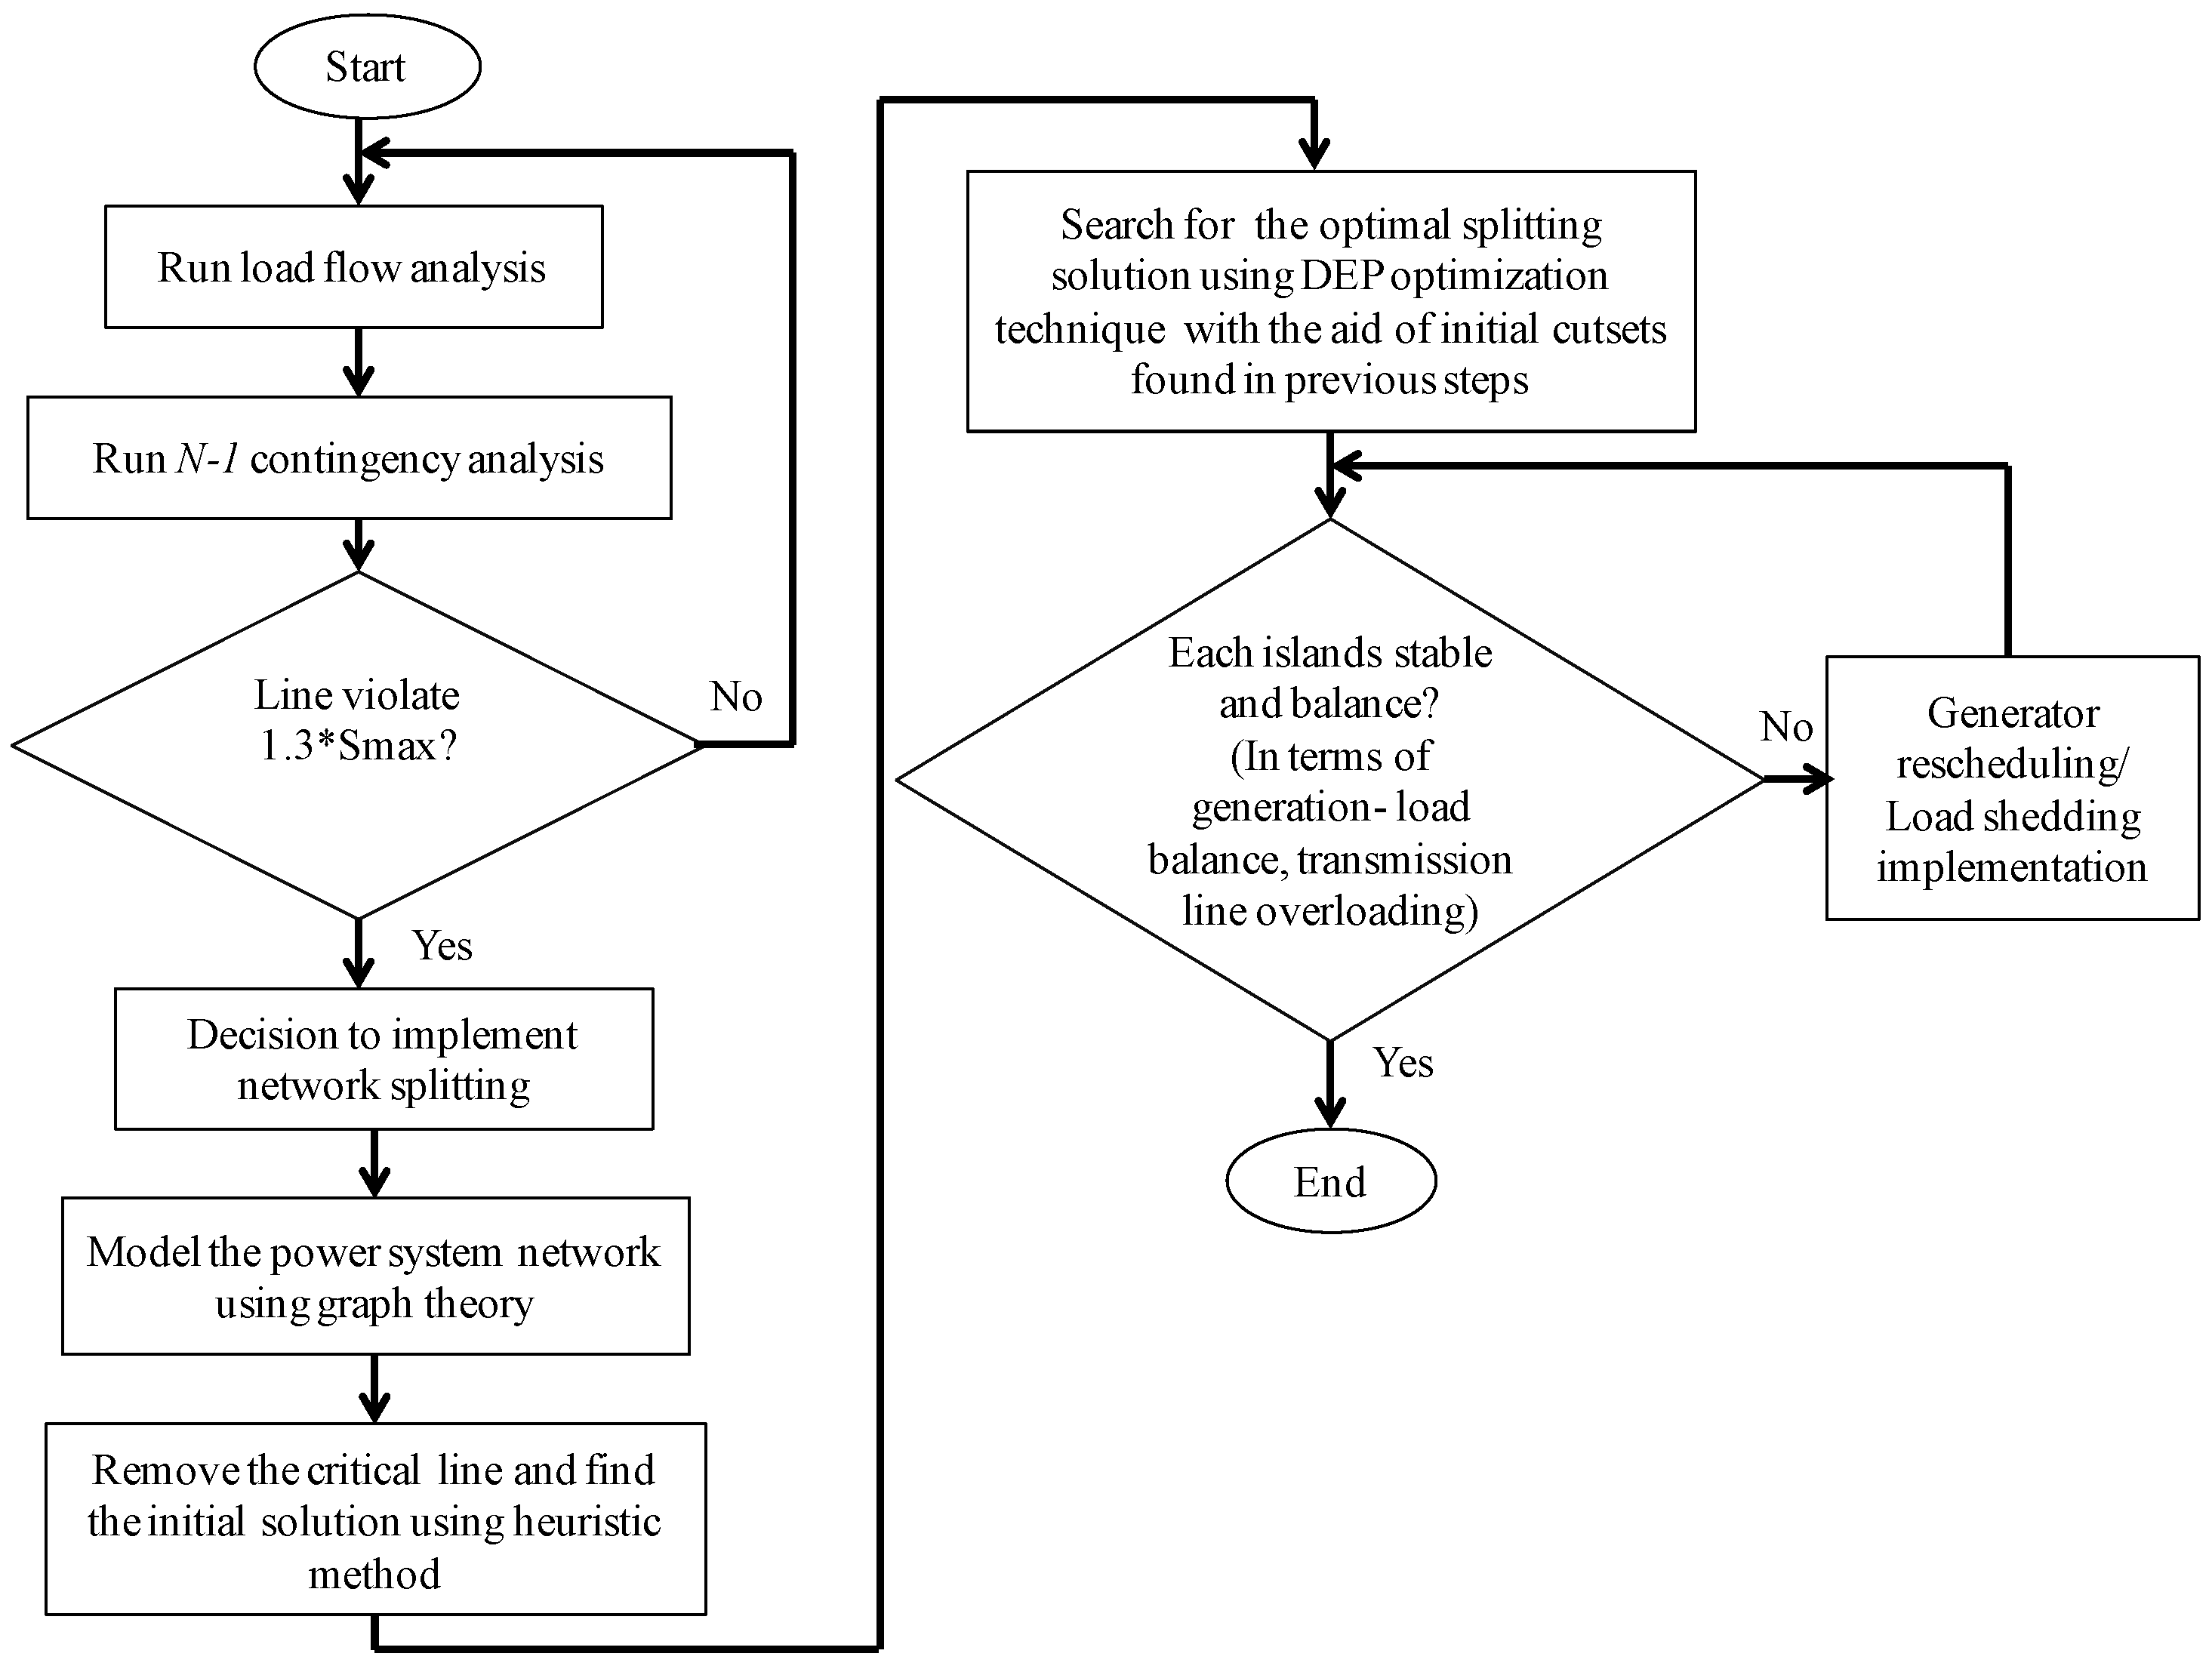
Figure 2.
IEEE 14 bus system where the critical line (line 9-10) is disconnected due to any outages.
Figure 2.
IEEE 14 bus system where the critical line (line 9-10) is disconnected due to any outages.
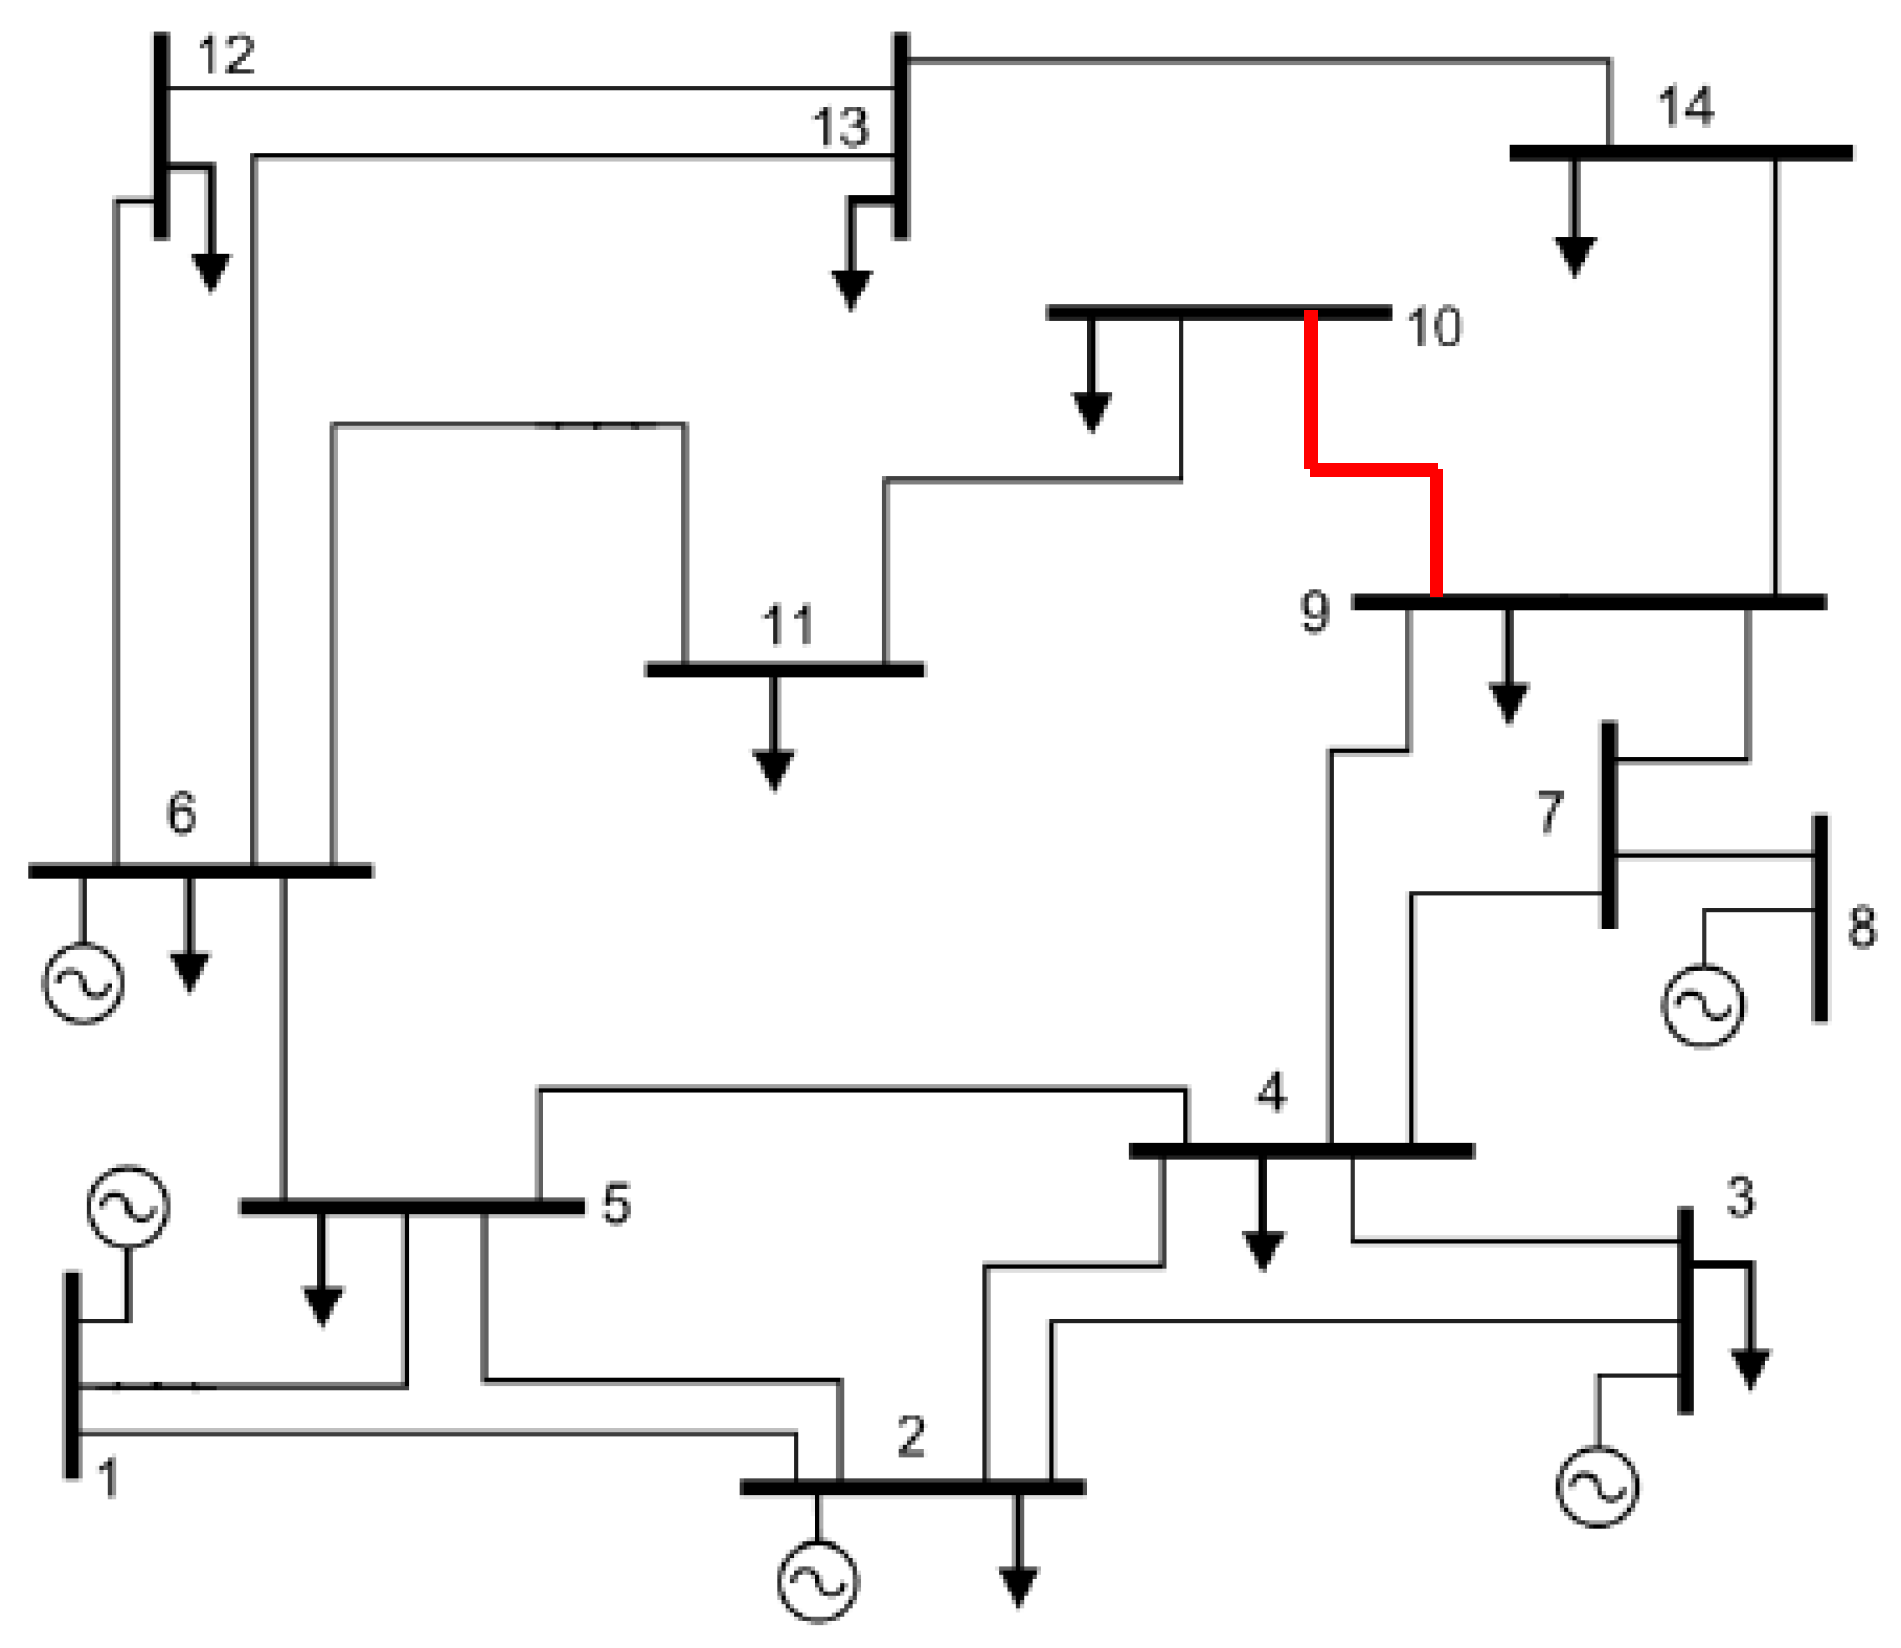
Figure 3.
(a) IEEE 5-bus system; (b) Graph representation of IEEE 5-bus system.
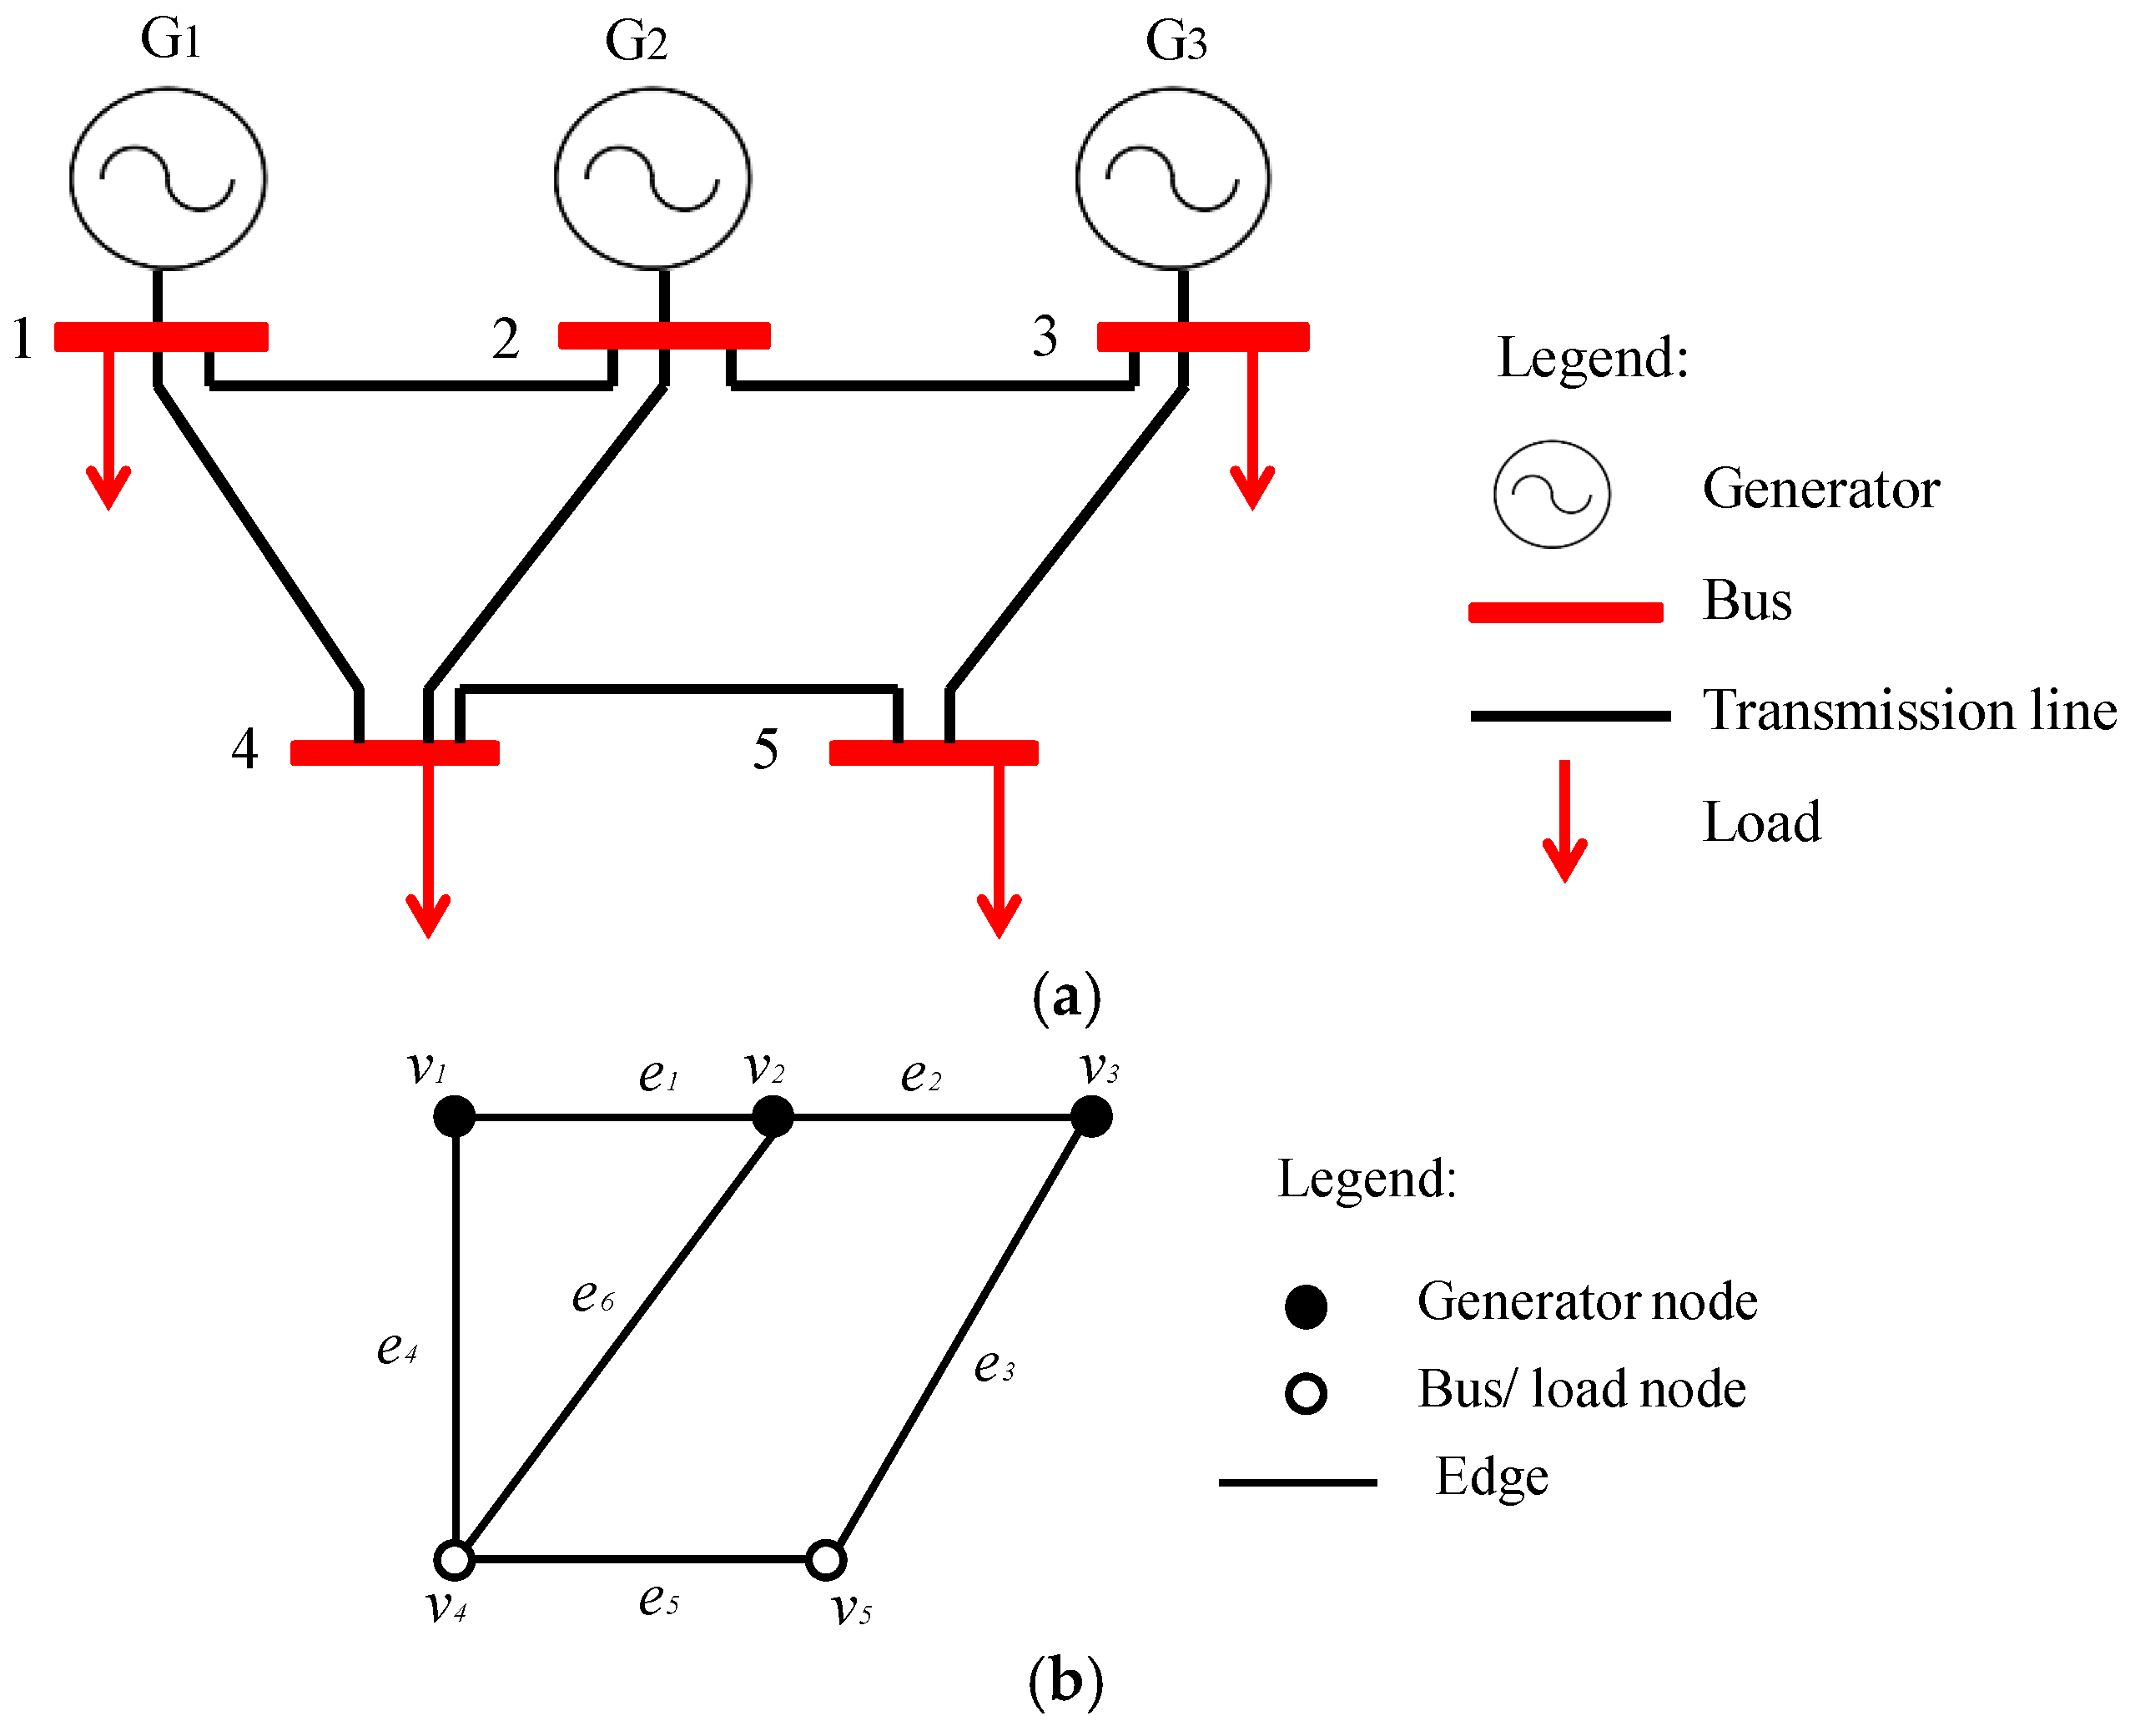
Figure 4.
Initial cutsets using a heuristic approach.
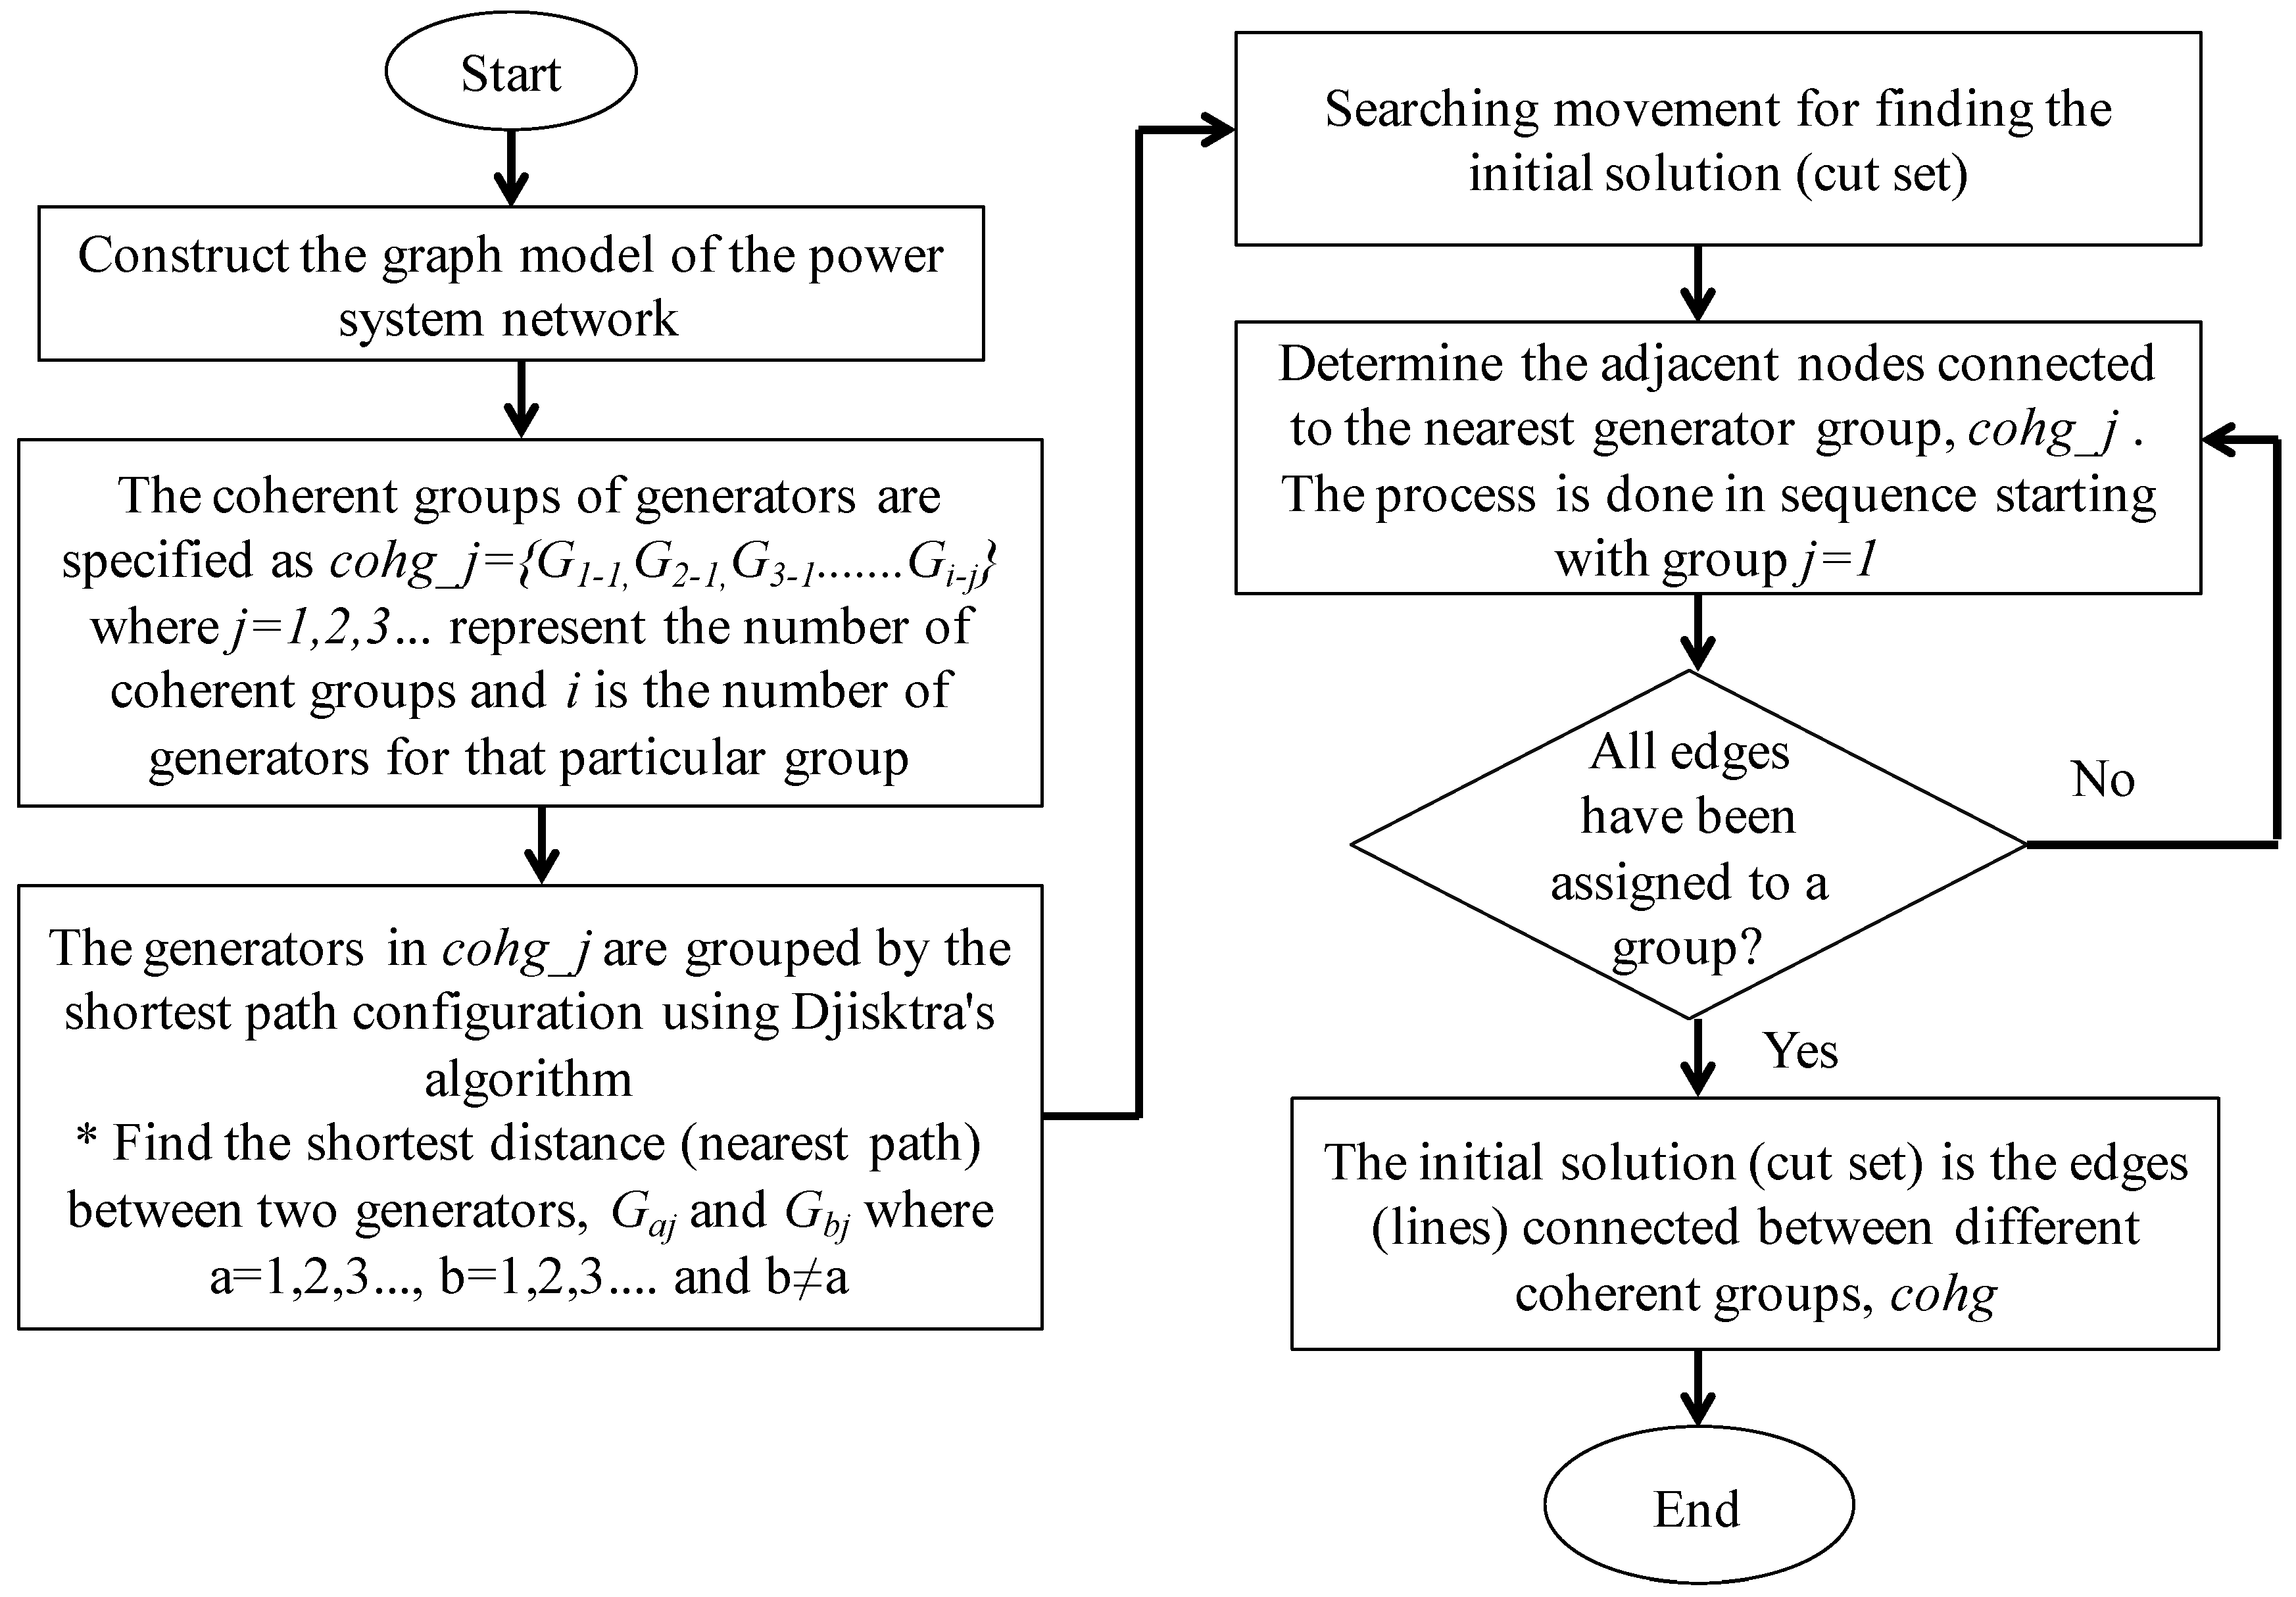
Figure 5.
Initial cutsets determination using a heuristic approach. (a) Backbone formation; (b) The first stage; (c) The second stage.
Figure 5.
Initial cutsets determination using a heuristic approach. (a) Backbone formation; (b) The first stage; (c) The second stage.
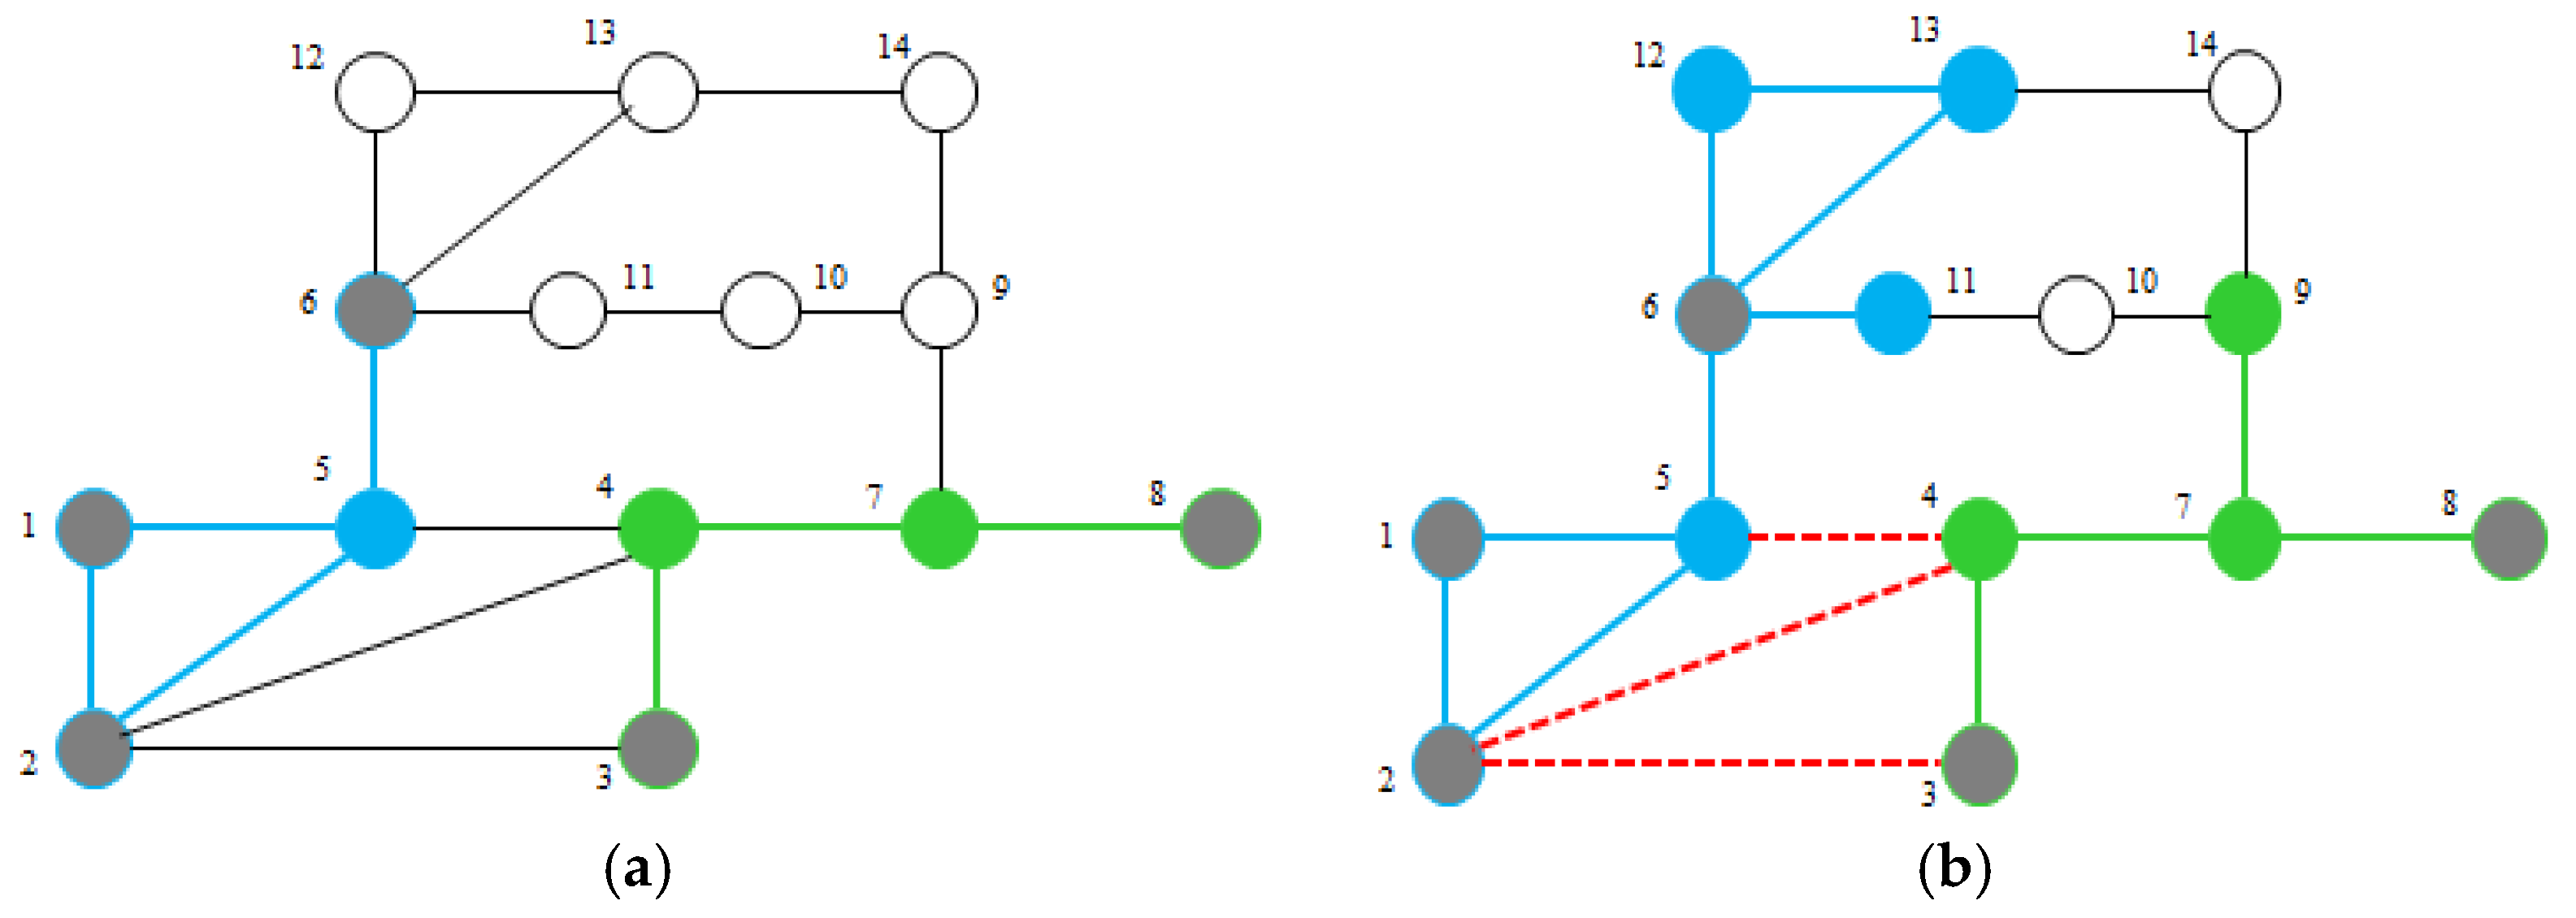
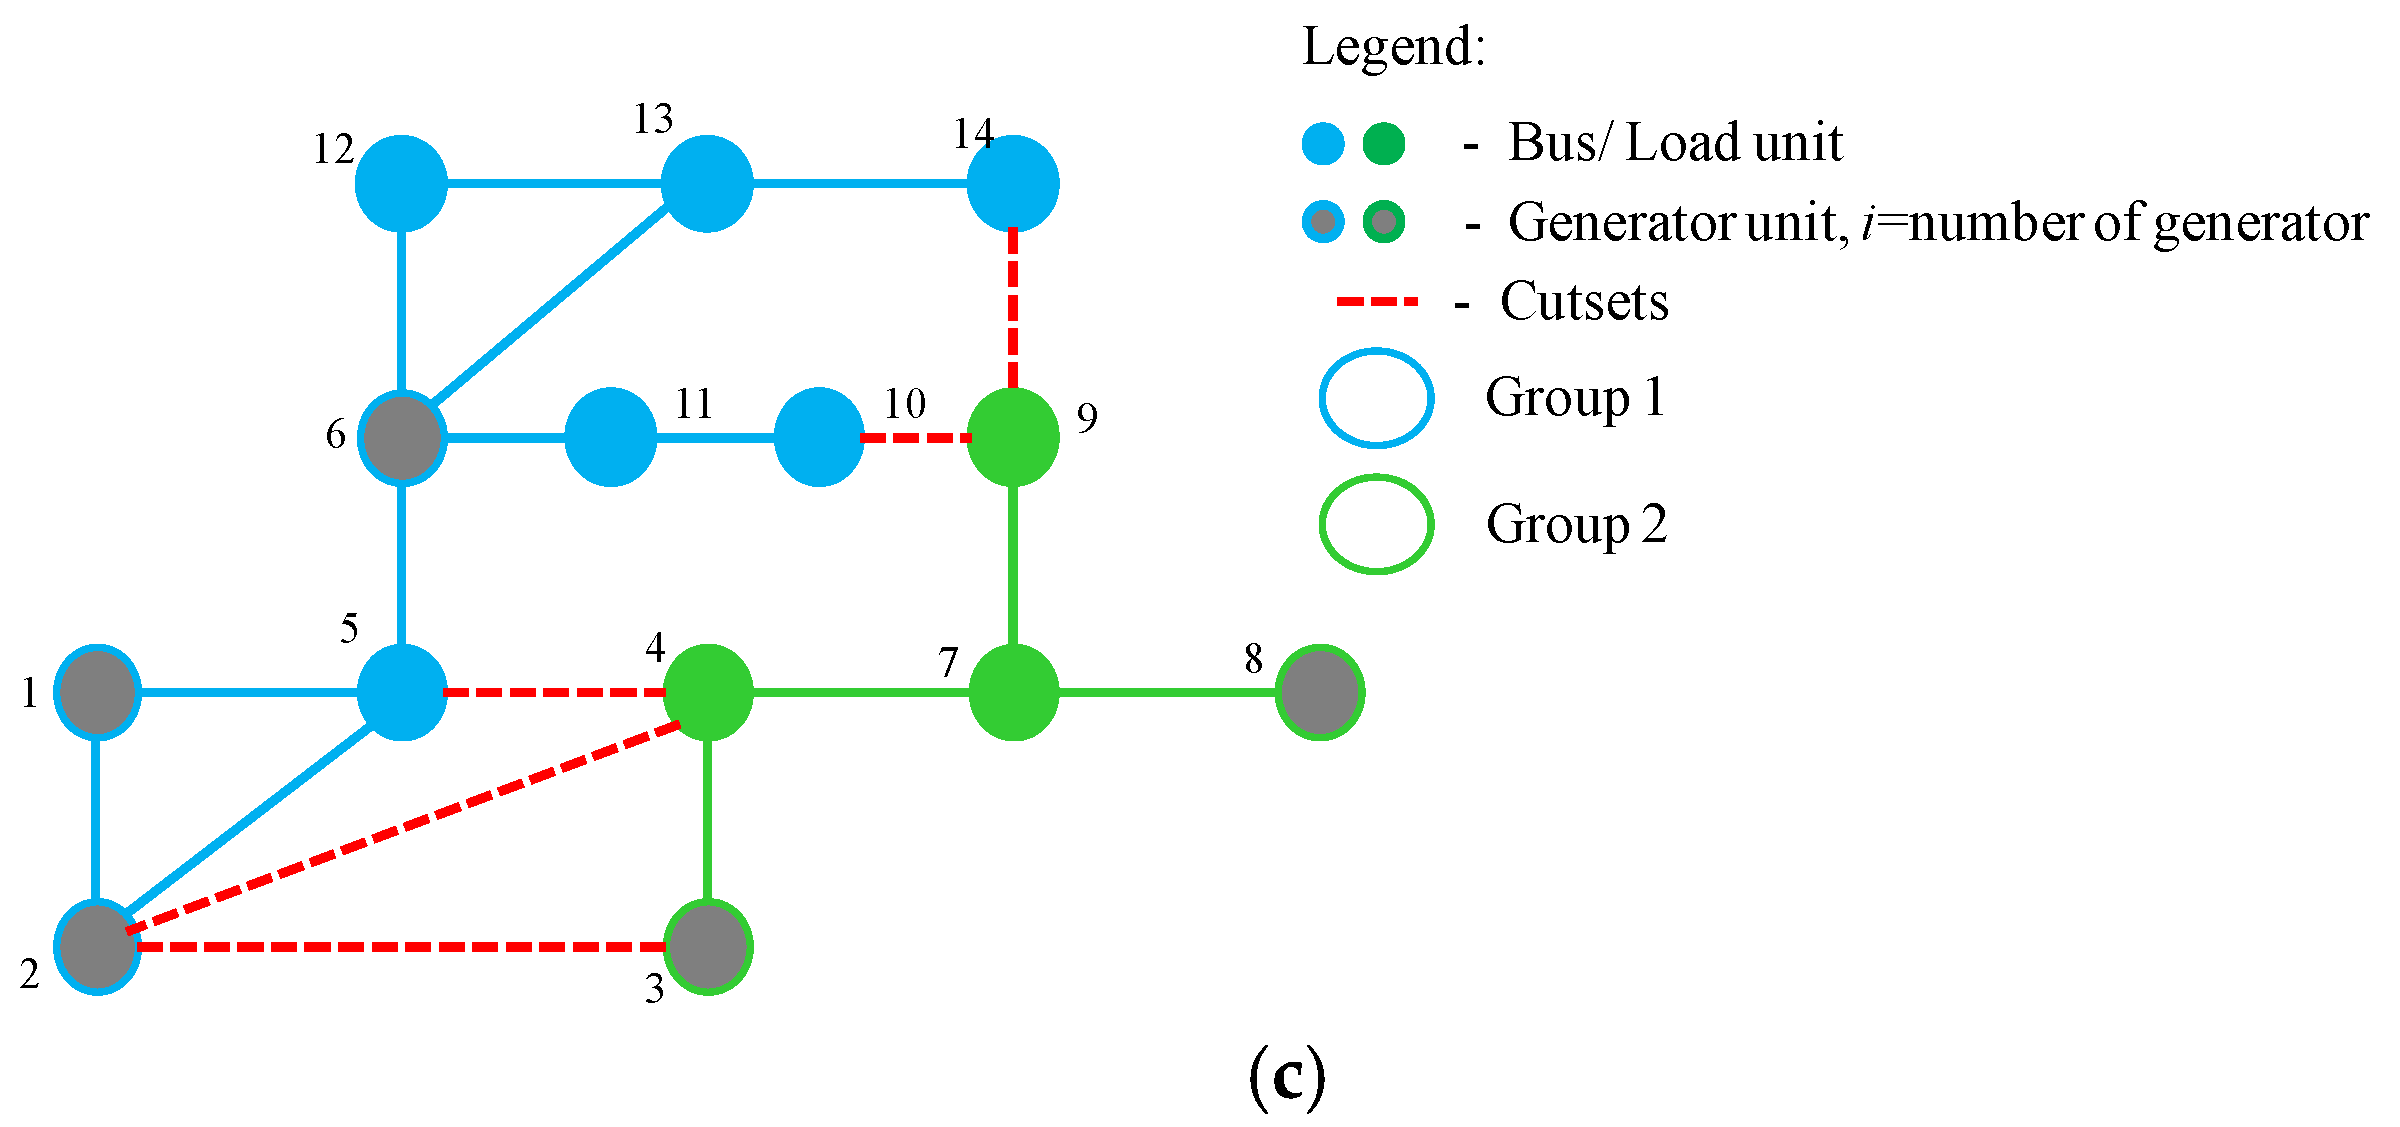
Figure 6.
The flowchart for the proposed discrete evolutionary programming (DEP) optimization technique.
Figure 6.
The flowchart for the proposed discrete evolutionary programming (DEP) optimization technique.

Figure 7.
Optimal network splitting solution (dashed red lines) for the IEEE 118 bus system—Case A.
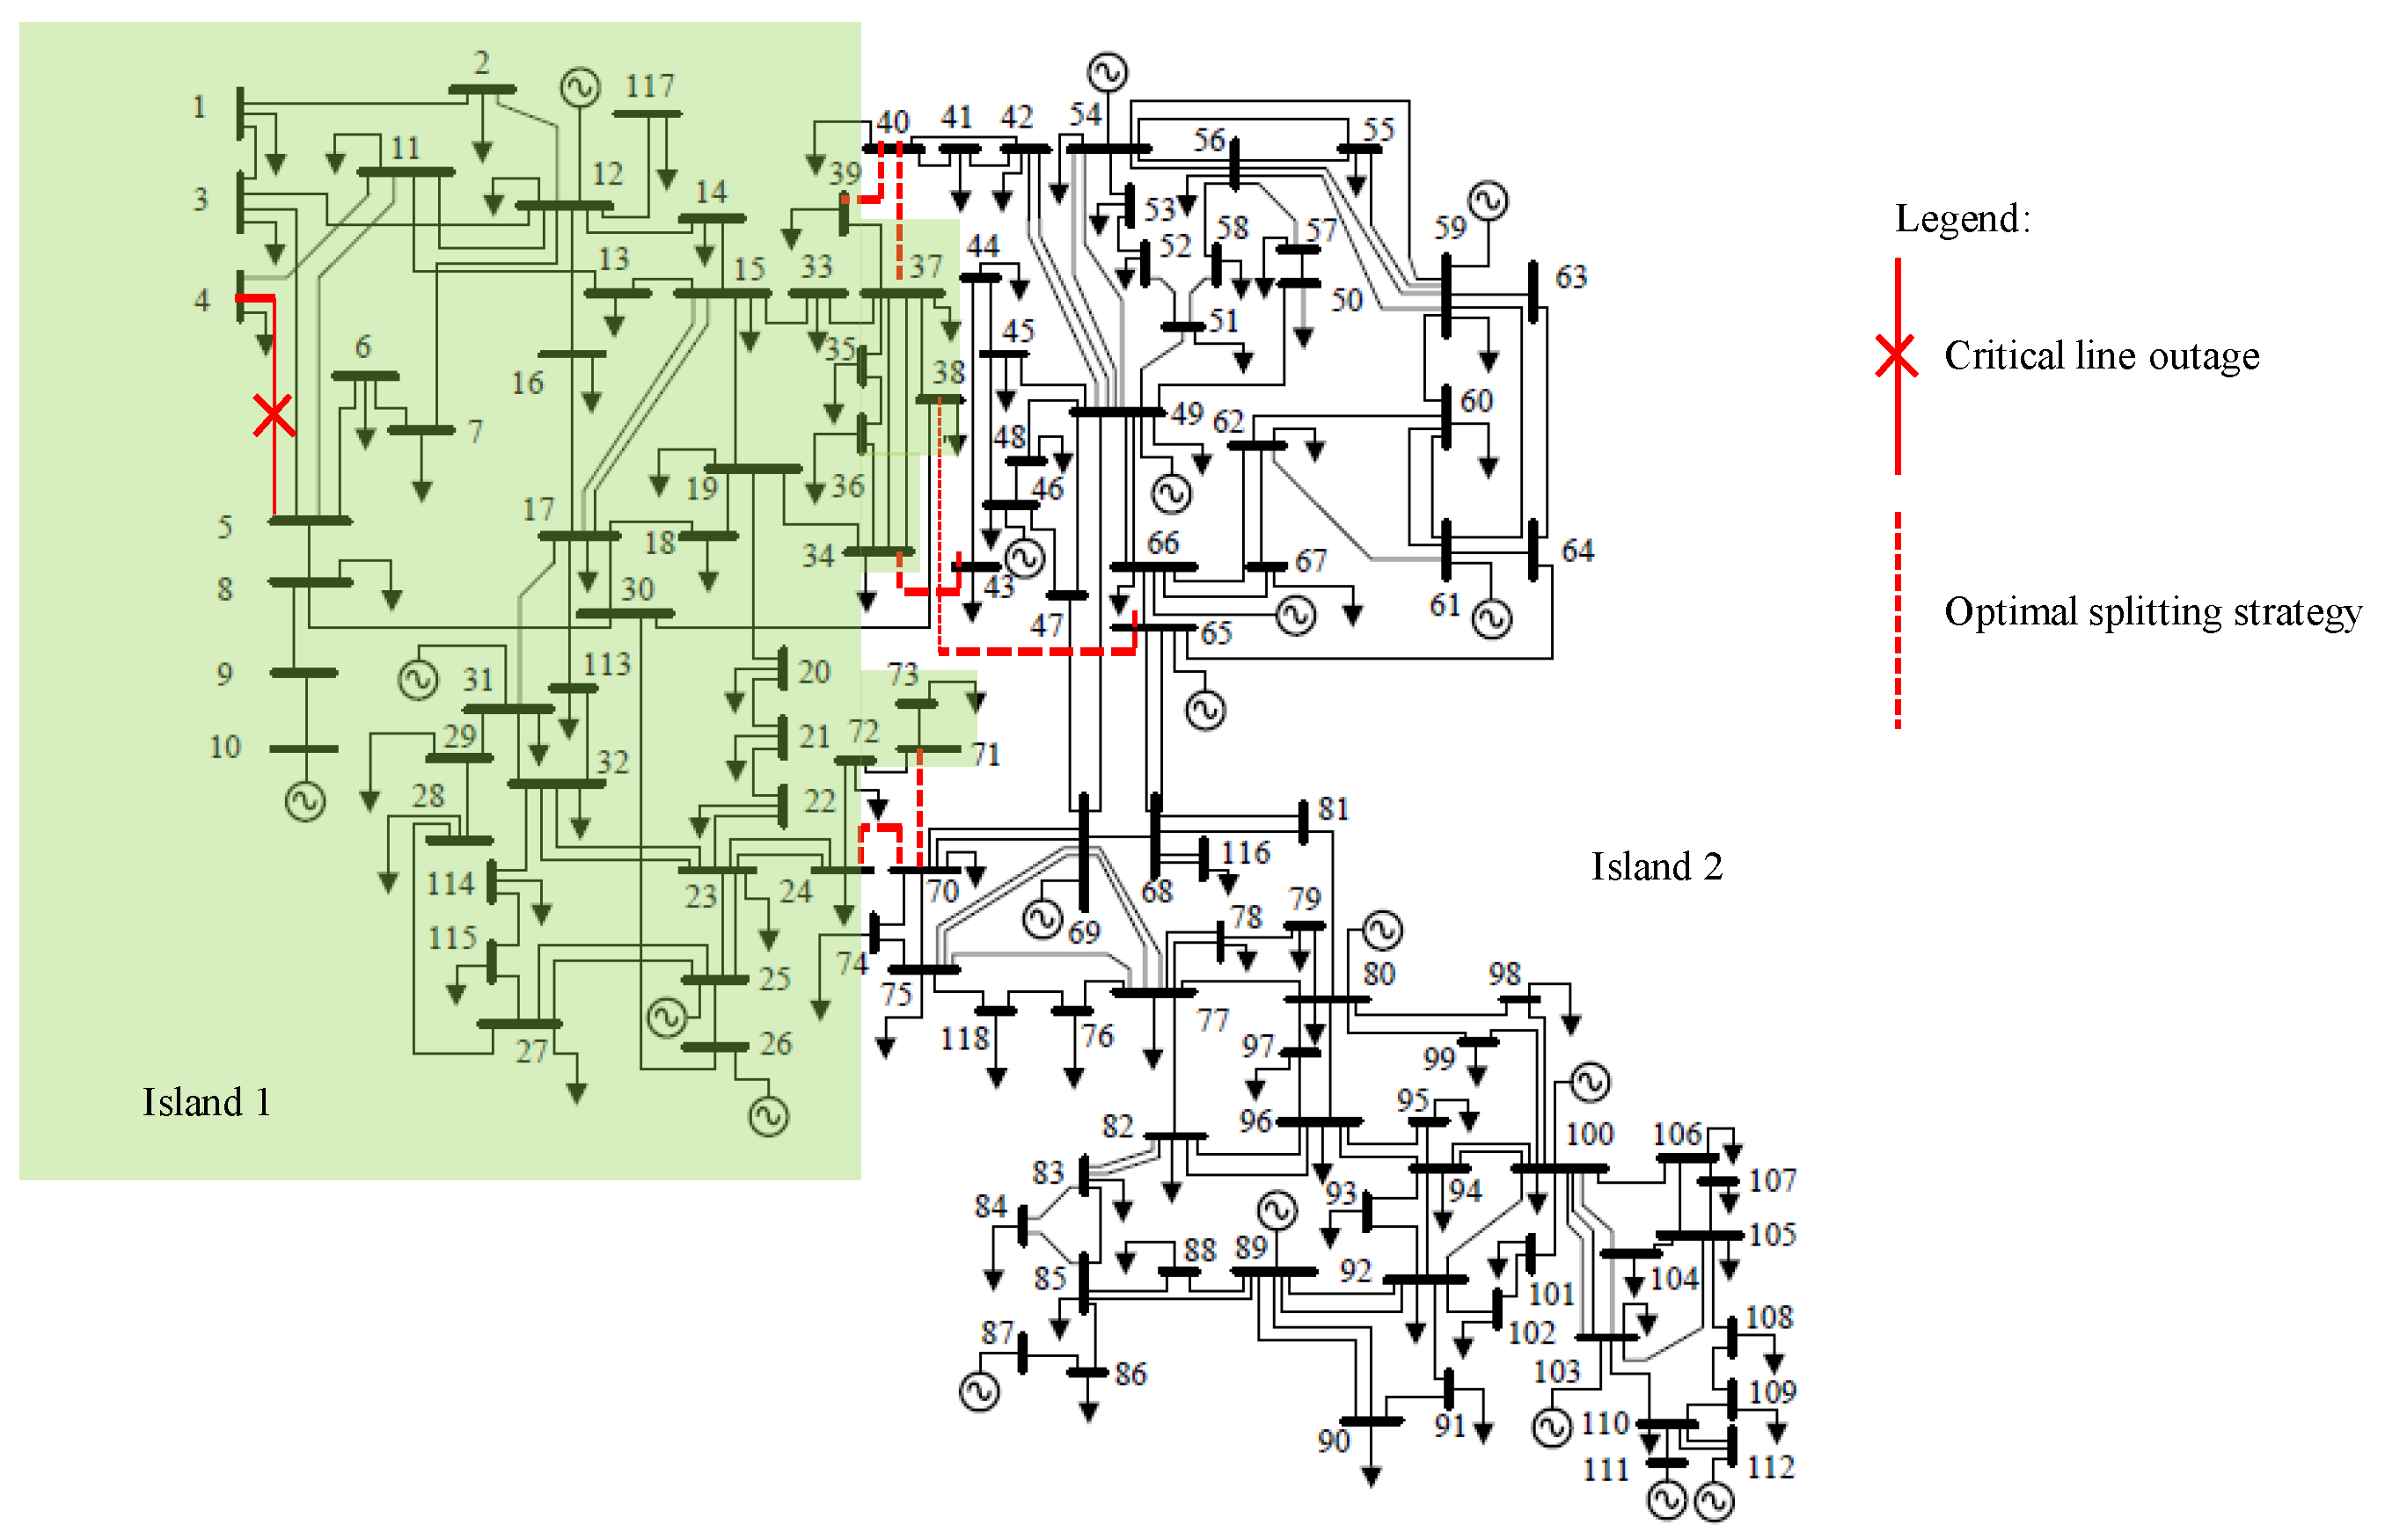
Figure 8.
Optimal network splitting solution (dashed red lines) for the IEEE 118 bus system—Case B.


Table 1.
Initialization population.
| No. | Example of Heuristic Initialization | 1st Edge | 2nd Edge | 3rd Edge | 4th Edge | 5th Edge |
|---|---|---|---|---|---|---|
| 1 | Original initial cutsets | X1 | X2 | X3 | X4 | |
| 2 | One edge is randomly added | X1 | X2 | X3 | X4 | A1 |
| 3 | One edge is randomly added | X1 | X2 | X3 | X4 | A2 |
| 4 | One edge is randomly reduced | X1 | X2 | B1 | ||
| 5 | One edge is randomly reduced | X1 | X2 | B2 |
Table 2.
Mutation process.
| No. Example of Heuristic Mutation | 1st Edge | 2nd Edge | 3rd Edge | 4th Edge | 5th Edge | |
|---|---|---|---|---|---|---|
| 1 | 3th initial population | X1 | X2 | X3 | X4 | A2 |
| 2 | 1st edge is randomly replaced | N | X2 | X3 | X4 | A2 |
| 3 | 2nd edge is randomly replaced | X1 | N | X3 | X4 | A2 |
| 4 | 3rd edge is randomly replaced | X1 | X2 | N | X4 | A2 |
| 5 | 4th edge is randomly replaced | X1 | X2 | X3 | N | A2 |
| 6 | 5th edge is randomly replaced | X1 | X2 | X3 | X4 | N |
Table 3.
Generator groups for the IEEE 118 bus system.
| Test System | Total Generators | Islands | Coherent Generators |
|---|---|---|---|
| IEEE 118 | 10, 12, 25, 26, 31, 46, 49, 54, 59, 61, 65, 66, 69, 80, 87, 89, 100, 103, 111 | First island | 10,12,25,26,31 |
| Second island | 46, 49, 54, 59, 61, 65, 66, 69, 80, 87, 89, 100, 103, 111 |
Table 4.
The initial cutsets for Case A.
| Initial Cutsets for Network Splitting | ∑Pdisrup (MW) |
|---|---|
| 37–40, 39–40, 34–43, 38–65, 24–70, 71–72 | 240.8302 |
Table 5.
IEEE 118 data after network splitting for Case A.
| Islands | Buses Info | Optimal Network Splitting Solution (Cutsets) | ∑Pdisrup (MW) | Generators Info | Active Power | Load Shed | ||||
|---|---|---|---|---|---|---|---|---|---|---|
| Before Load Shed | After Load Shed | |||||||||
| Gen | Max Limit (MW) | Total Pgen (MW) | Total Pload (MW) | Total Pgen (MW) | Total Pload (MW) | (MW) | ||||
| Island 1 | 1–39, 71–73, 113–115, 117 | 37–40, 39–40, 34–43, 38–65, 24–70, 70–71 | 217.4137 | G10 | 300 | 300 | 1167.0 | 300 | 1079 | 88 |
| G12 | 100 | 100 | 100 | |||||||
| G25 | 200 | 200 | 200 | |||||||
| G26 * | 420 | 420 | 417.603 | |||||||
| G31 | 100 | 100 | 100 | |||||||
| - | ∑1120 | ∑1120 | ∑1167.0 | ∑1117.603 | ∑1079 | |||||
| Island 2 | 40–70, 74–112, 116, 118 | G46 | 100 | 19 | 3075 | 19 | 3075 | - | ||
| G49 | 200 | 204 | 204 | |||||||
| G54 | 140 | 48 | 48 | |||||||
| G59 | 250 | 155 | 155 | |||||||
| G61 | 160 | 160 | 160 | |||||||
| G65 | 400 | 391 | 391 | |||||||
| G66 | 400 | 392 | 392 | |||||||
| G69 * | 800 | 537.421 | 537.421 | |||||||
| G80 | 500 | 477 | 477 | |||||||
| G87 | 100 | 4 | 4 | |||||||
| G89 | 600 | 500 | 500 | |||||||
| G100 | 300 | 252 | 252 | |||||||
| G103 | 100 | 40 | 40 | |||||||
| G111 | 100 | 36 | 36 | |||||||
| - | ∑4150 | ∑3211.42 | ∑3075 | ∑3211.42 | ∑3075 | |||||
* Slack bus, ∑=total
Table 6.
Initial cutsets for Case B.
| Initial Cutsets for Network Splitting | ∑Pdisrup (MW) |
|---|---|
| 37–40, 39–40, 34–43, 24–70, 71–72 | 161.7208 |
Table 7.
IEEE 118 data after network splitting for Case B.
| Islands | Buses Info | Optimal Network Splitting Solution (Cutsets) | ∑Pdisrup (MW) | Generators Info | Active Power | Load Shed | ||||
|---|---|---|---|---|---|---|---|---|---|---|
| Before Load Shed | After Load Shed | |||||||||
| Gen | Max Limit (MW) | Total Pgen (MW) | Total Pload (MW) | Total Pgen (MW) | Total Pload (MW) | (MW) | ||||
| Island 1 | 1–23, 25–39, 113–115, 117 | 23–24, 37–40, 39–40, 34–43 | 116.6024 | G10 | 300 | 300 | 1136 | 300 | 1077 | 59 |
| G12 | 100 | 100 | 100 | |||||||
| G25 | 200 | 200 | 200 | |||||||
| G26 * | 420 | 420 | 415.057 | |||||||
| G31 | 100 | 100 | 100 | |||||||
| - | ∑1120 | ∑1120 | ∑1136 | ∑1115.057 | ∑1077 | |||||
| Island 2 | 24, 40–112, 116, 118 | G46 | 100 | 19 | 3106 | 19 | 3106 | - | ||
| G49 | 200 | 200 | 200 | |||||||
| G54 | 140 | 48 | 48 | |||||||
| G59 | 250 | 155 | 155 | |||||||
| G61 | 160 | 160 | 160 | |||||||
| G65 | 400 | 391 | 391 | |||||||
| G66 | 400 | 392 | 392 | |||||||
| G69 * | 800 | 570.860 | 570.860 | |||||||
| G80 | 500 | 477 | 477 | |||||||
| G87 | 100 | 4 | 4 | |||||||
| G89 | 600 | 500 | 500 | |||||||
| G100 | 300 | 252 | 252 | |||||||
| G103 | 100 | 40 | 40 | |||||||
| G111 | 100 | 36 | 36 | |||||||
| - | ∑4150 | ∑3244.86 | ∑3106 | ∑3244.86 | ∑3106 | |||||
* Slack bus, ∑=total
Table 8.
The network splitting solution from this study and that of [17].
Table 8.
The network splitting solution from this study and that of [17].
| Test System | Technique | Disconnected Lines | Total Power Flow Disruption, Pdisrup (MW) |
|---|---|---|---|
| Case A | Reference [17] | 23–24, 38–65, 34–43, 42–49,42–29 | 265.5438 |
| Proposed method | 37–40, 39–40, 34–43, 38–65, 24–70, 70–71 | 217.4137 | |
| Case B | Reference [17] | 23–24, 34–43, 42–49,42–29 | 304.8224 |
| Proposed method | 15–19, 23–24, 37–40, 39–40, 34–43 | 116.6024 |
© 2018 by the authors. Licensee MDPI, Basel, Switzerland. This article is an open access article distributed under the terms and conditions of the Creative Commons Attribution (CC BY) license (http://creativecommons.org/licenses/by/4.0/).
Share and Cite
MDPI and ACS Style
Saharuddin, N.Z.; Zainal Abidin, I.; Mokhlis, H.; Abdullah, A.R.; Naidu, K. A Power System Network Splitting Strategy Based on Contingency Analysis. Energies 2018, 11, 434. https://doi.org/10.3390/en11020434
AMA Style
Saharuddin NZ, Zainal Abidin I, Mokhlis H, Abdullah AR, Naidu K. A Power System Network Splitting Strategy Based on Contingency Analysis. Energies. 2018; 11(2):434. https://doi.org/10.3390/en11020434
Chicago/Turabian StyleSaharuddin, Nur Zawani, Izham Zainal Abidin, Hazlie Mokhlis, Abdul Rahim Abdullah, and Kanendra Naidu. 2018. "A Power System Network Splitting Strategy Based on Contingency Analysis" Energies 11, no. 2: 434. https://doi.org/10.3390/en11020434
Note that from the first issue of 2016, this journal uses article numbers instead of page numbers. See further details here.