Assessment of Energy Performance and Emission Control Using Alternative Fuels in Cement Industry through a Process Model

School of Engineering and Technology, Central Queensland University, Rockhampton, QLD 4702, Australia
*
Author to whom correspondence should be addressed.
Energies 2017, 10(12), 1996; https://doi.org/10.3390/en10121996
Submission received: 11 October 2017
/
Revised: 20 November 2017
/
Accepted: 27 November 2017
/
Published: 1 December 2017
Abstract
:Cement manufacturing is one of the most energy intensive processes and is accountable for substantial pollutant emissions. Increasing energy costs compel stakeholders and researchers to search for alternative options to improve energy performance and reduce CO2 emissions. Alternative fuels offer a realistic solution towards the reduction of the usage of fossil fuels and the mitigation of pollutant emissions. This paper developed a process model of a precalciner kiln system in the cement industry using Aspen Plus software to simulate the effect of five alternative fuels on pollutant emissions and energy performance. The alternatives fuels used were tyre, municipal solid waste (MSW), meat and bone meal (MBM), plastic waste and sugarcane bagasse. The model was developed on the basis of energy and mass balance of the system and was validated against data from a reference cement plant. This study also investigated the effect of these alternative fuels on the quality of the clinker. The results indicated that up to a 4.4% reduction in CO2 emissions and up to a 6.4% reduction in thermal energy requirement could be achieved using these alternative fuels with 20% mix in coal. It was also found that the alternative fuels had minimum influence on the clinker quality except in the case of MSW. Overall, MBM was found to be a better option as it is capable on reducing energy requirement and CO2 emissions more than others. The outcomes of the study offer better understanding of the effects of solid alternative fuels to achieve higher energy performance and on mitigating pollutant emissions in cement industry.
1. Introduction
Increasing fossil fuel prices and new regulations from environment protection agencies to reduce the emissions from the industry sector is a great concern to stakeholders at the present time. Being an energy intensive and pollutant emitting industry, the cement industry is always under the scrutiny of these agencies. The energy required to produce one tonne of clinker varies between 3.2 to 6.3 GJ depending on the process, while 1.7 tonnes of raw materials are required for the process [1,2].
The huge energy requirement during chemical reaction of raw material are accountable for about 900 kg of CO2 and other greenhouse gas release in the environment. The cement industry is held responsible for 5–6% of anthropogenic CO2 emissions, which causes about 4% of global warming [3]. The researchers are developing different techniques to reduce the CO2 generation as well as new carbon capture technologies. Hills et al. [4] have summarized the currently proposed carbon capture technologies for the cement industry while Carrasco-Maldonado et al. [5] identified the recent development on oxy-fuel combustion technology in the cement industry. Geosequestration carbon capture technology can also be used in cement industry. CO2 methanation is a similar technology, which converts CO2 into methane (CH4) using hydrogen [6] and it could be used in cement industry as well. All the aforementioned technologies are still in the research and development stage and have yet to be completely adopted by the cement industry.
Among the other air pollutants, NOX and SO2 are main concerns for cement manufacturers. To reduce the pollutant emissions from fuel burning and to reduce the usage of nonrenewable fossil fuels, alternative fuels are often used in the kiln as well as in the calciner. Waste tyre, municipal solid waste (MSW) and industrial wastes are some of the well-established alternative fuels in cement industry for last three decades [7]. Many other alternative fuel sources have been recently identified, including meat and bone meal (MBM) [8], agricultural biomass and spent pot linings (SPL) [9], which are already in use by the manufacturer.
Introducing alternative fuels in the cement manufacturing process always pose some problem regarding the emission and clinker quality. Every pro and con must be identified before employing an alternative fuel to the manufacturing process. Numerous research works have been conducted in recent years to understand the possible impact of using alternative fuel in cement manufacturing. Mikulcic et al. [10] reviewed all the recent works on reducing greenhouse gasses emission by employing different alternative fuels. Horsley et al. [11] summarized the research articles on the behavior of trace elements on using alternative fuels in the cement industry. Specific pollutants like dioxin-like PCB have also been studied in recent years to find the correlation between the usage of alternative fuel and their emission [12]. The life cycle assessment (LCA) methodology was used by Georgiopoulou and Lyberatos [13] to quantify the environmental impact on using refuse-derived fuel (RDF), tire-derived fuel (TDF) and biological sludge as alternative fuel.
Economic risks associated with the experimentation of alternative fuels restrict the researchers’ ability to conduct tests in the cement plant. Alternatively process model offer a realistic solution of testing numerous alternative fuels and can predict the possible changes in pollutant emission and quality of the clinker. A number of software packages are available to model the manufacturing process based on thermodynamic calculation. Researchers use computational fluid dynamics (CFD) based software to model mainly the kiln section of the process [14,15,16,17,18,19,20,21,22,23]. Due to the complexity of modelling the behavior of solid particles in conventional CFD framework, researchers used one-dimensional models with material and energy balance equations. Numerical techniques associated with solving boundary value problems were incorporated to achieve accurate temperature profiles and specific mass fractions [9,10,11,12,13,14]. These models were used to study flame shape, temperature of the kiln, velocity profile of particles in the kiln system and oxygen enrichment in the burning zone. A different approach of modelling the cement manufacturing process can be found in literature by using Aspen Plus software, which focuses on the clinker chemistry, reaction stoichiometric and thermodynamic property of the material in the process [8,24,25,26,27].
In the current study, an Aspen Plus-based model for the entire clinker manufacturing process has been developed to simulate the flue gas formation while using selected alternative fuels. The model was verified using real plant data for coal that was used as primary fuel in the burning zone. The validated model was run with five selected alternative fuels—namely tyre, MSW, MBM, plastic waste and sugarcane bagasse—to predict the emission as well as the change in the kiln environment. Simulation results were used to optimize the usage of selected alternative fuels. Finally the model was executed under certain conditions to reduce the energy requirement of the system by lowering the total fuel feed but not affecting the kiln environment and daily production. The simulation results presented here indicated the reduction of pollutant emission as well as energy requirement for clinker production. This study also examined one of the biggest concerns of employing alternative fuels in the system, which is the quality of the clinker. The quality of the clinker should not be compromised, otherwise all the benefit that could be achieved through the usage of alternative fuels will have ceased. Simulation results indicate that the usage of alternative fuels had minimum effect on the clinker quality. The outcomes of this paper have provided a better understanding on the effect of alternative fuels in cement manufacturing.
2. Principles of Cement Manufacturing Process
The technology of cement production has been improved significantly from the days of its initial innovations. The principles of manufacturing process depend on the equipment design, method of operation and fuel consumption [28]. Four different operational categories are available for clinker production, which are dry, semi-dry, semi-wet and wet. Wet and semi-wet process use raw slurry, while semi-dry and dry process use dry raw meal with different process mechanism [29].
Another type of kiln, known as a vertical shaft kiln, is still in use predominately in China. A shaft kiln consists of a large drum set vertically with a packed mixture of raw material and fuel travelling down through it by gravity [30]. In Australia, precalciner kilns accounted for over 90% of total clinker production in the years 2014–2015 [31]. The current study considered the precalciner kiln type of manufacturing process due to its dominancy over the other process. In addition, an in-line calciner (ILC) has been considered for the current simulation, as this facility was available to the plant from which the data were collected. In an ILC, the tertiary air and kiln exhaust gas are carried to the burning zone of the calciner, which is useful to burn waste derived alternative fuel as well as coal and natural gases.
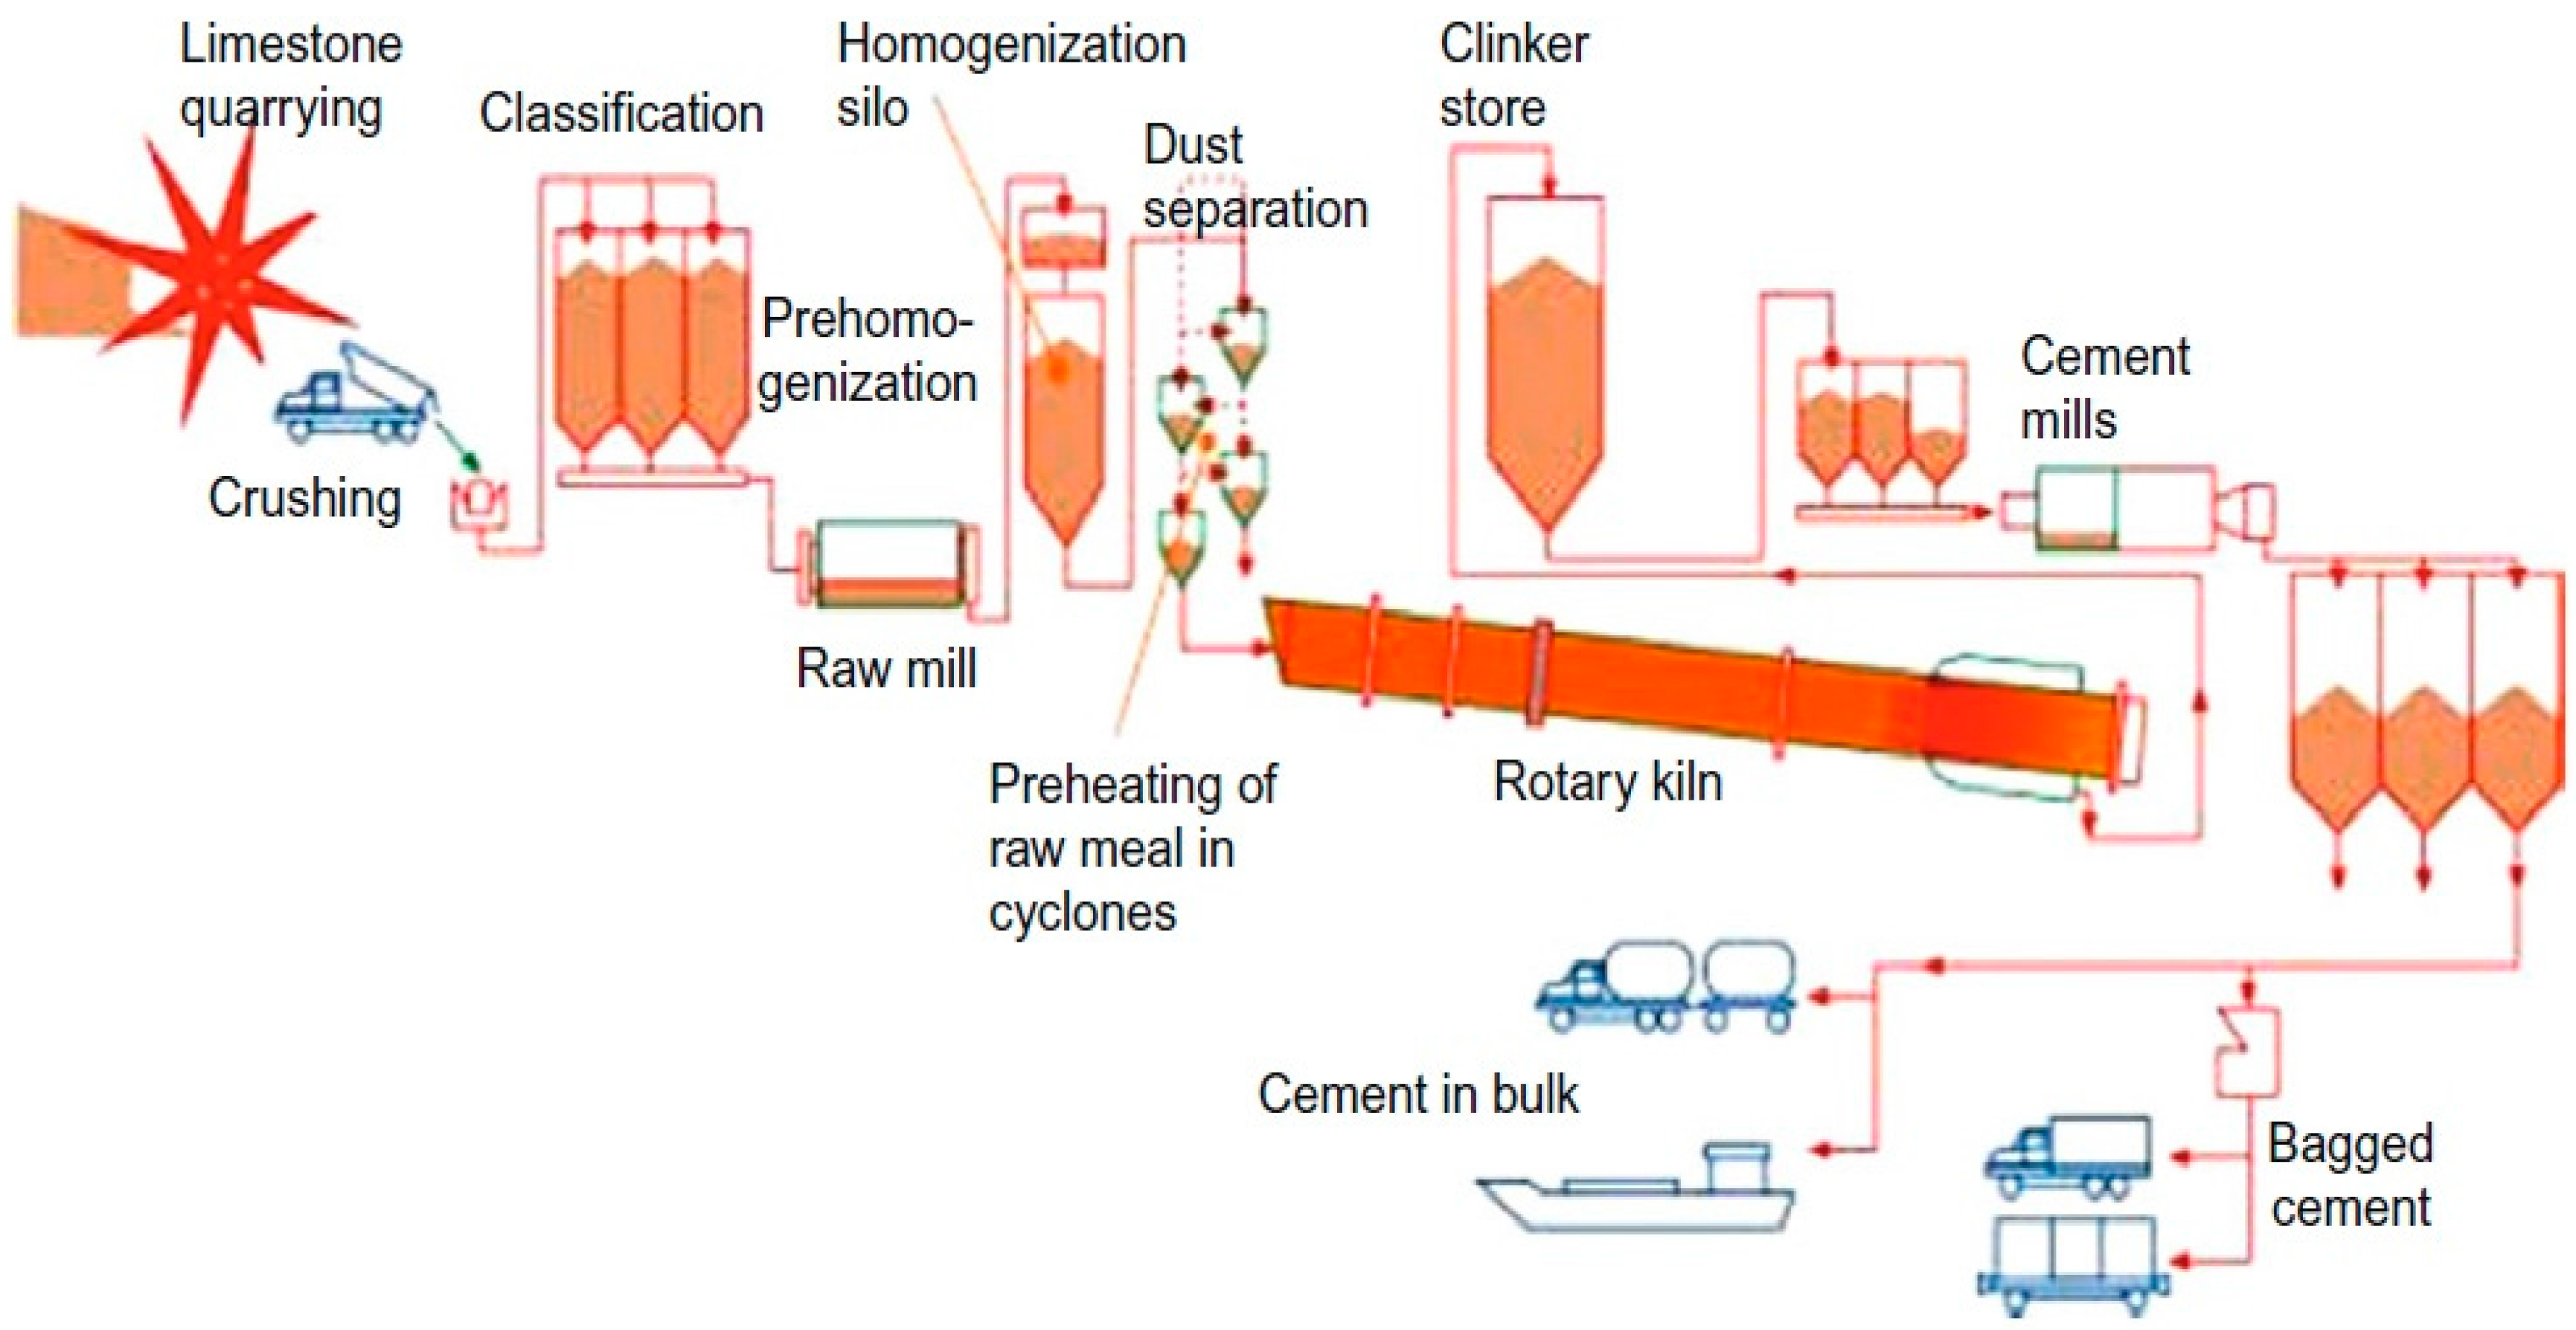
Quarry, raw meal preparation, preheating of raw meal, kiln, clinker cooling, grinding, storage and dispatch; these are the basic steps of cement production process. The first stage of chemical reactions is calcination, which is basically the decomposition of calcium carbonate (CaCO3) at about 900 °C to leave calcium oxide (CaO, lime) and release CO2. Inside the kiln, the major reactions occur where calcium oxide reacts at high temperature (typically 1400 °C–1500 °C) with silica, alumina and ferrous oxide to form the silicates, aluminates and ferrites respectively. This clinker is then ground in the ball mill together with gypsum and other additives to produce cement. Figure 1 shows a schematic diagram of the entire manufacturing process. Fuels are required to generate thermal energy during the process of calcination in the preheater-precalciner tower and during the clinkerization process in the kiln.
In the current study, the model was prepared on the basis of a process with production rate 2200 tonnes/day and 60–40% split of thermal energy requirement in precalciner and kiln respectively.
The relevant data including mass flow rate, temperature and pressure at different stage and chemical composition of fuel and feed material were collected from local cement plant where coal is used as primary fuel. According to the reference data, a constant 10% of excess air was maintained in the kiln. Excess oxygen in the precalciner depends on the flow rate of tertiary air and the kiln gas.
3. Clinker Chemistry
The chemical changes in clinker production occur almost exclusively through the pyroprocessing stage and are the same regardless of the process. Four primary materials, namely alite (C3S), belite (C2S), aluminate (C3A) and ferrite (C4AF) are formed during the production of clinker. Each of these constituents has a specific effect on the properties of the final material clinker. Along with the clinker formation reaction basic fuel burning reaction occurs inside the precalciner and kiln. The standard reaction enthalpies for the most important clinker forming reactions are given in Table 1 while the occurrence stages of different reactions are stated in Table 2.
Lime saturation factor (LSF), silica ratio (SR) and alumina ratio (AR) are the three basic ratios used to identify the quality of the clinker in cement production. The lime saturation factor is a ratio of CaO to the other three main oxides and the formula for the case of MgO < 2% is given by [34,35],
where CaO, MgO, SiO2, Al2O3 and Fe2O3 are all expressed in weight percentage.
The LSF is proportional to the ratio of alite to belite in the clinker and indicate the amount of unacceptable amount of free lime present in the clinker. The typical value of LSF for modern clinkers are 92–98% [35]. Theoretically, free lime will exist in the clinker if LSF is more than 100% but practically mixing of raw materials is never perfect and residual free lime exist in clinker even the LSF is considerably below 100%. The SR (also known as the silica modulus) governs the proportion of silicate phase in the clinker and is defined as,
SR is related with the liquid phase of the clinker at high temperature and controls the burnability of the clinker. For Portland cement, SR ranges from 2.0 to 3.0 [35]. AR is defined as the ratio of aluminate to ferrite phase and determines the quantity of liquid formed at low temperature. The formula AR is given by,
A high alumina ratio together with a low silica ratio could result in a fast-setting property of the cement, which needs to be controlled by adding higher amounts of gypsum. The value of AR between 1.0 and 4.0 is suitable for Portland cement.
4. Alternative Fuels
Alternative fuels are mostly waste derived and hence, are the more economical option over fossil fuels. It’s been over 30 years since the utilization of alternative fuels took place in cement industry on a commercial basis. Still, the manufacturers are facing some challenges regarding environmental, social and product quality issues. Rahman et al. [36] presented a detailed review on the common alternative fuels for cement industry where all the recent studies have been summarized.
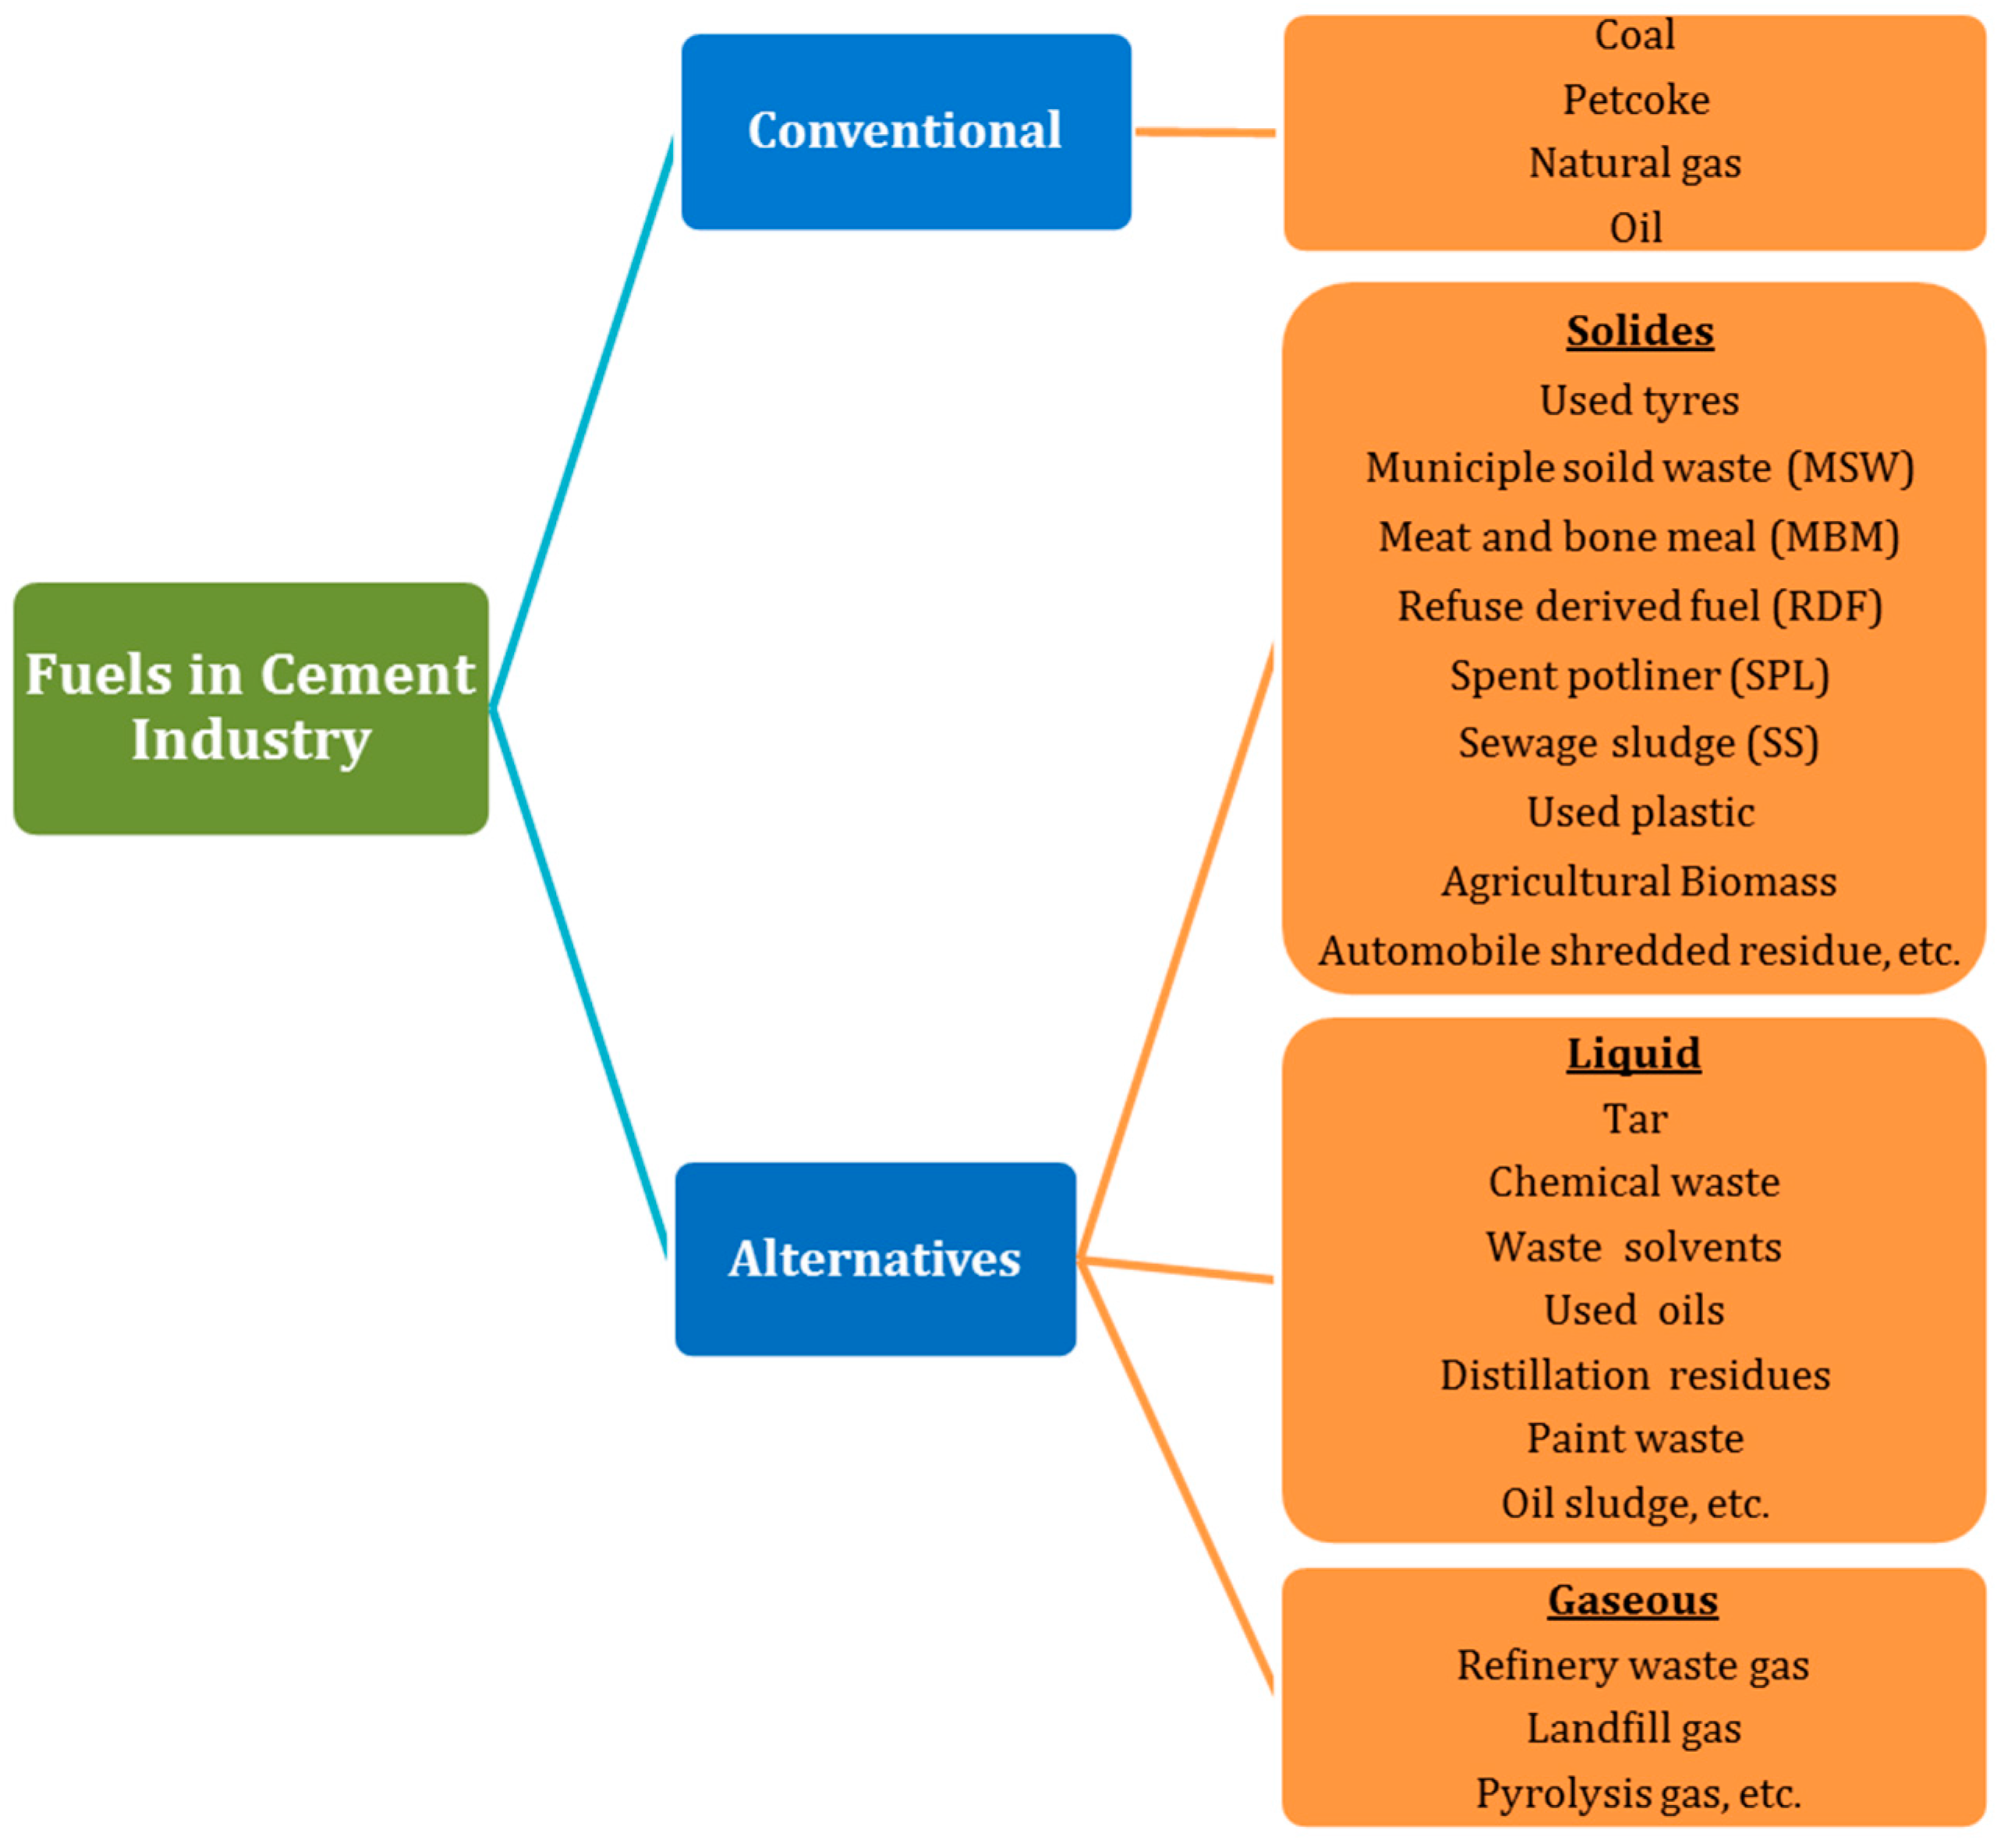
The range of alternative fuels is extremely wide. Alternative fuels are divided into three distinct categories: solid, liquid, and gaseous fuels. Different types of alternative fuel regarding their physical state are listed in Figure 2. Generally, the alternative fuels are chosen on the basis of price and availability but some other criteria such as energy content, moisture and volatile contents are equally important to ensure a feasible manufacturing process. Ash analysis of the alternative fuel is another key property that needs to be considered, as the ash remains in the kiln and takes part in the clinker formation reactions. In this article, five alternative fuels were considered for study with the process model. The chemical composition of the alternative fuels in terms of elemental analysis and ash analysis data was collected from the literature [37,38,39,40,41,42,43,44] and has been summarized in Table 3.
5. Process Model
The manufacturing of cement is a very complex process that includes several endothermic and exothermic reactions along with heat transfer in the solid, liquid and vapor phases of different materials. The process model was developed using simulation software Aspen Plus. The process model was built according to the reference plant specification with 2200 tonnes/day clinker production capacity with an ILC preheater tower. To simplify the model, several assumptions were made without affecting the basic principles of clinker formation, which are stated below.
- In the burning zone, the coal and other fuel combustion has taken place in two different reactors. The combustion process consists of the fuel decomposition section and decomposed products combustion section with Gibbs free energy minimization technique. These have been simulated by using two reactor modules of Aspen Plus, namely RYIELD and RGIBBS.
- NOX generation from the kiln was due to the combustion of the fuel only.
- CO2 was produced through calcination process and combustion of fuels.
- Only CaCO3 and MgCO3 of raw feed were decomposed within the calciner.
- Ash took part in the clinker formation reaction and ash yields were determined from the ash analysis of coal and alternative fuel.
- All the clinker formation reactions in kiln occurred in three separate reactors to facilitate pyoprocessing in different set of temperature.
- Any air leakages in the calciner system have not been considered throughout the model.
The Aspen Plus process flow sheet for cement manufacturing is illustrated in Figure 3, which clearly indicates the input and output stream of the system. One of the key features of Aspen Plus software is the availability of large numbers of the physical property method, which enables to modeling of most of the complex industrial process.
For the current process model, RKS-BM property method was selected which is suitable for coal and solid fuel combustion. The RKS-BM property method uses the Redlich-Kwong-Soave (RKS) cubic equation of state with Boston–Mathias (BM) alpha function for all thermodynamic properties. Three basic sub-stream classes exist in Aspen Plus, which are given in Table 4. For the current study, a combination of these three streams was considered, namely MCINCPSD, which includes MIXED, CISOLID and NC streams with particle size distribution (PSD) option. All fuels are considered as nonconventional and raw meal is composed of the conventional component.
The proposed model used HCOALGEN and DCOALIGT attribute to calculate enthalpy and density respectively of coal and selected alternative fuels, based on the elemental analysis of fuels. The HCOALGEN model includes a number of different correlations for the following:
- Heat of combustion,
- Heat of formation and,
- Heat capacity.
The DCOALIGT model gives the true density of a nonconventional component on a dry basis by using ultimate and sulfur analyses. The amount of excess air in the kiln section was maintained to be at 10% in accordance to the reference plant specification. The amount of excess oxygen in the calciner was calculated by using a calculator block. To run the model properly, operating parameter for each block and streams were specified. Data was collected from the reference plant as well as from the literature, which includes:
- Mass flow rates of all incoming streams.
- Temperature and pressure of all incoming material streams.
- Heating values and chemical composition of the coal and alternative fuels.
- Composition of raw meal in terms of mass or mole fraction.
- Particle size distribution of all fuel and raw feed.
- Dimension and efficiency of cyclone string.
- Heat flux data for the cooler section.
Different reactor blocks were chosen for the process model in such a way that all equilibrium and non-equilibrium equations can be used to generate a realistic output. The output data regarding the composition of clinker and the stack gas provided vital information about any possible changes that might occur due to the introduction of alternative fuels in the system. Collected plant data was used to validate the model from clinker composition and pollutant emission perspective. Though air emission data was not available for a particular instance, average air emission data were used to check the effectiveness of the model. Table 5 summarizes the validation results containing the input and output data collected from the local cement plant and simulation results. Model validation results indicate that the process model agrees well with the plant data and could be useful to predict the changing conditions with different sets of operating parameters. Some variation is observed in air emission data, which is obvious since available data of CO2 emissions was not the actual plant data (which was not available), but rather a standard limit. In spite of a few variations, the model showed promise on predicting the pollutant emission.
After validation, the model was executed with selected alternative fuels replacing fossil fuel coal up to 30% of the total thermal energy requirement. Simulation results, in terms of pollutant emission and kiln outlet temperature, were presented to identify the possible impact of using alternative fuels. To quantify potential improvement in energy demand, process model was run with less fuel feed while maintaining the kiln temperature at a fixed point and with a fixed production rate.
6. Results and Discussion
An Aspen Plus simulation model for cement manufacturing by using data from a reference plant which consists of a rotary kiln and an inline calciner with a five-stage cyclone string in the preheater tower is presented here. The model is validated for the reference case of only coal as process fuel and with a daily production of 2200 tonnes of clinker. Several unit operation blocks from simulation program were used to model all the segment of the process. The process model was prepared with mass and energy balance for chemical compounds and operation blocks. The fuel requirement was calculated on the basis of energy requirement data from the reference plant. Data related to process input, which included raw meal, combustion air and operating conditions, were supplied from the reference plant data. The proposed process model was run with five selected alternative fuels to investigate potential improvement in emission and energy demand data. Selected alternative fuels were set to substitute up to 30% of total thermal energy and each alternative fuel was used separately to identify their impact.
6.1. Emission Control
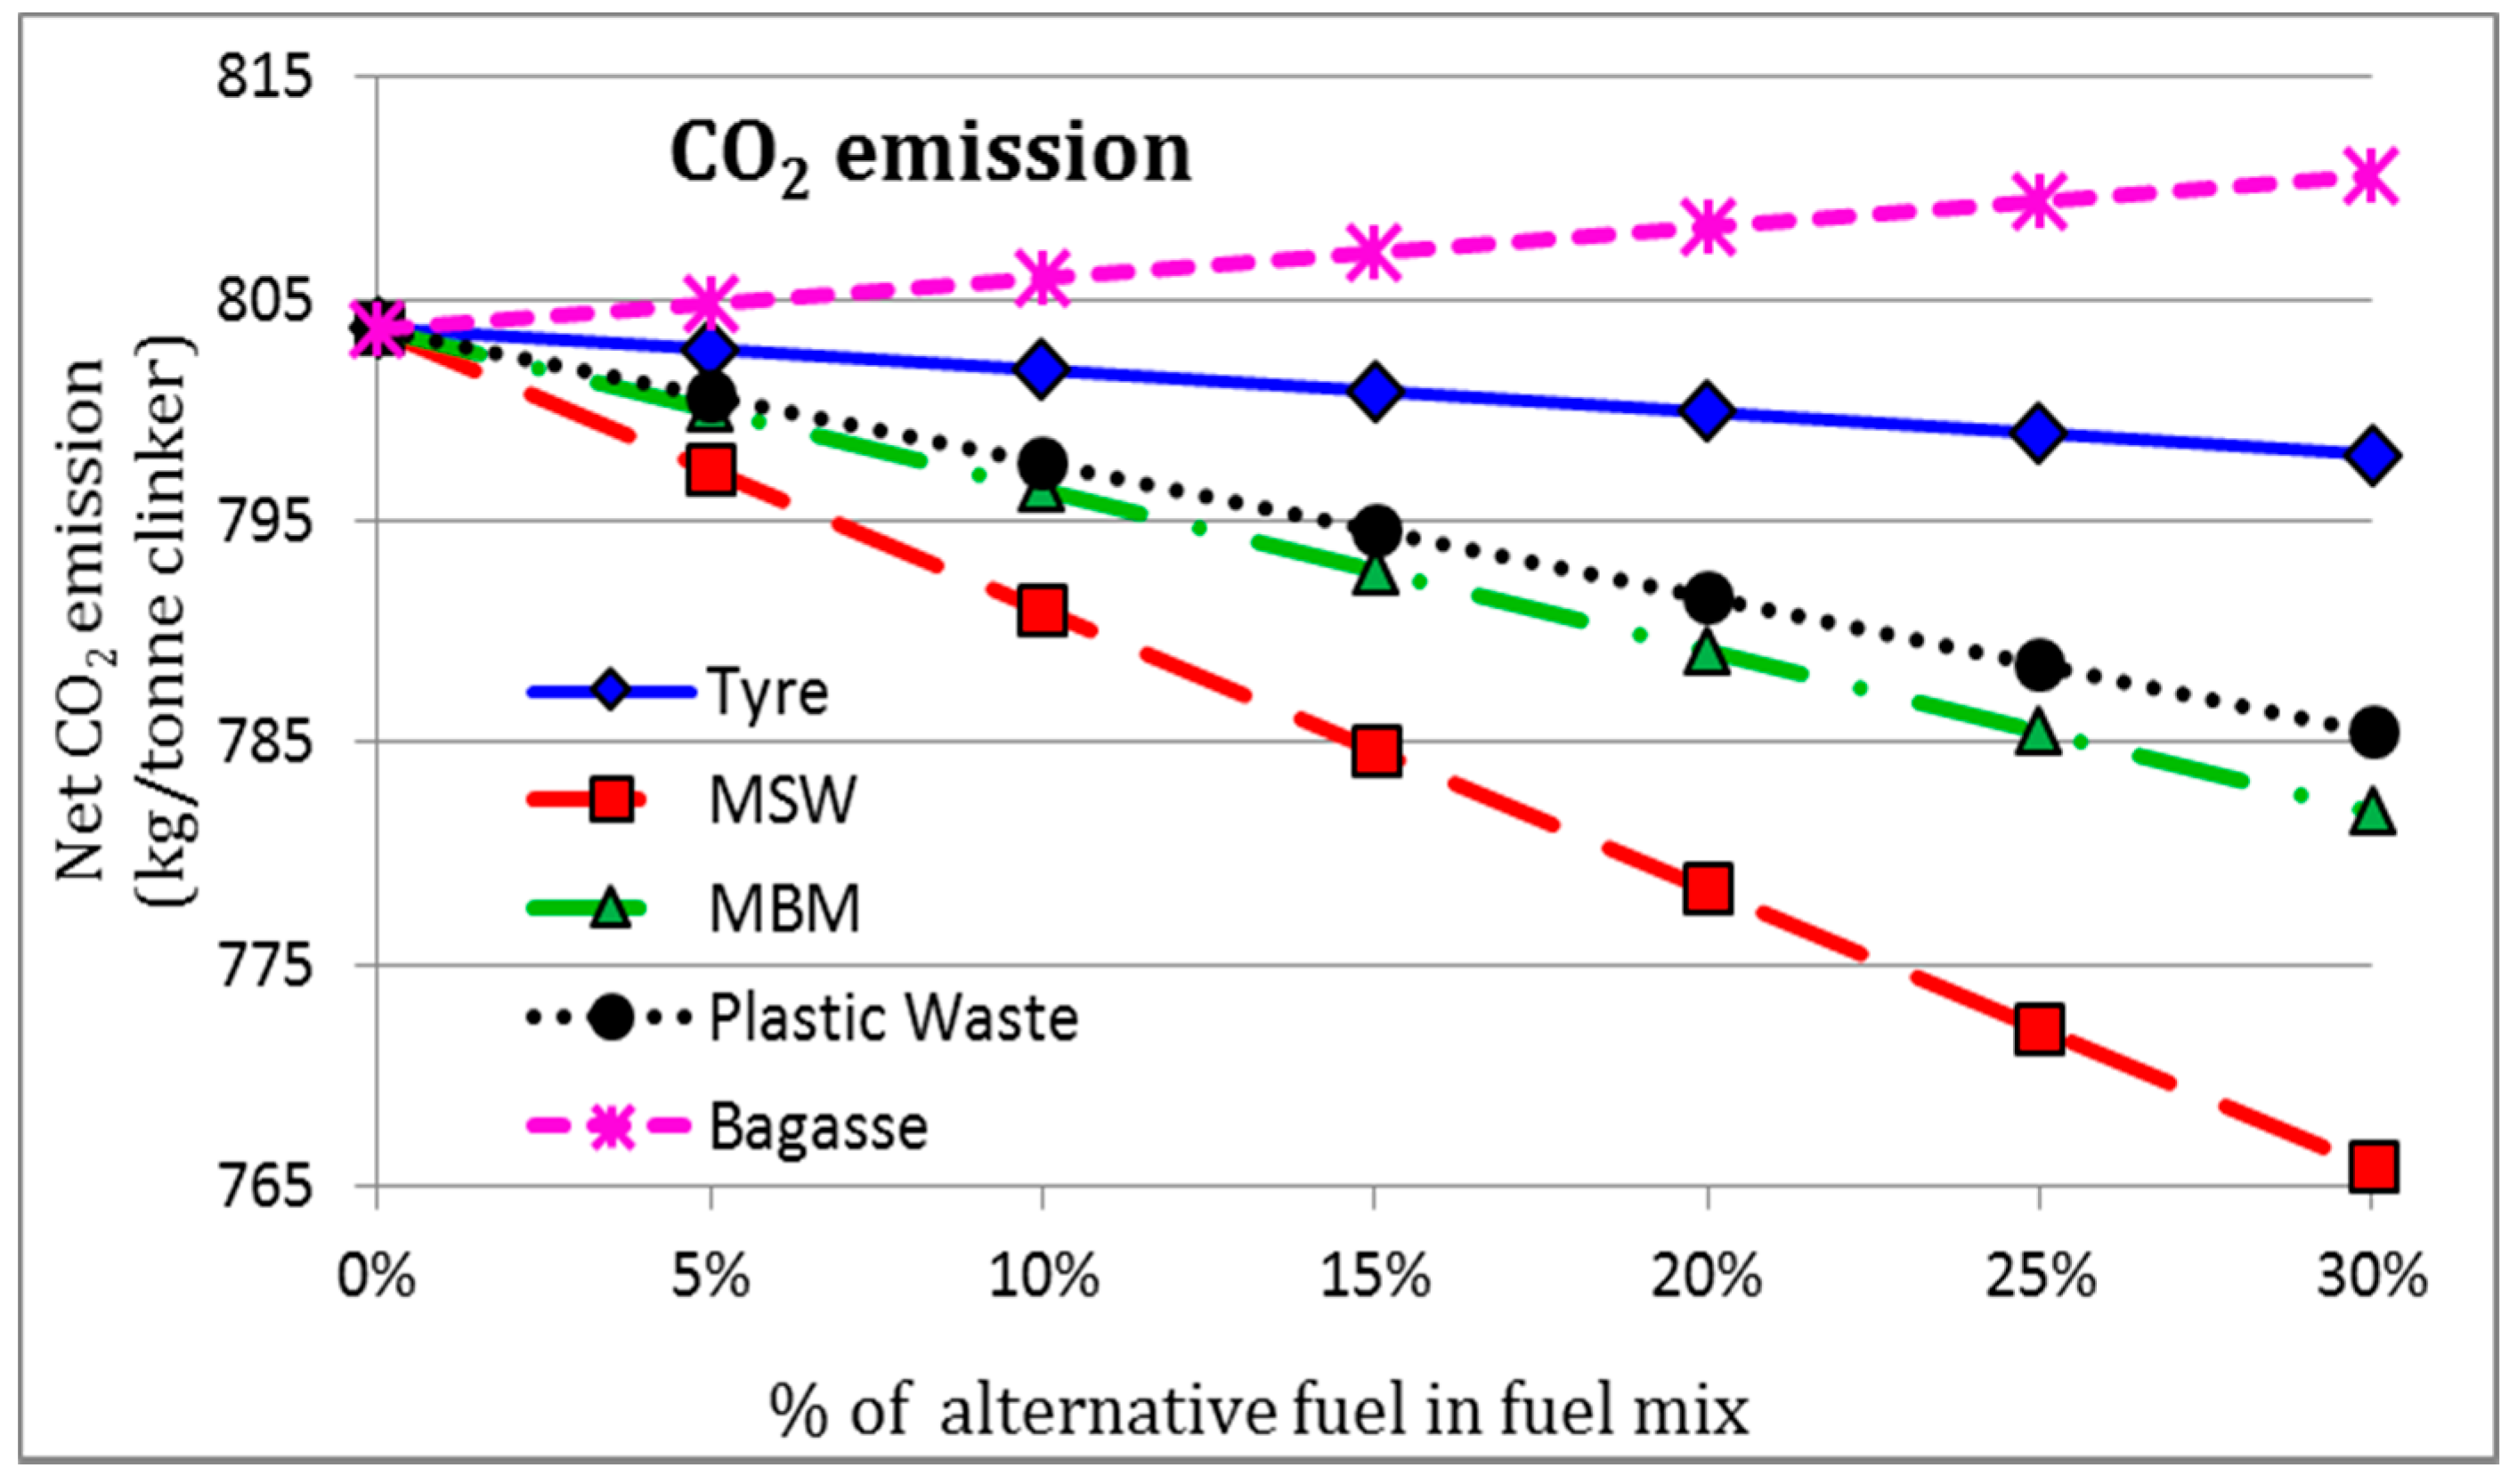
Total CO2 emissions from the pyroprocess depend on energy consumption and nearly 977 kg of CO2 was produced for each tonne of clinker. The simulation result for CO2 is presented in Figure 4, which indicates that apart from bagasse, all other selected alternative potentially reduces CO2 emission up to some extent. MSW was found as the best option to reduce CO2 emission up to 4.7% while substituting 30% of the thermal energy requirement. As the raw meal flow rate remains the same throughout the simulation, the reduction of CO2 occurs from fuel combustion stage. Carbon percentage in the elemental analysis of the alternative fuels and the energy content plays vital role in CO2 emission. For instance, MSW has a lower energy content which implies that a higher amount of fuel is required to keep the production amount near to the reference case. This could result in a higher CO2 emission, but the lower carbon content eventually offsets the CO2 as found in Figure 4. On the other hand, though the carbon content of bagasse is low, it will produce higher CO2 because of its lower energy content as suggested by the simulation results.
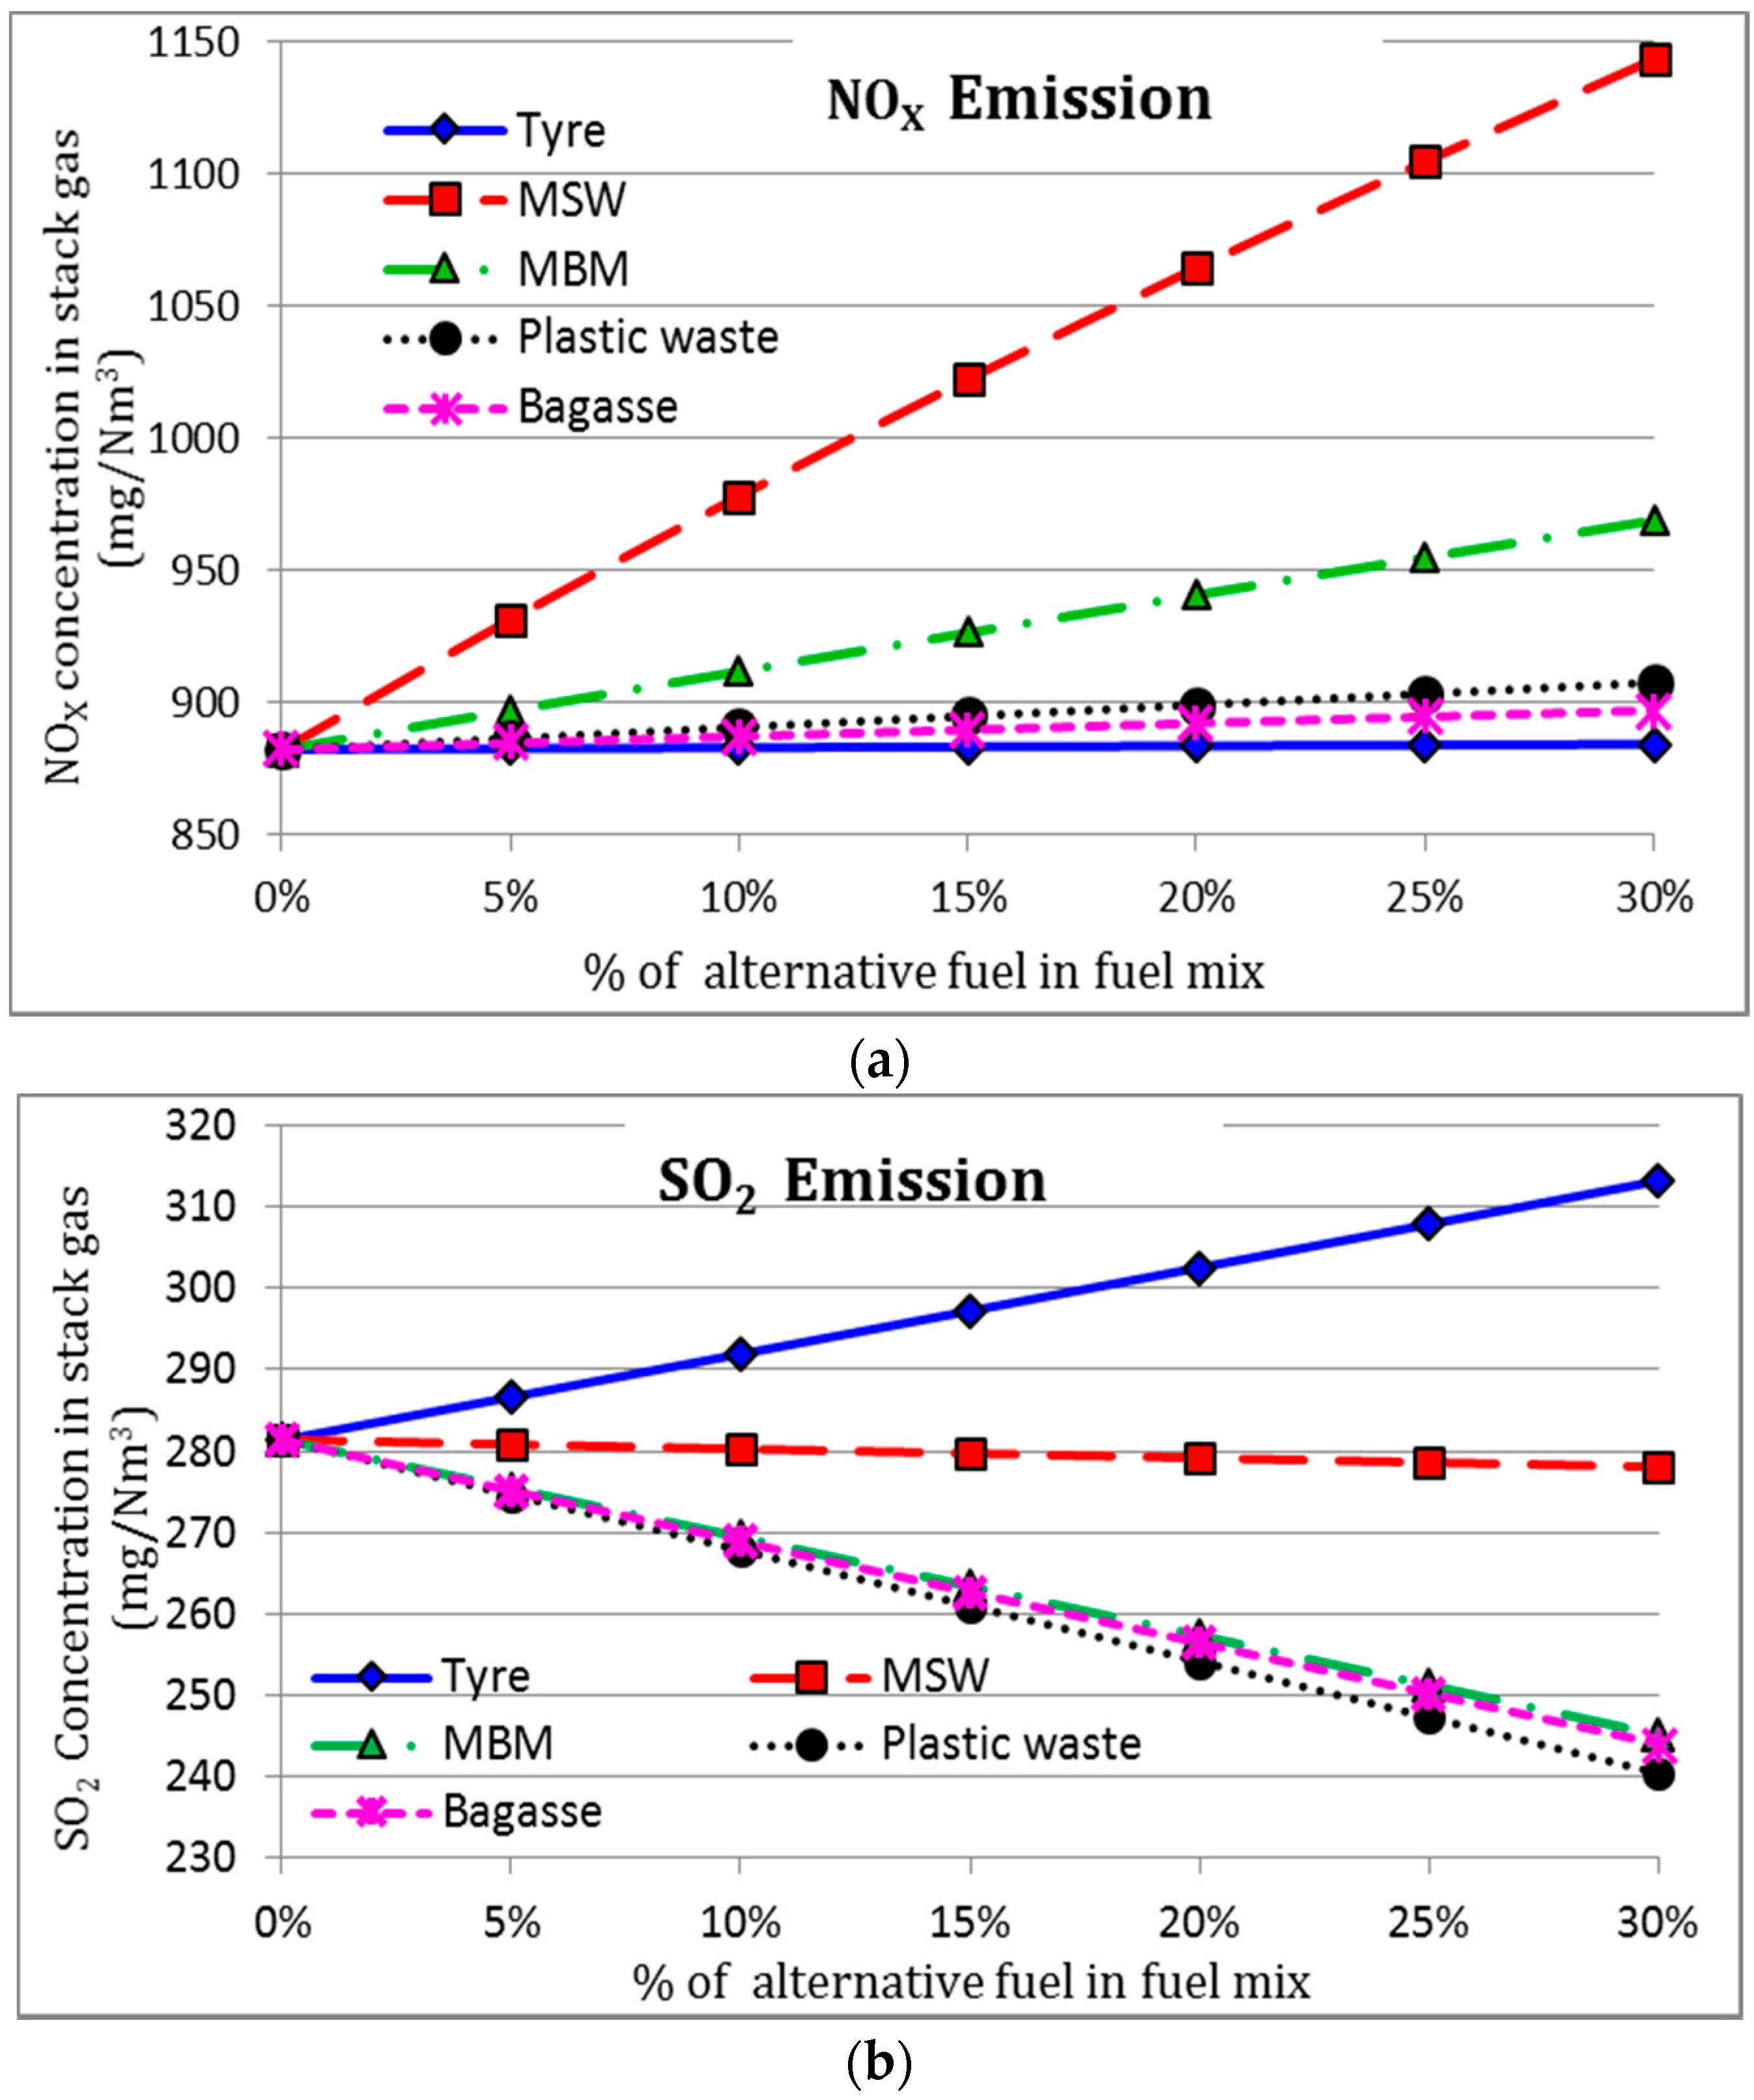
NOX and SO2 emission results are presented in Figure 5a,b respectively. For reference case the NOX and SO2 emission are found to be a little higher from the standard baseline, which is due to the excess air in the burning zone. As per plant specification, the kiln model was operated with 10% excess air and a constant flow of tertiary air in the calciner increase the oxygen level of up to 20%. Though MSW potentially reduces the CO2 emissions, an opposite scenario was observed in the case of NOX emission with 29.5% increase in the stack gas. All the selected alternative fuels were found to increase the NOX emission. SO2 emission remained almost constant for the case of MSW, while tyre produced about 11% more SO2 than reference case which was actually expected due to the sulfur content of tyre. All the other alternative fuels had the potential to reduce the SO2 emission significantly. The excess amount of NOX also depends on the amount of excess air in the burning zone. Since the excess air in the kiln was kept at a constant 10% limit, the amount of oxygen in the calciner had the impact on the NOX emission.
The temperature at the kiln outlet is a good indication of the kiln environment to understand the clinkerization phase inside the kiln. The reduction of temperature inside the kiln could possibly cause an incomplete pyroprocessing, which may lead to a downgraded clinker quality. The outlet temperature of kiln is illustrated in Figure 6a for different feed rate of alternative fuel where 0% alternative fuel indicates the reference case of only coal as fuel.
The simulation results showed that the kiln temperature was markedly low for the case of MSW, which could really change the clinker chemistry. Meanwhile, apart from bagasse all other three alternative fuels are capable of maintaining the kiln temperature up to the reference case. Clinker production is another key feature to measure while using alternative fuel. Decline in the production could cease the economic benefit potentially to be achieved by introducing alternative fuel in the system. Simulation results regarding the clinker production with a fixed raw meal feed is presented in Figure 6b. Simulation results showed that usage of plastic waste and bagasse could reduce the production of up to 0.4%, while MSW could possible increase the same about 0.6%. Since the amounts are negligible, all the alternative fuel could be used up to 30% based on these criteria.
6.2. Quality Control
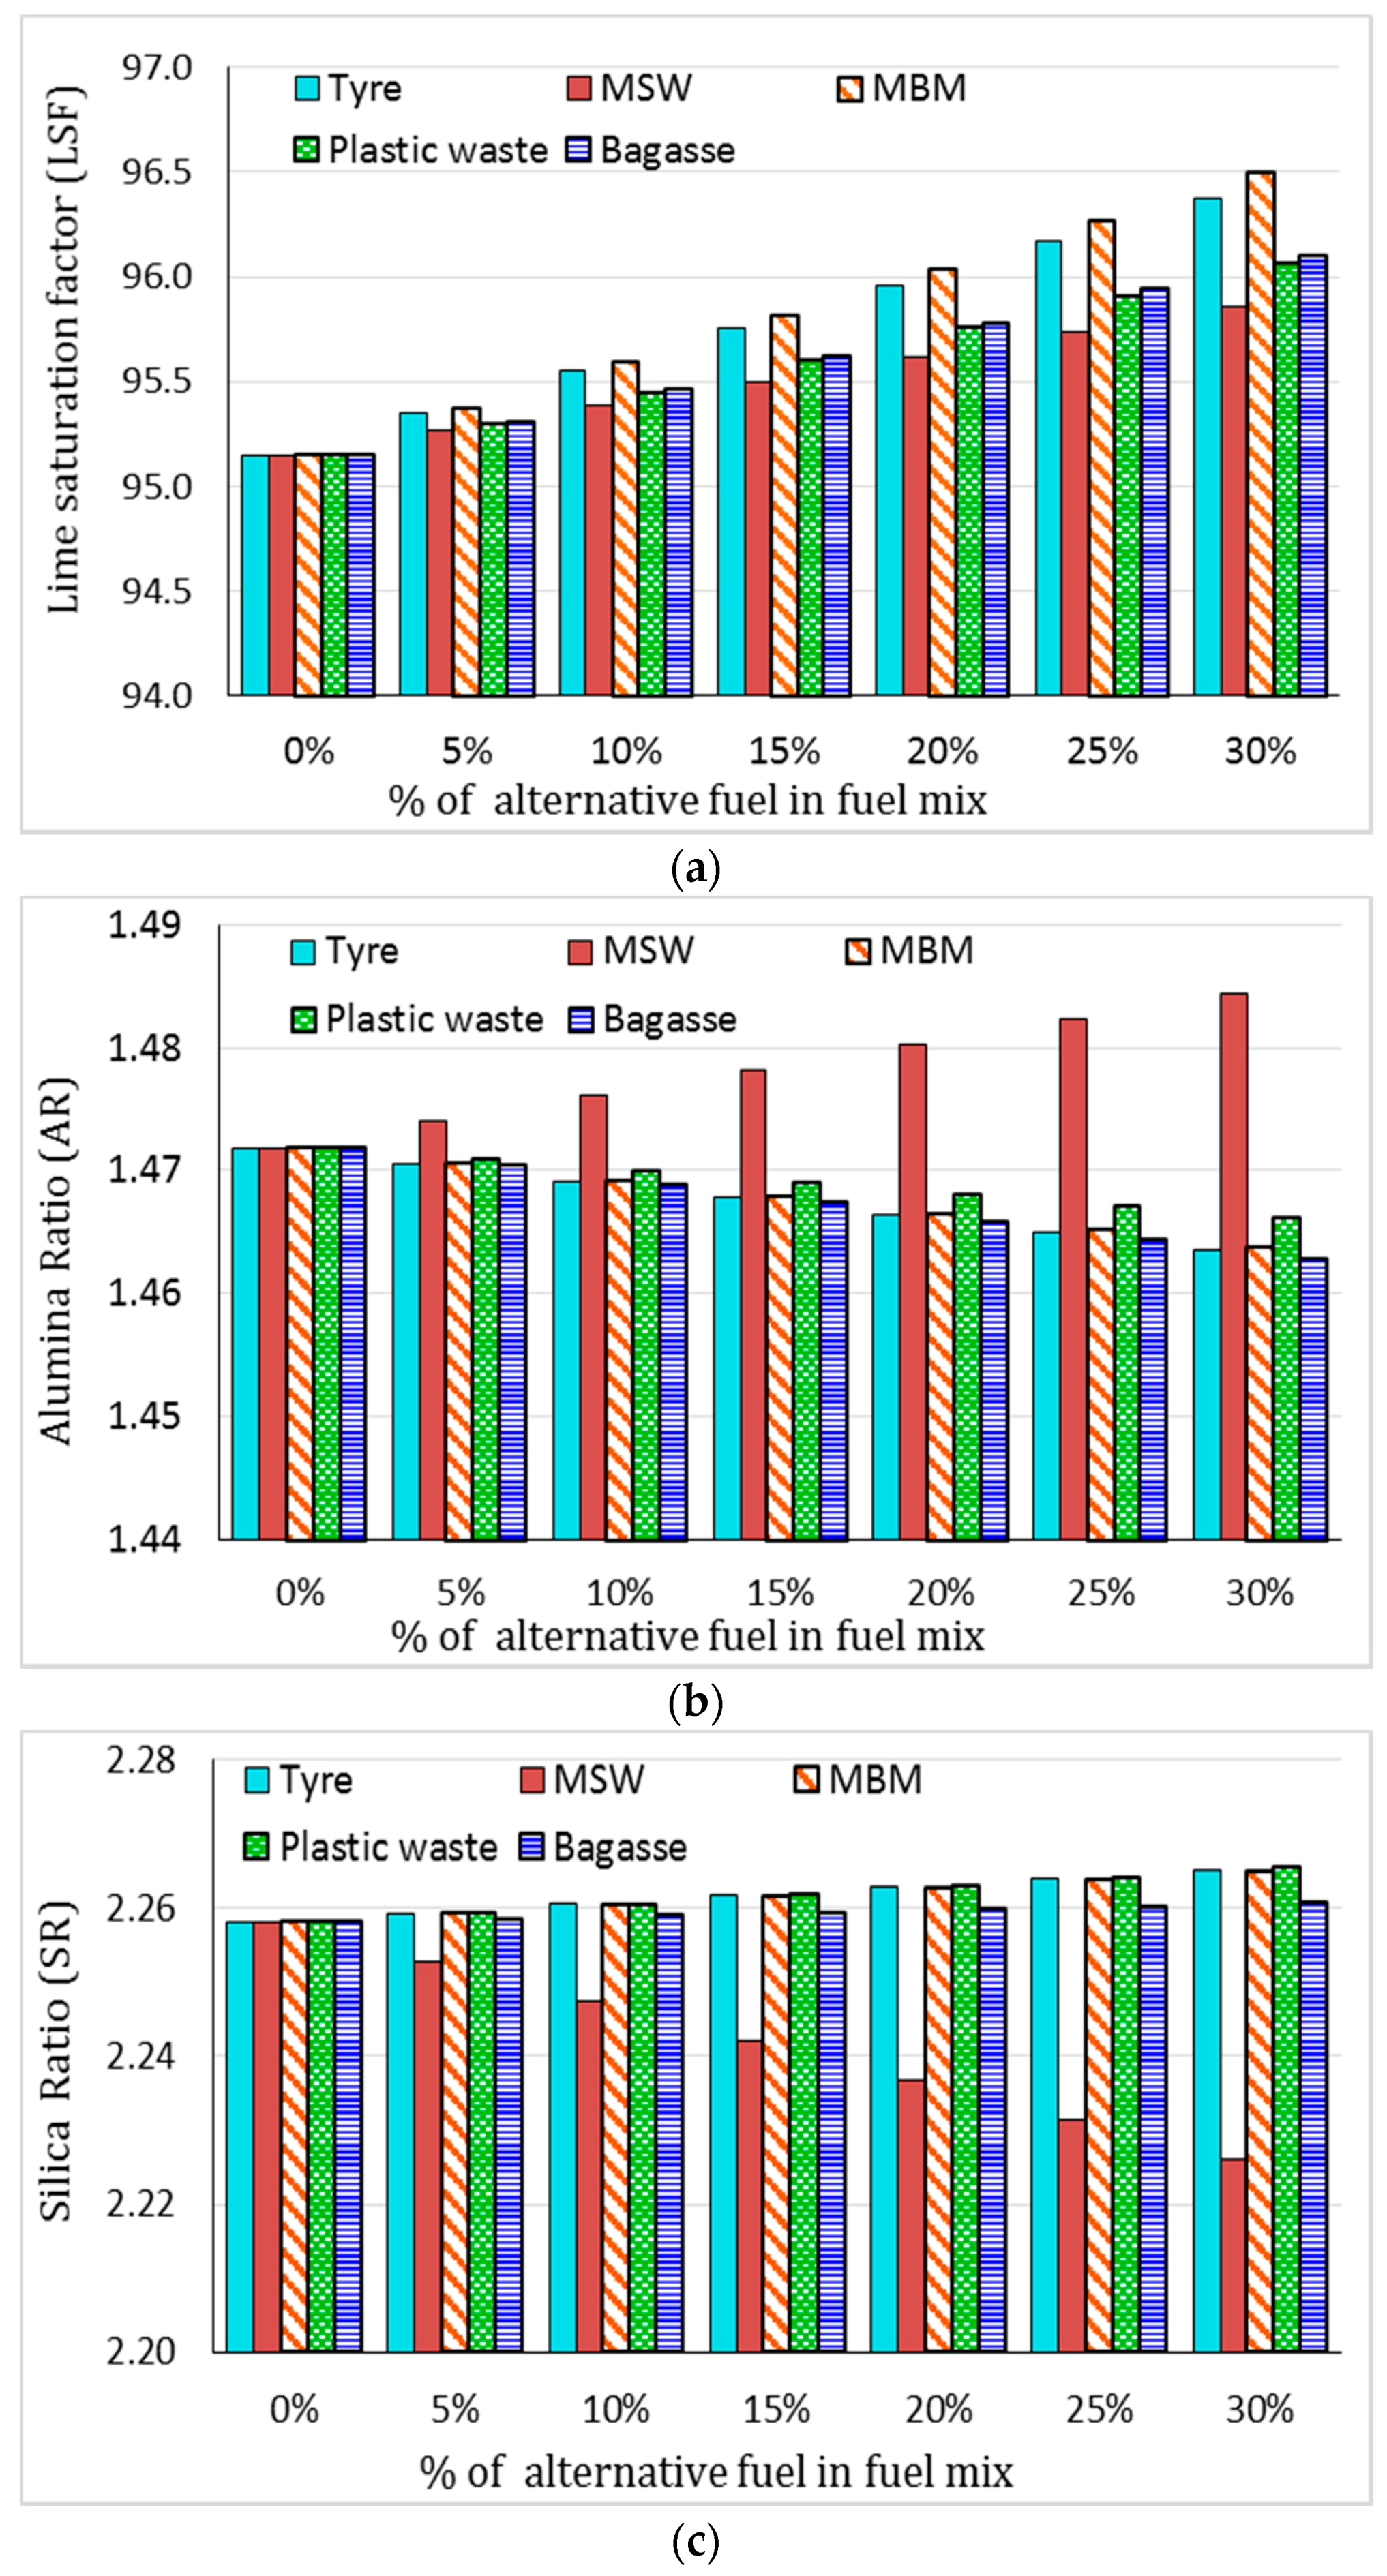
Impact on the clinker quality in terms of the basic ratios is presented in Figure 7. Simulation results suggested that selected alternative fuels had a common trend to increase the amount of LSF. A maximum 1.5% increase of LSF was observed for the case of MBM. It was also apparent that SR and AR could be affected while using MSW as alternative fuel, which could possibly due to the low kiln temperature as pointed out in previous section. Apart from MSW, alternative fuels seem to have no impact on AR and SR. Based on the analysis, it is evident that selected alternative fuels have minimum influence on the clinker quality.
6.3. Energy Performance
The main energy intensive phases of cement production process take place inside the precalciner, kiln and during the production of clinker. A large amount of thermal energy is required to create enough heat for the cement kiln and precalciner. Typical thermal energy consumption of clinker manufacturing with different kiln process is illustrated in Table 6 [35]. The reference plant has the configuration of a five-stage preheater tower with two rotary kilns. Only one of the rotary kilns is used for cement productions, which is connected with the preheater tower through the precalciner.
The current thermal energy consumption of the plant is roughly 3.15 MJ/kg of clinker production, which is little bit higher than the best available practice.
To examine the potential reduction of energy requirement of the system, the maximum percentage of alternative fuel in the fuel mix was determined from the emission analysis. Used tyre could be used up to 18% to keep the SOX emission below 300 mg/Nm3, while bagasse could be used up to 5% to keep the CO2 emission below the baseline limit set by the reference plant. Based on the kiln outlet temperature, the usage percentage of MSW was set at 15% and NOX level need to be controlled by reducing excess air in the calciner for this case. Usage of 20% MBM will keep the NOX emission below 950 mg/Nm3, which could even be lowered by controlling the air in the calciner. Plastic waste could be used up to 12% to avoid the clinker production dropped below 2195 tonnes/day. The model was run with the prescribed substitution rate and by lowering the total feed rate as well as adjusting the airflow in the calciner to investigate potential improvement in energy demand. Throughout this simulation the kiln outlet temperature and daily production were kept same as reference case. Lowering the fuel feed could reduce the clinker production as the combustion ash stays with the clinker to increase the volume. Additional raw meal was required for a consistent production rate.
Simulation results presented in Table 7 indicate that a reduction of pollutant emissions and energy demand in the cement industry can be achieved by using alternative fuels in suitable proportions. The thermal energy requirement in manufacturing process could be reduced a maximum of 6.39% by using 20% MBM in the fuel mix. The energy requirement could be as low as 2.944 MJ/kg of clinker production in this case. In addition, a 4.37% of CO2 emission reduction could be achieved by using MBM in up to 20% in the fuel mix. The only problem of using MBM is the added NOX emission, predominantly because of the excess air in the calciner that raises to about 15% and can be dealt with by controlling the air in the calciner. Plastic waste and bagasse are the other two potential options, which can reduce the energy requirement below the 3 MJ/kg mark along with some extent of decrease in CO2 discharge. Tyre is most widely used alternative fuel in the cement industry but it always poses some risk of extra SOX emission [36]. The simulation results shows that tyre can also reduce the energy requirement near to 3 MJ/kg which is considerable as it need minimum restoration to introduce the tyre feeding facilities. In contrast to other alternative fuels, MSW showed potential to reduce the raw meal; still it was less favorable option in consideration of energy requirements. MBM was found to be the best option among the selected alternative fuels though an additional 0.49% of raw meal required to secure the benefits. The simulation results presented provides guidelines for using the selected alternative fuels and further experimental study is recommended to justify the results.
7. Conclusions
This paper developed a process model for cement manufacturing process using Aspen Plus software to study the effect of alternative fuels on its energy performance and pollutant emissions. The five alternative fuels used were tyre, municipal solid waste (MSW), meat and bone meal (MBM), plastic waste and sugarcane bagasse. The model was validated with the real data from reference cement plant. The validated model was run for the selected alternative fuels feed in the system to identify possible improvement in air emission data. In the reference condition, selected alternative fuels are capable of reducing CO2 emission with an exception for bagasse. In a changed condition, potentially 6.39% of a reduction in thermal energy requirement could be achieved by using MBM, which was also identified as the best option among the alternative fuels. Plastic waste showed great prospect as an alternative fuel in terms of energy demand, though it was not commonly used in cement industry. CO2 reduction could be achieved by using MSW in the reference condition, but that might reduce the kiln temperature and affect the clinker composition. It was observed the alternative fuels had a minimum influence on the clinker quality except in the case of MSW. Tyre, the most widely used alternative fuel, was found to be a better option as it is capable on reducing energy requirement and CO2 emission on the top of its worldwide availability. Before introducing any alternative fuel in the process, simulation results need to be validated with experimental results. The process model presented in this study could be useful tool for researchers and stakeholders to determine the impact of wide range of alternative fuels in cement production.
Author Contributions
The contributions of each author are as follows: Azad Rahman did the literature review, developed the simulation model, analyzed the simulation results and drafted the manuscript. Mohammad G. Rasul contributed to the collection of the plant data and the development of the process model. He also revised the paper. M.M.K. Khan contributed on developing the process model with ideas and helped to draft the manuscript. S.C. Sharma helped to revise the manuscript.
Conflicts of Interest
The authors declare no conflicts of interest.
References
- Van Oss, H.G.; Padovani, A.C. Cement manufacture and the environment, Part I: Chemistry & Technology. J. Ind. Ecol. 2002, 6, 89–105. [Google Scholar]
- Van Oss, H.G.; Padovani, A.C. Cement manufacture and the environment, Part II: Environmental challenges and opportunities. J. Ind. Ecol. 2003, 7, 93–126. [Google Scholar]
- Rodrigues, F.A.; Joekes, I. Cement industry: Sustainability, challenges and perspectives. Environ. Chem. Lett. 2011, 9, 151–166. [Google Scholar] [CrossRef]
- Hills, T.; Leeson, D.; Florin, N.; Fennell, P. Carbon capture in the cement industry: Technologies, progress, and retrofitting. Environ. Sci. Technol. 2016, 50, 368–377. [Google Scholar] [CrossRef] [PubMed]
- Carrasco-Maldonado, F.; Spörl, R.; Fleiger, K.; Hoenig, V.; Maier, J.; Scheffknecht, G. Oxy-fuel combustion technology for cement production—State of the art research and technology development. Int. J. Greenh. Gas Control 2016, 45, 189–199. [Google Scholar] [CrossRef]
- Castellani, B.; Gambelli, A.M.; Morini, E.; Nastasi, B.; Presciutti, A.; Filipponi, M.; Nicolini, A.; Rossi, F. Experimental investigation on CO2 methanation process for solar energy storage compared to CO2-based methanol synthesis. Energies 2017, 10, 855. [Google Scholar] [CrossRef]
- Hoffart, M. Tyre Derived Fuel. In Proceedings of the WasteMINZ Conference, Auckland, New Zealand, 13–16 October 2010. [Google Scholar]
- Kaantee, U.; Zevenhoven, R.; Backman, R.; Hupa, M. Cement manufacturing using alternative fuels and the advantages of process modelling. Fuel Process. Technol. 2004, 85, 293–301. [Google Scholar] [CrossRef]
- Lechtenberg, D. Spent cell linings from the aluminium smelting process as an alternative fuel and raw material for cement production. Carbon 2009, 15, 30. [Google Scholar]
- Mikulcic, H.; Klemes, J.J.; Vujanovic, M.; Urbaniec, K.; Duic, N. Reducing greenhouse gasses emissions by fostering the deployment of alternative raw materials and energy sources in the cleaner cement manufacturing process. J. Clean. Prod. 2016, 136, 119–132. [Google Scholar] [CrossRef]
- Horsley, C.; Emmert, M.H.; Sakulich, A. Influence of alternative fuels on trace element content of ordinary Portland cement. Fuel 2016, 184, 481–489. [Google Scholar] [CrossRef]
- Richards, G.; Agranovski, I.E. Dioxin-like pcb emissions from cement kilns during the use of alternative fuels. J. Hazard. Mater. 2017, 323, 698–709. [Google Scholar] [CrossRef] [PubMed]
- Georgiopoulou, M.; Lyberatos, G. Life cycle assessment of the use of alternative fuels in cement kilns: A case study. J. Environ. Manag. 2017, in press. [Google Scholar] [CrossRef] [PubMed]
- Ariyaratne, W.K.H.; Malagalage, A.; Melaaen, M.C.; Tokheim, L. CFD modelling of meat and bone meal combustion in a cement rotary kiln—Investigation of fuel particle size and fuel feeding position impacts. Chem. Eng. Sci. 2015, 123, 596–608. [Google Scholar] [CrossRef]
- Mastorakos, E.; Massias, A.; Tsakiroglou, C.D. CFD predictions for cement kilns including flame modelling, heat transfer and clinker chemistry. Appl. Math. Model. 1999, 23, 55–76. [Google Scholar] [CrossRef]
- Mujumdar, K.S.; Ranade, V.V. Simulation of rotary cement kilns using a one-dimensional model. Chem. Eng. Res. Des. 2006, 84, 165–177. [Google Scholar] [CrossRef]
- Mujumdar, K.S.; Ganesh, K.V.; Kulkarni, S.B.; Ranade, V.V. Rotary cement kiln simulator (RoCKS): Integrated modelling of pre-heater, calciner, kiln and clinker cooler. Chem. Eng. Sci. 2007, 62, 2590–2607. [Google Scholar] [CrossRef]
- Spang, H.A. A dynamic model of a cement kiln. Automatica 1972, 8, 309–323. [Google Scholar] [CrossRef]
- Boateng, A.A.; Barr, P.V. A thermal model for the rotary kiln including heat transfer within the bed. Int. J. Heat Mass Transf. 1996, 39, 2131–2147. [Google Scholar] [CrossRef]
- Martins, M.A.; Oliveira, L.S.; Franca, A.S. Modeling and simulation of Limestone calcinations in rotary kilns. ZKG Int. 2002, 55, 76–87. [Google Scholar]
- Paul, M.; Mujumdar, K.S.; Ranade, V.V. Modeling of rotary cement kilns. In Proceedings of the International Symposium & 55th Annual Session of IIChE (Chemcon), Hyderabad, India, 19–22 December 2002. [Google Scholar]
- Giddings, D.; Pickering, S.J.; Simmons, K.; Eastwick, C.N. Combustion and aerodynamic behaviour of car tyre chips in a cement works precalciner. J. Inst. Energy 2002, 75, 91–99. [Google Scholar]
- Marin, O.; Charon, O.; Dugue, J.; Dukhan, S.; Zhou, W. Simulating the impact of oxygen enrichment in a cement rotary kiln using advanced computational methods. Combust. Sci. Technol. 2001, 164, 193–207. [Google Scholar] [CrossRef]
- Zhang, Y.; Cao, S.; Shao, S.; Chen, Y.; Liu, S.; Zhang, S. Aspen Plus-based simulation of a cement calciner and optimization analysis of air pollutants emission. Clean Technol. Environ. Policy 2011, 13, 459–468. [Google Scholar] [CrossRef]
- Rahman, A.; Rasul, M.G.; Khan, M.M.K.; Sharma, S. Cement calciner model development for optimizing the usage of alternative fuels. In Proceedings of the 12th International Conference on Sustainable Energy Technologies (SET 2013), Hong Kong, China, 26–29 August 2013; pp. 1784–1794. [Google Scholar]
- Rahman, A.; Rasul, M.G.; Khan, M.M.K.; Sharma, S. Aspen Plus based simulation for energy recovery from waste to utilize in cement plant preheater tower. Energy Procedia 2014, 61, 922–927. [Google Scholar] [CrossRef]
- Hokfors, B. Phase Chemistry in Process Models for Cement Clinker and Lime Production. Ph.D. Thesis, Thermal Energy Conversion Laboratory, Department of Applied Physics and Electronics, UMEA University, Umeå, Sweden, 2014. [Google Scholar]
- European Commission (EC). Reference Document on the Best Available Techniques in the Cement and Lime Manufacturing Industries; BAT Reference Document (BREF); European IPPC Bureau: Seville, Spain, 2001. [Google Scholar]
- Cembureau, European Cement Association. Best Available Techniques for the Cement Industry. 1999. Chapter 3. pp. 15–43. Available online: http://cembureau.be/ (accessed on 10 May 2013).
- Murray, A.; Price, L. Use of Alternative Fuels in Cement Manufacture: Analysis of Fuel Characteristics and Feasibility for Use in the Chinese Cement Sector; Ernest Orlando Lawrence Berkeley National Laboratory: Berkeley, CA, USA, 2008.
- CIF Fast Facts 2015, Australian Cement Industry Statistics 2015. Available online: http://www.cement.org.au/Portals/0/Documents/Fast%20Facts/CIF%20Fast%20Facts%202015%20(low%20res).pdf (accessed on 22 July 2016).
- Tokheim, L.A. The Impact of Staged Combustion on the Operation of a Precalciner Cement Kiln. Ph.D. Thesis, Telemark College, Porsgrunn, Norway, 1999. [Google Scholar]
- Hewlett, P.C. Lea’s Chemistry of Cement and Concrete, 4th ed.; Butterworth-Heinemann Ltd.: Oxford, UK, 2003. [Google Scholar]
- Aldieb, M.A.; Ibrahim, H.G. Variation of feed chemical composition and its effect on clinker formation- simulation process. In Proceedings of the World Congress on Engineering and Computer Science, San Francisco, CA, USA, 20–22 October 2010; Volume 2. [Google Scholar]
- Taylor, H.F.W. Cement Chemistry, 2nd ed.; Thomas Telford Publishing: London, UK, 2004. [Google Scholar]
- Rahman, A.; Rasul, M.G.; Khan, M.M.K.; Sharma, S. Recent development on the uses of alternative fuels in cement manufacturing process. Fuel 2015, 145, 84–99. [Google Scholar] [CrossRef]
- Karell, M.A.; Blumenthal, M.H. Air regulatory impacts of the use of tire-derived fuel. Environ. Prog. 2001, 20, 80–86. [Google Scholar] [CrossRef]
- Trezza, M.A.; Scian, A.N. Scrap tire ashes in Portland cement production. Mater. Res. 2009, 12, 489–494. [Google Scholar] [CrossRef]
- Garg, A.; Smith, R.; Hill, D.; Longhurst, P.J.; Pollard, S.J.T.; Simms, N.J. An integrated appraisal of energy recovery options in the United Kingdom using solid recovered fuel derived from municipal solid waste. Waste Manag. 2009, 29, 2289–2297. [Google Scholar] [CrossRef] [PubMed]
- Kikuchi, R. Recycling of municipal solid waste for cement production: Pilot-scale test for transforming incineration ash of solid waste into cement clinker. Res. Conserv. Recycl. 2001, 31, 137–147. [Google Scholar] [CrossRef]
- Fryda, L.; Panopoulos, K.; Vourliotis, P.; Kakaras, E.; Pavlidou, E. Meat and bone meal as secondary fuel in fluidized bed combustion. Proc. Combust. Inst. 2007, 31, 2829–2837. [Google Scholar] [CrossRef]
- Kim, J.; Mun, T.; Kim, J.; Kim, J. Air gasification of mixed plastic wastes using a two-stage gasifier for the production of producer gas with low tar and a high caloric value. Fuel 2011, 90, 2266–2272. [Google Scholar] [CrossRef]
- Xiao, R.; Jin, B.; Zhou, H.; Zhong, Z.; Zhang, M. Air gasification of polypropylene plastic waste in fluidized bed gasifier. Energy Convers. Manag. 2007, 48, 778–786. [Google Scholar] [CrossRef]
- Jenkins, B.M.; Baxter, L.L.; Miles, T.R., Jr.; Miles, T.R. Combustion properties of biomass. Fuel Process. Technol. 1998, 54, 17–46. [Google Scholar] [CrossRef]
- GERIAP. Company Toolkit for Energy Efficiency, Industry Sectors—Cement. 2005. Available online: http://www.energyefficiencyasia.org/docs/IndustrySectorsCement_draftMay05.pdf (accessed on 10 May 2014).
Figure 1.
Cement manufacturing process [8].
Figure 1.
Cement manufacturing process [8].

Figure 2.
List of fuels (conventional & alternatives) in cement industry.

Figure 3.
Aspen Plus process model flow sheet for cement manufacturing.

Figure 4.
Net CO2 emission (kg/tonne clinker).

Figure 5.
(a) NOX concentration and (b) SO2 concentration in stack gas (mg/Nm3).

Figure 6.
(a) Kiln outlet temperature (°C); (b) clinker production (tonne/day).
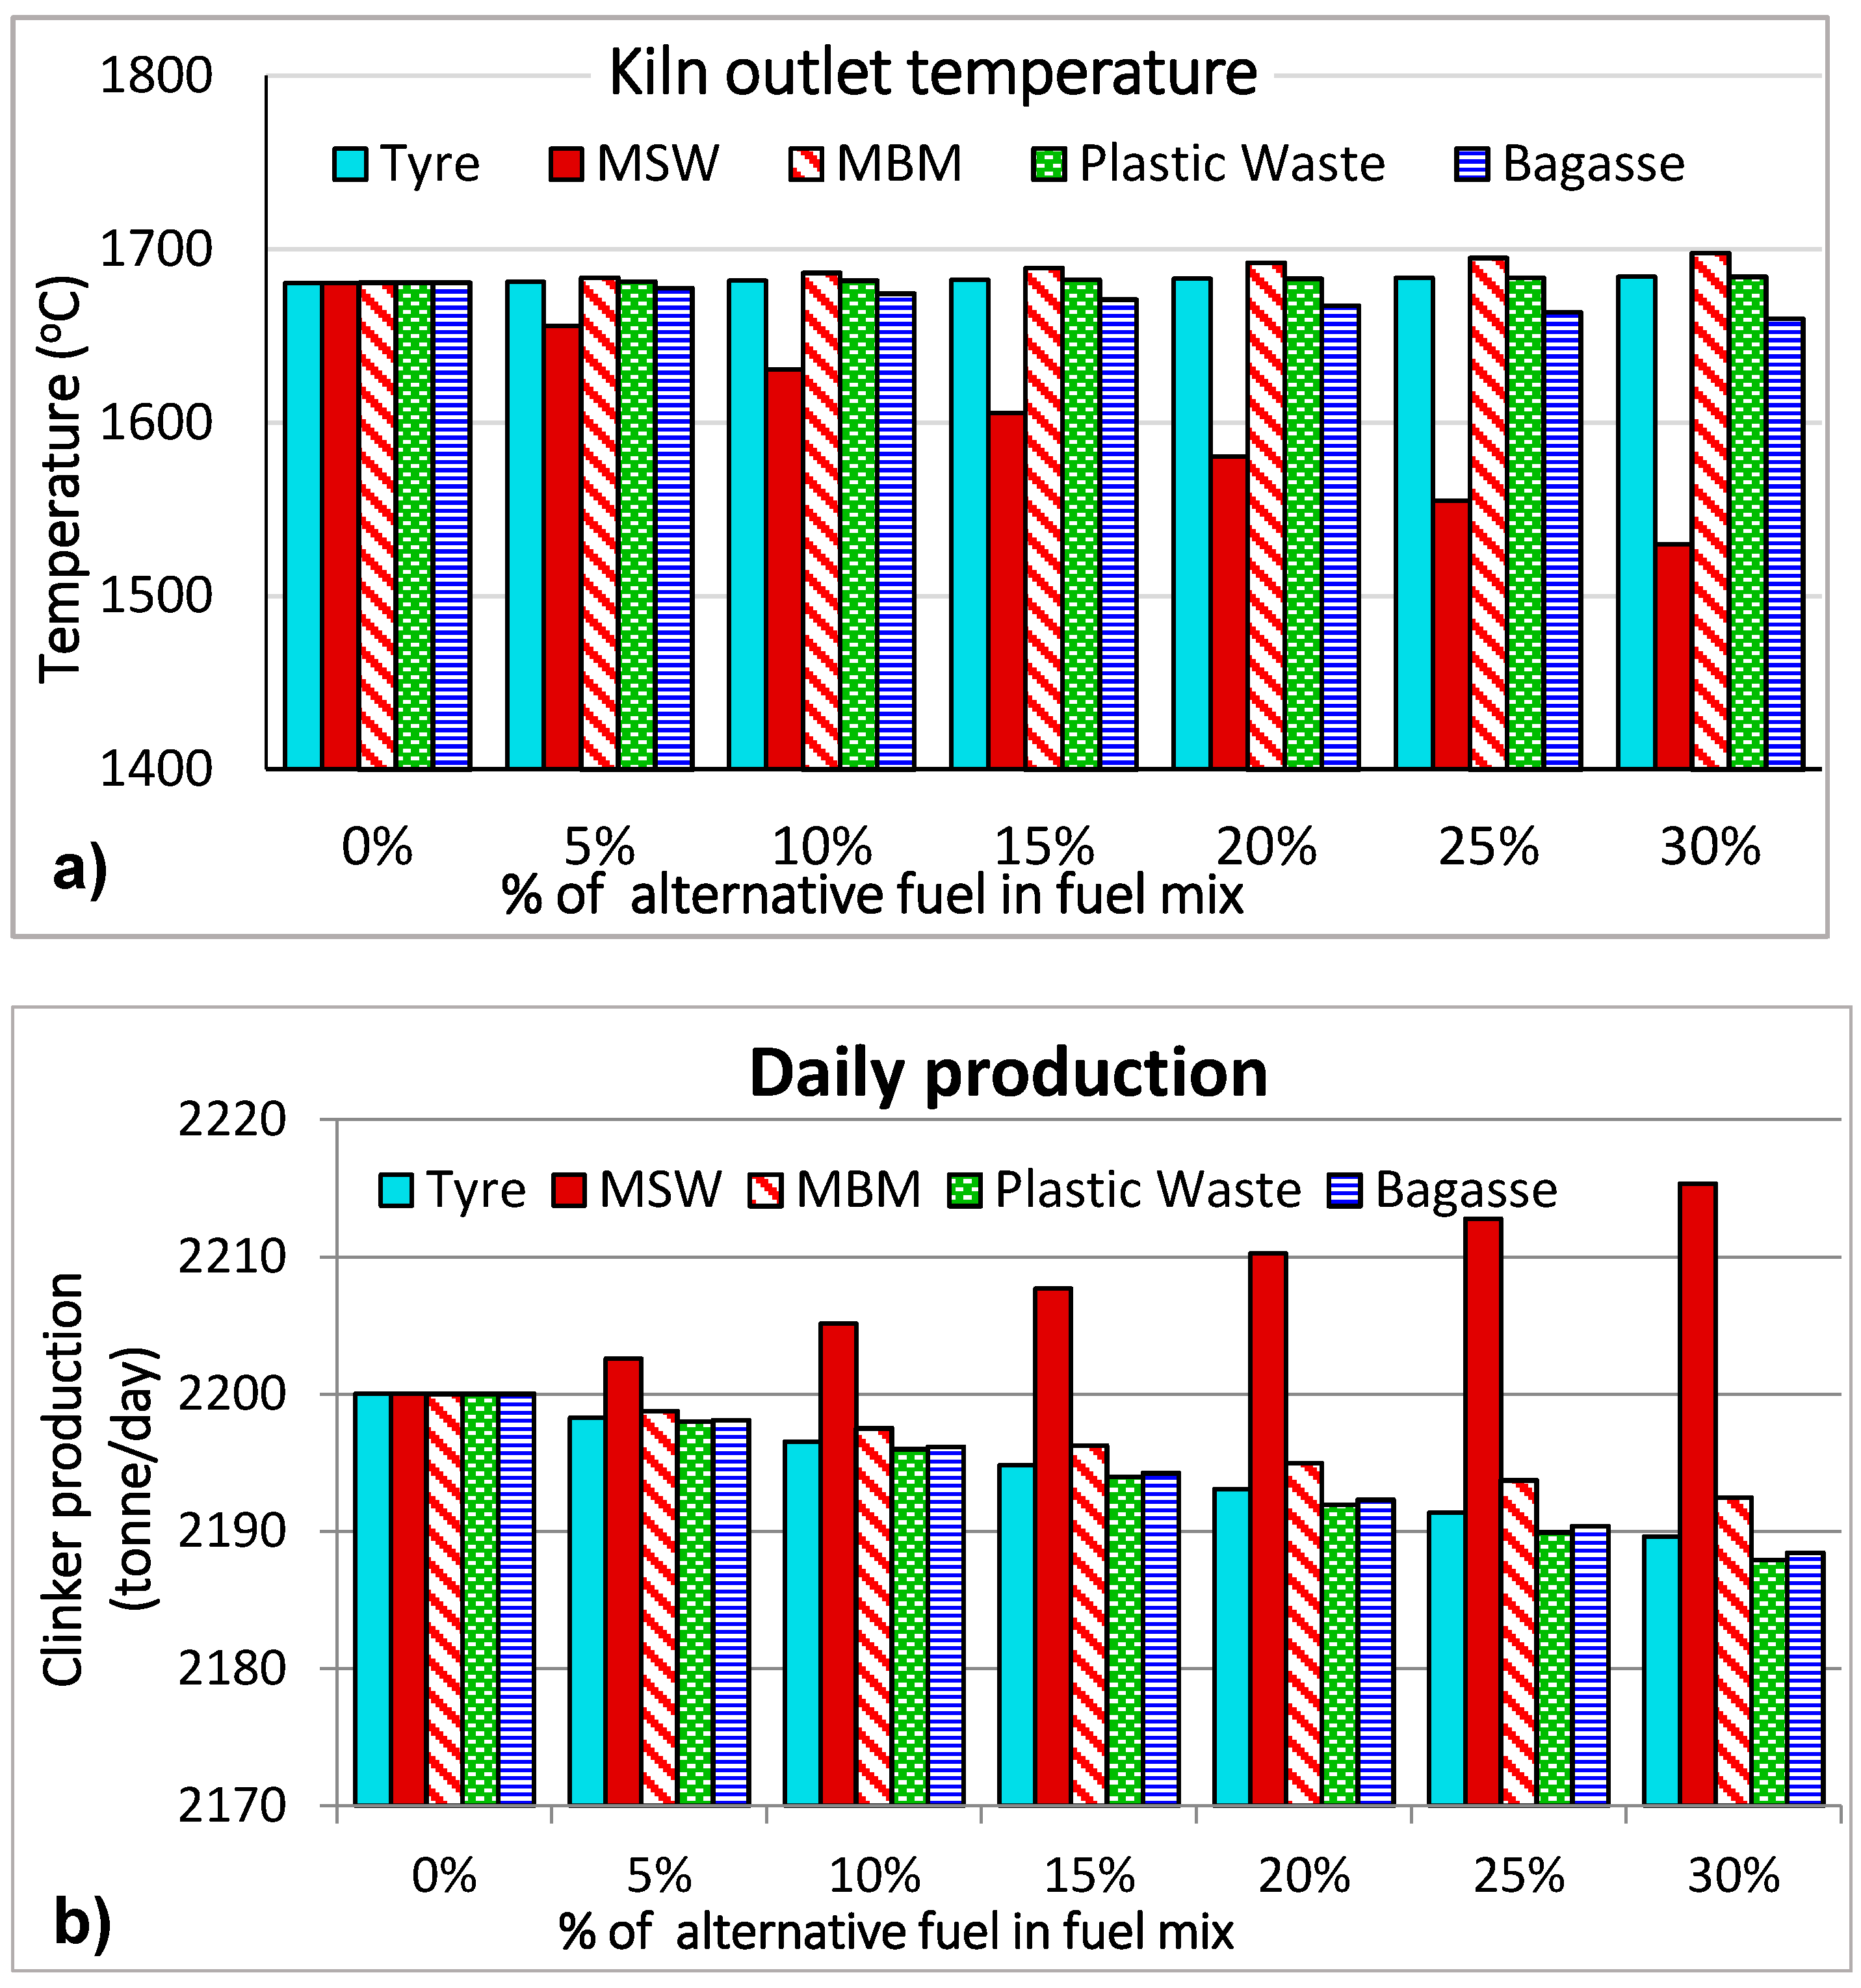
Figure 7.
Impact on clinker quality (a) LSF (b) AR and (c) SR.


Table 1.
Reactions and reaction enthalpies [32].
Table 1.
Reactions and reaction enthalpies [32].
| Reaction | Reaction Equation | Standard Reaction Enthalpy [kJ/kg] |
|---|---|---|
| I. Formation of oxides and decomposing reactions | ||
| Evaporation of water | H2O(l) → H2O(g) | 2453 |
| Decomposition of kaolinite | Al2O3·2SiO2·2H2O → Al2O3 + 2SiO2 + 2H2O | 780 |
| Oxidation of carbon | C + O2 → CO2 | −33,913 |
| Dissociation of MgCO3 | MgCO3 → MgO + CO2 | 1395 |
| Dissociation of CaCO3 | CaCO3 → CaO + CO2 | 1780 |
| II. Formation of intermediates | ||
| Formation of CA | CaO + Al2O3 → CaO·Al2O3 | −100 |
| Formation of C2F | 2CaO + Fe2O3 → 2CaO·Fe2O3 | −114 |
| Formation of β-C2S | 2CaO + SiO2 → 2CaO·SiO2 | −732 |
| III. Sintering reactions | ||
| Formation of C4AF | CA + C2F + CaO → C4AF | 25 |
| Formation of C3A | CA + 2CaO → C3A | 25 |
| Formation of C3S | β-C2S + CaO → C3S | 59 |
Table 2.
Description of reactions occur in various stages [33].
Table 2.
Description of reactions occur in various stages [33].
| Temperature | Reaction | Stage of Process |
|---|---|---|
| 100 °C | Evaporation of free water | Preheater |
| 500 °C and above | Evolution of combined water from clay | Preheater |
| 900 °C and above | Crystallization of amorphous dehydration products of clay | Precalciner, Early kiln |
| 900 °C and above | Evolution of calcium carbonate to form carbon dioxide | Precalciner, Early kiln |
| 900 °C–1200 °C | Reaction between lime and clay | Early to mid-kiln |
| 1250 °C–1280 °C | Commencement of liquid formation | Mid to late Kiln |
| Above 1280 °C | Further formation of liquid and completion of formation of cement compounds | Mid to late kiln |
| Coal (Plant Data) | Tyre | MSW | MBM | Plastic Waste | Bagasse | |
|---|---|---|---|---|---|---|
| Proximate analysis on dry basis (wt %) | ||||||
| Moisture | 4.2 | 0.62 | 31.2 | 1.35 | 0.6 | 0 |
| Ash | 19.1 | 4.81 | 35.17 | 10.54 | 0.4 | 11.95 |
| Volatile matter | 36.6 | 67.06 | 64.83 | 80.74 | 94.77 | 85.61 |
| Fixed carbon | 53.0 | 28.13 | 0 | 8.72 | 4.83 | 2.44 |
| Elemental analysis on dry basis (wt %) | ||||||
| C | 69.43 | 84.39 | 34.88 | 55.7 | 77.02 | 48.64 |
| H | 3.83 | 7.13 | 4.65 | 8.03 | 12.14 | 5.87 |
| N | 1.5 | 0.24 | 1.02 | 7.15 | 0 | 0.16 |
| S | 0.36 | 0.01 | 0.15 | 0 | 1.09 | 0.03 |
| Cl | 0.2 | 1.24 | 1.02 | 0.05 | 0 | 0.04 |
| O | 5.58 | 2.18 | 23.11 | 18.53 | 4.92 | 42.82 |
| LHV (MJ/kg) | 27.4 | 37.8 | 15.4 | 30.705 | 41.5 | 18.99 |
| Ash analysis (wt %) | ||||||
| SiO2 | 46.09 | 14.1 | 15.1 | 5.97 | 61.35 | 46.61 |
| Al2O3 | 20.64 | 2.7 | 15.6 | 1.81 | 25.13 | 17.69 |
| Fe2O3 | 7.84 | 1.1 | 4.7 | 0.59 | 5.44 | 14.14 |
| CaO | 16.19 | 47.0 | 36.6 | 45.6 | 4.72 | 4.47 |
| MgO | 1.16 | 0.7 | 2 | 1.43 | 0.94 | 3.33 |
| SO3 | 2.45 | 1.2 | 1.7 | - | 0.03 | 2.08 |
| TiO2 | 1.3 | <0.01 | - | 1.1 | - | 2.63 |
| P2O5 | 2.45 | <0.01 | 1.5 | 37.3 | - | 2.72 |
| Na2O | 0.31 | <0.01 | 1.8 | 2.07 | 0.42 | 0.79 |
| K2O | 1.57 | <0.01 | 1.3 | 1.86 | 1.52 | 0.15 |
| Cl2 | - | - | 9.7 | 0.11 | - | - |
| ZnO | - | 33.1 | - | - | - | - |
Table 4.
Material stream class.
| Name | Function |
|---|---|
| Mixed | Used to handle conventional components that reach vapor–liquid–solid phase equilibrium |
| CISOLID (Conventional, Inert, Solid) | Used to handle conventional components that appear in the solid phase but do not participate in phase equilibrium |
| NC (Nonconventional) | Used to handle nonconventional components |
Table 5.
Model validation.
| Input Data (From Plant) | ||||||||||||
|---|---|---|---|---|---|---|---|---|---|---|---|---|
| Coal analysis | Proximate analysis | Moisture | Fixed carbon | Volatile matter | Ash | Calorific Value | ||||||
| 1.35 | 57.3 | 24.15 | 18.55 | 27.4 MJ/kg | ||||||||
| Ultimate analysis | C | H | N | Cl | S | O (by diff.) | ||||||
| 69.13 | 3.79 | 1.51 | 0 | 0.36 | 6.66 | |||||||
| Ash analysis | SiO2 | Al2O3 | Fe2O3 | CaO | MgO | SO3 | TiO2 | P2O5 | Na2O | K2O | ||
| 0.4609 | 0.2064 | 0.0784 | 0.1619 | 0.0116 | 0.0245 | 0.013 | 0.0245 | 0.0031 | 0.0157 | |||
| Raw meal (wt %) | SiO2 | Al2O3 | CaO | MgO | K2O | Na2O | Fe2O3 | TiO2 | SO3 | L.O.I. | CaCO3 | |
| 13.68 | 3.54 | 43.49 | 0.66 | 0.23 | 0.15 | 2.49 | - | 0.16 | 35.39 | 78.13 | ||
| Output Data | ||||||||||||
| Clinker composition (oxide form) | ||||||||||||
| CaO | SiO2 | Al2O3 | Fe2O3 | MgO | P2O5 | TiO2 | Na2O | K2O | SO3 | Free CaO | ||
| Plant data | 66.79 | 21.84 | 5.72 | 3.89 | 1.1 | -- | -- | 0.31 | 0.37 | 0.22 | 1.1 | |
| Simulation results | 66.7793 | 21.6564 | 5.7106 | 3.8798 | 1.0089 | 0.052 | 0.028 | 0.245 | 0.362 | 0.2227 | 0.9369 | |
| Clinker composition (Compound form) and ratios | ||||||||||||
| C4AF | C3A | C2S | C3S | LSF | AR | SR | ||||||
| Plant data | 11.84 | 8.58 | 15.95 | 61.26 | 96.003 | 1.47 | 2.273 | |||||
| Simulation results | 11.80692 | 8.55310 | 15.90564 | 61.23595 | 95.14625 | 1.47190 | 2.25813 | |||||
| Air emission data | ||||||||||||
| Pollutant | Unit | Source | Available data | Simulation results | ||||||||
| CO2 | kg/tonne clinker | Standard limit | 977 | 803.6919 | ||||||||
| NOX | gm/tonne clinker | Average plant data | 2200 | 2076.50498 | ||||||||
| SO2 | gm/tonne clinker | Average plant data | 170 | 175.893923 | ||||||||
Table 6.
Specific thermal energy consumption in different kiln process [45].
Table 6.
Specific thermal energy consumption in different kiln process [45].
| Kiln Process | Thermal Energy Consumption (MJ/kg Clinker) |
|---|---|
| Wet process with internals | 5.86–6.28 |
| Long dry process with internals | 4.60 |
| 1-stage cyclone pre-heater | 4.18 |
| 2-stage cyclone pre-heater | 3.77 |
| 4-stage cyclone pre-heater | 3.55 |
| 4-stage cyclone pre-heater plus calciner | 3.14 |
| 5-stage pre-heater plus calciner plus high efficiency cooler | 3.01 |
| 6-stage pre-heater plus calciner plus high efficiency cooler | <2.93 |
Table 7.
Analysis of potential improvement in emission and energy requirement.
| Fuel Mix | Only Coal | Coal 82% & Tyre 18% | Coal 85% & MSW 15% | Coal 80% & MBM 20% | Coal 88% & Plastic Waste 12% | Coal 95% & Bagasse 5% | |
|---|---|---|---|---|---|---|---|
| Properties | |||||||
| Excess air in the kiln | 10% | 5% | 5% | 5% | 5% | 5% | |
| Excess air in the calciner | 20.025% | 13.58% | 6.866% | 15.277% | 10.7879% | 8.64% | |
| Kiln outlet temperature (°C) | 1680.665 | 1680.708 | 1680.441 | 1679.998 | 1680.722 | 1680.205 | |
| Raw feed (kg/h) [change %] | 137,856 | 138,365 [+0.369%] | 137,510 [−0.25%] | 138,530 [+0.489%] | 138,475 [+0.449%] | 138,320 [+0.337%] | |
| Energy requirement (MJ/kg clinker) [change %] | 3.145 | 3.028 [−3.72%] | 3.152 [+0.22%] | 2.944 [−6.39%] | 2.983 [−5.15%] | 2.982 [−5.18%] | |
| CO2 emission (kg/tonne clinker) [change %] | 803.692 | 781.275 [−2.79%] | 780.585 [−2.88%] | 768.543 [−4.37%] | 778.564 [−3.13%] | 786.632 [−2.12%] | |
© 2017 by the authors. Licensee MDPI, Basel, Switzerland. This article is an open access article distributed under the terms and conditions of the Creative Commons Attribution (CC BY) license (http://creativecommons.org/licenses/by/4.0/).
Share and Cite
MDPI and ACS Style
Rahman, A.; Rasul, M.G.; Khan, M.M.K.; Sharma, S.C. Assessment of Energy Performance and Emission Control Using Alternative Fuels in Cement Industry through a Process Model. Energies 2017, 10, 1996. https://doi.org/10.3390/en10121996
AMA Style
Rahman A, Rasul MG, Khan MMK, Sharma SC. Assessment of Energy Performance and Emission Control Using Alternative Fuels in Cement Industry through a Process Model. Energies. 2017; 10(12):1996. https://doi.org/10.3390/en10121996
Chicago/Turabian StyleRahman, Azad, Mohammad G. Rasul, M.M.K. Khan, and Subhash C. Sharma. 2017. "Assessment of Energy Performance and Emission Control Using Alternative Fuels in Cement Industry through a Process Model" Energies 10, no. 12: 1996. https://doi.org/10.3390/en10121996
Note that from the first issue of 2016, this journal uses article numbers instead of page numbers. See further details here.