1. Introduction
If any region can be seen as a microcosm with both the environmental and developmental problems and opportunities facing the World, particularly the developing countries, it is China. Since 1978 China’s gross domestic product (GDP) has experienced an annual growth of ten percent, making China the fastest growing country [
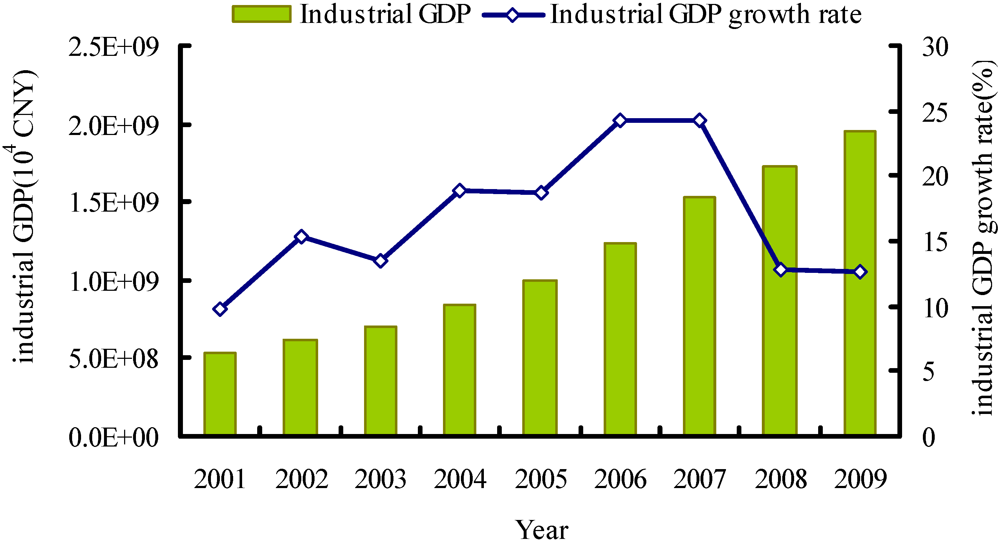
1]. China’s industrial GDP showed remarkable growth rate of over 10% between 2001 and 2009 (see
Figure 1). In 2007, China’s GDP stood at US$3.38 trillion, which made China the world’s third largest economy as far as GDP is concerned [
2]. China’s economic growth, industrialization, and urbanization coupled with inadequate investment in basic water supply and treatment infrastructure have resulted in widespread water pollution, and China is quickly moving in the direction of becoming one of the world’s biggest polluters. A report from United Nations Environmental Programme (UNEP) demonstrated that environmental damages were resulting in significant losses of GDP in China each year [
3]. More and more attention has been paid to whether or not the country’s development is sustainable and when and how its environmental conditions will be improved.
Figure 1.
Changes of China’s industrial gross domestic product during 2001–2009 (Data resources: Annual Statistic Report on Environment in China—ASREC [
4]).
Figure 1.
Changes of China’s industrial gross domestic product during 2001–2009 (Data resources: Annual Statistic Report on Environment in China—ASREC [
4]).
In 1991, Grossman innovatively put forward the concept of Environmental Kuznets Curves (EKC) to explain the relationship between economic development and environmental quality. The process can be expressed as an inverted “U”-shape
i.e., three stages from harmony to disorder, followed by coordination [
5]. However, the inverted “U”-shape is not the sole possible relationship between the two, so economic development is not the exclusive solution to environmental problems [
6,
7]. To identify the underlying mechanisms of economic progress and environmental degradation, several theories and empirical methods were put forward during the past three decades,
i.e., the econometric regression, the structural decomposition analysis (SDA) and the index decomposition analysis (IDA) [
8]. IDA is a useful technique for quantifying a large number of underlying factors that contribute to the changes in environmental quality by decomposing these changes at the sector level. The advantage of IDA is that it can be readily applied to various available data at different levels of aggregation [
9]. With respect to IDA, there have been a variety of different index methods available, such as Laspeyres index [
10] and the Divisia index [
11,
12]. In 1997, Ang and Choi [
13] first put forward the multiplication version of the Logarithmic Mean Divisia Index (namely LMDI II), which resolved the residual problem in the Divisia index method but led to a new problem of discontinuity in aggregation. Ang and Liu proposed the additive version of the Logarithmic Mean Divisia Index (LMDI I), which was complete in decomposition and consistent in aggregation, and efficient in handling zero values [
14]. LMDI I is widely used in the industrial energy conservation, and SO
2 & CO
2 emission reduction analysis [
15,
16]. However, few attempts have focused on the interaction analysis between the industry wastewater pollutant discharges and the economic growth.
China’s 12th Five-Year Plan (2011–2015) aims to achieve an average annual GDP growth of 7% while protecting the environment with an aim to reduce emissions of chemical-oxygen demand (COD) and ammonia nitrogen (NH4-N) by 8% and 10%, respectively, over the five-year period. In order to achieve harmonized development between economic growth and environmental sustainability, China must strengthen its environmental regulations.
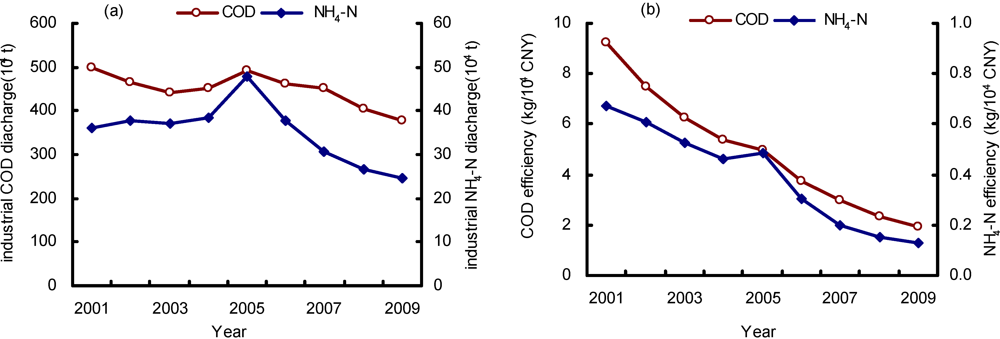
During the period of 2001–2009, industrial COD and NH
4-N discharges in wastewater showed an overall declining tendency (see
Figure 2a)and the average annual decreases were 148,927.7 t and 14,580.3 t, respectively. The discharge efficiency (amount of pollutant discharges per 10
4 CNY, in
Figure 2b) of COD and NH
4-N shows an obvious decline trend from the year 2001 to the year 2009 with the exception of 2005. It is important to know the cause of this change, and to achieve a clear understanding of the relationships among the economic development, the technology improvement, the structure adjustment and the wastewater pollutant discharges. This will make contribution for the policy and regulations making to ensure the realization of COD and NH
4-N reduction goal.
This paper analyzes the impact of different factors on the change of China’s industrial COD and NH4-N discharges. The aim of the paper is to identify the dominant factors driving the change of these COD and NH4-N discharges. Based on the two critical pollutants emission from industrial wastewater, the representative IDA method LMDI I is used to demonstrate the interaction mechanism. The changes in industrial pollutant discharges were decomposed into the scale of economic activities (production effect), the technological level of each sector (intensity effect), and the economic structure (structure effect).
Figure 2.
Changes of the wastewater discharges in industrial wastewater during 2001–2009, (
a) pollutant discharges; (
b) pollutant discharge efficiency (Data resources: ASREC [
4]).
Figure 2.
Changes of the wastewater discharges in industrial wastewater during 2001–2009, (
a) pollutant discharges; (
b) pollutant discharge efficiency (Data resources: ASREC [
4]).
This paper is organized as follows:
Section 2 describes the LMDI I method and the data used.
Section 3 presents the impacts of different factors on the changes of China’s industrial COD and NH
4-N discharges based on LMDI I.
Section 4 presents the conclusions, and the
last section offers some policy implications.
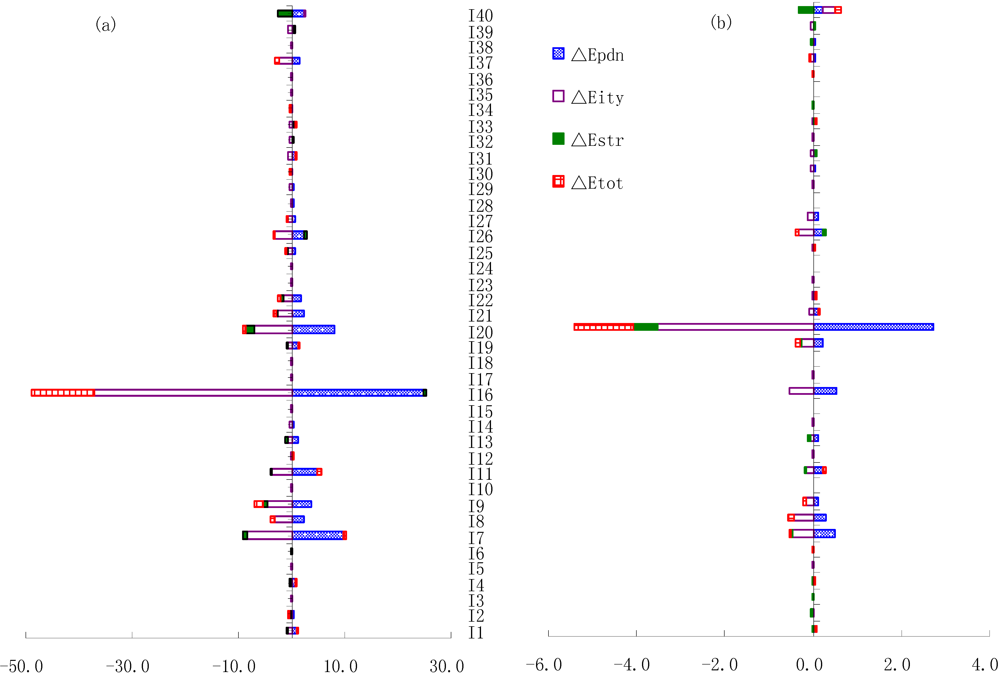
4. Conclusions
Over period of 2001–2009, China’s industrial COD discharges decreased 14.89 million tons, and the contribution by production scale, structural scale, intensity scale, cleaner production scale and pollution abatement scale were 72.97 × 10⁴ t, −6.93 × 10⁴ t, −80.94 × 10⁴ t, −53.37 × 10⁴ t and −27.57 × 10⁴ t, respectively. Likewise, the average changes of industrial NH4-N discharges were −1.46 × 10⁴ t, and the ΔEpdn,, ΔEstr,, ΔEity,, ΔEtec, and ΔEaba were 5.85 × 10⁴ t, −1.04 × 10⁴ t, −6.27 × 10⁴ t, −3.43 × 10⁴ t and −2.84 × 10⁴ t, respectively. The results also indicate that:
(1) Production effect was the major contributor to the increment of COD and NH4-N discharges in industrial wastewater, while the intensity effect played a crucial role in COD and NH4-N reduction.
(2) As one of the two parts in the intensity effect, the clean-technology effect played a major role in pollution reduction.
(3) Compared with the production effect and intensity effect, the structure effect played a minor role. However, it did decrease industrial pollution discharges between 2001 and 2009, so industrial structure adjustment should be a long-term policy goal in pollution reduction.
(4) The main contributors to the average production effect of the industrial COD discharges were manufacture of paper and paper products, processing of food from agricultural products, manufacture of raw chemical materials and chemical products, manufacture of textile and manufacture of beverages, while the main contributing sub-sectors to the average production effect of the industrial NH4-N discharges were manufacture of raw chemical materials and chemical products, manufacture of paper and paper products, processing of food from agricultural products, manufacture of foods, manufacture of textile and smelting and pressing of ferrous metals. Therefore, these sectors should be the top sectors to offsetthe growth of industrial COD or NH4-N discharges.


