Street Connectivity is Negatively Associated with Physical Activity in Canadian Youth

Abstract
:1. Introduction
2. Experimental Section
2.1. Overview of Study Sample and Design
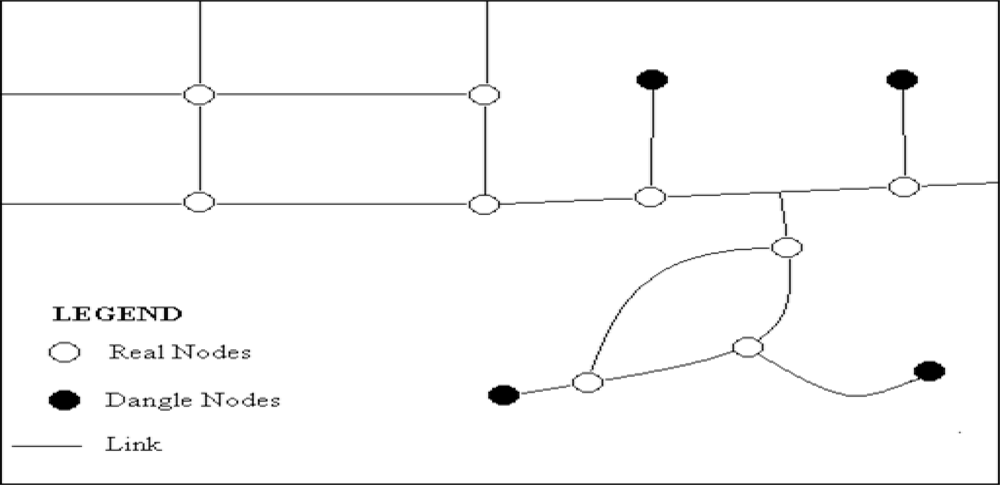
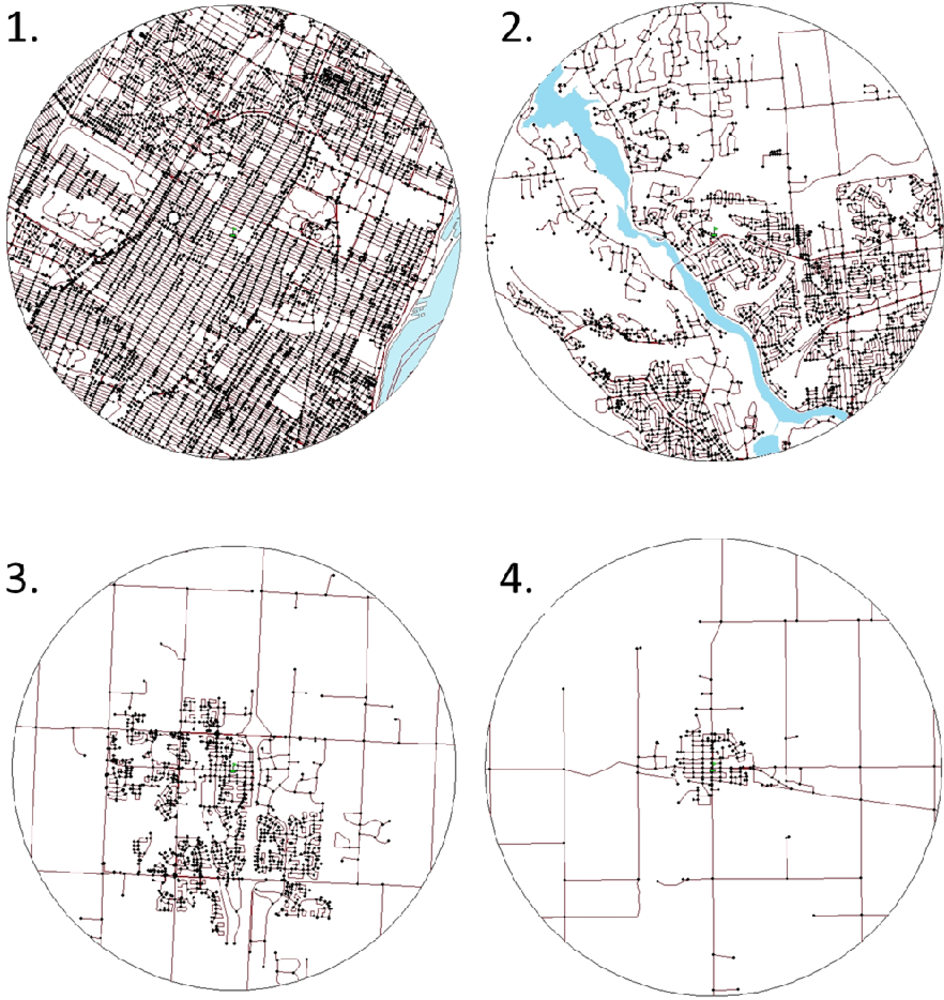
2.2. Measurement of Street Connectivity
2.3. Measurement of Physical Activity
2.4. Measurement of Potential Covariates
2.5. Statistical Analysis
3. Results and Discussion
3.1. Results
3.2. Discussion
4. Conclusions
Acknowledgments
References
- Janssen, I; LeBlanc, AG. Systematic review of the health benefits of physical activity in school-aged children and youth. Int. J. Behav. Nutr. Phys. Activ 2010, 7, 40. [Google Scholar]
- Colley, RC; Garriguet, D; Janssen, I; Craig, CL; Clarke, J; Tremblay, MS. Physical activity of Canadian children: Accelerometer results from the 2007 to 2009 Canadian Health Measures Survey. Health Rep 2011, 11, 1–11. [Google Scholar]
- Troiano, RP; Berrigan, D; Dodd, KW; Masse, LC; Tilert, T; McDowell, M. Physical activity in the United States measured by accelerometer. Med. Sci. Sports Exerc 2008, 40, 181–188. [Google Scholar]
- Humpel, N; Owen, N; Leslie, E. Environmental factors associated with adults’ participation in physical activity: A review. Am. J. Prev. Med 2002, 22, 188–199. [Google Scholar]
- Owen, N; Humpel, N; Leslie, E; Bauman, A; Sallis, JF. Understanding environmental influences on walking: Review and research agenda. Am. J. Prev. Med 2004, 27, 67–76. [Google Scholar]
- Tresidder, M. Using GIS to Measure Connectivity: An Exploration of Issues; School of Urban Studies and Planning, Portland State University: Portland, OR, USA, 2005. [Google Scholar]
- Saelens, BE; Sallis, JF; Frank, LD. Environmental correlates of walking and cycling: findings from the transportation, urban design, and planning literatures. Ann. Behav. Med 2003, 25, 80–91. [Google Scholar]
- Saelens, BE; Sallis, JF; Black, JB; Chen, D. Neighborhood-based differences in physical activity: An environment scale evaluation. Am. J. Public Health 2003, 93, 1552–1558. [Google Scholar]
- Gilmour, H. Physically active Canadians. Health Rep 2007, 18, 45–65. [Google Scholar]
- Canadian Fitness and Lifestyle Research Institute. 2004 Physical Activity and Sport Monitor: Local Opportunities for Physical Activity and Sport; Canadian Fitness and Lifestyle Research Institute: Ottawa, Canada, 2005; Available online: http://www.cflri.ca/pub_page/117 (accessed on 9 August 2011).
- Veitch, J; Bagley, S; Ball, K; Salmon, J. Where do children usually play? A qualitative study of parents’ perceptions of influences on children's active free-play. Health Place 2006, 12, 383–393. [Google Scholar]
- Kligerman, M; Sallis, JF; Ryan, S; Frank, LD; Nader, PR. Association of neighborhood design and recreation environment variables with physical activity and body mass index in adolescents. Am. J. Health Promot 2007, 21, 274–277. [Google Scholar]
- Mota, J; Almeida, M; Santos, P; Ribeiro, JC. Perceived neighborhood environments and physical activity in adolescents. Prev. Med 2005, 41, 834–836. [Google Scholar]
- Norman, GJ; Nutter, SK; Ryan, S; Sallis, JF; Calfas, KJ; Patrick, K. Community design and access to recreational facilities as correlates of adolescent physical activity and body-mass index. J. Phy. Act. Health 2006, 3, S118–S128. [Google Scholar]
- Leung, CW; Gregorich, SE; Laraia, BA; Kushi, LH; Yen, IH. Measuring the neighborhood environment: Associations with young girls’ energy intake and expenditure in a cross-sectional study. Int. J. Behav. Nutr. Phys. Act 2010, 7, 52. [Google Scholar]
- Boone-Heinonen, J; Gordon-Larsen, P. Life stage and sex specificity in relationships between the built and socioeconomic environments and physical activity. J. Epidemiol. Community 2010. [Google Scholar] [CrossRef]
- Currie, C; Nic Gabhainn, S; Godeau, N; Roberts, C; Smith, R; Currie, D; Pickett, W; Richter, M; Morgan, A; Barnekow, V. Inequalities in Young People's Health: HBSC International Report from the 2005/2006 Survey; World Health Organization Regional Office for Europe: Copenhagen, Denmark, 2008. [Google Scholar]
- Simpson, K; Janssen, I; Craig, WM; Pickett, W. Multilevel analysis of associations between socioeconomic status and injury among Canadian adolescents. J. Epidemiol. Community 2005, 59, 1072–1077. [Google Scholar]
- Nichol, ME; Janssen, I; Pickett, W. Perceptions of neighborhood safety, not recreational facilities, are associated with adolescent physical activity. J. Phys. Act. Health 2009, 7, 442–450. [Google Scholar]
- Seliske, LM; Pickett, W; Boyce, WF; Janssen, I. Association between the food retail environment surrounding schools and overweight in Canadian youth. Publ. Health Nutr 2009, 12, 1384–1391. [Google Scholar]
- Janssen, I; Boyce, WF; Simpson, K; Pickett, W. Influence of individual- and area-level measures of socioeconomic status on obesity, unhealthy eating, and physical inactivity in Canadian adolescents. Am. J. Clin. Nutr 2006, 83, 139–145. [Google Scholar]
- Krizek, KJ; Birnbaum, AS; Levinson, DM. A schematic for focusing on youth in investigations of community design and physical activity. Am. J. Health Promot 2004, 19, 33–38. [Google Scholar]
- Boyce, WF; Davies, D; Gallupe, O; Shelley, D. Adolescent risk taking, neighborhood social capital, and health. J. Adolesc. Health 2008, 43, 246–252. [Google Scholar]
- Seliske, LM; Pickett, W; Boyce, WF; Janssen, I. Density and type of food retailers surrounding Canadian schools: Variations across socioeconomic status. Health Place 2009, 15, 903–907. [Google Scholar]
- Zhang, J; Yu, KF. What's the relative risk? A method of correcting the odds ratio in cohort studies of common outcomes. JAMA 1998, 280, 1690–1691. [Google Scholar]
- Oleckno, WA. Essential Epidemiology: Principles and Applications; Waveland Press: Long Grove, IL, USA, 2002. [Google Scholar]
- Lund, H. Testing the claims of the new urbanism: Local access, pedestrian travel, and neighboring behaviors. Am. Plann. Assoc. J 2003, 69, 414–429. [Google Scholar]
- Southworth, M; Ben-Joseph, E. Reconsidering the cul-de-sac. Access 2004, 24, 28–33. [Google Scholar]
- Sallis, JF; Prochaska, JJ; Taylor, WC. A review of correlates of physical activity of children and adolescents. Med. Sci. Sports Exerc 2000, 32, 963–975. [Google Scholar]


| Street Connectivity Scale Quartiles | |||||
|---|---|---|---|---|---|
| 1 (highest) | 2 | 3 | 4 (lowest) | p value | |
| Level 1 variables | |||||
| Gender, % | 0.72 | ||||
| Male | 25.8 | 23.1 | 27.7 | 23.4 | |
| Female | 27.8 | 20.5 | 27.9 | 23.8 | |
| Grade, % | 0.04 | ||||
| 6 | 21.2 | 28.5 | 22.8 | 27.6 | |
| 7 | 33.3 | 14.5 | 27.6 | 24.6 | |
| 8 | 30.3 | 15.1 | 29.5 | 25.1 | |
| 9 | 23.2 | 27.4 | 30.3 | 19.2 | |
| 10 | 26.8 | 22.6 | 27.8 | 22.8 | |
| Family socioeconomic status, % | <0.0001 | ||||
| low | 40.7 | 17.4 | 20.7 | 21.2 | |
| medium | 27.8 | 19.3 | 27.2 | 25.7 | |
| high | 23.8 | 24.3 | 29.5 | 22.4 | |
| Perceived neighborhood safety, % | <0.0001 | ||||
| low | 32.7 | 20.0 | 26.8 | 20.5 | |
| medium | 26.4 | 22.0 | 28.8 | 22.8 | |
| high | 22.5 | 22.6 | 25.9 | 29.1 | |
| Perceived litter in neighborhood, % | <0.0001 | ||||
| none | 28.0 | 23.4 | 27.3 | 21.3 | |
| some | 25.8 | 20.2 | 28.3 | 25.7 | |
| lots | 25.3 | 16.9 | 29.0 | 28.8 | |
| Perceived rundown houses, % | <0.0001 | ||||
| none | 28.4 | 23.3 | 27.1 | 21.2 | |
| some | 21.2 | 16.0 | 30.6 | 32.2 | |
| lots | 26.7 | 14.3 | 28.1 | 31.0 | |
| Level 2 variables | |||||
| Socioeconomic status, % | <0.0001 | ||||
| 1 (lowest) | 4.8 | 9.3 | 28.6 | 57.3 | |
| 2 | 39.3 | 13.2 | 28.4 | 19.1 | |
| 3 | 28.2 | 21.1 | 30.9 | 19.9 | |
| 4 | 35.8 | 33.7 | 14.6 | 15.9 | |
| 5 (highest) | 22.7 | 30.5 | 33.9 | 9.1 | |
| Geographic location, % | <0.0001 | ||||
| Urban, inside census metro area | 43.8 | 32.6 | 20.7 | 2.9 | |
| Urban, outside census metro area | 0 | 7.0 | 43.2 | 49.8 | |
| Rural | 0 | 0 | 33.1 | 66.9 | |
| Number of parks and recreational facilities, % | <0.0001 | ||||
| 1 (least) | 2.4 | 5.8 | 30.2 | 61.6 | |
| 2 | 3.9 | 7.4 | 50.9 | 37.9 | |
| 3 | 11.9 | 16.7 | 53.8 | 17.5 | |
| 4 | 47.1 | 43.2 | 5.9 | 3.8 | |
| 5 (most) | 66.4 | 33.6 | 0 | 0 | |
| Total | Male | Female | Grade 6–8 | Grade 9–10 | |
|---|---|---|---|---|---|
| Physical activity outside of school hours, % | |||||
| None | 5.5 | 44.6 | 55.4 | 50.2 | 49.8 |
| 0.5 hours/week | 12.5 | 36.8 | 63.2 | 60.4 | 39.6 |
| 1 hour/week | 18.4 | 40.1 | 59.9 | 60.4 | 39.6 |
| 2–3 hours/week | 26.7 | 44.4 | 55.6 | 56.2 | 43.9 |
| 4–6 hours/week | 20.5 | 51.3 | 48.7 | 54.6 | 45.4 |
| 7+ hours/week | 16.4 | 59.4 | 40.6 | 55.2 | 44.8 |
| Physically active ≥4 hours/week outside of school hours, % | |||||
| No | 63.0 | 41.7 | 58.3 | 57.7 | 42.3 |
| Yes | 37.0 | 54.9 | 45.1 | 54.8 | 45.2 |
| n | % physically active | RR (95% CI) | |
|---|---|---|---|
| Street connectivity scale | |||
| 1 (highest connectivity) | 2,296 | 30.7 | 1.00 |
| 2 | 1,851 | 39.8 | 1.29 (1.16–1.42) |
| 3 | 2,374 | 39.5 | 1.31 (1.18–1.44) |
| 4 (lowest connectivity) | 2,014 | 38.6 | 1.26 (1.14–1.40) |
| P trend | <0.0001 | ||
| Connected node ratio | |||
| 1 (highest connectivity) | 2,114 | 31.7 | 1.00 |
| 2 | 2,104 | 35.8 | 1.12 (1.00–1.25) |
| 3 | 2,174 | 39.8 | 1.25 (1.12–1.38) |
| 4 (lowest connectivity) | 2,143 | 40.4 | 1.27 (1.15–1.41) |
| P trend | <0.0001 | ||
| Intersection density | |||
| 1 (highest connectivity) | 2,142 | 32.9 | 1.00 |
| 2 | 2,123 | 37.2 | 1.14 (1.01–1.27) |
| 3 | 2,151 | 40.8 | 1.28 (1.15–1.41) |
| 4 (lowest connectivity) | 2,119 | 37.0 | 1.14 (1.01–1.27) |
| P trend | 0.008 | ||
| Average block length | |||
| 1 (highest connectivity) | 2,161 | 32.1 | 1.00 |
| 2 | 2,095 | 37.6 | 1.18 (1.05–1.31) |
| 3 | 2,122 | 40.6 | 1.31 (1.18–1.45) |
| 4 (lowest connectivity) | 2,154 | 37.7 | 1.19 (1.06–1.33) |
| P trend | 0.001 | ||
| % Physically active | Bivariate Model RR (95% CI) | Multivariate Model 1 RR (95% CI) | Multivariate Model 2 RR (95% CI) | Multivariate Model 3 RR (95% CI) | |
|---|---|---|---|---|---|
| Street connectivity scale | |||||
| 1 (high) | 30.7 | 1.00 | 1.00 | 1.00 | 1.00 |
| 2 | 39.8 | 1.29 (1.16–1.42) | 1.22 (1.09–1.35) | 1.25 (1.12–1.39) | 1.22 (1.10–1.35) |
| 3 | 39.5 | 1.31 (1.18–1.44) | 1.24 (1.12–1.37) | 1.34 (1.15–1.53) | 1.25 (1.13–1.37) |
| 4 (low) | 38.6 | 1.26 (1.14–1.40) | 1.20 (1.08–1.33) | 1.29 (1.09–1.51) | 1.21 (1.09–1.34) |
| P trend | <0.0001 | 0.0009 | 0.002 | 0.0004 | |
| Level 1 covariates | |||||
| Gender | |||||
| Male | 43.6 | 1.00 | 1.00 | 1.00 | 1.00 |
| Female | 31.2 | 0.71 (0.67–0.76) | 0.73 (0.68–0.77) | 0.72 (0.68–0.77) | 0.73 (0.68–0.77) |
| P value | <0.0001 | <0.0001 | <0.0001 | <0.0001 | |
| Grade | |||||
| 6 | 35.2 | 1.00 | 1.00 | 1.00 | 1.00 |
| 7 | 34.7 | 1.01 (0.91–1.12) | 1.01 (0.91–1.12) | 1.01 (0.91–1.11) | 1.02 (0.91–1.12) |
| 8 | 37.2 | 1.07 (0.97–1.17) | 1.10 (0.99–1.20) | 1.08 (0.98–1.19) | 1.10 (0.99–1.20) |
| 9 | 37.9 | 1.08 (0.97–1.19) | 1.11 (1.01–1.22) | 1.10 (0.99–1.21) | 1.11 (1.01–1.22) |
| 10 | 39.2 | 1.12 (1.01–1.23) | 1.16 (1.05–1.27) | 1.14 (1.03–1.25) | 1.16 (1.05–1.27) |
| P trend | 0.02 | 0.001 | 0.003 | 0.0008 | |
| Family socioeconomic status | |||||
| low | 26.4 | 1.00 | 1.00 | 1.00 | 1.00 |
| medium | 33.0 | 1.21 (1.07–1.36) | 1.17 (1.03–1.32) | 1.17 (1.03–1.32) | 1.16 (1.03–1.31) |
| high | 41.9 | 1.53 (1.37–1.69) | 1.46 (1.30–1.62) | 1.46 (1.31–1.63) | 1.45 (1.30–1.61) |
| P trend | <0.0001 | <0.0001 | <0.0001 | <0.0001 | |
| Perceived neighborhood safety | |||||
| low | 29.7 | 1.00 | 1.00 | 1.00 | 1.00 |
| medium | 36.7 | 1.21 (1.12–1.31) | 1.20 (1.10–1.30) | 1.20 (1.11–1.30) | 1.19 (1.10–1.29) |
| high | 45.0 | 1.49 (1.37–1.61) | 1.48 (1.35–1.61) | 1.48 (1.36–1.61) | 1.47 (1.34–1.59) |
| P trend | <0.0001 | <0.0001 | <0.0001 | <0.0001 | |
| Perceived litter in neighborhood | |||||
| none | 36.6 | 1.00 | 1.00 | 1.00 | 1.00 |
| some | 37.7 | 1.04 (0.98–1.10) | 1.10 (1.03–1.16) | 1.10 (1.03–1.17) | 1.12 (1.05–1.18) |
| lots | 35.7 | 1.01 (0.89–1.12) | 1.10 (1.97–1.24) | 1.10 (0.96–1.23) | 1.13 (1.01–1.26) |
| P trend | 0.38 | 0.007 | 0.007 | 0.0004 | |
| Perceived rundown houses | |||||
| none | 36.7 | 1.00 | 1.00 | 1.00 | |
| some | 37.7 | 1.04 (0.96–1.11) | 1.06 (0.98–1.14) | 1.06 (0.98–1.15) | |
| lots | 38.1 | 1.06 (0.88–1.25) | 1.12 (0.92–1.33) | 1.12 (0.92–1.34) | |
| P trend | 0.27 | 0.07 | 0.07 | ||
| Level 2 covariates | |||||
| Area socioeconomic status | |||||
| 1 (lowest) | 38.5 | 1.00 | 1.00 | ||
| 2 | 33.8 | 0.85 (0.74–0.97) | 0.91 (0.80–1.03) | ||
| 3 | 37.7 | 0.96 (0.85–1.08) | 1.03 (0.92–1.15) | ||
| 4 | 33.2 | 0.87 (0.76–0.99) | 0.92 (0.81–1.05) | ||
| 5 (highest) | 40.6 | 1.02 (0.91–1.15) | 1.02 (0.90–1.15) | ||
| P trend | 0.60 | 0.57 | |||
| Geographic location | |||||
| Urban inside CMA | 35.7 | 1.00 | 1.00 | ||
| Urban outside CMA | 37.2 | 1.06 (0.96–1.17) | 0.97 (0.84–1.10) | ||
| Rural | 40.7 | 1.14 (1.02–1.26) | 1.01 (0.87–1.16) | ||
| P trend | 0.02 | 0.87 | |||
| Parks/recreational facilities | |||||
| 1 (least) | 39.0 | 1.00 | 1.00 | ||
| 2 | 38.2 | 0.97 (0.85–1.10) | 0.99 (0.87–1.11) | ||
| 3 | 37.1 | 0.91 (0.79–1.03) | 0.94 (0.82–1.06) | ||
| 4 | 34.9 | 0.89 (0.78–1.02) | 1.02 (0.88–1.17) | ||
| 5 (most) | 35.7 | 0.88 (0.77–1.00) | 1.13 (0.97–1.30) | ||
| P trend | 0.03 | 0.23 | |||
| n | % Physically active | Bivariate Model RR (95% CI) | Multivariate Model 1 RR (95% CI) | Multivariate Model 2 RR (95% CI) | |
|---|---|---|---|---|---|
| Street connectivity scale | |||||
| 1 (highest) | 731 | 30.7 | 1.00 (referent) | 1.00 (referent) | 1.00 (referent) |
| 2 | 728 | 39.8 | 1.13 (0.91–1.37) | 1.08 (0.88–1.30) | 1.09 (0.89–1.30) |
| 3 | 725 | 39.5 | 1.24 (1.02–1.47) | 1.19 (0.98–1.41) | 1.19 (0.99–1.40) |
| 4 (lowest) | 738 | 38.6 | 1.12 (0.91–1.34) | 1.09 (0.89–1.30) | 1.09 (0.90–1.30) |
| P trend | 0.20 | 0.27 | 0.24 | ||
| Additional variables | |||||
| Vehicle traffic | |||||
| low | 1,111 | 42.0 | 1.00 (referent) | 1.00 (referent) | |
| medium | 925 | 38.7 | 0.93 (0.83–1.04) | 0.94 (0.84–1.05) | |
| high | 886 | 35.6 | 0.86 (0.76–0.97) | 0.87 (0.76–0.98) | |
| P trend | 0.01 | 0.02 | |||
| Stoplights or stop signs at busy intersections | |||||
| no | 521 | 34.4 | 1.00 (referent) | 1.00 (referent) | |
| yes | 2,401 | 40.0 | 1.15 (1.02–1.30) | 1.16 (1.01–1.30) | |
| P value | 0.03 | 0.03 | |||
| Bike lanes and sidewalks | |||||
| no | 934 | 38.1 | 1.00 (referent) | ||
| yes | 1,988 | 39.4 | 1.01 (0.91–1.12) | ||
| P value | 0.78 | ||||
© 2011 by the authors; licensee MDPI, Basel, Switzerland. This article is an open-access article distributed under the terms and conditions of the Creative Commons Attribution license (http://creativecommons.org/licenses/by/3.0/).
Share and Cite
Mecredy, G.; Pickett, W.; Janssen, I. Street Connectivity is Negatively Associated with Physical Activity in Canadian Youth. Int. J. Environ. Res. Public Health 2011, 8, 3333-3350. https://doi.org/10.3390/ijerph8083333
Mecredy G, Pickett W, Janssen I. Street Connectivity is Negatively Associated with Physical Activity in Canadian Youth. International Journal of Environmental Research and Public Health. 2011; 8(8):3333-3350. https://doi.org/10.3390/ijerph8083333
Chicago/Turabian StyleMecredy, Graham, William Pickett, and Ian Janssen. 2011. "Street Connectivity is Negatively Associated with Physical Activity in Canadian Youth" International Journal of Environmental Research and Public Health 8, no. 8: 3333-3350. https://doi.org/10.3390/ijerph8083333