Assessment of Vulnerability to Extreme Flash Floods in Design Storms

Abstract
:1. Introduction
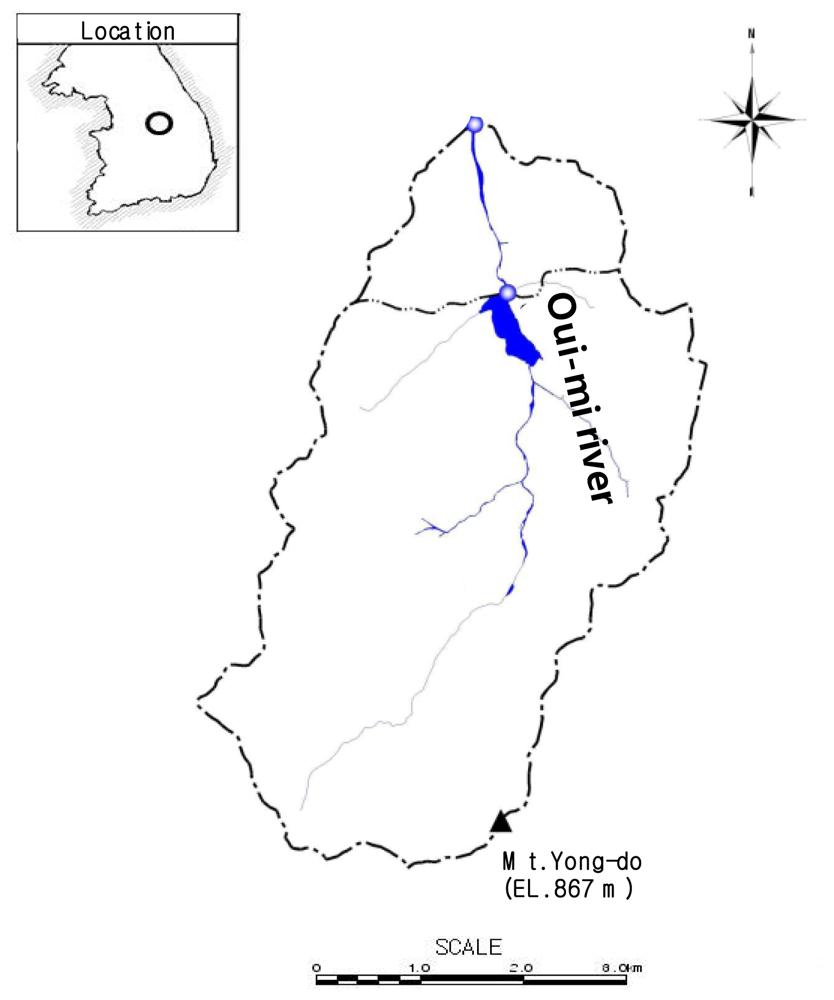
2. Study Catchment
3. Flash Flood Indexing Method
3.1. Flood Runoff Hydrographs
3.2. Rising Curve Gradient (K)
3.3. Peak Discharge Magnitude (M)
3.4. Flood Response Time (T)
3.5. Flash Flood Index
4. Comparison of Flash Flood Indexes
5. Assessment of Vulnerability in Design Storms
5. Summary and Conclusions
Acknowledgements
References
- Korea National Emergency Management Agency, The Annual Natural Disaster Bulletin; Korea National Emergency Management Agency: Seoul, Korea, 2007.
- Intergovernmental Panel on Climate Change (IPCC), Fourth Assessment Report, Climate Change 2007—Summary for Policymakers; IPCC: Geneva, Switzerland, 2007.
- Doswell, CA, III. Flash Flood-Producing Convective Storms. Proceedings of the US-Spain Workshop on Natural Hazards, Barcelona, Spain, 8–11 June 1993; pp. 97–107.
- Lapenta, KD; McNaught, BJ; Capriola, SJ; Giordano, LA; Little, CD; Hrebenach, SD; Carter, GM; Valverde, MD; Frey, DS. The challenge of forecasting heavy rain and flooding throughout the Eastern Region of the National Weather Service. Part I: Characteristics and events. Weather Forecast 1995, 10, 78–90. [Google Scholar]
- Opitz, HH; Summer, SG; Wert, DA; Snyder, WR; Kane, RJ; Brady, RH; Stokols, PM; Kuhl, SC; Carter, GM. The challenge of forecasting heavy rain and flooding throughout the Eastern Region of the National Weather Service. Part II: Forecast techniques and applications. Weather Forecast 1995, 10, 91–104. [Google Scholar]
- Kyiamah, GKA. Monitoring and Characterization of Flash Floods. MS thesis, Department of Civil Engineering, University of Louisville, Louisville, KY, USA, 1996. [Google Scholar]
- Bhaskar, NR; French, BM; Kyiamah, GK. Characterization of flash floods in Eastern Kentucky. J. Hydrol. Eng 2000, 5, 327–331. [Google Scholar]
- Jung, JC. The Study on Estimation of the Flash Flood Index for the Bo-chun River Basin. MS thesis, Department of Civil Engineering, Suwon University, Kyeonggi Province, Korea, 2000. [Google Scholar]
- Kim, BS; Kim, HS. Estimation of the flash flood severity using runoff hydrograph and flash flood index. J. Korea Water Resour. Assoc 2008, 41, 185–196. [Google Scholar]
- Wonju City, The Basic Plan Report for the Oui-mi River Maintenance Works; Wonju City: Gangwon Province, Korea, 2007.
- USACE, Hydrograph Modeling System; Technical Reference Manual; Hydrologic Engineering Center: Davis, CA, USA, 2000.
- Huff, FA. Time distribution of rainfall in heavy storms. Water Resour. Res 1967, 3, 1007–1019. [Google Scholar]


| No | Flood Runoff Characteristics | Flash Flood Indexing Parameters | Rainfall Characteristics | ||||||||||||||
|---|---|---|---|---|---|---|---|---|---|---|---|---|---|---|---|---|---|
| Flood event date | Flood peak discharge | Time to peak discharge | Rising curve gradient | Peak discharge magnitude | Flood response time | Relative Severity Factors | Flash Flood Index | Average rainfall intensity | Max. 1-hourly rainfall | Max. 2-hourly rainfall | Max. 3-hourly rainfall | Total rainfall depth | Rainfall duration time | ||||
| (1) | Qp(m3/s) (2) | T(hr) (3) | K(mm/hr2) (4) | M(mm/hr) (5) | T (hr) (6) | RK (7) | RM (8) | RT (9) | RF (%) (10) | FI (%) (11) | Ia (mm/hr) (12) | R1h (mm) (13) | R2h (mm) (14) | R3h (mm) (15) | Rt (mm) (16) | D (hr) (17) | |
| 1 | 06/29/73 | 20.5 | 8.0 | 0.55 | 4.40 | 8.00 | 0.10 | 0.11 | 0.38 | 19.48 | 10.47 | 5.06 | 14.0 | 25.0 | 32.0 | 40.5 | 8 |
| 2 | 08/23/74 | 14.5 | 4.0 | 0.78 | 3.11 | 4.00 | 0.14 | 0.08 | 0.75 | 32.24 | 10.86 | 4.47 | 22.3 | 27.5 | 29.6 | 67.0 | 15 |
| 3 | 09/15/75 | 30.7 | 19.0 | 0.35 | 6.61 | 19.00 | 0.06 | 0.17 | 0.16 | 12.91 | 11.47 | 4.39 | 13.0 | 23.0 | 27.0 | 101.0 | 23 |
| 4 | 08/14/76 | 28.0 | 11.0 | 0.55 | 6.02 | 11.00 | 0.10 | 0.15 | 0.27 | 17.42 | 12.49 | 4.26 | 15.0 | 23.5 | 26.0 | 81.0 | 19 |
| 5 | 09/06/77 | 39.6 | 16.0 | 0.53 | 8.51 | 16.00 | 0.09 | 0.22 | 0.19 | 16.60 | 15.53 | 5.37 | 21.5 | 42.0 | 46.5 | 107.4 | 20 |
| 6 | 08/19/78 | 44.9 | 18.0 | 0.54 | 9.66 | 18.00 | 0.10 | 0.25 | 0.17 | 16.91 | 17.03 | 6.44 | 29.5 | 37.0 | 46.0 | 122.3 | 19 |
| 7 | 08/04/79 | 59.2 | 11.0 | 1.16 | 12.73 | 11.00 | 0.21 | 0.32 | 0.27 | 26.71 | 26.42 | 9.39 | 29.5 | 45.5 | 57.0 | 112.7 | 12 |
| 8 | 07/22/80 | 71.7 | 17.0 | 0.91 | 15.43 | 17.00 | 0.16 | 0.39 | 0.18 | 24.30 | 27.63 | 6.63 | 43.0 | 53.2 | 75.4 | 132.6 | 20 |
| 9 | 07/01/81 | 31.9 | 15.0 | 0.46 | 6.86 | 15.00 | 0.08 | 0.17 | 0.20 | 15.17 | 12.76 | 5.59 | 15.0 | 25.5 | 31.0 | 95.0 | 17 |
| 10 | 08/21/82 | 26.2 | 3.0 | 1.88 | 5.64 | 3.00 | 0.33 | 0.14 | 1.00 | 49.22 | 23.83 | 6.05 | 32.0 | 38.0 | 42.0 | 60.5 | 10 |
| 11 | 07/19/83 | 24.7 | 7.0 | 0.76 | 5.31 | 7.00 | 0.13 | 0.13 | 0.43 | 23.27 | 13.47 | 6.11 | 17.0 | 28.5 | 36.5 | 55.0 | 9 |
| 12 | 09/02/84 | 24.0 | 17.0 | 0.30 | 5.16 | 17.00 | 0.05 | 0.13 | 0.18 | 12.04 | 9.24 | 4.83 | 10.5 | 16.0 | 24.0 | 96.5 | 20 |
| 13 | 07/17/85 | 57.8 | 5.0 | 2.49 | 12.43 | 5.00 | 0.44 | 0.32 | 0.60 | 45.23 | 37.85 | 14.92 | 29.0 | 45.0 | 65.0 | 89.5 | 6 |
| 14 | 07/19/86 | 80.5 | 7.0 | 2.47 | 17.32 | 7.00 | 0.44 | 0.44 | 0.43 | 43.58 | 43.94 | 6.39 | 32.0 | 58.0 | 69.0 | 134.2 | 21 |
| 15 | 07/22/87 | 70.0 | 4.0 | 3.76 | 15.06 | 4.00 | 0.67 | 0.38 | 0.75 | 60.02 | 52.53 | 8.15 | 41.5 | 57.5 | 67.5 | 187.5 | 23 |
| 16 | 07/14/88 | 111.5 | 12.0 | 2.00 | 23.97 | 12.00 | 0.35 | 0.61 | 0.25 | 40.44 | 48.16 | 13.97 | 33.0 | 57.0 | 75.5 | 223.5 | 16 |
| 17 | 07/26/89 | 77.4 | 7.0 | 2.38 | 16.64 | 7.00 | 0.42 | 0.42 | 0.43 | 42.43 | 42.21 | 6.22 | 34.0 | 67.5 | 85.5 | 143.0 | 23 |
| 18 | 09/11/90 | 92.8 | 24.0 | 0.83 | 19.96 | 24.00 | 0.15 | 0.51 | 0.13 | 25.98 | 32.72 | 9.52 | 38.5 | 72.0 | 88.0 | 228.5 | 24 |
| 19 | 07/20/91 | 58.3 | 12.0 | 1.04 | 12.53 | 12.00 | 0.19 | 0.32 | 0.25 | 25.11 | 25.17 | 10.58 | 32.0 | 38.0 | 47.5 | 137.5 | 13 |
| 20 | 09/24/92 | 35.6 | 15.0 | 0.51 | 7.65 | 15.00 | 0.09 | 0.19 | 0.20 | 16.15 | 14.23 | 5.44 | 13.5 | 25.5 | 36.5 | 98.0 | 18 |
| 21 | 07/13/93 | 70.4 | 13.0 | 1.16 | 15.14 | 13.00 | 0.21 | 0.38 | 0.23 | 27.39 | 29.55 | 7.55 | 30.5 | 42.0 | 52.5 | 158.5 | 21 |
| 22 | 06/30/94 | 123.6 | 20.0 | 1.33 | 26.59 | 20.00 | 0.24 | 0.67 | 0.15 | 35.36 | 45.54 | 8.54 | 37.0 | 68.5 | 90.5 | 196.5 | 23 |
| 23 | 08/25/95 | 40.7 | 8.0 | 1.09 | 8.76 | 8.00 | 0.19 | 0.22 | 0.38 | 26.39 | 20.84 | 5.71 | 22.5 | 29.0 | 36.5 | 120.0 | 21 |
| 24 | 07/28/96 | 55.0 | 4.0 | 2.96 | 11.83 | 4.00 | 0.53 | 0.30 | 0.75 | 52.51 | 41.27 | 12.33 | 35.0 | 53.0 | 68.5 | 74.0 | 6 |
| 25 | 07/01/97 | 98.7 | 18.0 | 1.18 | 21.23 | 18.00 | 0.21 | 0.54 | 0.17 | 30.50 | 37.41 | 7.24 | 49.5 | 56.5 | 63.5 | 166.5 | 23 |
| 26 | 08/08/98 | 50.7 | 15.0 | 0.73 | 10.90 | 15.00 | 0.13 | 0.28 | 0.20 | 20.19 | 20.28 | 4.75 | 19.5 | 38.5 | 41.0 | 95.0 | 20 |
| 27 | 08/02/99 | 57.8 | 22.0 | 0.57 | 12.43 | 22.00 | 0.10 | 0.32 | 0.14 | 18.41 | 20.79 | 5.61 | 27.5 | 40.5 | 51.0 | 123.5 | 22 |
| 28 | 07/22/00 | 64.2 | 11.0 | 1.25 | 13.80 | 11.00 | 0.22 | 0.35 | 0.27 | 28.19 | 28.65 | 7.42 | 36.0 | 50.0 | 54.5 | 96.5 | 13 |
| 29 | 06/30/01 | 98.3 | 5.0 | 4.23 | 21.14 | 5.00 | 0.75 | 0.54 | 0.60 | 62.92 | 64.38 | 17.75 | 41.0 | 72.0 | 87.0 | 106.5 | 6 |
| 30 | 08/31/02 | 62.1 | 23.0 | 0.58 | 13.35 | 23.00 | 0.10 | 0.34 | 0.13 | 19.08 | 22.10 | 8.61 | 22.5 | 40.5 | 54.0 | 198.0 | 23 |
| 31 | 06/27/03 | 46.8 | 9.0 | 1.12 | 10.07 | 9.00 | 0.20 | 0.26 | 0.33 | 26.25 | 22.71 | 8.17 | 15.0 | 30.0 | 42.5 | 122.5 | 15 |
| 32 | 08/18/04 | 33.0 | 21.0 | 0.34 | 7.09 | 21.00 | 0.06 | 0.18 | 0.14 | 12.76 | 11.99 | 3.73 | 12.5 | 23.0 | 31.0 | 89.5 | 24 |
| 33 | 07/11/05 | 33.6 | 10.0 | 0.72 | 7.22 | 10.00 | 0.13 | 0.18 | 0.30 | 20.39 | 15.58 | 5.74 | 23.0 | 33.0 | 44.0 | 109.0 | 19 |
| 34 | 07/16/06 | 67.5 | 15.0 | 0.97 | 14.51 | 15.00 | 0.17 | 0.37 | 0.20 | 24.66 | 26.99 | 8.46 | 22.5 | 42.0 | 54.5 | 203.0 | 24 |
| 35 | 08/05/07 | 183.3 | 7.0 | 5.63 | 39.41 | 7.00 | 1.00 | 1.00 | 0.43 | 80.95 | 100.00 | 18.65 | 68.0 | 122.5 | 149.0 | 186.5 | 10 |
| 36 | 07/24/08 | 70.6 | 19.0 | 0.80 | 15.18 | 19.00 | 0.14 | 0.39 | 0.16 | 22.83 | 26.35 | 4.02 | 49.0 | 63.0 | 68.0 | 96.5 | 24 |
| average | 59.9 | 12.6 | 1.36 | 12.88 | 12.56 | 0.24 | 0.33 | 0.33 | 29.83 | 28.40 | 7.72 | 28.52 | 44.70 | 55.43 | 123.76 | 17.50 | |
| maximum | 183.3 | 24.0 | 5.63 | 39.41 | 24.00 | 1.00 | 1.00 | 1.00 | 80.95 | 100.00 | 18.65 | 68.00 | 122.50 | 149.00 | 228.50 | 24.00 | |
| minimum | 14.5 | 3.0 | 0.30 | 3.11 | 3.00 | 0.05 | 0.08 | 0.13 | 12.04 | 9.24 | 3.73 | 10.50 | 16.00 | 24.00 | 40.50 | 6.00 | |
| Flash Flood Index, RF | Flash Flood Index, FI | |||
|---|---|---|---|---|
| Regression Equations | R2 | Regression Equations | R2 | |
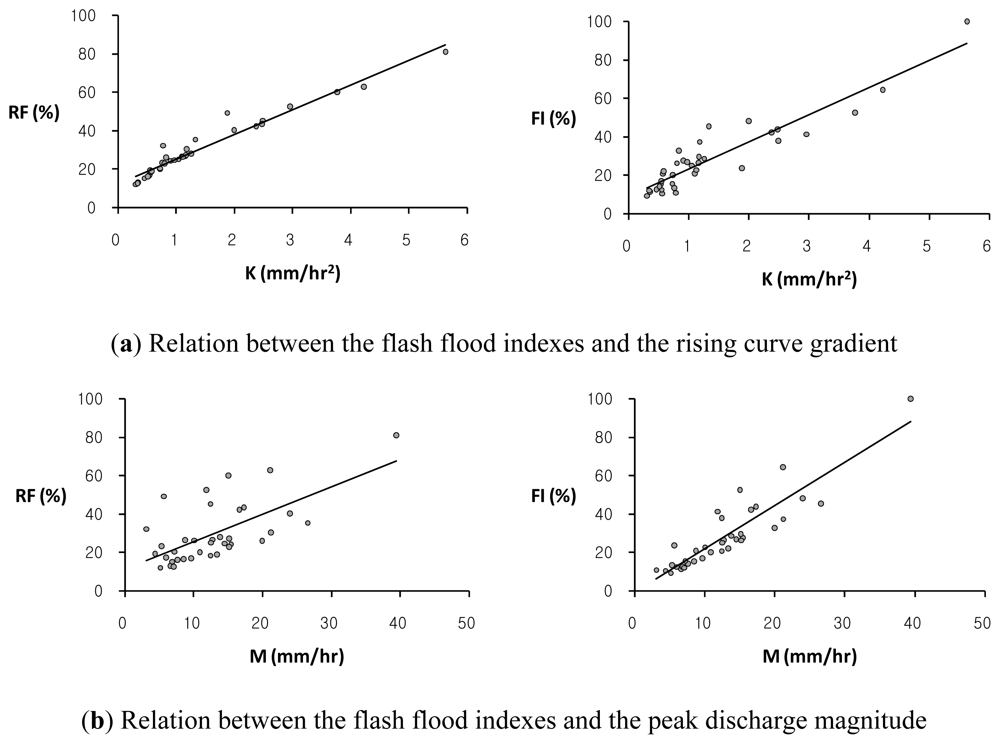
| K | RF =12.869K +12.354 | 0.950 | FI =14.131K + 9.209 | 0.861 |
| M | RF =1.418M +11.569 | 0.428 | FI = 2.258M − 0.682 | 0.817 |
| Flash Flood Index, RF | Flash Flood Index, FI | |||
|---|---|---|---|---|
| Regression Equations | R2 | Regression Equations | R2 | |
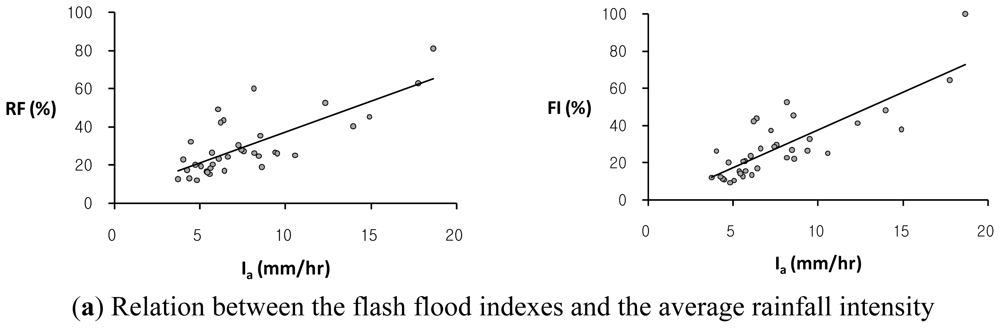
| Ia | RF = 3.252 Ia + 4.713 | 0.573 | FI = 4.044 Ia − 2.835 | 0.666 |
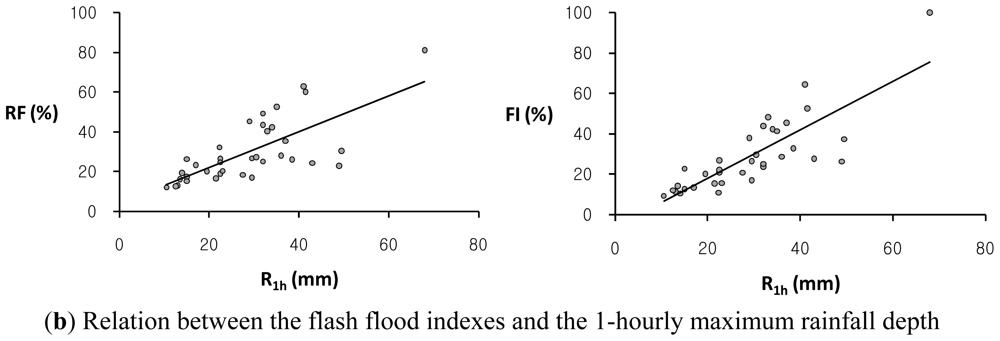
| R1h | RF = 0.900 R1h + 4.166 | 0.512 | FI = 1.195 R1h − 5.671 | 0.678 |
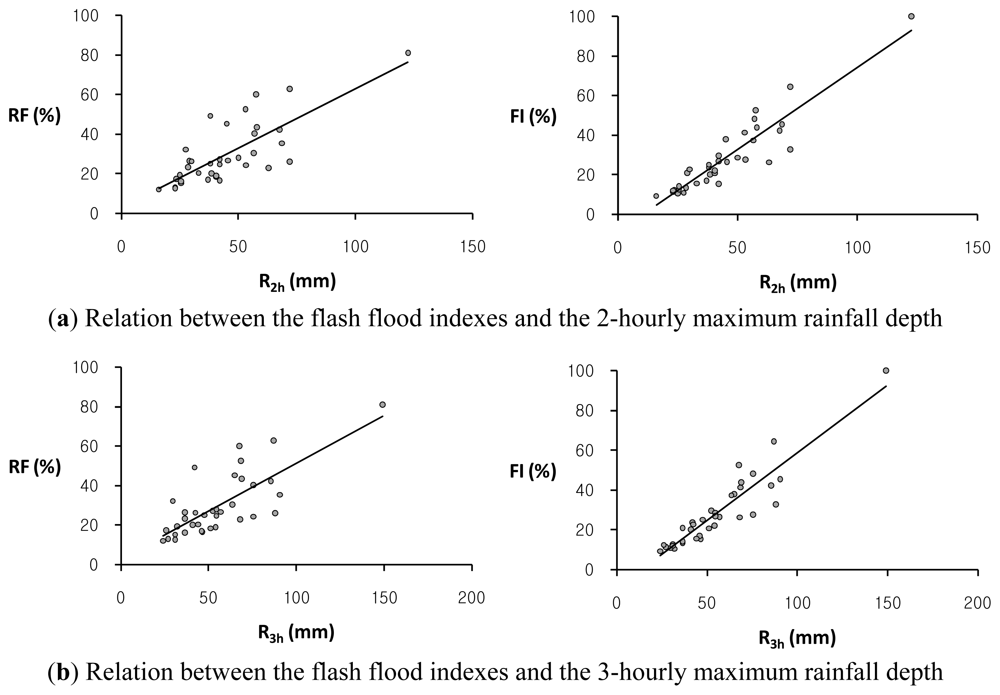
| R2h | RF = 0.597 R2h + 3.152 | 0.587 | FI = 0.830 R2h − 8.692 | 0.854 |
| R3h | RF = 0.484 R3h + 3.008 | 0.577 | FI = 0.682 R3h − 9.383 | 0.860 |
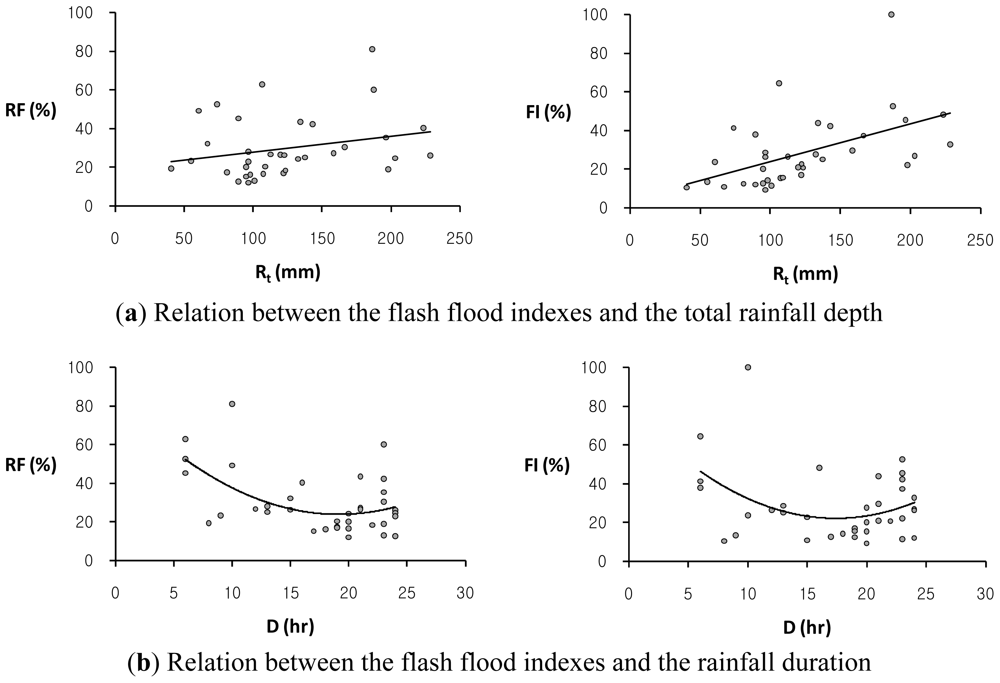
| Rt | RF = 0.081 Rt + 19.755 | 0.061 | FI = 0195 Rt + 4.253 | 0.265 |
| D | RF = 0.164D2 − 6.289D + 84.146 | 0.285 | FI = 0.187D2 − 6.495D + 78.691 | 0.137 |
| Duration | Depth of precipitation (mm)
| |||||||
|---|---|---|---|---|---|---|---|---|
| 2 yrs | 3 yrs | 5 yrs | 10 yrs | 20 yrs | 50 yrs | 100 yrs | 200 yrs | |
| 1 hrs | 40.3 | 46.1 | 52.6 | 60.7 | 68.5 | 78.5 | 92.5 | 99.8 |
| 3 hrs | 64.3 | 74.1 | 85.1 | 98.9 | 112.1 | 129.3 | 144.1 | 157.1 |
| 6 hrs | 88.5 | 102.7 | 118.6 | 138.7 | 158 | 182.8 | 198.0 | 215.9 |
| 12 hrs | 119.2 | 141.7 | 166.9 | 198.3 | 228.5 | 267.7 | 282.6 | 311.3 |
| 18 hrs | 128.7 | 153.5 | 181.1 | 217.1 | 251.9 | 298.3 | 340.4 | 373.1 |
| 24 hrs | 136.9 | 164.1 | 194.1 | 232.4 | 268.7 | 316.1 | 388.1 | 431.5 |
| Cumulative time (%) | 0 | 10 | 20 | 30 | 40 | 50 | 60 | 70 | 80 | 90 | 100 | |
|---|---|---|---|---|---|---|---|---|---|---|---|---|
| Cumulative Rainfall (%) | 1st quartile | 0.0 | 20.1 | 41.3 | 60.3 | 69.4 | 73.6 | 79.5 | 84.2 | 89.6 | 95.2 | 100.0 |
| 2nd quartile | 0.0 | 4.7 | 12.0 | 26.0 | 47.7 | 67.7 | 78.0 | 87.1 | 92.1 | 96.3 | 100.0 | |
| 3rd quartile | 0.0 | 4.9 | 10.7 | 15.8 | 21.9 | 33.7 | 52.1 | 74.7 | 88.9 | 95.4 | 100.0 | |
| 4th quartile | 0.0 | 8.6 | 16.7 | 22.2 | 25.0 | 30.4 | 35.0 | 45.2 | 60.0 | 81.7 | 100.0 | |
| No | Flood Runoff Characteristics | Flood Indexing Parameters | Rainfall Characteristics | ||||||||
|---|---|---|---|---|---|---|---|---|---|---|---|
| Design flood | Flood peak discharge | Time to peak discharge | Rising curve gradient | Peak discharge magnitude | Relative Severity Factors | Flash Flood Index | Average rainfall intensity | Total rainfall depth | Rainfall duration time | ||
| (1) | Qp (m3/s) (2) | T (hr) (3) | K (mm/hr2) (4) | M (mm/hr) (5) | RK (6) | RM (7) | FI (%) (8) | Ia (mm/hr) (9) | Rt (mm) (10) | D (hr) (11) | |
| 1 | 2year 1hr | 25.32 | 2 | 2.72 | 5.45 | 0.48 | 0.14 | 31.09 | 40.3 | 40.3 | 1 |
| 2 | 2year 3hr | 51.28 | 3 | 3.68 | 11.03 | 0.65 | 0.28 | 46.63 | 21.4 | 64.3 | 3 |
| 3 | 2year 6hr | 64.95 | 5 | 2.79 | 13.97 | 0.50 | 0.35 | 42.53 | 14.8 | 88.5 | 6 |
| 4 | 2year 12hr | 60.46 | 9 | 1.44 | 13.00 | 0.26 | 0.33 | 29.32 | 9.9 | 119.2 | 12 |
| 5 | 2year 18hr | 46.26 | 13 | 0.77 | 9.95 | 0.14 | 0.25 | 19.42 | 7.2 | 128.7 | 18 |
| 6 | 2year 24hr | 38.67 | 17 | 0.49 | 8.32 | 0.09 | 0.21 | 14.89 | 5.7 | 136.9 | 24 |
| 7 | 3year 1hr | 31.89 | 2 | 3.43 | 6.86 | 0.61 | 0.17 | 39.16 | 46.1 | 46.1 | 1 |
| 8 | 3year 3hr | 64.36 | 3 | 4.61 | 13.84 | 0.82 | 0.35 | 58.53 | 24.7 | 74.1 | 3 |
| 9 | 3year 6hr | 81.23 | 5 | 3.49 | 17.47 | 0.62 | 0.44 | 53.19 | 17.1 | 102.7 | 6 |
| 10 | 3year 12hr | 77.06 | 9 | 1.84 | 16.57 | 0.33 | 0.42 | 37.38 | 11.8 | 141.7 | 12 |
| 11 | 3year 18hr | 58.93 | 13 | 0.97 | 12.67 | 0.17 | 0.32 | 24.74 | 8.5 | 153.5 | 18 |
| 12 | 3year 24hr | 49.47 | 17 | 0.63 | 10.64 | 0.11 | 0.27 | 19.05 | 6.8 | 164.1 | 24 |
| 13 | 5year 1hr | 39.84 | 2 | 4.28 | 8.57 | 0.76 | 0.22 | 48.92 | 52.6 | 52.6 | 1 |
| 14 | 5year 3hr | 78.77 | 3 | 5.65 | 16.94 | 1.00 | 0.43 | 71.64 | 28.4 | 85.1 | 3 |
| 15 | 5year 6hr | 100.30 | 5 | 4.31 | 21.57 | 0.77 | 0.55 | 65.68 | 19.8 | 118.6 | 6 |
| 16 | 5year 12hr | 96.26 | 9 | 2.30 | 20.70 | 0.41 | 0.53 | 46.69 | 13.9 | 166.9 | 12 |
| 17 | 5year 18hr | 73.53 | 13 | 1.22 | 15.81 | 0.22 | 0.40 | 30.86 | 10.1 | 181.1 | 18 |
| 18 | 5year 24hr | 61.68 | 17 | 0.78 | 13.26 | 0.14 | 0.34 | 23.76 | 8.1 | 194.1 | 24 |
| 19 | 10year 1hr | 50.52 | 2 | 5.43 | 10.86 | 0.96 | 0.28 | 62.02 | 60.7 | 60.7 | 1 |
| 20 | 10year 3hr | 100.63 | 3 | 7.21 | 21.64 | 1.28 | 0.55 | 91.52 | 33.0 | 98.9 | 3 |
| 21 | 10year 6hr | 125.29 | 5 | 5.39 | 26.94 | 0.96 | 0.68 | 82.04 | 23.1 | 138.7 | 6 |
| 22 | 10year 12hr | 120.78 | 9 | 2.89 | 25.97 | 0.51 | 0.66 | 58.58 | 16.5 | 198.3 | 12 |
| 23 | 10year 18hr | 92.71 | 13 | 1.53 | 19.94 | 0.27 | 0.51 | 38.91 | 12.1 | 217.1 | 18 |
| 24 | 10year 24hr | 77.24 | 17 | 0.98 | 16.61 | 0.17 | 0.42 | 29.75 | 9.7 | 232.4 | 24 |
| 25 | 20year 1hr | 61.50 | 2 | 6.61 | 13.23 | 1.17 | 0.34 | 75.51 | 68.5 | 68.5 | 1 |
| 26 | 20year 3hr | 131.32 | 3 | 9.41 | 28.24 | 1.67 | 0.72 | 119.43 | 37.4 | 112.1 | 3 |
| 27 | 20year 6hr | 150.03 | 5 | 6.45 | 32.26 | 1.15 | 0.82 | 98.24 | 26.3 | 158 | 6 |
| 28 | 20year 12hr | 144.50 | 9 | 3.45 | 31.08 | 0.61 | 0.79 | 70.09 | 19.0 | 228.5 | 12 |
| 29 | 20year 18hr | 111.79 | 13 | 1.85 | 24.04 | 0.33 | 0.61 | 46.92 | 14.0 | 251.9 | 18 |
| 30 | 20year 24hr | 92.36 | 17 | 1.17 | 19.86 | 0.21 | 0.50 | 35.57 | 11.2 | 268.7 | 24 |
| 31 | 50year 1hr | 76.44 | 2 | 8.22 | 16.44 | 1.46 | 0.42 | 93.85 | 78.5 | 78.5 | 1 |
| 32 | 50year 3hr | 149.45 | 3 | 10.71 | 32.14 | 1.90 | 0.82 | 135.92 | 43.1 | 129.3 | 3 |
| 33 | 50year 6hr | 182.77 | 5 | 7.86 | 39.31 | 1.40 | 1.00 | 119.68 | 30.5 | 182.8 | 6 |
| 34 | 50year 12hr | 175.94 | 9 | 4.20 | 37.84 | 0.75 | 0.96 | 85.34 | 22.3 | 267.7 | 12 |
| 35 | 50year 18hr | 137.26 | 13 | 2.27 | 29.52 | 0.40 | 0.75 | 57.61 | 16.6 | 298.3 | 18 |
| 36 | 50year 24hr | 112.14 | 17 | 1.42 | 24.12 | 0.25 | 0.61 | 43.19 | 13.2 | 316.1 | 24 |
| 37 | 100year 1hr | 87.62 | 2 | 9.42 | 18.84 | 1.67 | 0.48 | 107.58 | 92.5 | 92.5 | 1 |
| 38 | 100year 3hr | 174.44 | 3 | 12.50 | 37.51 | 2.22 | 0.95 | 158.65 | 48.0 | 144.1 | 3 |
| 39 | 100year 6hr | 202.91 | 5 | 8.73 | 43.64 | 1.55 | 1.11 | 132.87 | 33.0 | 198.0 | 6 |
| 40 | 100year 12hr | 197.66 | 9 | 4.72 | 42.51 | 0.84 | 1.08 | 95.87 | 23.6 | 282.6 | 12 |
| 41 | 100year 18hr | 156.28 | 13 | 2.59 | 33.61 | 0.46 | 0.85 | 65.60 | 18.9 | 340.4 | 18 |
| 42 | 100year 24hr | 130.13 | 17 | 1.65 | 27.98 | 0.29 | 0.71 | 50.12 | 16.2 | 388.1 | 24 |
| 43 | 200year 1hr | 98.61 | 2 | 10.60 | 21.21 | 1.88 | 0.54 | 121.07 | 99.8 | 99.8 | 1 |
| 44 | 200year 3hr | 196.90 | 3 | 14.11 | 42.34 | 2.51 | 1.07 | 179.07 | 52.4 | 157.1 | 3 |
| 45 | 200year 6hr | 227.09 | 5 | 9.77 | 48.84 | 1.73 | 1.24 | 148.70 | 36.0 | 215.9 | 6 |
| 46 | 200year 12hr | 220.53 | 9 | 5.27 | 47.43 | 0.94 | 1.20 | 106.97 | 25.9 | 311.3 | 12 |
| 47 | 200year 18hr | 174.35 | 13 | 2.88 | 37.49 | 0.51 | 0.95 | 73.18 | 20.7 | 373.1 | 18 |
| 48 | 200year 24hr | 145.34 | 17 | 1.84 | 31.26 | 0.33 | 0.79 | 55.98 | 18.0 | 431.5 | 24 |
| average | 108.43 | 8.17 | 4.51 | 23.32 | 0.80 | 0.59 | 69.65 | 27.18 | 174.99 | 10.67 | |
| maximum | 227.09 | 17 | 14.11 | 48.84 | 2.51 | 1.24 | 179.07 | 78.50 | 316.10 | 24 | |
| minimum | 31.89 | 2 | 0.49 | 6.68 | 0.09 | 0.17 | 14.89 | 5.70 | 46.10 | 1 | |
| recorded max. | 183.26 | 24 | 5.63 | 39.41 | 1.00 | 1.00 | 100.00 | 18.65 | 228.50 | 24 | |
© 2011 by the authors; licensee MDPI, Basel, Switzerland This article is an open-access article distributed under the terms and conditions of the Creative Commons Attribution license (http://creativecommons.org/licenses/by/3.0/).
Share and Cite
Kim, E.S.; Choi, H.I. Assessment of Vulnerability to Extreme Flash Floods in Design Storms. Int. J. Environ. Res. Public Health 2011, 8, 2907-2922. https://doi.org/10.3390/ijerph8072907
Kim ES, Choi HI. Assessment of Vulnerability to Extreme Flash Floods in Design Storms. International Journal of Environmental Research and Public Health. 2011; 8(7):2907-2922. https://doi.org/10.3390/ijerph8072907
Chicago/Turabian StyleKim, Eung Seok, and Hyun Il Choi. 2011. "Assessment of Vulnerability to Extreme Flash Floods in Design Storms" International Journal of Environmental Research and Public Health 8, no. 7: 2907-2922. https://doi.org/10.3390/ijerph8072907