The Value of the Freshwater Snail Dip Scoop Sampling Method in Macroinvertebrates Bioassessment of Sugar Mill Wastewater Pollution in Mbandjock, Cameroon

Abstract
:Introduction
Materials and Methods
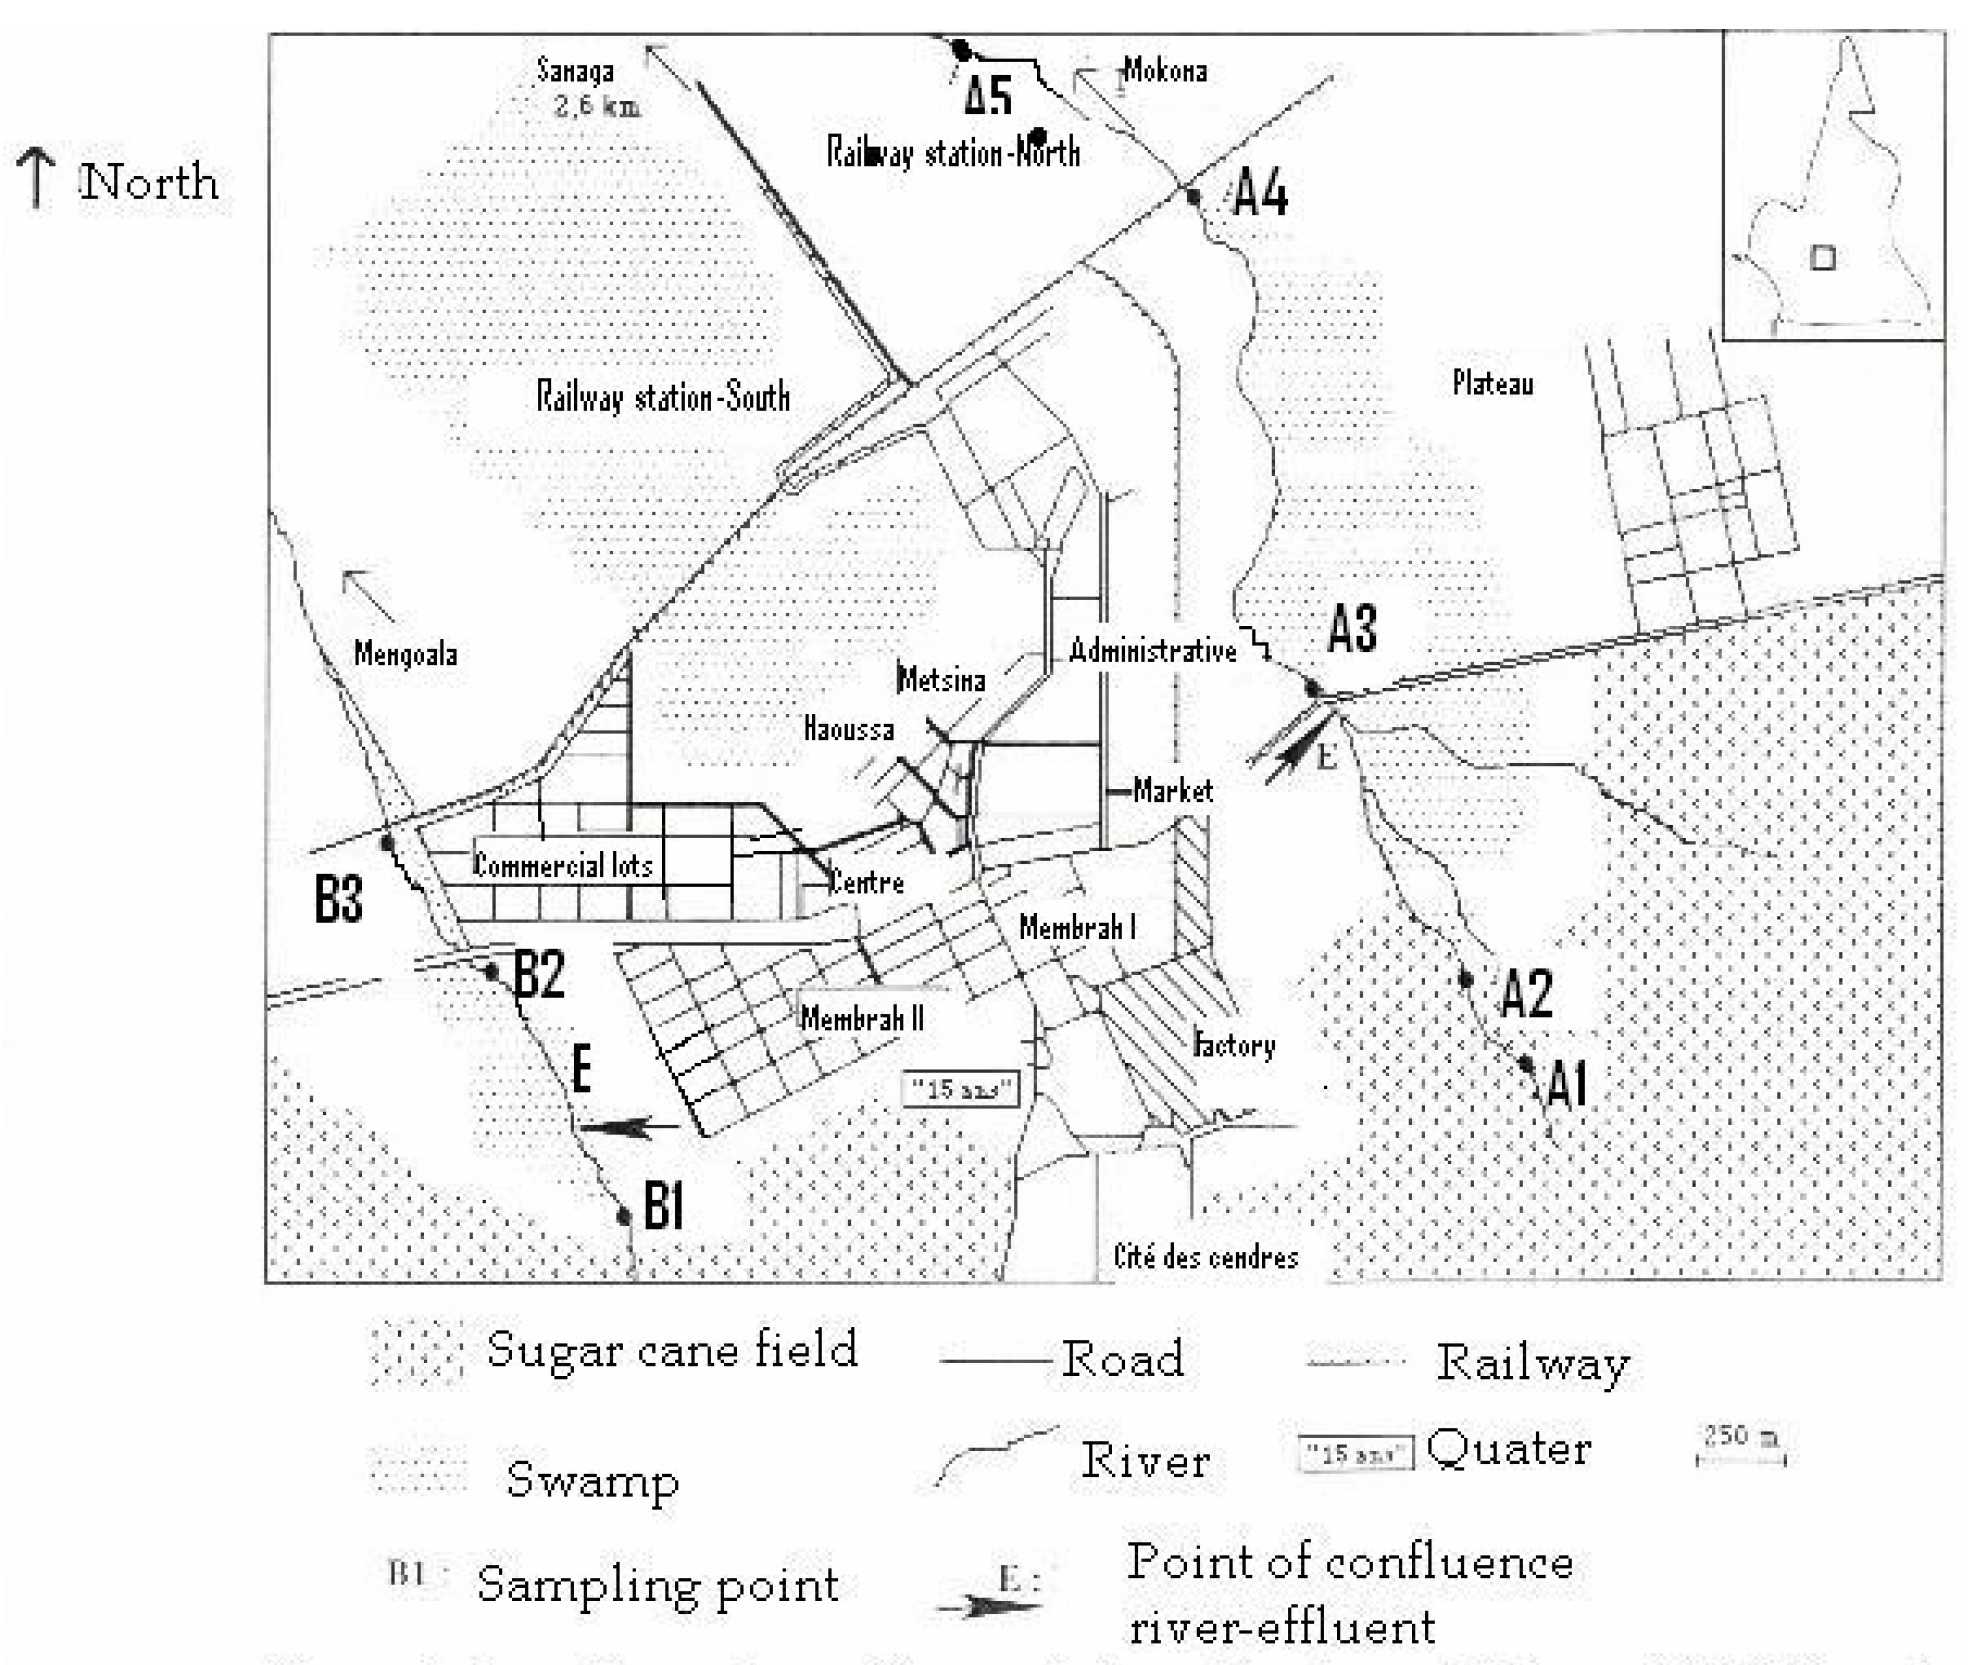
Study Areas

Selection of Sampling Sites
Study Method
Results
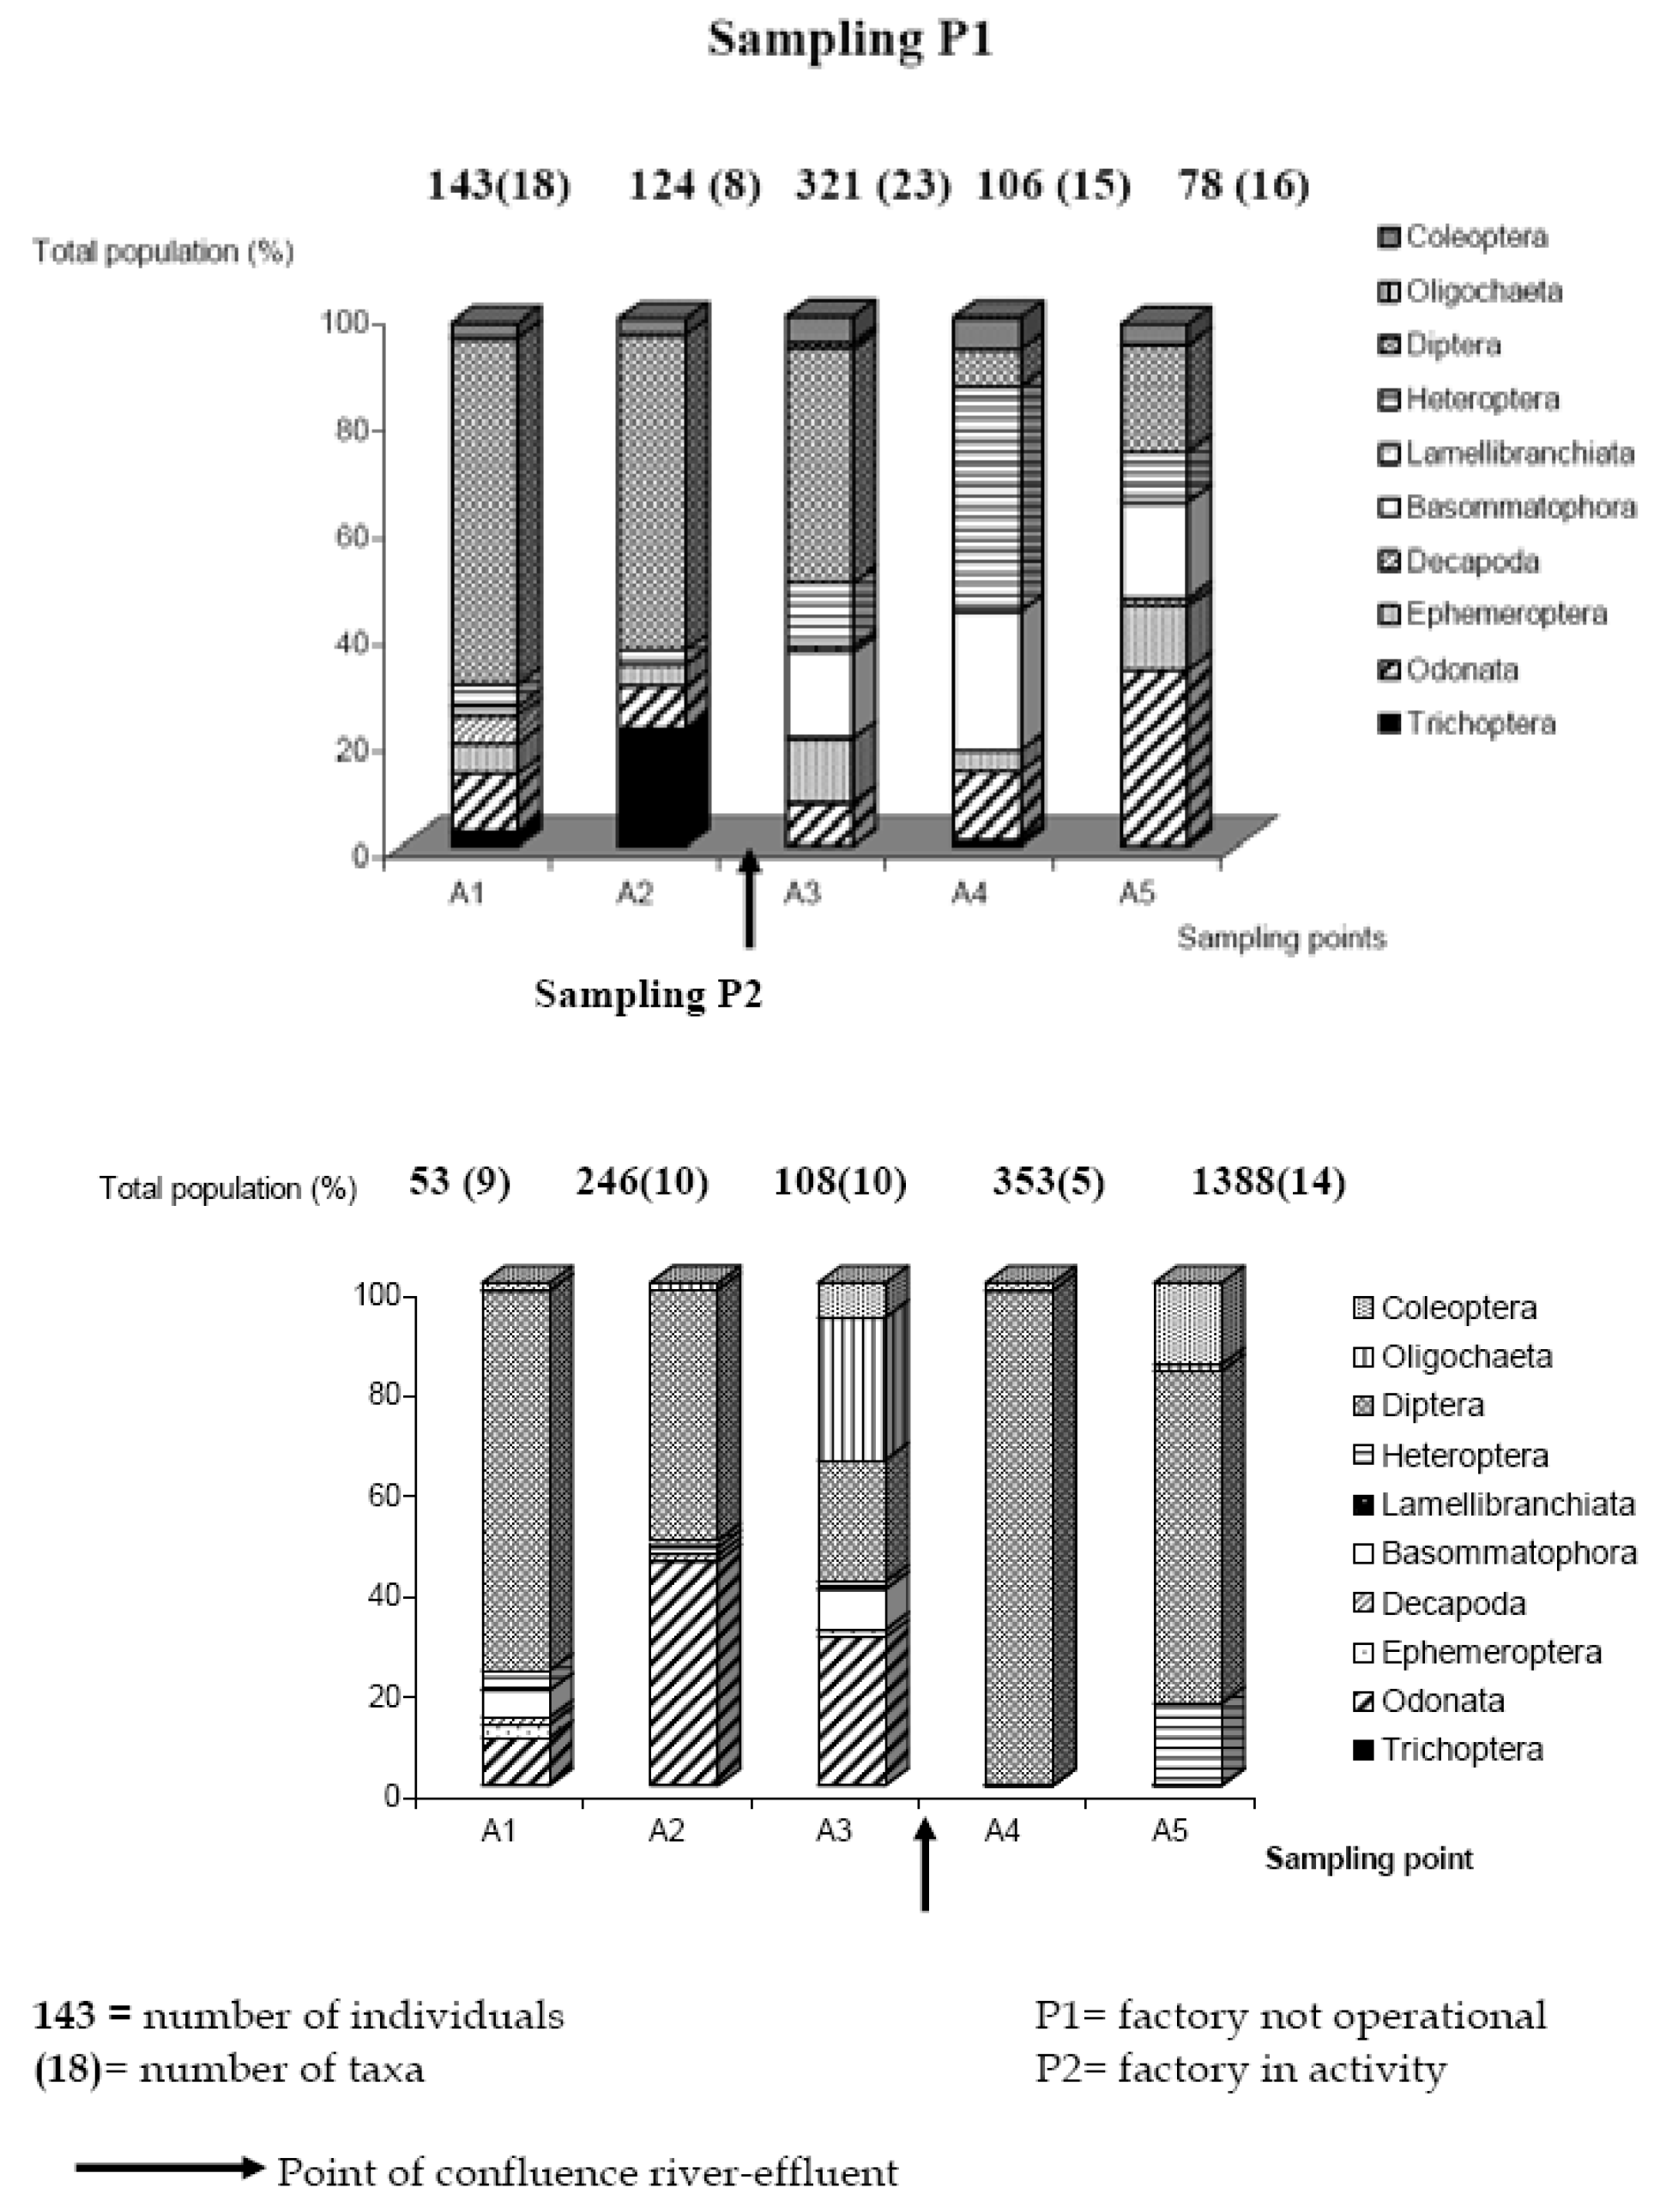
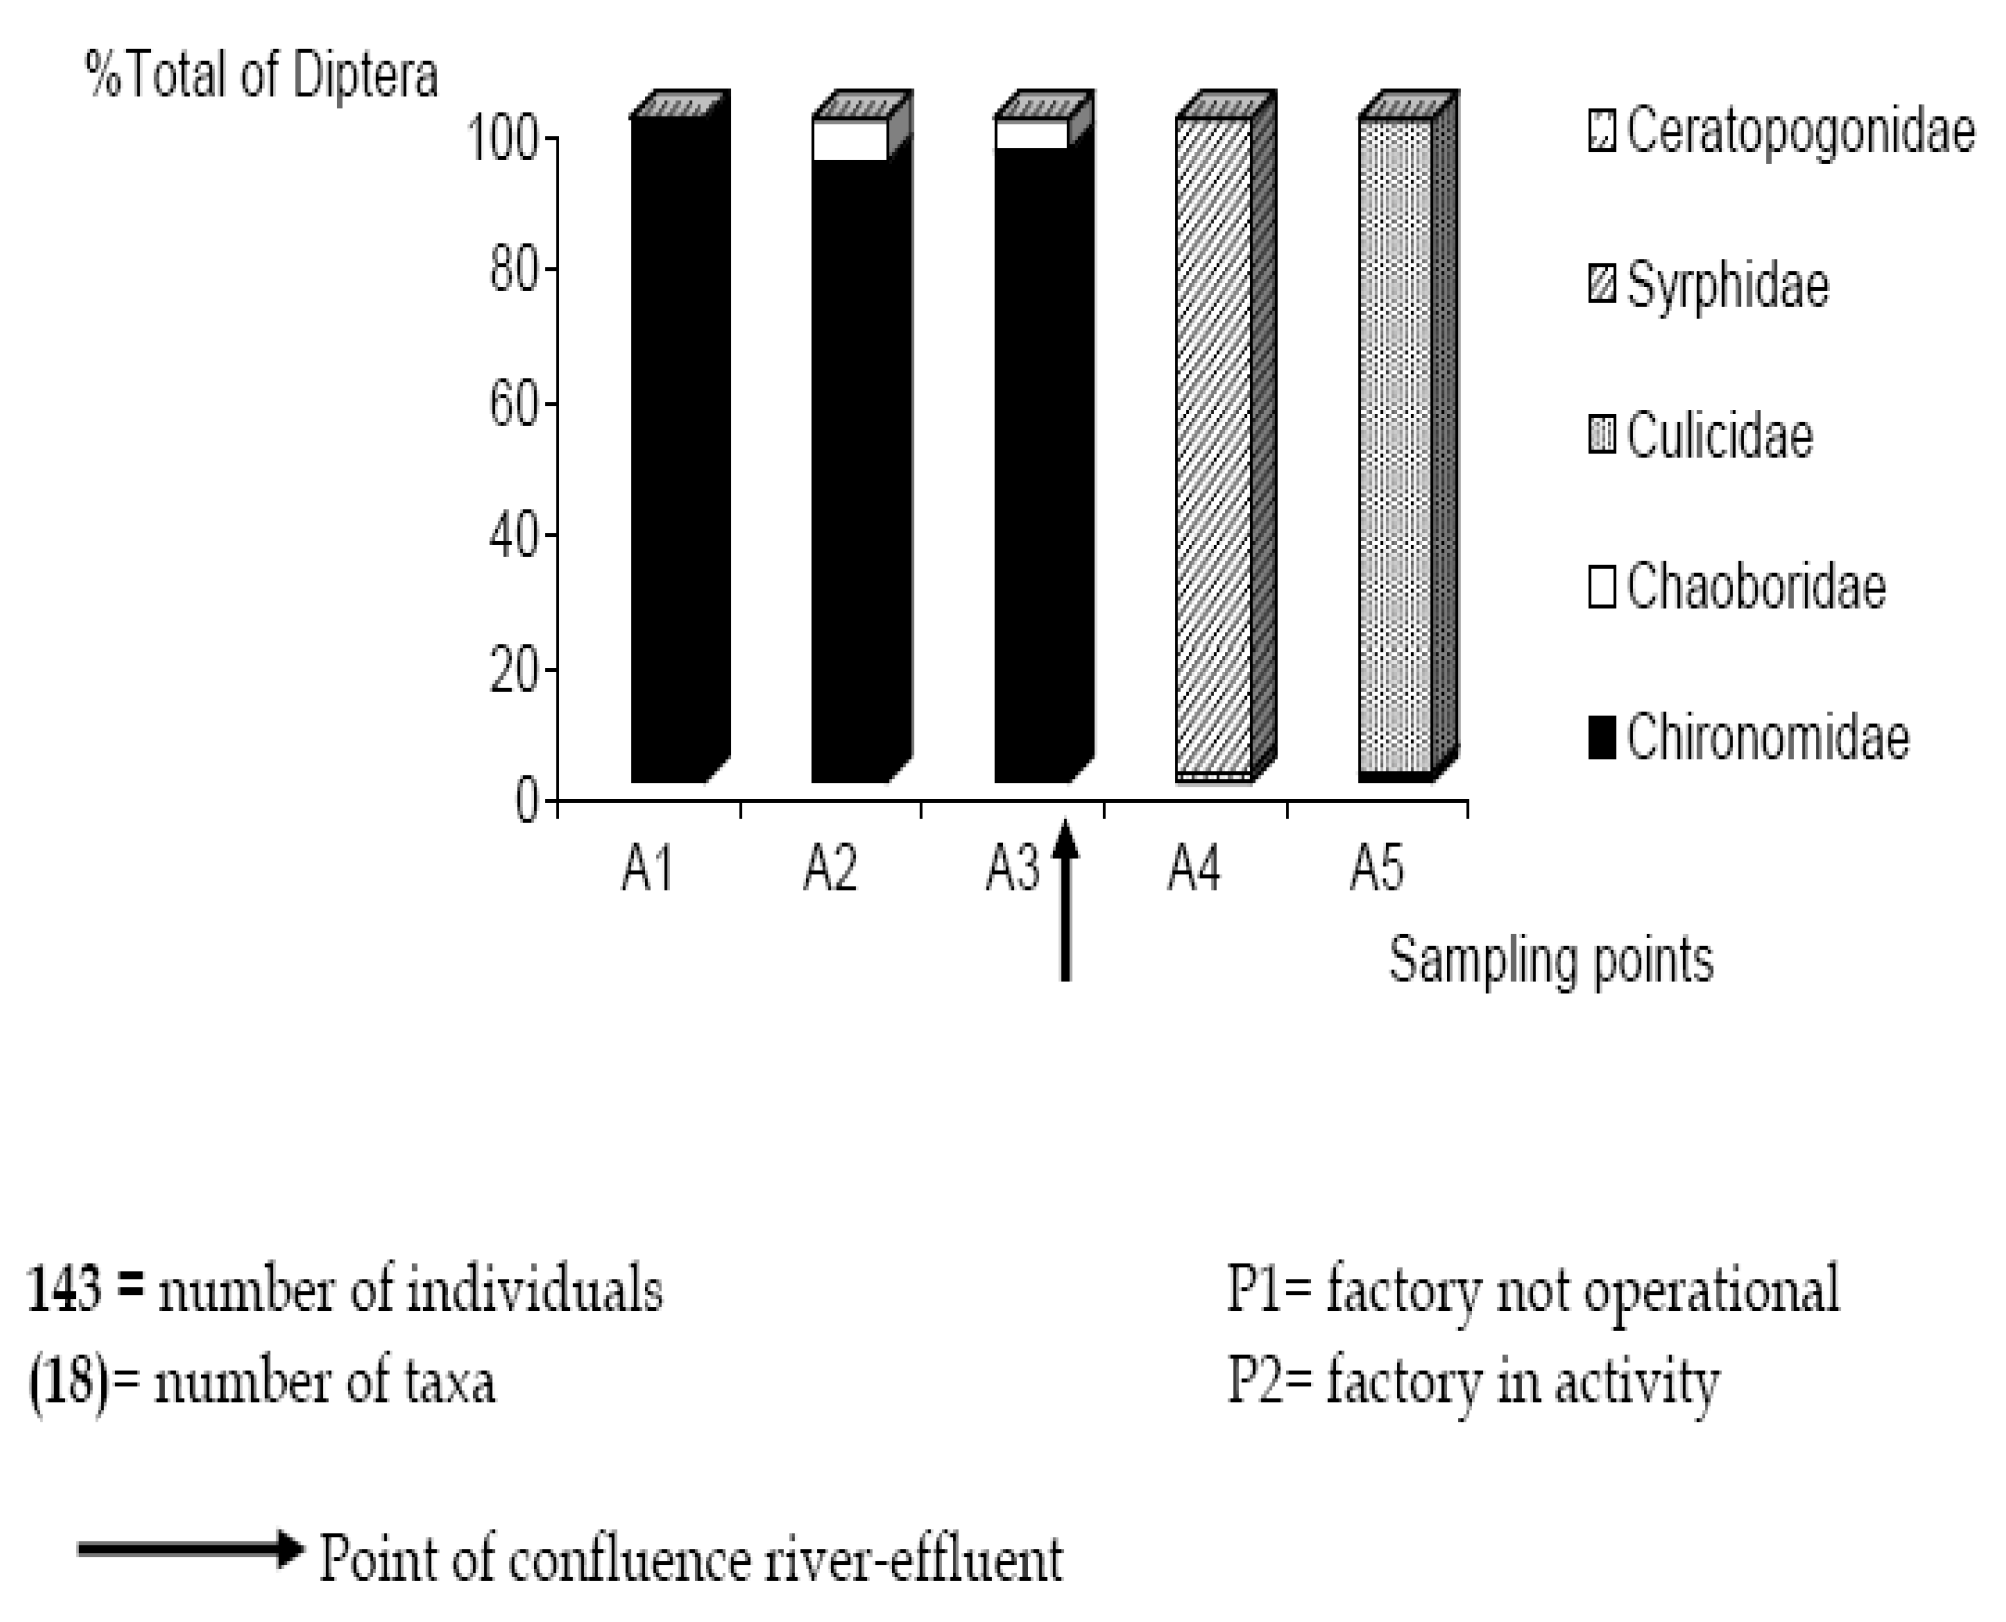
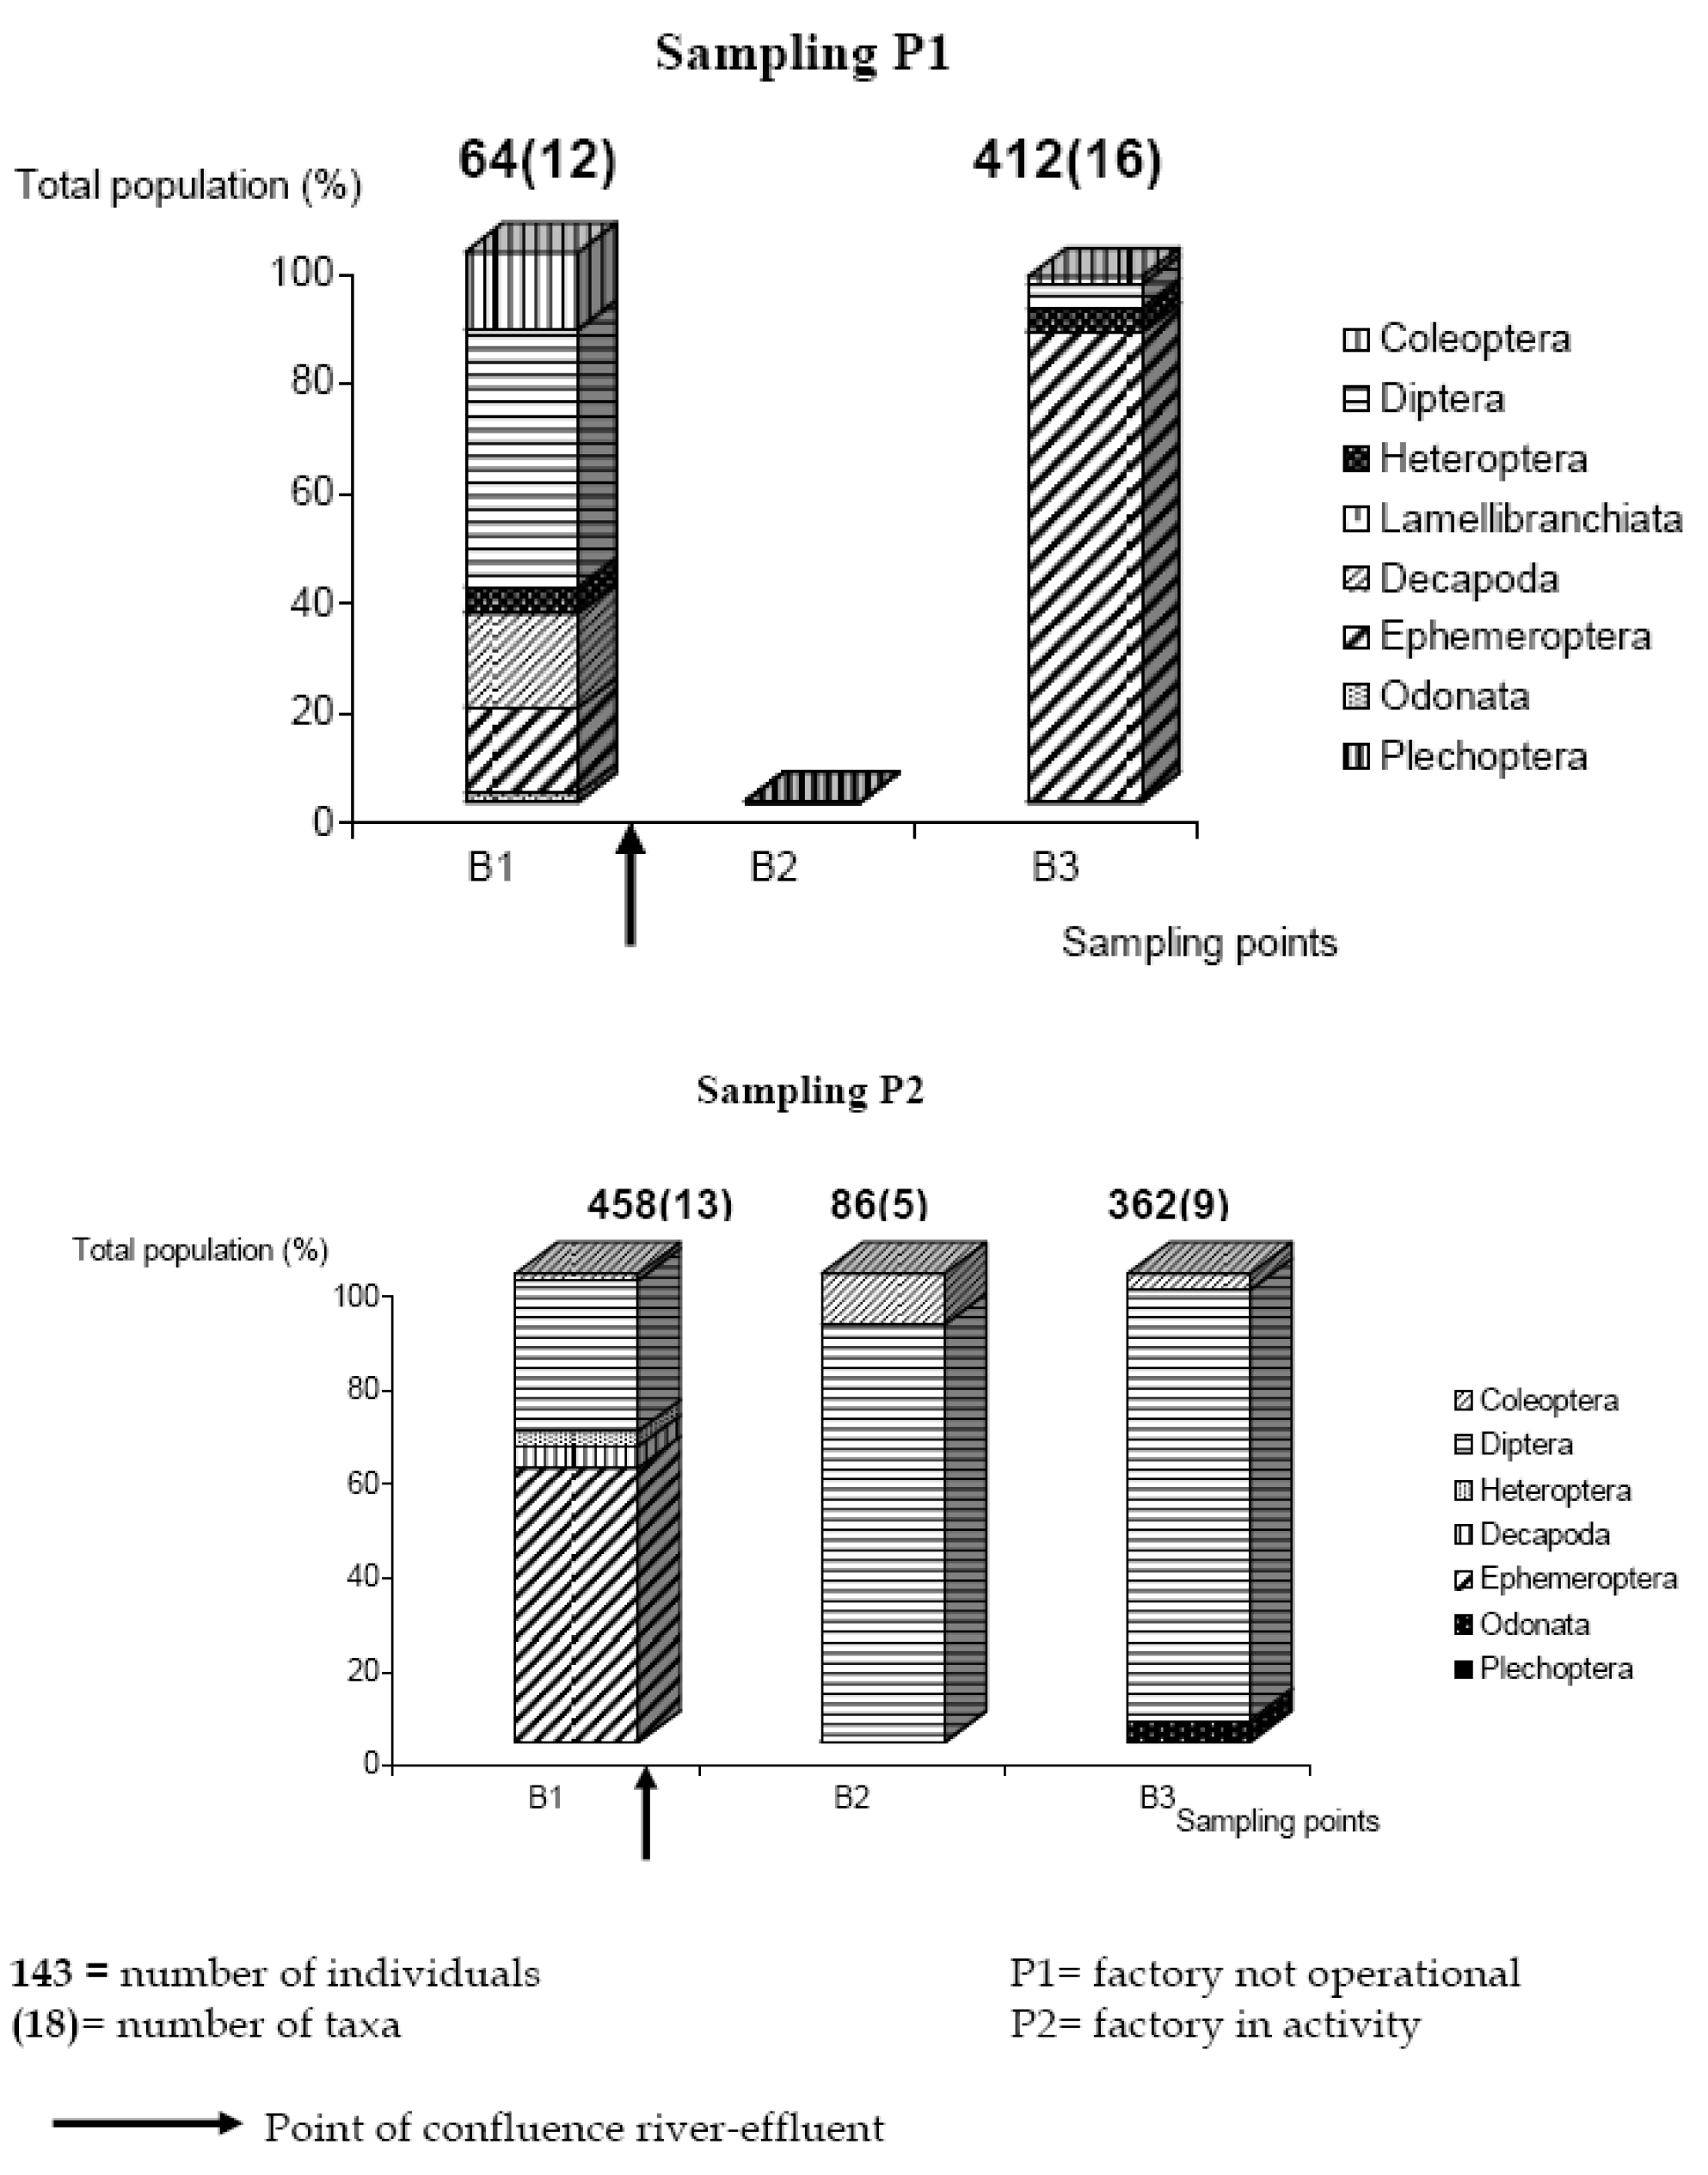
Spatial Variation of the Fauna

| Taxa | Sampling Points | |||||||
| Mokona | Mengoala | |||||||
| AI | A2 | A3 | A4 | A5 | B1 | B2 | B3 | |
| Poaceae | x | x | ||||||
| Panicum brevifolium linn. Panicum calvum stapf | ||||||||
| Echinochloa pyramidalis | x | x | x | x | x | x | ||
| hitchc | ||||||||
| Paspalum conjugatum Berg. | x | |||||||
| Acroceras amplectens stapf | x | |||||||
| Sorghum sp. | x | x | x | x | x | x | x | |
| Pennisetum purpureum schumach. | x | x | x | x | x | x | x | x |
| Commelinaceae | ||||||||
| Aneilema beniniense kunth | x | x | x | |||||
| Basalminaceae | ||||||||
| Impatiens irvingii Hook. F. ex Oliv. | x | |||||||
| Cryperaceae | ||||||||
| Rhynchospora corymbosa | ||||||||
| britcon | x | x | x | x | x | |||
| Scleria verrucosa willd. | x | |||||||
| Polygonaceae | ||||||||
| Polygonum limbatum Meisn | x | x | ||||||
| Onagraceae | ||||||||
| Ludwigia abyssinica A. rich. | x | |||||||
| Mimosaceae Mimosa pudica | x | |||||||
| Hydrocaritaceae Ottelia ulvifolia walp. | x | x | ||||||
| Sampling sites | Rivers | ||
|---|---|---|---|
| Mokona | Mengoala | ||
| Upstream | P1 | 0,47 | 0,16 |
| P2 | 0,39 | 0,13 | |
| Efflent | P1 | 0,03 | 0,01 |
| P2 | 0,06 | 0,0013 | |
| Downstream | P1 | 0,35 | 0,15 |
| P2 | * | * | |
Temporal Variation of the Fauna
| Organisms (Families) | Development stage | A1 | A2 | Efluent | A3 | 44 | A5 | |||||||
|---|---|---|---|---|---|---|---|---|---|---|---|---|---|---|
| PI | P2 | PI | P2 | PI | P2 | P1 | P2 | PI | P2 | PI | P2 | |||
| Diptera | ||||||||||||||
| Syphidhe | Larvae | 23 | 311 | 340 | 1 | |||||||||
| Chironomidae | Larvae | 94 | 40 | 74 | 115 | 145 | 25 | 6 | 15 | 1 | ||||
| Ceratopogonidae | Larvae | 10 | 1 | |||||||||||
| Chaobonidae | Larvae | 2 | ||||||||||||
| Cuicidae | Larvae | 8 | 90 | |||||||||||
| Heteropera | ||||||||||||||
| Nauconde | Adults | 4 | 2 | 2 | 7 | |||||||||
| Corixide | Adults | 1 | 3 | 13 | 1 | 13 | ||||||||
| Nepidae | Adults | 3 | 3 | |||||||||||
| Notonecide | Aduilts | 2 | 2 | |||||||||||
| Mesovelide | Aduilts | 1 | 1 | 1 | 16 | 20 | 1 | |||||||
| Velidae | Adults | 3 | ||||||||||||
| Genidae | Adults | 1 | 3 | 1 | 9 | 1 | 7 | 2 | ||||||
| Hydrometidae | Aduilts | 1 | 1 | 2 | ||||||||||
| Pleidae | Adults | 6 | ||||||||||||
| Decapoda | ||||||||||||||
| Atyide | Adults | 9 | 1 | |||||||||||
| Coleoptera | ||||||||||||||
| Hytaemnda | Adults | 1 | ||||||||||||
| Hytrophidae | Adults | 1 | 1 | 5 | ||||||||||
| Larvae | 2 | 1 | 4 | |||||||||||
| 3 | 5 | 8 | 1 | 2 | ||||||||||
| Gyrnidae | Larvae | 2 | ||||||||||||
| Lymnebidae | larvae | 2 | ||||||||||||
| Elimidae | Adults | 1 | 6 | 1 | ||||||||||
| Larvae | 3 | 1 | ||||||||||||
| Dryopidae | Larvae | 3 | 1 | |||||||||||
| Dytiscidae | Adults | 3 | 7 | |||||||||||
| Hygobidae | karvae | 1 | ||||||||||||
| Ephemeroptera | ||||||||||||||
| Heptagnmidae | Larvae | 4 | 6 | |||||||||||
| Caenidae | Larvae | 一 | ||||||||||||
| Siphlomridae | Larvae | 5 | 20 | |||||||||||
| Ephemendae | Larvae | 3 | 16 | |||||||||||
| Baetdae | Larvae | 2 | 5 10 | 110 | 32 | 15 | ||||||||
| Tichope | ||||||||||||||
| Hytdptilidae Ecnomidae | Larvae Larvae | 24 3 | ||||||||||||
| Phryganeide | Larvae | 5 | ||||||||||||
| Trichoptera prdide Larvae | 1 | |||||||||||||
| Coleoptera | ||||||||||||||
| Hydraenidae | Adults | 1 | ||||||||||||
| Hydrophilidae | Adults | 1 | 1 | 1 | 5 | |||||||||
| Larvae | 2 | 1 | 4 | |||||||||||
| Haliplidae | Adults | 3 | 5 | 8 | 1 | 2 | ||||||||
| Gyrinidae | L arvae | 2 | ||||||||||||
| Lymnebidae | larvae | 2 | ||||||||||||
| EImidae | Adults | 1 | 6 | 1 | ||||||||||
| Larvae | 3 | 1 | ||||||||||||
| Dryopidae | Larvae | 3 | 1 | |||||||||||
| Dytiscidae | Adults | 3 | 7 | |||||||||||
| Hygrobidae | larvae | 1 | ||||||||||||
| Ephemeroptera | ||||||||||||||
| Heptageniidae | Larvae 4 | 4 | 6 | |||||||||||
| Caenidae | L arvae | 1 | ||||||||||||
| Siphlonuridae | Larvae | 5 | 16 | 20 | ||||||||||
| Ephemeridae | Larvae | 3 | 10 | |||||||||||
| Baetidae | Larvae | 2 | 5 | 10 | 110 | 32 | 15 | |||||||
| Trichoptera | ||||||||||||||
| Hydroptilidae | L arvae | 24 | ||||||||||||
| Ecnomidae | Larvae | 3 | ||||||||||||
| Phryganeidae | Larvae | 5 | ||||||||||||
| Trichoptera perlidae Larvae | 1 | |||||||||||||
| Odonata | ||||||||||||||
| Platycnemidae | Larvae | 2 | 1 | 15 | 1 | |||||||||
| Aeschimidae | L arvae | 4 | 1 | 1 | 1 | |||||||||
| Calopterygidae | Larvae | 9 | ||||||||||||
| Coenagrionidae | Larvae | 5 | 2 | 12 | 1 | |||||||||
| Libellulidae | L arvae | 1 | 2 | |||||||||||
| Cordulidae | Larvae | 2 | 11 | |||||||||||
| Basommatophora | ||||||||||||||
| Planorbidae | 2 | 40 | 25 | 12 | ||||||||||
| 9 | ||||||||||||||
| Ferrissidae | 2 | 3 | ||||||||||||
| lymnaeaidae | 6 | 1 | 1 | 1 | ||||||||||
| Lamellibranchiata | ||||||||||||||
| Sphaeriidae | 3 | |||||||||||||
| Anneida | ||||||||||||||
| Achaeta | Adults | 3 | ||||||||||||
| Oligocheata | Adults | 3 | 2 | |||||||||||
| 31 | ||||||||||||||
| Total number of individuals | 143 | 53 | 124 | 246 | 28 | 311 | 321 | 08 | 106 | 353 | 78 | 138 | ||
| Total number of taxa | 18 | 9 | 8 | 10 | 2 | 1 | 23 | 10 | 15 | 5 | 16 | 14 | ||
| Oganism (Family) | Development stage | B 1 | Effluent | B2 | B3 | |||||
|---|---|---|---|---|---|---|---|---|---|---|
| P1 | P2 | P1 | P2 | P1 | P2 | P1 | P2 | |||
| Diptera | ||||||||||
| Simuliidae | Nymphe | 1 | - | |||||||
| Syrphidae | Larvae | 494 | 507 | - | 73 | 320 | ||||
| Chironomidae | Larvae | 29 | 150 | - | 25 | |||||
| Ceratopogonidae | Larvae | 76 | - | 1 | ||||||
| Athericidae | Larvae | 11 | - | |||||||
| Culicidae | Larvae | - | 4 | 18 | ||||||
| Sciomyzidae heteroptera | Larvae | 2 | ||||||||
| Herbride | Larvae | 1 | ||||||||
| Corixidae | Adults | 1 | - | 13 | 11 | |||||
| Nepidae | Adults | - | 1 | |||||||
| Notonectidae | Adults | 1 | - | 6 | ||||||
| Mesoveliidae | Adults | 1 | - | 1 | 3 | |||||
| Veliidae | Adults | 1 | 2 | - | ||||||
| Gerridae | Adults | 2 | - | 1 | 3 | |||||
| Hydrometridae | Adults | 2 | - | 3 | ||||||
| Naucoridae | Adults | 4 | - | |||||||
| Decapoda | ||||||||||
| Grapsidae | Adults | - | 1 | |||||||
| Atyidae plannipenna | Adults | 11 | 20 | - | ||||||
| Osmylidae | Larvae | - | 1 | |||||||
| Coleoptera | Larvae | |||||||||
| Coleoptera | Hydrophilidae | Larvae | 3 | 2 | - | 6 | 2 | |||
| Adults | 2 | - | 1 | |||||||
| Haliplidae | Adults | - | 3 | |||||||
| Lymnebidae | Adults | - | 2 | |||||||
| Gyrinidae | Adults | 2 | - | 2 | ||||||
| Elmidae | Adults | 3 | - | 1 | ||||||
| Dryopidae | Adults | - | 2 | |||||||
| Plecoptera | ||||||||||
| Perlidae | Larvae | - | 1 | |||||||
| Ephemeroptera | Larvae | |||||||||
| Siphlonuridae | Larvae | 9 | 8 | - | 349 | |||||
| potamanthidae | Larvae | 2 | - | |||||||
| Baetidae | Larvae | 260 | - | |||||||
| Odonata | ||||||||||
| Platycnemidae | Larvae | 1 | - | 1 | ||||||
| Basommatophora | ||||||||||
| lymnaeaidae | Adults | 2 | - | 1 | ||||||
| Planorbidae | Adults | - | 5 | |||||||
| Total number of individuals | 64 | 458 | 498 | 594 | - | 86 | 412 | 362 | ||
| Total number of Taxa | 12 | 13 | 1 | 3 | - | 5 | 16 | 9 | ||


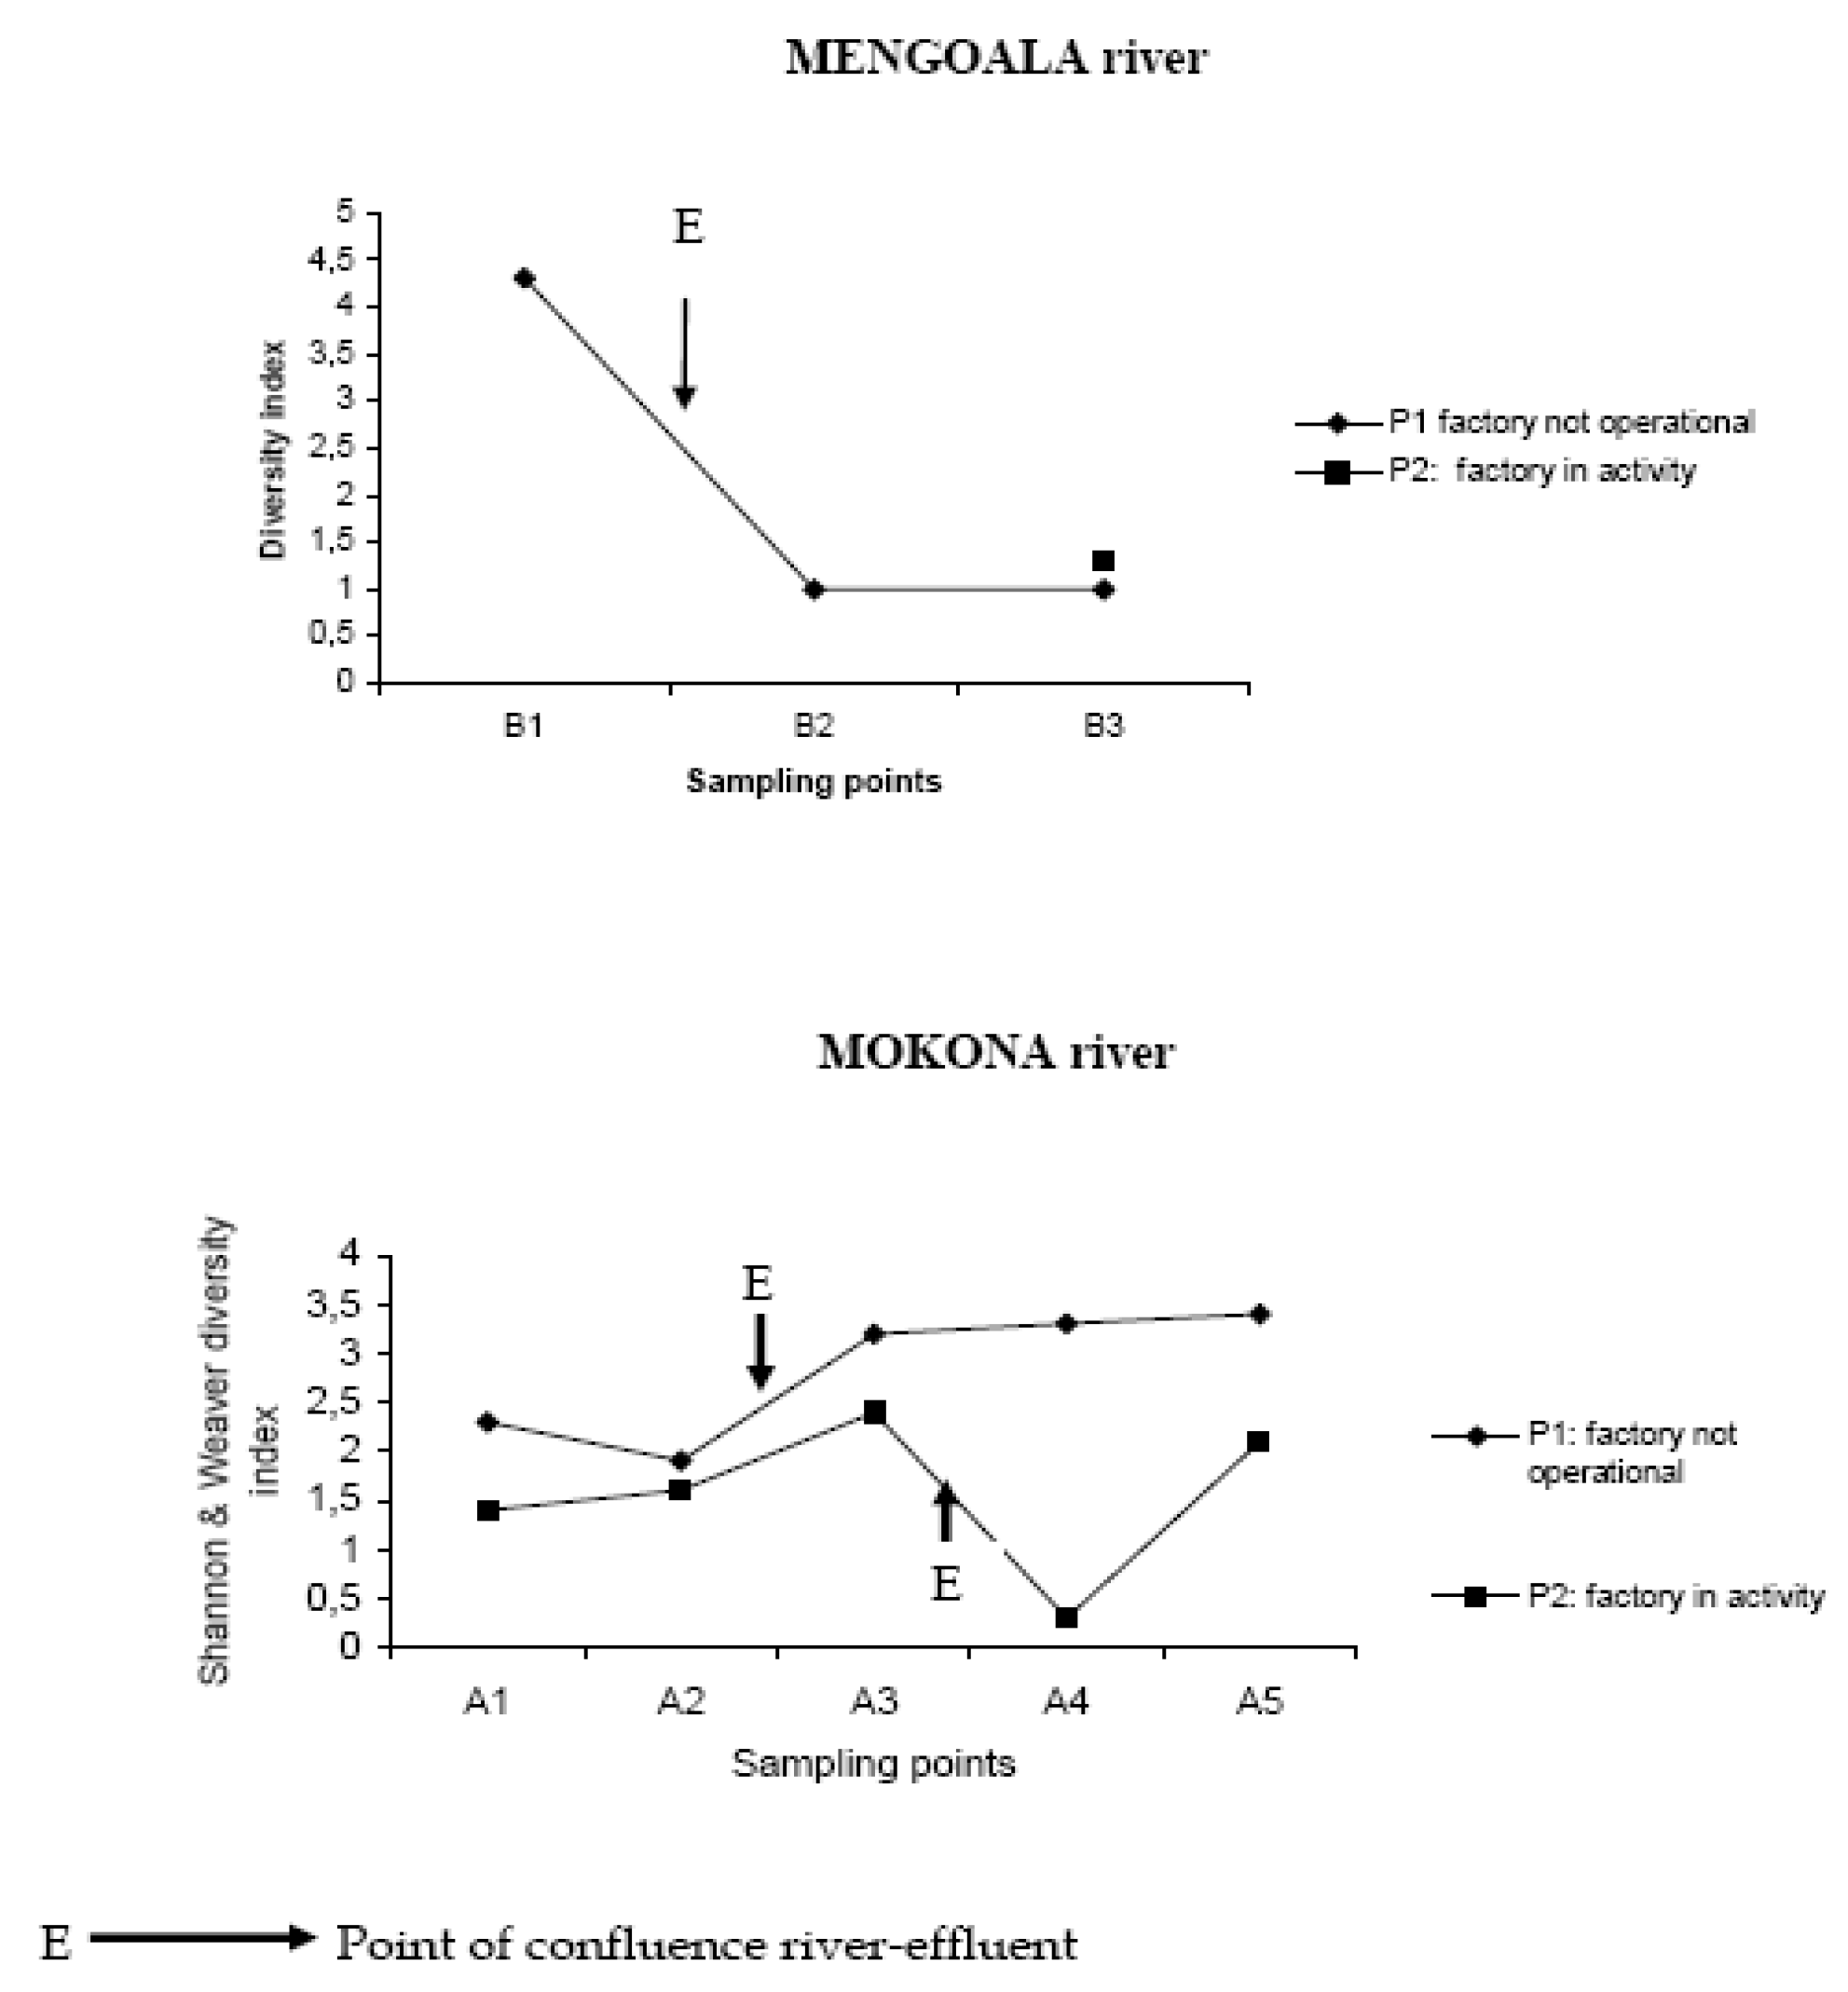
Diversity Index

Discussion

Conclusion
Acknowledgement
References
- La Dou, J. Transfert de technologie «à risquer» vers les pays en développement. Cahiers santé, 1992, 2, 153–160. [Google Scholar]
- Yaméogo, L.; Resh, V. H.; Molyneux D., H. Control of river blindness in West Africa: Case history of biodiversity in a disease control program. Eco. Health, 2004, 1, 172–183. [Google Scholar]
- Moor, J. W. Diversity and indicator species as measures of water pollution in a sub arctic lake. Hydrobiologia, 1979, 66 (1), 73–80. [Google Scholar]
- Ramade, F.; Cosson, R.; Echaubard, M.; Le bras, S.; Moreteau, J. C.; Thybaud, E. Détection de la pollution des eaux en milieu agricole. Bull. Ecol, 1984, 15 (1), 21–37. [Google Scholar]
- Metcalfe, J. L. Biological water quality assessment of running status in Europe. Environ. Pollu, 1989, 60, 101–139. [Google Scholar]
- Resh V., H. Use of freshwater benthic macroinvertebrates and rapid assessment procedures in developing and newly industrialized countries. In: Biological Assessment and criteria: Tools for water resources planning and decision-making. Davis, W. S., Simon, T. P. (Eds). Boca Raton, FL: Lewis Publishers, 1995; pp. 161-177.
- Solimini, A.G.; Gulia, P.; Monfrinoti, M.; Carchini, G. :Performance of different biotic indices and sampling methods in assessing water quality in the lowland stretch of the Tiber River. Hydrobiologia, 2000, 423, 197–208. [Google Scholar]
- Dejoux, C. La pollution d’origine industrielle. In “la pollution des eaux continentals africaines”. ORSTOM (Ed.) Paris, 1988; pp. 289-330.
- Yaméogo, L., Crosa, G., Sammon, Nabé, K., Tholley, D.; Calamari, D.: Long-term assessment of insecticide treatments in West Africa: Aquatic Entomofauna. Chemosphere, 2001, 44, 1759-1773.
- Brown, D. S. Methods. In “Freshwater Snails of Africa and their Medical Importance”. Taylor and Francis (Ed.), London, 1980; pp. 435-450.
- Tchounwou, P. B.; Lantum, D. M.; Monkiedje, A.; Takougang, I.; Barbazan, P. The urgent need for environmental sanitation and safe drinking water supply in Mbandjock, Cameroon. Archives of Environmental Contamination and Toxicology, 1997, 33, 17-22.
- Durand, J. R. Lévêque, C. Faune et aquatique de l’afrique soudano-sahélienne. Tomes I et II. ORSTOM (Ed). Paris, 1980 ; P. 873.
- Takougang, I.; Tchounwou, P. B.; Barbazan, P. Impact des effluents d’un complexe agroindustriel sucrier sur la distribution des mollusques dulçaquicoles à Mbandjock (Cameroun). Cahier Santé, 1993, 3(3), 178–182. [Google Scholar]
- Sladecek, V. System of water quality from the biological point of view. Arch. Hydrobiol, 1973, 7, 1–218. [Google Scholar]
- Mattingly, R. L.; Cummins, K. W.; King, R. H. The chironomid. Hydrobiology, 1981, 77, 161–165. [Google Scholar] [CrossRef]
- Anonymous: Les rivières de Haute-Normandie vues par les invertébrés. Direction Régionale de l’Environnement de Haute-Normandie, 1999.
- Foree, E. G. Industrial wastes. Fermentation industries-pharmaceutical, corn and sugar. J. wat. Poll. Cont. Fed., 1975; 47(6), 1398–1402. [Google Scholar]
- Chutter, F. M. An empirical biotic index of the quality of water in South African streams and rivers. Water Research, 1972, 6, 19–30. [Google Scholar]
- APHA: Standard Methods for the examination of water and wastewater. 17th Edition, American Public Health Association, AWWA, WPGF, Washington DC, USA, 1990.
- Heister, R. D. The biotic index as a measure of organic pollution in steams. Amer. Biol. Teach., 1972, 2, 79–83. [Google Scholar]
- Fore, L. S.; Paulsen, K.; O’Laughlin, K. Assessing the performance of volunteers in monitoring streams. Freshwater Biology, 2001, 46(1), 109-123. [Google Scholar]
Publisher’s Note: MDPI stays neutral with regard to jurisdictional claims in published maps and institutional affiliations. |
© 2008 by the authors. Licensee MDPI, Basel, Switzerland. This article is an open access article distributed under the terms and conditions of the Creative Commons Attribution (CC BY) license (https://creativecommons.org/licenses/by/4.0/).
Share and Cite
Takougang, I.; Barbazan, P.; Tchounwou, P.B.; Noumi, E. The Value of the Freshwater Snail Dip Scoop Sampling Method in Macroinvertebrates Bioassessment of Sugar Mill Wastewater Pollution in Mbandjock, Cameroon. Int. J. Environ. Res. Public Health 2008, 5, 68-75. https://doi.org/10.3390/ijerph5020068
Takougang I, Barbazan P, Tchounwou PB, Noumi E. The Value of the Freshwater Snail Dip Scoop Sampling Method in Macroinvertebrates Bioassessment of Sugar Mill Wastewater Pollution in Mbandjock, Cameroon. International Journal of Environmental Research and Public Health. 2008; 5(1):68-75. https://doi.org/10.3390/ijerph5020068
Chicago/Turabian StyleTakougang, Innocent, Phillipe Barbazan, Paul B. Tchounwou, and Emmanuel Noumi. 2008. "The Value of the Freshwater Snail Dip Scoop Sampling Method in Macroinvertebrates Bioassessment of Sugar Mill Wastewater Pollution in Mbandjock, Cameroon" International Journal of Environmental Research and Public Health 5, no. 1: 68-75. https://doi.org/10.3390/ijerph5020068