Abstract
Through public health studies, specifically on child obesity modeling, research scholars have been attempting to identify the factors affecting obesity using suitable statistical techniques. In recent years, regression, structural equation modeling (SEM) and partial least squares (PLS) regression have been the most widely employed statistical modeling techniques in public health studies. The main objective of this study to apply the Taguchi method to introduce a new pattern rather than a model for analyzing the body mass index (BMI) of children as a representative of childhood obesity levels mainly related to social media use. The data analysis includes two main parts. The first part entails selecting significant indicators for the proposed framework by applying SEM for primary and high school students separately. The second part introduces the Taguchi method as a realistic and reliable approach to exploring which combination of significant variables leads to high obesity levels in children. AMOS software (IBM, Armonk, NY, USA) was applied in the first part of data analysis and MINITAB software (Minitab Inc., State College, PA, USA) was utilized for the Taguchi experimental analysis (second data analysis part). This study will help research scholars view the data and a pattern rather than a model, as a combination of different factor levels for target factor optimization.
1. Introduction
In 2016, the World Health Organization (WHO) reported that around 170 million children below the age of 18 were suffering from obesity and overweight []. Some researchers consider this concern regarding children as one of the greatest and most crucial threats to public health in the last twenty years [,]. Obesity is now acknowledged as a severe hazard to society due to its rapidly expanding prevalence []. Consequently, focus should be geared toward preventing child overweight and obesity.
Previous studies on childhood overweight and obesity modeling illustrate that the main factors are family environment and children’s lifestyle. A number of studies indicate that family environment is an important determinant of children’s lifestyle [] and both have an impact on child BMI level. Hence, information on children’s lifestyle is often collected based on household environment surveys. Decision makers are able to use such information to allocate resources prudently when planning activities aimed at improving the overall lifestyle of children and adolescents. Previous studies specify that several factors are associated with the children’s lifestyle index, including parental lifestyle [] and parental socioeconomic status [,,]. In general, family socio-economic status [,,], child-feeding behavior [], children’s physical activity [,,] and food intake [] are the most familiar factors involved in childhood obesity modeling. Moreover, some researchers added television viewing and computer use [,] in studies to develop models to analyze children’s health and lifestyle. With the current development of digital technologies, especially mobiles and tablets, the daily average use has been increasing among children, youth and adults. Progressively prevalent social media (e.g., Facebook, Instagram, Twitter, YouTube, WeChat, etc.) have altered many aspects of our daily lives. Consequently, the structure of children’s lifestyle in terms of social media usage has also changed.
While the main feature of Web 1.0 was cognition and of Web 2.0 connection, the main feature of social media today is the provision of a space for cooperation []. Cooperation promotes the concept of online communities based on social participation []. Waring et al. [] showed that in terms of weight loss, online communities provide social support for users to engage with others in weight loss activities. A survey by Pagoto et al. [] showed that for 100 adults, Twitter followers are more significant sources of encouragement for weight loss rather than family and friends. Higher positive feedback was received from Twitter followers, and thus greater attempts at weight loss have been reported. Evans et al. [] found that bloggers who report their weight loss goals on their weblogs feel accountable to their readers and thus increase related activities. Waring et al. [] argued that “even in the absence of interaction, adults may find following others attempting to lose weight, obesity experts, and related organizations’ social media feeds for information helpful to their weight loss efforts.” Gruver et al. [] suggested that social media peer groups may offer a promising new way of providing families with the knowledge, strategies and support they need to adopt obesity prevention behaviors.
In contrast, social media can also have negative effects. Mazur et al. [] showed that children who use social media more are at greater risk of sleep disturbance that leads to obesity. They reported a 40% decrease in obesity in children whose parents limit their screen-time than in children without such limitation. Content that users consume on social media is another important subject. Holmberg [] discussed the persuasive effect of food marketing through social media on obesity. He argued that social media can be used proactively in clinical practice, to inspire people to behave in healthier ways, such as cook at home and consume healthier diets. For example, users can share photos of their kitchen and healthy meals while clinical staff provide feedback. Nonetheless, Swindle et al. [] believe that digital technology delivers solutions and can facilitate nutrition educators to connect with at-risk populations. The Internet, for instance, has long been the most extensive supply of health data []. Studies report the successful use of social media like Facebook for educating parents on child obesity prevention []. However, to develop a research framework for obesity Hall et al. [] suggested factors within broader social and environmental contexts that contribute to the risk of obesity. A current study by Huang et al. [] proved that daily average technology use has a significant effect on children’s weight. Moreover, they found that the relationship between family socio-economic status, technology use by children and children’s weight is stronger in the obesity model than the non-obesity model. However, there are insufficient studies on the impact of daily social media use on children’s BMI level according to different educational levels from primary to high school.
Iran has been facing the problem of child obesity and overweight in the last two decades. A study by Soltani et al. [] demonstrated that more than 18% of children in elementary school (6–11 years old) exhibit the highest prevalence and risk of obesity and overweight. The challenges of obesity and overweight during childhood and the teenage years have negative and dangerous ramifications for premature mortality and morbidity as well as physical disability later in adulthood []. The association between obesity/overweight and eating habits while watching television was studied by Ghobadi et al. [] in Iran. Unfortunately, there are very few studies in Iran that investigate the impact of child behavior like technology use, average sleep time and physical activity considering the family environment and especially the family socio-economic status, child-feeding behavior and children’s BMI level. Nevertheless, research on the simultaneous integration of the interrelationships among three well-known concepts, i.e., family socio-economic status, family child-feeding behavior and children’s healthy and unhealthy food intake into one model remains scarce.
Descriptive statistics [], Analysis of Variance (ANOVA) [,], neural networks [], regression [,,,,] and fuzzy sets [] are popular statistical methods of analyzing obesity. Among these statistical modeling techniques, regression (bivariate or multivariate) is the most widely used to analyze child obesity modeling. In recent decades, a new modeling application, structural equation modeling (SEM), has been applied in child obesity analysis studies []. With the SEM technique it is possible to hypothesize all kinds of interactions and associations among research variables in a single causal framework. This approach is supportive for research scholars to better understand the concept of latent variables and their action within the model and output interpretation. This method has been employed in a wide range of studies, especially in public health [,,]. Ordinarily, SEM has a robust capability of combining both measurement variables (observed) and constructs (non-observed) with the causal relations among them, which leads to a dependent (or output) variable. SEM has served as a better alternative to general linear models (GLMs), such as linear or non-linear regression, factor analysis, etc.
Statistical modeling like regression, SEM, partial least squares (PLS) or even mathematical modeling techniques including neuro-fuzzy inference systems can determine the significant independent (input) variables. However, they are not able to illustrate which levels or categories of independent variables lead to higher, lower or nominal dependent (output) variable rates. Therefore, statistical or mathematical modeling techniques cannot answer the question: what level or category of independent variables leads to higher or lower dependent variables? The Taguchi method can answer this question. This method has been applied in various engineering studies [,] but Taguchi experimental analysis lacks in public health studies. Therefore, the main purpose of this study is to introduce the Taguchi method to identify a pattern that combines input variables that lead to child obesity.
2. Taguchi Method Structure
The Taguchi method is based on measuring the standard deviation and calculating the variation in the expected value as follows:
- High standard deviation denotes that the observed values are spread out from the expected value due to noise factors.
- Lower standard deviation denotes that the observed values are near the expected value on account of noise factors.
It is not easy to control noise factors, but researchers believe that both observed and noise factor values can be controlled by the Signal-to-Noise (SN) ratio. The SN ratio defines the impact of noise factors on performance characteristics and quantifies the variability []. Based on optimization type, there are three SN applications, which are defined as follows:
- (a)
- if seeking an optimal situation based on a smaller rate.
- (b)
- if seeking an optimal situation based on a larger rate.
- (c)
- if seeking an optimal situation based on a nominal rate.
where y is the observed data, n is the number of observations, is the average of observed data, and is the variance of y.
Figure 1 shows the analysis process based on the Taguchi method.
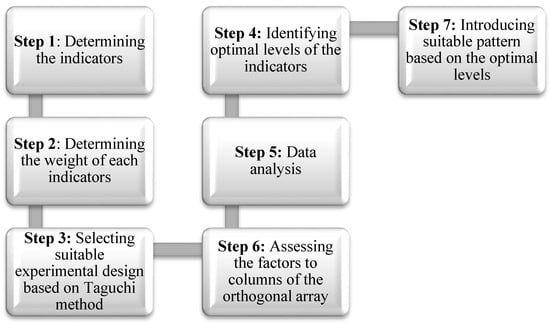
Figure 1.
Taguchi method analysis process [].
3. Materials and Methods
3.1. Sampling Procedure
The cross-sectional research design was applied in the current study. According to the statistical sampling concept, cross-sectional research design applies any assumed research population sample at one point in time to obtain the essential data. The education system in Iran is divided into two main levels:
- Primary school level: 6 years long, from 6 years old (grade 1) to 11 years old (grade 6),
- High school level: 6 years long, from 12 years old (grade 1) to 17 years old (grade 6).
Both primary school and high school students were considered for the data collection. The data were collected in Tehran, Iran, from 5 September 2017 to 20 February 2018. Tehran has 35 public primary schools and 62 high schools. A combination of cluster and stratified sampling was used in the current study. The data collection contained three steps. The first step entailed cluster sampling, whereby every high school and primary school reflected one cluster. All schools were contacted by phone and email to explain the project objectives and request collaboration for this research. At the end, 12 high schools and 19 primary schools confirmed participation in this project. In the first sampling step where every school was denoted a cluster, a total of 31 clusters (12 + 19 = 31) were obtained. Sixty (60) questionnaires were distributed to every cluster (school). Stratified sampling entailed the second step of the sampling procedure. Here, six strata (every school grade = 1 stratum) were considered in every cluster. Every school has six grades (six strata), and 10 questionnaires were distributed for each stratum. In the third step, random sampling was used to select participants from volunteer parents. Therefore, the sample number was 31 × 6 × 10 = 1860 questionnaires. Eighteen (18) bachelor and master students of management and public health were trained for the data collection phase.
3.2. Measuring the Indicators
3.2.1. Obesity Level
In this study, BMI represents the obesity level. Song et al. [] defined BMI as a measure of relative size based on the mass and height of an individual with the following formula:
Child BMI is measured in the same way as for adults, except it is then compared to the typical values of other children of the same age. Instead of comparing against overweight thresholds and fixed underweight values, the BMI is compared against a percentile of children of the same gender and age []. Table 1 provides the child BMI categories. A BMI below the 5th percentile indicates underweight and above the 95th percentile, obesity. Children with a BMI between the 85th and 95th percentiles are considered overweight []. The weight and height information were collected from the students’ health cards. The children’s BMI levels were measured by considering 1, 2, 3, 4, and 5 for ‘underweight,’ ‘normal range,’ ‘at risk,’ ‘moderately obese’ and ‘severely obese.’

Table 1.
BMI categories for children.
3.2.2. Family Socio-Economic Status
In the current study, family socio-economic status was measured in terms of four criteria: father and mother’s age, education, income and work experience, as follows:
- Age: (a) less than 31 years old (value 1); (b) 31–40 years old (value 2); (c) 41–50 years old (value 3); (d) 51–60 years old (value 4); (e) over 60 years old (value 5).
- Education: (a) less than high school (value 1); (b) high school (value 2); (c) diploma (value 3); (d) bachelor (value 4); (e) master or PhD (value 5).
- Job Experience: (a) less than 5 years (value 1); (b) 5 to 10 years (value 2); (c) 11 to 15 years (value 3); (d) 16 to 20 years (value 4); (e) over 20 years (value 5).
- Income: (a) less than 2MT [MT: Million Tomans] per month (value 1); (b) 2 to 3MT per month (value 2); (c) 3 to 4MT per month (value 3); (d) 4 to 5MT per month (value 4); (e) over 5MT per month (value 5).
3.2.3. Food Intake of Children
Kröller and Warschburger [] introduced seven factors to measure the food intake of children, which is divided into two groups: healthy and unhealthy food intake. This concept was applied in the present work to measure the food intake of children. Healthy food intake includes the consumption of whole grain products (including whole grain rice, pasta, bread, and cereals), fruits (including all kinds of unsweetened fruits, frozen or fresh) and vegetables (including frozen, dry or fresh), whereas unhealthy food intake entails the consumption of fast food (e.g., hot dogs, pizza, and burgers), chips (e.g., nuts, chips, and pretzels), soft drinks (including all types of sweetened beverages) and sweets (e.g., cookies, candies, chocolate, and cake). Every indicator was measured using a five-point scale. The responses obtained were coded as 1 for ‘never’, 2 for ‘rarely, 3 for ‘sometimes’, 4 for ‘mostly’ and 5 for ‘always.’
3.2.4. Family Child-Feeding Behavior
Birch et al. [] designed the child feeding questionnaire (CFQ) for measuring family child-feeding behavior. The six factors in CFQ are modeling, controlling, pressuring, rewarding, monitoring and restricting. A five-point scale was also applied to measure these indicators. The responses obtained were coded as 1 for ‘never’, 2 for ‘rarely, 3 for ‘sometimes’, 4 for ‘mostly’ and 5 for ‘always.’
3.2.5. Other Factors
In addition to the above factors, the following are also included in the present research framework:
Children’s Social Media Use
Social media has been defined by different authors. Kaplan and Haenlein [] define social media as “a group of internet-based applications that build on the ideological and technological foundations of Web 2.0, and that allow the creation and exchange of UGC”. Khajeheian [] shows that by advances in technology, social media can be used in various devices, such as mobile-devices, laptops and PCs, tablets, video consoles and even television sets. Doub et al. [] consider social media as a platform which is accessible through Internet-connected devices including computers, tablets, and smartphones.
In our study, the average number of hours per day that children use social media (e.g., on TV, mobile, tablet, etc.) is divided into four categories: (a) less than 1 h per day (value 1); (b) 1 to 2 h per day (value 2); (c) 2 to 3 h per day (value 3); (d) 3 to 4 h per day (value 4) and (e) more than 4 h per day (value 5).
Children’s Physical Activity
The average number of times per week that children do physical activities is coded into four categories: (a) none (value 1); (b) 1 or 2 times per week (value 2); (c) 3 or 4 times per week (value 3); (d) 5 or 6 times per week (value 4) and (e) every day (value 5).
Children’s Sleep Amount
The average number of hours per day that children sleep are divided into four categories: (a) less than 6 h per day (value 1); (b) 6 to 7 h per day (value 2); (c) 7 to 8 h per day (value 3); (d) 8 to 9 h per day (value 4) and (e) more than 9 h per day (value 5).
4. Results
From 1860 questionnaires distributed (1140 to primary schools and 720 to high schools), 1563 were completed and returned (958 from primary schools and 611 from high schools).
4.1. Descriptive Statistical Analysis
Table 2 and Table 3 and Figure 2, Figure 3 and Figure 4 present the research variable distribution among primary and high school students. Based on Table 2, 12.00% of primary school children (115 out of 958) from the study sample are underweight, 72.55% (695 out of 958) are in the normal range and 15.44% (148 out of 958) are overweight and obese. However, among high school students, 15.06% are underweight, 65.79% are in the normal range, and 19.14% are overweight.
Table 2.
Body mass index (BMI) distribution.
Table 3.
Distributions of parents’ characteristics (primary school and high school).
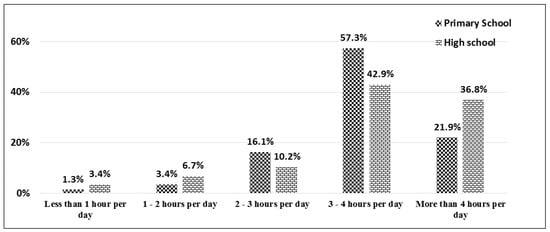
Figure 2.
Distribution of children’s social media use among primary and high school students.
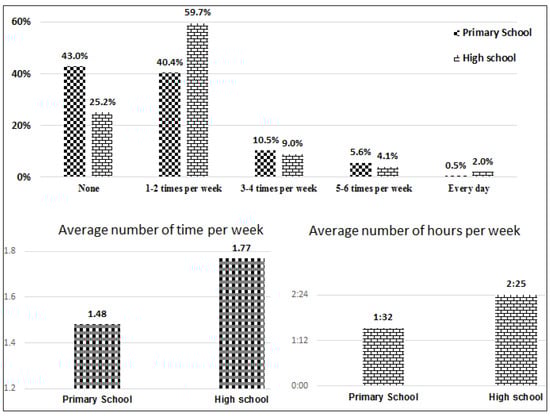
Figure 3.
Distribution of children’s physical activity among primary and high school students.
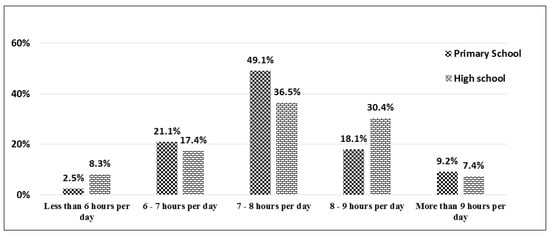
Figure 4.
Distribution of children’s sleep amount among primary and high school students.
Among the sample population, 57.3% of primary school students and 42.9% of high school students use social media 3–4 h per day. Moreover, 21.9% of primary school students and 36.8% of high school students use social media more than 4 h per day. In general, 79.2% of primary school students and 79.7% of high school students use social media more than 3 h per day (Figure 2).
From 958 primary school students, 43% do no physical activity, 40.4% do physical activity 1–2 times per week, 10.5% do 3–4 times per week, 5.6% do 5–6 times per week, and only less than 1% do physical activity every day. However, among high school students, 25.2% do not exercise, 59.7% do so 1–2 times per week, 9% do 3–4 times per week, 4.1% do 5–6 times per week and around 2% do exercise every day (Figure 3).
Based on Figure 4, most primary school students (49.1%) and high school students (36.5%) get 7–8 h of sleep per day. More than 18% of primary school students get 8–9 h of sleep per day. However, among high school students, more than 30% get 8–9 h of sleep per day.
Based on Table 3, for the primary school group the fathers’ age categories are 41–50 years old (52.4%), then 31–40 years old (25.9%) and 51–60 years old (12.7%). For the high school group the fathers’ age categories are 41–50 years old (49.8%) and 51–60 years old (36.2%). In the primary school group, 6.2% of mothers are less than 31 years old, 26.6% 31–40 years old, 37.9% 41–50 years old, 25.9% 51–60 years old, and 3.4% over 60 years old. For the high school group, the distribution is: 0.7% (less than 31 years old), 36.8% (31–40 years old), 39.6% (41–50 years old), 21.6% (51–60 years old) and 1.3% (over 60 years old).
The highest education level for parents is diploma. More than 57% of fathers and around 35% of mothers of primary school students have a diploma. These values for high school students are 55% (father) and 32.9% (mother). Almost 27% and 37% of fathers of primary school and high school students have bachelor degrees, and 37% and 33% of mothers have bachelor degrees respectively (Table 3).
4.2. SEM Analysis
Figure 5 illustrates the SEM research framework for both primary and high school students. Seven factors are considered as research model inputs. Four factors including children’s healthy food intake, children’s unhealthy food intake, family socio-economic status and family child-feeding behavior are latent constructs. The remaining factors, including children’s social media use, children’s physical activity and children’s sleep amount are measurement structures.
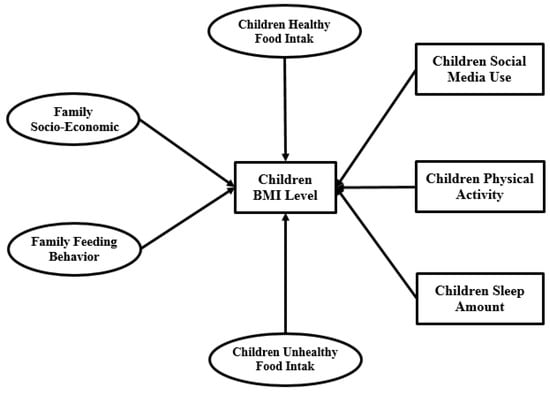
Figure 5.
SEM research model.
4.2.1. SEM Analysis Validity and Reliability
Fornell, Larcker [] defined the following terms and conditions for the reliability and validity of a questionnaire:
- (a)
- Validity: for every latent variable the Cronbach’s alpha value must be equal to or higher than 0.7.
- (b)
- Reliability:
- The factor loading of every indicator of all latent variables must be higher than 0.70.
- The average variance extracted (AVE) for every latent variable must be equal to or higher than 0.50.
Figure 6 represents the Cronbach’s alpha outputs of four latent variables for both primary and high school. Evidently, all indices are higher than 0.7. Therefore, the research model validity is accepted.
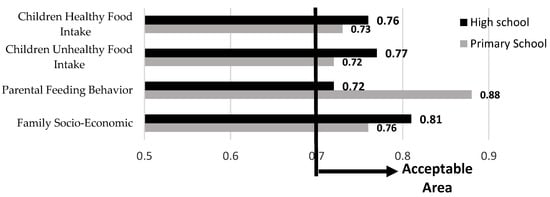
Figure 6.
Cronbach’s alpha outputs.
Table 4 presents the factor loadings of children’s healthy food intake, children’s unhealthy food intake, family socio-economic status and family child-feeding behavior in both primary and high school models.
Table 4.
Factor loading analysis of the research latent variables.
Table 4 presents the factor loadings of the indicators of four research latent variables for both primary and high school separately. In the primary school model the age (father), age (mother), education (father), and modeling, and in the high school model the age (father), age (mother), rewarding, modeling and restricting have lower factor loadings (below 0.7). Therefore, these indicators must be excluded from the SEM analysis. By excluding some indicators, the study reliability is thus confirmed. Figure 7 presents the Average Variance Extracted (AVE) analysis outputs for both primary and high school levels. This figure illustrates that all research group variables have acceptable AVE values.
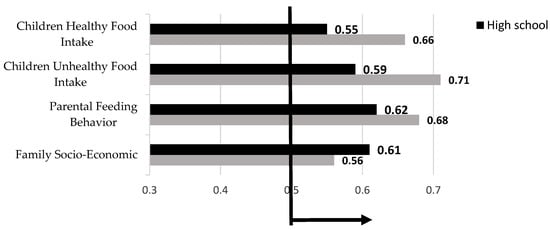
Figure 7.
AVE analysis outputs.
4.2.2. Normality Testing
In SEM analysis, kurtosis and skewness are the most familiar indices for normality testing. If the absolute value of the kurtosis index is below 7 and the skewness index value is below 2, then the normality of the indicator is acceptable. Table 5 provides the normality test analysis of each variable for both primary and high school models. The normality of all indicators (which was accepted according to Section 4.2.1.) is accepted individually according to the skewness and kurtosis outputs. Furthermore, based on the multivariate normality test output, the kurtosis values are 8.391 and 9.023 for primary and high school. These values are lower than 10, and therefore the multivariate normality is accepted [].
Table 5.
Normality test.
4.2.3. Model Fitting
Figure 8 shows the output of SEM model fitting. The goodness of fit index (GFI), relative fit index (RFI), incremental fit index (IFI), Tucker Lewis index (TLI), comparative fit index (CFI), and normed fit index (NFI) values are within acceptable ranges.
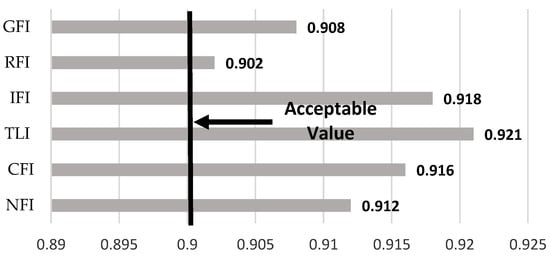
Figure 8.
Model fit analysis.
4.2.4. Multicollinearity Analysis
In SEM analysis, multicollinearity among latent variables is a serious problem. Weak discriminant validity of the research model employed usually causes multicollinearity. In Figure 9, the double arrow represents the covariance among latent variables. Kline and Klammer [] determined that if the correlation between two latent variables is bigger than 0.85, the research model has a multicollinearity problem. Based on the SEM measurement model outputs presented in Figure 9, the correlation among the four latent variables does not exceed 0.85 for both primary and high school, which validates there is no multicollinearity in the current research model.
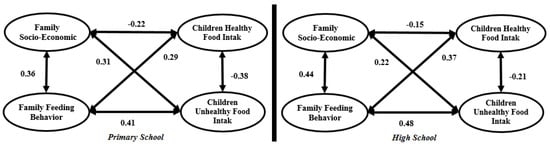
Figure 9.
Full measurement model.
4.2.5. Structural Model
A structural model is used to recognize the hypothesized relationship among research variables, which is linked to the presumed model’s conception. Figure 10 and Table 6 present the structural primary and high school models.
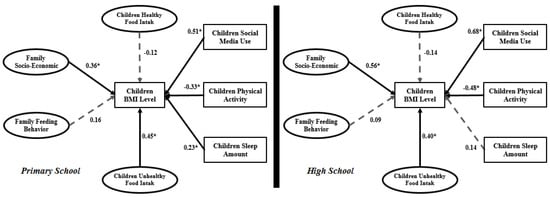
Figure 10.
Structural primary and high school models.
Table 6.
SEM analysis outputs for primary and high school students.
From the seven relationships in the primary school model, the impact of both family child-feeding behavior and children’s healthy food intake on child BMI is not significant. However, in the high school model, family child-feeding behavior and children’s sleep amount do not have a significant impact on child BMI. In the primary school model, children’s social media use (β = 0.51), family socio-economic status (β = 0.36) and children’s physical activity (β = −0.33) have the highest values. However, in the high school model, family socio-economic status and children’s social media use can be said to have the same severe impact on child BMI.
4.3. Taguchi Method Analysis
In this part of the study the significant research variables were selected from the SEM analysis. Then the Taguchi experiment was designed, data was extracted from the main dataset and data analysis was done based on the Taguchi method. In the primary school model, two variables including family child-feeding behavior and children’s healthy food intake were eliminated from the Taguchi experimental analysis. Therefore, the Taguchi analysis for primary school entailed five variables: family socio-economic status, children’s unhealthy food intake, children’s social media use, children’s physical activity and children’s sleep amount. Every variable had five levels; therefore, the L25 (55) Taguchi experimental design was applied. Thus, at least 25 participants must be extracted from the entire primary school dataset. In the high school model (Figure 10), three variables were excluded from the Taguchi experimental design, namely family child-feeding behavior, children’s healthy food intake and children’s sleep amount. Therefore, the Taguchi experimental design for high school involved four variables: family socio-economic status, children’s unhealthy food intake, children’s social media use, and children’s physical activity. In this part of the study, the L20 (45) Taguchi experimental design with at least 20 participants from the high school dataset was used. MINITAB software was employed in this data analysis step. Table 7 contains the coding structure for data analysis with MINITAB software.
Table 7.
Taguchi method coding.
Figure 11 and Figure 12 express the Taguchi method outputs from MINITAB software for primary schools and high schools.
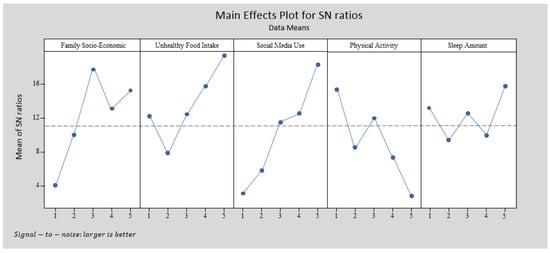
Figure 11.
Taguchi output for the primary school obesity model with MINITAB software.
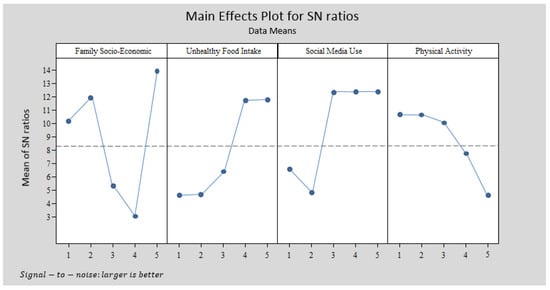
Figure 12.
Taguchi output for the high school obesity model with MINITAB software.
The structures in Figure 11 and Figure 12 differ. The primary school pattern involved five variables and the high school pattern had four variables, which were chosen based on the SEM outputs. Figure 12 illustrates that the highest BMI occurred for families with moderate socio-economic status and children who always consume unhealthy food, use social media more than 4 h per day, have no physical activity and sleep more than 9 h per day. However, according to Figure 12, the highest BMI in the high school pattern was observed for children who mostly or always eat unhealthy food, use social media 2–3 h per day or more, have no physical activity or only once per week, and come from a family with very high socio-economic status.
5. Discussion
The main objective of this study was described in two main sections. The first section introduced an obesity model for primary and high school students by applying SEM. In this part of the study, the main effective indicators on the BMI of both groups were identified. The second section introduced a pattern based on the Taguchi method from the data and variables extracted from the data analysis in the first section and the Taguchi design process.
Based on the above objective, data was collected from 1569 participants (958 from primary schools and 611 from high schools). The research model introduced in Figure 5 includes four latent variables (family socio-economic status, family child-feeding behavior, children’s healthy food intake and children’s unhealthy food intake) and three measurement variables (children’s social media use, children’s physical activity and children’s sleep amount). This discussion contains two parts in terms of SEM and Taguchi method outputs.
Based on Table 2, primary school children have a 5.74% risk of becoming overweight. However, in the high school group the risk is 8.11%, which is higher than primary school (range: 8.11%–5.74% = 2.37%). Generally, 15.44% of primary school participants are obese and 19.14% of high school participants are overweight.
5.1. Discussion on SEM Outputs
According to the SEM analysis of the primary school model, R2 is 0.83. This means that 83% of child BMI variation is dependent on family socio-economic status, family child-feeding behavior, children’s unhealthy food intake, children’s social media use, children’s physical activity and children’s sleep amount. In the high school model the variation is 75% with significant effects from family socio-economic status, children’s unhealthy food intake, children’s social media use, and children’s physical activity. The R2 value is lower in the high school model than primary school. As mentioned before, the R2 value for the high school model is 0.75, which means that a 25% variation in BMI is related to other indicators that are not involved in the present research model.
5.1.1. Obesity and Family Socio-Economic Status
Studies by Crouch et al. [] and Walsh and Cullinan [] confirmed that family socio-economic status has a significant impact on children’s weight. In the current study, child BMI was considered instead of weight. In both primary school and high school models, family socio-economic status has a significant impact on child BMI. However, the structure of significant indicators of family socio-economic status for primary school differs from high school. In both models, the parents’ age has no impact on family socio-economic status. Moreover, in the primary school model, the mother’s education has a lower factor loading. Therefore, these indicators were deleted from further data analysis (see Table 4).
5.1.2. Obesity and Physical Activity and Sleep
Physical activity and amount of sleep have been considered in previous studies related to child obesity modeling []. These two indicators were included in the present research models. Physical activity has a negative significant impact on child BMI in both primary school (β = −0.33) and high school (β = −0.48) models. However, this impact is higher in the high school model. Children’s sleep amount has a significant impact on child BMI in the primary school model (β = 0.23) but not a significant impact in the high school model (β = 0.14). Therefore, the impact of children’s sleep amount and children’s physical activity in the primary school model differs from the high school model.
Two meta-analyses and systematic reviews related short sleep duration with obesity in children [,]. In the current study, it was found that the average daily sleep amount of children (primary school students) is significantly and positively related to BMI. For high school students, the impact of sleep amount is not significant on their BMI level. However, a study by Taheri, Lin [] revealed that short sleep duration is related to alterations in metabolic hormones that promote energy intake. Another study by Spiegel, Tasali [] confirmed that metabolic hormone alterations as a consequence of reduced amount of sleep is also associated with an increase in subjective hunger and appetite for unhealthy foods.
5.1.3. Obesity and Social Media Use
In both primary school and high school models, children’s social media use has significant impact on child BMI. The impact in the high school model (β = 0.68) is much higher than in the primary school model (β = 0.51). Therefore, according to the high school model, students who spend more time using social media on devices like TV, video games, laptop/PC and mobile telephones exhibit a greater increase in BMI than primary school students. This variable with different definitions has been used in various studies. In this study, it was applied along with other important variables like healthy and unhealthy food intake, sleep amount, and physical activity. The SEM outputs confirm that in the primary school obesity model, children’s social media use has the highest impact (highest regression coefficient β = 0.51) among other input variables. Even two significant latent variables (i.e., family socio-economic status and children’s unhealthy food intake), which are a combination of some other indicators, have lower impact than children’s social media use (as one indicator). This indicator in the high school model is in second place after family socio-economic status with very little difference. Essentially, in both primary and high school obesity models, children’s social media use has the highest impact on child BMI. Therefore, it can be said that children’s social media use is a curtailing indicator of BMI increase in children.
As a result, the outputs from this study illustrate that increased daily use of social media is independently associated with greater BMI levels for both primary and high school students. This relation has been confirmed in a number of current studies [,,,]. However, according to the present study, the relationship between social media use and BMI level has the highest value among others. There are a few reasons for this result. Griffiths and Page [] mentioned that obesity has been related to victimization and social isolation. Using technology may promote sedentariness and replace otherwise active behaviors, and may thus contribute to energy imbalance. Technology use has also been related to increased energy intake despite the absence of hunger, resulting in surplus energy intake in adolescents []. Moreover, Andreyeva et al. [] approved that the advertising of unhealthy food like fast food and sugar sweetened beverages via technologies also affects the increased consumption of these foods among different generations, especially children and youth. These kinds of advertisements are not limited to TV, but are also found on the Internet and particularly in current mobile telephone applications. In current years, a number of energy drink companies have become main sponsors of some video games even. Adolescents and children are significantly immersed in these applications and become targets of optimum unhealthy beverage/food advertising. Our data analysis supports the notion that social media used with all kinds of technologies can significantly impact the increase in child BMI for primary and high school students.
5.1.4. Comparison of SEM with Other Statistical Modeling
Three main advantages of SEM along with statistical disadvantages are presented below:
- Application of latent variables. A particular advantage of SEM is the use of ‘latent variables.’ According to Bollen [], “latent variables provide a degree of abstraction that permits us to describe relations among a class of events or variables that share something in common.” Latent variables refer to constructs that are not directly observable. However, the other technical modeling including regression and even the adaptive neuro fuzzy inference system (ANFIS) do not have this ability.
- The ability to perform simultaneous estimation. There is a common limitation among correlation analysis, t-test, ANOVA, MANOVA and regression analysis. All these approaches can express a single correlation between the independent and dependent variables. In regression analysis, however, one or more independent variables are involved in a research model, but there should be only one dependent variable. In SEM it is possible to determine two or more dependent variables with different measurement and latent variable structures. MANOVA and canonical correlation may involve more than one independent and dependent variables, but analysis is restricted in that it is only possible to determine the linkage between independent and dependent variables. On the other hand, SEM can have the relationships among several dependent variables in a single model.
- SEM is able to estimate the direct and indirect effects in a single model. Gefen et al. [] believe that the most significant advantage of SEM technique is the ability to simultaneously model and examine the indirect and direct associations that exist among multiple independent and dependent variables.
5.2. Discussion of the Outputs from the Second Section
The outputs from the first section were used in the second section. Based on the SEM analysis outputs, the significant variables in obesity modeling were extracted and the Taguchi experiment was designed. The primary school model involved family socio-economic status, children’s unhealthy food intake, children’s social media use, children’s physical activity and children’s sleep. For the high school model, the family socio-economic status, children’s unhealthy food intake, children’s social media use, and child sleep amount were extracted (Figure 10). L25 (55) and L20 (45) were designed for the primary school and high school patterns. Figure 11 illustrates the MINITAB software output according to the Taguchi method design for primary schools. This figure represents a pattern which indicates that families with moderate socio-economic status and with children who always have unhealthy food intake, use social media more than 4 h per day, have no physical activity and sleep more than 9 h per day have children with the highest BMI. This pattern differs for high school students. The highest BMI in the high school pattern (Figure 12) is experienced by families with very high socio-economic status and with children who mostly or always eat unhealthy food, use social media 2–3 h per day or more, and have no physical activity or only once per day.
The Difference between the Taguchi Method and Other Statistical Modeling
The concept of data analysis with the Taguchi method is quite different from other statistical modeling, like regression, SEM, PLS and ANFIS. The output of modeling techniques is about the significance or non-significance of the independent variables in the research model. However, those outputs are not able to answer the following question:
The combination of what levels or categories of independent variables leads to dependent variable (higher or lower values) optimization?
Data analysis with the Taguchi method can answer the above question. The interpretation of Figure 12 is:
- The highest BMI in the high school pattern is observed for children who mostly or always eat unhealthy food, use social media 2–3 h per day or more, do no physical activity or only once per week, and come from a family with very high socio-economic status.
- The impact of two levels of unhealthy food intake (mostly and always) on BMI is the same.
- The impact of three levels of social media use (2–3 h per day, 3–4 h per day and more than 4 h per day) on BMI is the same.
- The impact of two levels of physical activity (none and 1–2 times per week) on BMI is the same.
According to the above discussion, it appears the Taguchi method is able to introduce a pattern of with a combination of different research variable levels. This feature is not feasible with statistical modeling, like regression, factor analysis, or even SEM, PLS and ANFIS.
6. Conclusions
There are currently serious overweight and obesity problems worldwide. Hence, researchers in this area seek to understand the effective variables and introduce solutions to control the BMI. Previous studies have utilized a range of methodologies to analyze overweight, such as descriptive statistics including diagrams, tables and charts, other modeling methods like regression and SEM, or even nonparametric analysis using fuzzy sets. This study combined SEM with the Taguchi method to introduce an improved pattern for public health studies in order to better understand the obesity levels of primary and high school students. The SEM output yielded significant effective variables on child obesity and the Taguchi method introduced a pattern based on a combination of significant variables that lead to high BMI in children.
Author Contributions
Conceived and designed the experiments: D.K., A.M.C., N.B.A.K.S., C.W.J.W.M.R., H.S.J.; performed the experiments: D.K., A.M.C.; analyzed the data: H.S.J.; contributed reagents and materials: N.B.A.K.S., C.W.J.W.M.R.; wrote the paper: D.K., A.M.C., N.B.A.K.S., C.W.J.W.M.R., H.S.J.
Acknowledgments
This research is done under University of Malaya support with project number: BK043-2016 and GC002C-17HNE.
Conflicts of Interest
The authors declare no conflict of interest.
References
- WHO. Report of the Commission on Ending Childhood Obesity; WHO: Geneva, Switzerland, 2016. [Google Scholar]
- Baek, S.-H.; Chung, H.-J.; Lee, H.-K.; D’Souza, R.; Jeon, Y.; Kim, H.-J.; Kweon, S.-J.; Hong, S.-T. Treatment of Obesity with the Resveratrol-Enriched Rice DJ-526. Sci. Rep. 2014, 4, 3879. [Google Scholar] [CrossRef] [PubMed]
- Vinturache, A.E.; McDonald, S.; Slater, D.; Tough, S. Perinatal Outcomes of Maternal Overweight and Obesity in Term Infants: A Population-Based Cohort Study in Canada. Sci. Rep. 2015, 5, 9334. [Google Scholar] [CrossRef] [PubMed]
- Huang, H.; Radzi, W.M.; Salarzadeh Jenatabadi, H. Family Environment and Childhood Obesity: A New Framework with Structural Equation Modeling. Int. J. Environ. Res. Public Health 2017, 14, 181. [Google Scholar] [CrossRef] [PubMed]
- Brown, J.E.; Broom, D.H.; Nicholson, J.M.; Bittman, M. Do working mothers raise couch potato kids? Maternal employment and children’s lifestyle behaviours and weight in early childhood. Soc. Sci. Med. 2010, 70, 1816–1824. [Google Scholar] [CrossRef] [PubMed]
- Ek, A.; Sorjonen, K.; Nyman, J.; Marcus, C.; Nowicka, P. Child behaviors associated with childhood obesity and parents’ self-efficacy to handle them: Confirmatory factor analysis of the Lifestyle Behavior Checklist. Int. J. Behav. Nutr. Phys. Act. 2015, 12, 36. [Google Scholar] [CrossRef] [PubMed]
- Okubo, H.; Miyake, Y.; Sasaki, S.; Tanaka, K.; Murakami, K.; Hirota, Y. Dietary patterns in infancy and their associations with maternal socio-economic and lifestyle factors among 758 Japanese mother–child pairs: The Osaka Maternal and Child Health Study. Matern. Child Nutr. 2014, 10, 213–225. [Google Scholar] [CrossRef] [PubMed]
- Veldhuis, L.; Vogel, I.; van Rossem, L.; Renders, C.M.; HiraSing, R.A.; Mackenbach, J.P.; Raat, H. Influence of maternal and child lifestyle-related characteristics on the socioeconomic inequality in overweight and obesity among 5-year-old children; the “Be Active, Eat Right” Study. Int. J. Environ. Res. Public Health 2013, 10, 2336–2347. [Google Scholar] [CrossRef] [PubMed]
- Mangrio, E.; Wremp, A.; Moghaddassi, M.; Merlo, J.; Bramhagen, A.C.; Rosvall, M. Antibiotic use among 8-month-old children in Malmö, Sweden–in relation to child characteristics and parental sociodemographic, psychosocial and lifestyle factors. BMC Pediatr. 2009, 9, 31. [Google Scholar] [CrossRef] [PubMed]
- Andrews, K.R.; Silk, K.S.; Eneli, I.U. Parents as health promoters: A theory of planned behavior perspective on the prevention of childhood obesity. J. Health Commun. 2010, 15, 95–107. [Google Scholar] [CrossRef] [PubMed]
- Ball, K.; Mishra, G.; Crawford, D. Which aspects of socioeconomic status are related to obesity among men and women? Int. J. Obes. 2002, 26, 559–565. [Google Scholar] [CrossRef]
- Nau, C.; Schwartz, B.S.; Bandeen-Roche, K.; Liu, A.; Pollak, J.; Hirsch, A.; Bailey-Davis, L.; Glass, T.A. Community socioeconomic deprivation and obesity trajectories in children using electronic health records. Obesity 2015, 23, 207–212. [Google Scholar] [CrossRef] [PubMed]
- Kröller, K.; Warschburger, P. Maternal feeding strategies and child’s food intake: Considering weight and demographic influences using structural equation modeling. Int. J. Behav. Nutr. Phys. Act. 2009, 6. [Google Scholar] [CrossRef] [PubMed]
- Schwartz, C.; King, N.A.; Perreira, B.; Blundell, J.E.; Thivel, D. A systematic review and meta-analysis of energy and macronutrient intake responses to physical activity interventions in children and adolescents with obesity. Pediatric Obes. 2017, 12, 179–194. [Google Scholar] [CrossRef] [PubMed]
- Kipping, R.R.; Howe, L.D.; Jago, R.; Campbell, R.; Wells, S.; Chittleborough, C.R.; Mytton, J.; Noble, S.M.; Peters, T.J.; Lawlor, D.A. Effect of intervention aimed at increasing physical activity, reducing sedentary behaviour, and increasing fruit and vegetable consumption in children: Active for Life Year 5 (AFLY5) school based cluster randomised controlled trial. BMJ 2014, 348, g3256. [Google Scholar] [CrossRef] [PubMed]
- Donnelly, J.E.; Greene, J.L.; Gibson, C.A.; Smith, B.K.; Washburn, R.A.; Sullivan, D.K.; DuBose, K.; Mayo, M.S.; Schmelzle, K.H.; Ryan, J.J.; et al. Physical Activity Across the Curriculum (PAAC): A randomized controlled trial to promote physical activity and diminish overweight and obesity in elementary school children. Prev. Med. 2009, 49, 336–341. [Google Scholar] [CrossRef] [PubMed]
- Gittelsohn, J.; Trude, A.C.; Poirier, L.; Ross, A.; Ruggiero, C.; Schwendler, T.; Anderson Steeves, E. The Impact of a Multi-Level Multi-Component Childhood Obesity Prevention Intervention on Healthy Food Availability, Sales, and Purchasing in a Low-Income Urban Area. Int. J. Environ. Res. Public Health 2017, 14, 1371. [Google Scholar] [CrossRef] [PubMed]
- Hendrie, G.A.; Coveney, J.; Cox, D.N. Defining the complexity of childhood obesity and related behaviours within the family environment using structural equation modelling. Public Health Nutr. 2012, 15, 48–57. [Google Scholar] [CrossRef] [PubMed]
- Bakić-Mirić, N. Social Media: A Critical Introduction; SAGE Publications Sage UK: London, UK, 2018. [Google Scholar]
- Malinen, S. Understanding user participation in online communities: A systematic literature review of empirical studies. Comput. Hum. Behav. 2015, 46, 228–238. [Google Scholar] [CrossRef]
- Waring, M.E.; Jake-Schoffman, D.E.; Holovatska, M.M.; Mejia, C.; Williams, J.C.; Pagoto, S.L. Social Media and Obesity in Adults: A Review of Recent Research and Future Directions. Curr. Diabetes Rep. 2018, 18, 34. [Google Scholar] [CrossRef] [PubMed]
- Pagoto, S.; Schneider, K.L.; Evans, M.; Waring, M.E.; Appelhans, B.; Busch, A.M.; Whited, M.C.; Thind, H.; Ziedonis, M. Tweeting it off: Characteristics of adults who tweet about a weight loss attempt. J. Am. Med. Inform. Assoc. 2014, 21, 1032–1037. [Google Scholar] [CrossRef] [PubMed]
- Evans, M.; Faghri, P.D.; Pagoto, S.L.; Schneider, K.L.; Waring, M.E.; Whited, M.C.; Appelhans, B.M.; Busch, A.; Coleman, A.S. The weight loss blogosphere: An online survey of weight loss bloggers. Transl. Behav. Med. 2015, 6, 403–409. [Google Scholar] [CrossRef] [PubMed]
- Gruver, R.S.; Bishop-Gilyard, C.T.; Lieberman, A.; Gerdes, M.; Virudachalam, S.; Suh, A.W.; Kalra, G.K.; Magge, S.N.; Shults, J.; Schreiner, M.S.; et al. A social media peer group intervention for mothers to prevent obesity and promote healthy growth from infancy: Development and pilot trial. JMIR Res. Protoc. 2016, 5. [Google Scholar] [CrossRef] [PubMed]
- Mazur, A.; Caroli, M.; Radziewicz-Winnicki, I.; Nowicka, P.; Weghuber, D.; Neubauer, D.; Dembiński, Ł.; Crawley, F.P.; White, M.; Hadjipanayis, A. Reviewing and addressing the link between mass media and the increase in obesity among European children: The European Academy of Paediatrics (EAP) and The European Childhood Obesity Group (ECOG) consensus statement. Acta Paediatr. 2018, 107, 568–576. [Google Scholar] [CrossRef] [PubMed]
- Holmberg, C. If You Can’t Beat It–Use It: Why and How Clinicians Need to Consider Social Media in the Treatment of Adolescents with Obesity; Nature Publishing Group: London, UK, 2016. [Google Scholar]
- Swindle, T.M.; Ward, W.L.; Whiteside-Mansell, L.; Bokony, P.; Pettit, D. Technology use and interest among low-income parents of young children: Differences by age group and ethnicity. J. Nutr. Educ. 2014, 46, 484–490. [Google Scholar] [CrossRef] [PubMed]
- Hesse, B.W.; Nelson, D.E.; Kreps, G.L.; Croyle, R.T.; Arora, N.K.; Rimer, B.K.; Viswanath, K. Trust and sources of health information: The impact of the Internet and its implications for health care providers: Findings from the first Health Information National Trends Survey. Arch. Intern. Med. 2005, 165, 2618–2624. [Google Scholar] [CrossRef] [PubMed]
- Swindle, T.M.; Ward, W.L.; Whiteside-Mansell, L. Facebook: The Use of Social Media to Engage Parents in a Preschool Obesity Prevention Curriculum. J. Nutr. Educ. Behav. 2018, 50. [Google Scholar] [CrossRef] [PubMed]
- Hall, K.D.; Hammond, R.A.; Rahmandad, H. Dynamic interplay among homeostatic, hedonic, and cognitive feedback circuits regulating body weight. Am. J. Public Health 2014, 104, 1169–1175. [Google Scholar] [CrossRef] [PubMed]
- Soltani, P.R.; Ghanbari, A.; Rad, A.H. Obesity related factors in school-aged children. Iran. J. Nurs. Midwifery Res. 2013, 18, 175–179. [Google Scholar] [PubMed]
- Omraninava, M.; Fendereski, A.; Darrudi, A.; Zabihi, F.; Feizi, N.; Ghoroghi, S. Evaluation of the Obesity Contributing Factors in first grade elementary school students from Sari, North of Iran. Middle East J. Fam. Med. 2018, 7, 139. [Google Scholar] [CrossRef]
- Ghobadi, S.; de Zepetnek, J.O.T.; Hemmatdar, Z.; Bellissimo, N.; Barati, R.; Ahmadnia, H.; Salehi-Marzijarani, M.; Faghih, S. Association between overweight/obesity and eating habits while watching television among primary-school children in the city of Shiraz, Iran. Public Health Nutr. 2018, 21, 571–579. [Google Scholar] [CrossRef] [PubMed]
- Partap, U.; Young, E.H.; Allotey, P.; Sandhu, M.S.; Reidpath, D.D. Anthropometric and cardiometabolic risk factors in parents and child obesity in Segamat, Malaysia. Int. J. Epidemiol. 2017, 46, 1523–1532. [Google Scholar] [CrossRef] [PubMed]
- Bruñó, A.; Escobar, P.; Cebolla, A.; Álvarez-Pitti, J.; Guixeres, J.; Lurbe, E.; Baños, R.; Lisón, J.F. Home-exercise Childhood Obesity Intervention: A Randomized Clinical Trial Comparing Print Versus Web-based (Move It) Platforms. J. Pediatr. Nurs. 2018. [Google Scholar] [CrossRef] [PubMed]
- Al-Mahmood, S.M.A.; Shamsuddin, A.H.; Saufi, N.A.M.; Othman, N.; Ibrahim, W.N. Factors Predicting Paediatric Obesity Among Primary School Children in Kuantan. Int. J. Care Scholars 2018, 1, 14–18. [Google Scholar]
- Novak, B.; Bigec, M. Application of Artificial Neural Networks for Childhood Obesity Prediction. In Proceedings of the 1995 Second New Zealand International Two-Stream Conference on Artificial Neural Networks and Expert Systems, Dunedin, New Zealand, 20–23 November 1995; IEEE: Piscataway, NJ, USA, 1995. [Google Scholar]
- Ordway, M.R.; Sadler, L.S.; Holland, M.L.; Slade, A.; Close, N.; Mayes, L.C. A Home Visiting Parenting Program and Child Obesity: A Randomized Trial. Pediatrics 2018, 114, e20171076. [Google Scholar] [CrossRef] [PubMed]
- Gross, R.S.; Mendelsohn, A.L.; Yin, H.S.; Tomopoulos, S.; Gross, M.B.; Scheinmann, R.; Messito, M.J. Randomized controlled trial of an early child obesity prevention intervention: Impacts on infant tummy time. Obesity 2017, 25, 920–927. [Google Scholar] [CrossRef] [PubMed]
- Wang, Y.; Min, J.; Khuri, J.; Li, M. A Systematic Examination of the Association between Parental and Child Obesity across Countries. Adv. Nutr. 2017, 8, 436–448. [Google Scholar] [CrossRef] [PubMed]
- Park, A.; Kim, Y. The longitudinal influence of child maltreatment on child obesity in South Korea: The mediating effects of low self-esteem and depressive symptoms. Child. Youth Serv. Rev. 2018, 87, 34–40. [Google Scholar] [CrossRef]
- Kambondo, G.; Sartorius, B. Risk Factors for Obesity and Overfat among Primary School Children in Mashonaland West Province, Zimbabwe. Int. J. Environ. Res. Public Health 2018, 15, 249. [Google Scholar] [CrossRef] [PubMed]
- Khanna, M.; Srinath, N.; Mendiratta, J. The Study of Obesity in Children Using Fuzzy Logic. IJITR 2015, 3, 1833–1836. [Google Scholar]
- Hui, H.; Binti, N.A.; Salarzadeh Jenatabadi, H. Family Food Security and Children’s Environment: A Comprehensive Analysis with Structural Equation Modeling. Sustainability 2017, 9, 1220. [Google Scholar]
- Sarmugam, R.; Worsley, A. Dietary behaviours, impulsivity and food involvement: Identification of three consumer segments. Nutrients 2015, 7, 8036–8057. [Google Scholar] [CrossRef] [PubMed]
- Tanja, T.-T.; Outi, N.; Sakari, S.; Jarmo, L.; Kaisa, P.; Leila, K. Preliminary finnish measures of eating competence suggest association with health-promoting eating patterns and related psychobehavioral factors in 10–17 year old adolescents. Nutrients 2015, 7, 3828–3846. [Google Scholar] [CrossRef] [PubMed]
- Hui, H.; Salarzadeh Jenatabadi, H. Comparing Bayesian and Maximum Likelihood Predictors in Structural Equation Modeling of Children’s Lifestyle Index. Symmetry 2016, 8, 141. [Google Scholar] [CrossRef]
- Pandey, N.; Murugesan, K.; Thomas, H. Optimization of ground heat exchangers for space heating and cooling applications using Taguchi method and utility concept. Appl. Energy 2017, 190, 421–438. [Google Scholar] [CrossRef]
- Motorcu, A.R.; Isik, Y.; Kus, A.; Cakir, M.C. Analysis of the Cutting Temperature and Surface Roughness during the Orthogonal Machining of Aisi 4140 Alloy Steel via the Taguchi Method. Analysis 2016, 50, 343–351. [Google Scholar] [CrossRef]
- Chandrasekar, V.; Kannan, K.; Priyavarshini, R.; Gayathri, R. Application of taguchi method in optimization of process factors of ready to eat peanut (Arachis hypogaea) Chutney. Int. Food Res. J. 2015, 22, 510–516. [Google Scholar]
- Salarzadeh Jenatabadi, H.; Babashamsi, P.; Yusoff, N.I.M. The Combination of a Fuzzy Analytical Hierarchy Process and the Taguchi Method to Evaluate the Malaysian Users’ Willingness to Pay for Public Transportation. Symmetry 2016, 8, 90. [Google Scholar] [CrossRef]
- Song, P.; Li, X.; Gasevic, D.; Flores, A.B.; Yu, Z. BMI, Waist Circumference Reference Values for Chinese School-Aged Children and Adolescents. Int. J. Environ. Res. Public Health 2016, 13, 589. [Google Scholar] [CrossRef] [PubMed]
- CDCP, Centers for Disease Control and Prevention. About BMI for Children and Teens. Retrieved 23 January 2015. Available online: http://www.cdc.gov/healthyweight/assessing/bmi/childrens_bmi/about_childrens_bmi.html (accessed on 25 March 2017).
- Birch, L.L.; Fisher, J.O.; Grimm-Thomas, K.; Markey, C.N.; Sawyer, R.; Johnson, S.L. Confirmatory factor analysis of the Child Feeding Questionnaire: A measure of parental attitudes, beliefs and practices about child feeding and obesity proneness. Appetite 2001, 36, 201–210. [Google Scholar] [CrossRef] [PubMed]
- Kaplan, A.M.; Haenlein, M. Two hearts in three-quarter time: How to waltz the social media/viral marketing dance. Bus. Horiz. 2011, 54, 253–263. [Google Scholar] [CrossRef]
- Khajeheian, D. Media entrepreneurship: A consensual definition. AD-Minister 2017, 30, 91–113. [Google Scholar] [CrossRef]
- Doub, A.E.; Small, M.; Birch, L.L. A call for research exploring social media influences on mothers’ child feeding practices and childhood obesity risk. Appetite 2016, 99, 298–305. [Google Scholar] [CrossRef] [PubMed]
- Fornell, C.; Larcker, D.F. Evaluating structural equation models with unobservable variables and measurement error. J. Market. Res. 1981, 18, 39–50. [Google Scholar] [CrossRef]
- Radzi, C.W.J.B.W.M.; Jenatabadi, H.S.; Hasbullah, M.B. Firm Sustainability Performance Index Modeling. Sustainability 2015, 7, 16196–16212. [Google Scholar] [CrossRef]
- Kline, T.J.B.; Klammer, J.D. Path model analyzed with ordinary least squares multiple regression versus LISREL. J. Psychol. Interdiscip. Appl. 2001, 135, 213–225. [Google Scholar] [CrossRef] [PubMed]
- Crouch, P.; O’dea, J.A.; Battisti, R. Child feeding practices and perceptions of childhood overweight and childhood obesity risk among mothers of preschool children. Nutr. Dietetics 2007, 64, 151–158. [Google Scholar] [CrossRef]
- Walsh, B.; Cullinan, J. Decomposing socioeconomic inequalities in childhood obesity: Evidence from Ireland. Econ. Hum. Biol. 2015, 16, 60–72. [Google Scholar] [CrossRef] [PubMed]
- Ji, M.; Tang, A.; Zhang, Y.; Zou, J.; Zhou, G.; Deng, J.; Yang, L.; Li, M.; Chen, J.; Qin, H.; et al. The Relationship between Obesity, Sleep and Physical Activity in Chinese Preschool Children. Int. J. Environ. Res. Public Health 2018, 15, 527. [Google Scholar] [CrossRef] [PubMed]
- Miller, M.A.; Kruisbrink, M.; Wallace, J.; Ji, C.; Cappuccio, F.P. Sleep duration and incidence of obesity in infants, children, and adolescents: A systematic review and meta-analysis of prospective studies. Sleep 2018, 41. [Google Scholar] [CrossRef] [PubMed]
- MacLean, J.E.; DeHaan, K.; Chowdhury, T.; Nehme, J.; Bendiak, G.N.; Hoey, L.; Horwood, L.; Pasterkamp, H.; Kirk, V.; Constantin, E.; et al. The scope of sleep problems in Canadian children and adolescents with obesity. Sleep Med. 2018, 47, 44–50. [Google Scholar] [CrossRef] [PubMed]
- Taheri, S.; Lin, L.; Austin, D.; Young, T.; Mignot, E. Short sleep duration is associated with reduced leptin, elevated ghrelin, and increased body mass index. PLoS Med. 2004, 1, e62. [Google Scholar] [CrossRef] [PubMed]
- Spiegel, K.; Tasali, E.; Penev, P.; Van Cauter, E. Brief communication: Sleep curtailment in healthy young men is associated with decreased leptin levels, elevated ghrelin levels, and increased hunger and appetite. Ann. Intern. Med. 2004, 141, 846–850. [Google Scholar] [CrossRef] [PubMed]
- Li, J.S.; Barnett, T.A.; Goodman, E.; Wasserman, R.C.; Kemper, A.R. Approaches to the prevention and management of childhood obesity: The role of social networks and the use of social media and related electronic technologies: A scientific statement from the American Heart Association. Circulation 2013, 127, 260–267. [Google Scholar] [CrossRef] [PubMed]
- Kang, Y.; Wang, Y.; Zhang, D.; Zhou, L. The public’s opinions on a new school meals policy for childhood obesity prevention in the US: A social media analytics approach. Int. J. Med. Inform. 2017, 103, 83–88. [Google Scholar] [CrossRef] [PubMed]
- Thasanasuwan, W.; Srichan, W.; Kijboonchoo, K.; Yamborisut, U.; Wimonpeerapattana, W.; Rojroongwasinkul, N.; Khouw, I.T.; Deurenberg, P. Low Sleeping Time, High TV Viewing Time, and Physical Inactivity in School Are Risk Factors for Obesity in Pre-Adolescent Thai Children. J. Med. Assoc. Thail. Chotmaihet Thangphaet 2016, 99, 314–321. [Google Scholar]
- Walton, K.; Simpson, J.R.; Darlington, G.; Haines, J. Parenting stress: A cross-sectional analysis of associations with childhood obesity, physical activity, and TV viewing. BMC Pediatr. 2014, 14, 244. [Google Scholar] [CrossRef] [PubMed]
- Griffiths, L.J.; Page, A.S. The impact of weight-related victimization on peer relationships: The female adolescent perspective. Obesity 2008, 16, S39–S45. [Google Scholar] [CrossRef] [PubMed]
- Chaput, J.-P.; Visby, T.; Nyby, S.; Klingenberg, L.; Gregersen, N.T.; Tremblay, A.; Astrup, A.; Sjödin, A. Video game playing increases food intake in adolescents: A randomized crossover study. Am. J. Clin. Nutr. 2011, 93, 1196–1203. [Google Scholar] [CrossRef] [PubMed]
- Andreyeva, T.; Kelly, I.R.; Harris, J.L. Exposure to food advertising on television: Associations with children’s fast food and soft drink consumption and obesity. Econ. Hum. Biol. 2011, 9, 221–233. [Google Scholar] [CrossRef] [PubMed]
- Bollen, K.A. Latent variables in psychology and the social sciences. Annu. Rev. Psychol. 2002, 53, 605–634. [Google Scholar] [CrossRef] [PubMed]
- Gefen, D.; Straub, D.; Boudreau, M.C. Structural equation modeling and regression: Guidelines for research practice. Commun. Assoc. Inf. Syst. 2000, 4, 7. [Google Scholar]
© 2018 by the authors. Licensee MDPI, Basel, Switzerland. This article is an open access article distributed under the terms and conditions of the Creative Commons Attribution (CC BY) license (http://creativecommons.org/licenses/by/4.0/).