Trends and the Economic Effect of Asbestos Bans and Decline in Asbestos Consumption and Production Worldwide


Abstract
:1. Introduction
2. Materials and Methods
- = GDP growth
- = Country fixed effect
- = Time fixed effect
- = A dummy variable that equals one for years when country has an asbestos ban in place and is zero otherwise
- = Differences-in-differences effect of the asbestos ban
- = Control variable (e.g., asbestos production or consumption)
- = Coefficient on control variable
- = Residual term
3. Results
4. Discussion
5. Conclusions
Acknowledgments
Author Contributions
Conflicts of Interest
References
- Virta, R.L. Asbestos Substitutes. In Industrial Minerals & Rocks: Commodities, Markets, and Uses; Kogel, J.E., Trivedi, N.C., Barker, J.M., Krukowski, S.T., Eds.; Society for Mining, Metallurgy, and Exploration, Inc.: Littleton, CO, USA, 2006; pp. 3–5. [Google Scholar]
- Robinson, B.M. Malignant Mesothelioma: an epidemiological perspective. Ann. Cardiothorac. Surg. 2012, 1, 492–496. [Google Scholar]
- Lin, R.; Takahashi, K.; Karjalainen, A.; Hoshuyama, T.; Wilson, D.; Kameda, T.; Chan, C.; Wen, C.; Furuya, S.; Higashi, T.; et al. Ecological association between asbestos-related diseases and historical asbestos consumption: an international analysis. Lancet 2007, 369, 844–849. [Google Scholar] [CrossRef]
- Nishikawa, K.; Takahashi, K.; Karjalainen, A.; Wen, C.; Furuya, S.; Hoshuyama, T.; Todoroki, M.; Kiyomoto, Y.; Wilson, D.; Higashi, T.; et al. Recent Mortality from Pleural Mesothelioma, Historical Patterns of Asbestos Use, and Adoption of Bans: A Global Assessment. Environ. Health Perspect. 2008, 116, 1675–1680. [Google Scholar] [CrossRef] [PubMed]
- Järvholm, B.; Burdorf, A. Emerging Evidence that the Ban on Asbestos Use is Reducing the Occurrence of Pleural Mesothelioma in Sweden. Scand. J. Public Health 2015, 43, 875–881. [Google Scholar] [CrossRef] [PubMed]
- Ivanov, I.D.; Kim, R. Elimination of Asbestos-Related Diseases; World Health Organization: Geneva, Switzerland, 2011. [Google Scholar]
- Leigh, J.P. Economic Burden of Occupational Injury and Illness in the United States. Milbank Q. 2011, 89, 728–772. [Google Scholar] [CrossRef] [PubMed]
- Watterson, A. Annex 5. Economic costs of ARDs. In Proceedings of the Human and Financial Burden of Asbestos in the WHO European Region, Meeting Report, Bonn, Germany, 5–6 November 2012; pp. 53–67. [Google Scholar]
- Driscoll, T. Annex 3. Report on DALYs Lost from Asbestos Exposure in European Countries and Annex 4. Step-by-Step Guidance on Calculating DALYs Lost from Asbestos Exposure in a Country for a National Asbestos Profile. In Proceedings of the Human and Financial Burden of Asbestos in the WHO European Region, Meeting Report, Bonn, Germany, 5–6 November 2012; pp. 41–52. [Google Scholar]
- World Health Organization. Asbestos: Elimination of Asbestos-Related Diseases. Fact Sheet N°343; World Health Organization: Geneva, Switzerland, 2017. [Google Scholar]
- International Labour Organization. Resolution Concerning Asbestos. In Proceedings of the 95th Session of the International Labour Conference, Geneva, Switzerland, 31 May–16 June 2006. [Google Scholar]
- The International Ban Asbestos Secretariat. Available online: http://www.ibasecretariat.org/ (accessed on 4 April 2016).
- European Commission. Commission Directive 1999/77/EC of 26 July 1999 adapting to technical progress for the sixth time Annex I to Council Directive 76/769/EEC on the approximation of the laws, regulations and administrative provisions of the Member States relating to restrictions on the marketing and use of certain dangerous substances and preparations (asbestos). Off. J. Eur. Commun. 1999, L207, 18–20. [Google Scholar]
- Da Silva, A.L.G.; Etulain, C.R. The Economic Impact of the Banning of the Use of Asbestos in Brazil. J. Unicamp 2010, 483, 2, (Article Translated from Portuguese into English by Daniel Berman). [Google Scholar]
- National Economic Development and Labour Council (NEDLAC). The Socio-Economic Impact of Phasing out Asbestos in South Africa; National Economic Development and Labour Council (NEDLAC), 2002. Available online: http://new.nedlac.org.za/wp-content/uploads/2014/10/Asbestos_November2002.pdf (accessed on 14 March 2018).
- World Health Organization, Regional Office for Europe. Assessing the Economic Costs of the Health Impacts of Environmental and Occupational Factors: The Economic Dimension of Asbestos. In Proceedings of the Conference, Bonn, Germany, 18–19 May 2016. Allen, L.P.; Baez, J.; Stern, M.E.; George, F. Asbestos-Economic Assessment of Bans and Declining Production and Consumption; World Health Organization Regional Office for Europe: Copenhagen, Denmark, 2017. [Google Scholar]
- Virta, R.L. Worldwide Asbestos Supply and Consumption Trends from 1900 through 2003; U.S. Geological Survey: Reston, VA, USA, 2006; Data after 2003 Obtained from the U.S. Geological Survey (USGS). Available online: http://minerals.usgs.gov/minerals/pubs/commodity/asbestos (accessed on 22 March 2016)After 2007, Data on Annual Asbestos Consumption Were Available only for Countries that Consumed More than 1000 Metric Tons per Year. To be Consistent, the Data Cited in this Report for all Years Exclude Countries that Consumed 1000 Metric Tons or Less.
- Le, G.V.; Takahashi, K.; Karjalainen, A.; Delgermaa, V.; Hoshuyama, T.; Miyamura, Y.; Furuya, S.; Higashi, T.; Pan, G.; Wagner, G. National Use of Asbestos in Relation to Economic Development. Environ. Health Perspect. 2010, 188, 116–119. [Google Scholar] [CrossRef] [PubMed]
- Data Obtained from the United Nations Statistics Division. Available online: http://data.un.org/ (accessed on 4 April 2016).
- Employment Data Obtained from Statistics Canada. Available online: https://www.statcan.gc.ca/eng/start (accessed on 30 July 2015).
- Asbestos Mining Stops for First Time in 130 Years. CBC News, 24 November 2011.
- Ruff, K. Quebec and Canadian governments end their historic support of the asbestos industry. Int. J. Occup. Environ. Health 2012, 18, 263–267. [Google Scholar] [CrossRef] [PubMed]
- Allen, L.P.; Martin, D.N. Forecasting Product Liability by Understanding the Driving Forces. In The International Comparative Legal Guide to: Product Liability 2006; Global Legal Group: London, UK, 2006; pp. 37–43. [Google Scholar]
- Mudarri, D.H. National Expenditures, Jobs, and Economic Growth Associated with Indoor Air Quality in the United States. J. Environ. Health 2014, 76, 26–31. [Google Scholar] [PubMed]
- Insurance Information Institute. Estimated Asbestos Losses, 2005–2014. Estimated Asbestos Losses, 2004–2013. Estimated Asbestos Losses, 2002–2011. Available online: http://www.iii.org/table-archive/21043 (accessed on 18 April 2016).


| Number of countries in sample | 49 | |||
| Number of countries that have transitioned away from asbestos | 38 | |||
| Variable | Coefficient | Std. Error | p-Value | 95% CI |
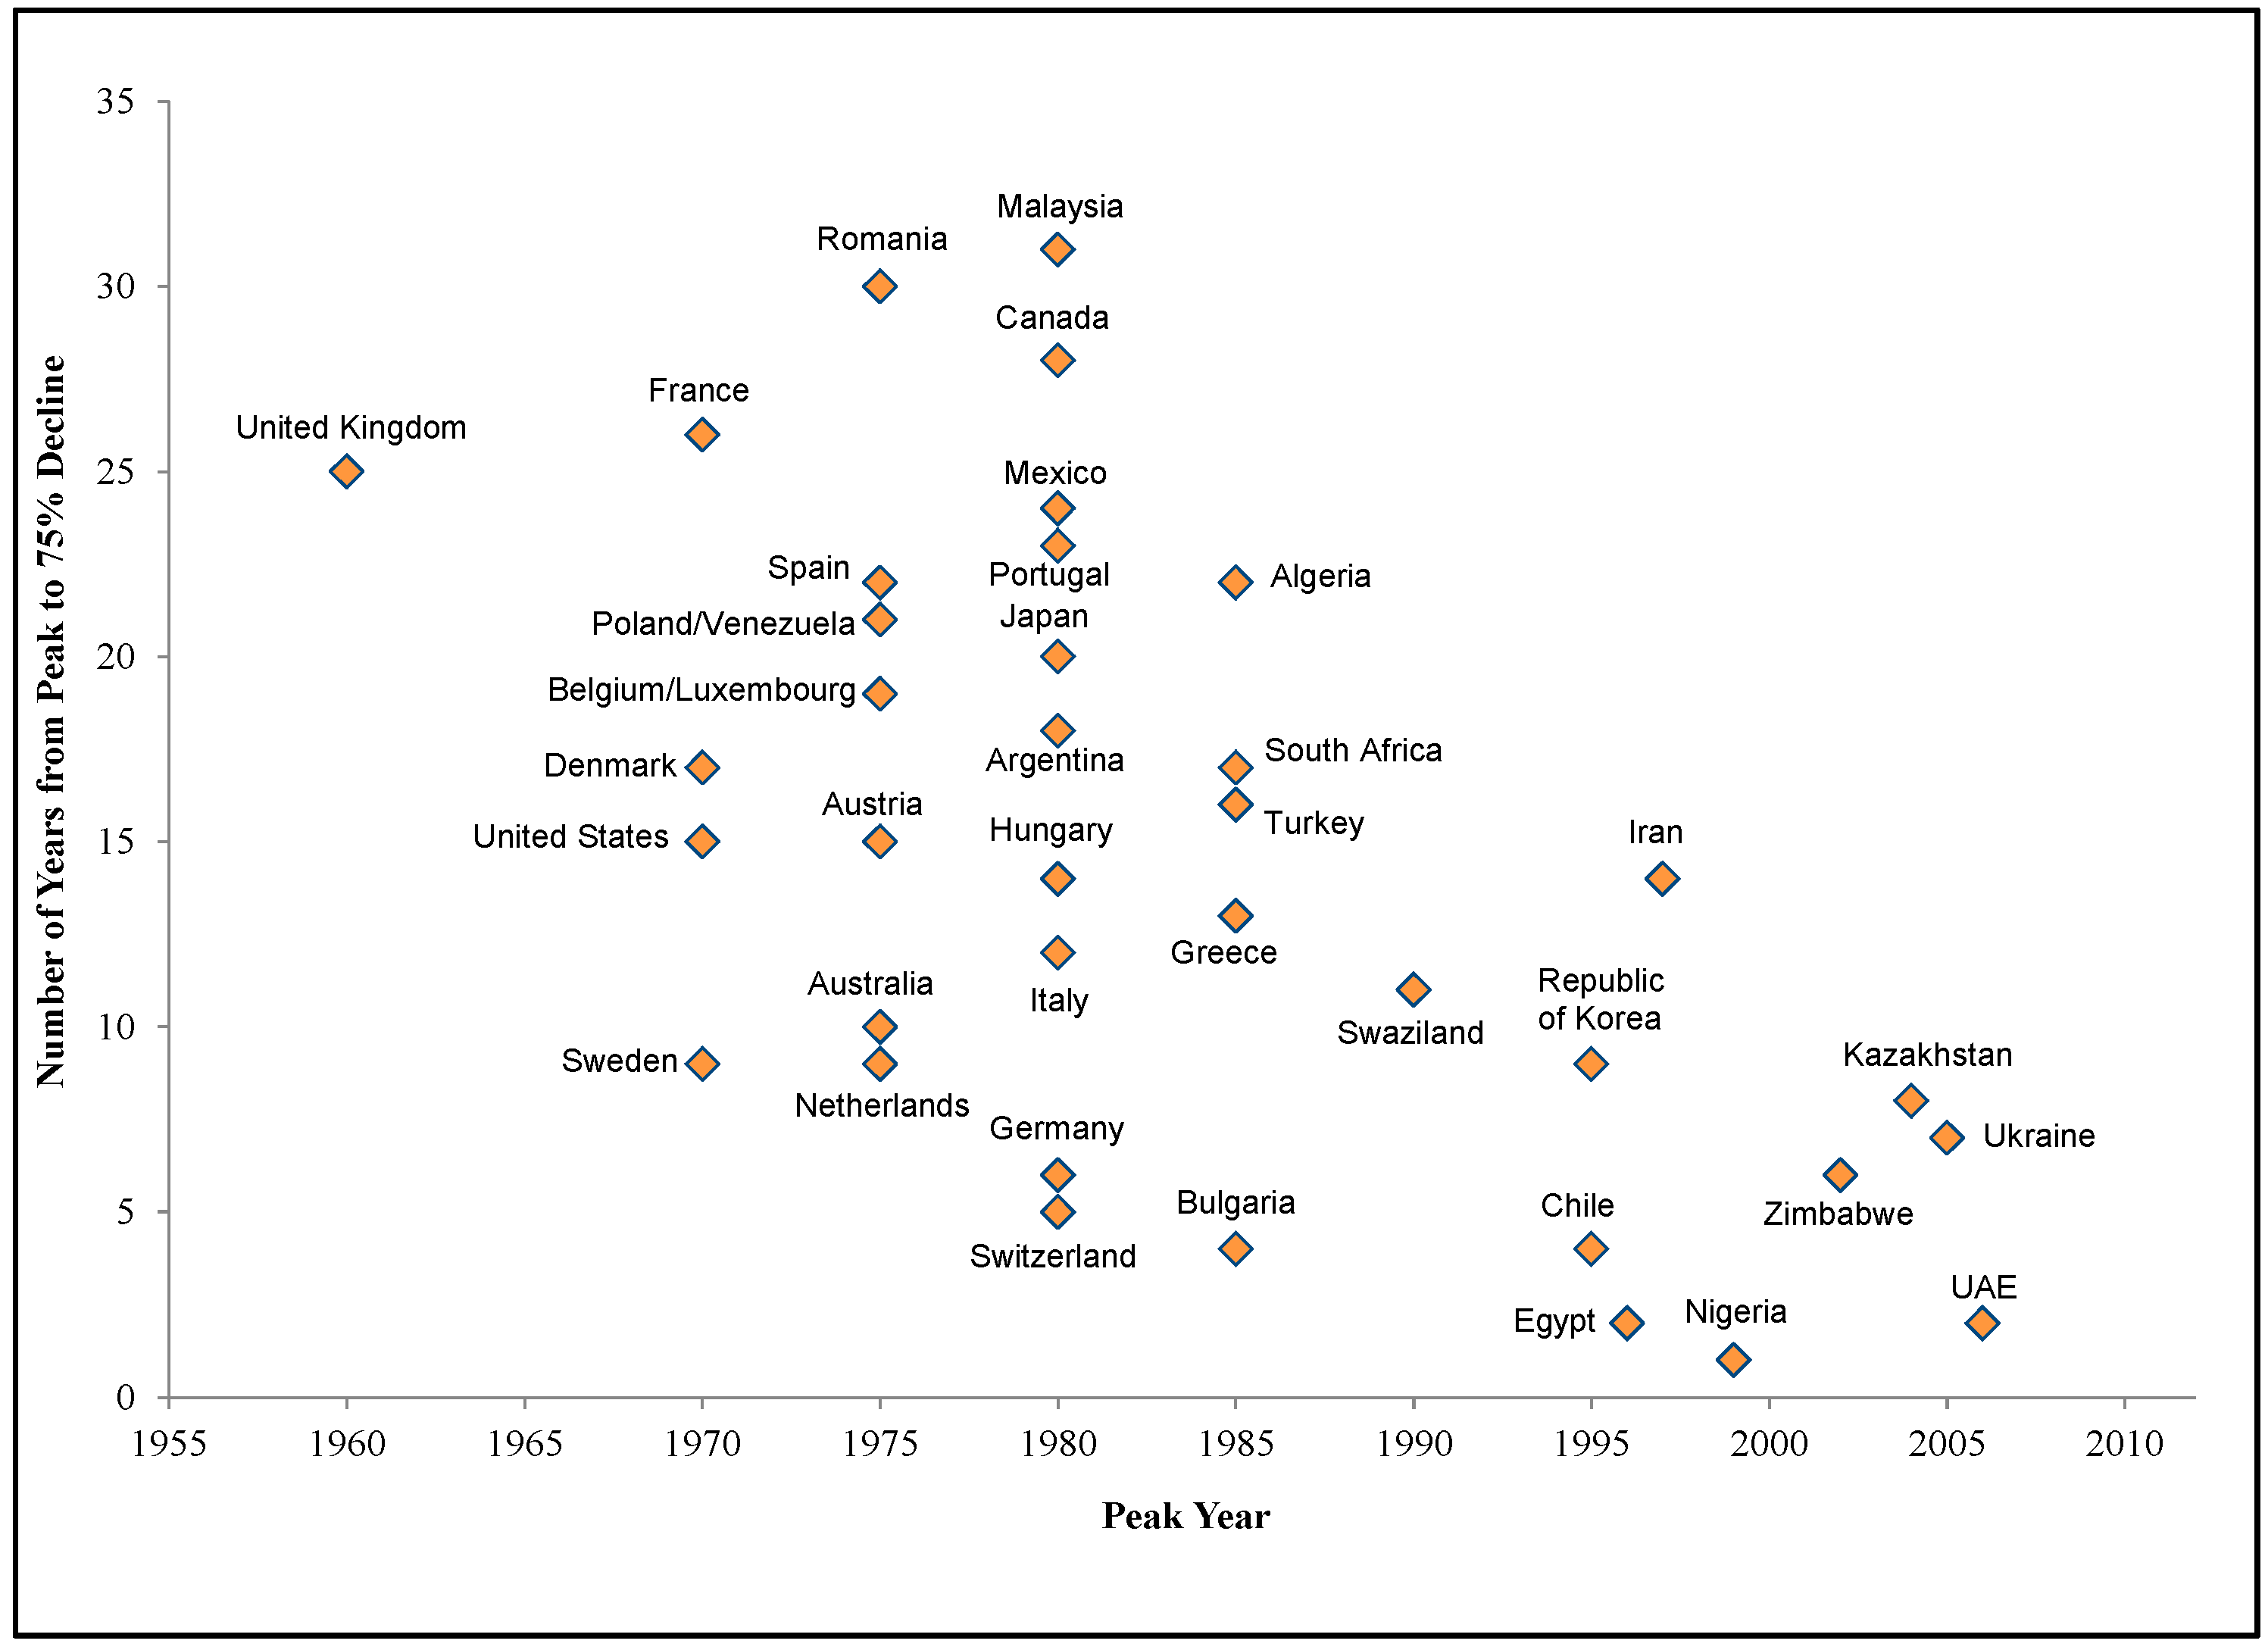
| Peak year | 0.041 | 0.018 | 0.025 | 0.005–0.076 |
| Model | 1 | 2 | 3 |
|---|---|---|---|
| Estimated Coefficients (p-Values) | |||
| Diff-in-diff estimator | −0.012 (0.302) | −0.015 (0.55) | 0.009 (0.866) |
| Asbestos control | 0.0008 (0.004) | −0.002 (0.864) | |
| Fixed effects | Year, Country | Year, Country | Year, Country |
| R-squared | 0.35 | 0.43 | 0.39 |
| Country sample | Consumer | Consumer | Producer |
© 2018 by the authors. Licensee MDPI, Basel, Switzerland. This article is an open access article distributed under the terms and conditions of the Creative Commons Attribution (CC BY) license (http://creativecommons.org/licenses/by/4.0/).
Share and Cite
Allen, L.P.; Baez, J.; Stern, M.E.C.; Takahashi, K.; George, F. Trends and the Economic Effect of Asbestos Bans and Decline in Asbestos Consumption and Production Worldwide. Int. J. Environ. Res. Public Health 2018, 15, 531. https://doi.org/10.3390/ijerph15030531
Allen LP, Baez J, Stern MEC, Takahashi K, George F. Trends and the Economic Effect of Asbestos Bans and Decline in Asbestos Consumption and Production Worldwide. International Journal of Environmental Research and Public Health. 2018; 15(3):531. https://doi.org/10.3390/ijerph15030531
Chicago/Turabian StyleAllen, Lucy P., Jorge Baez, Mary Elizabeth C. Stern, Ken Takahashi, and Frank George. 2018. "Trends and the Economic Effect of Asbestos Bans and Decline in Asbestos Consumption and Production Worldwide" International Journal of Environmental Research and Public Health 15, no. 3: 531. https://doi.org/10.3390/ijerph15030531
APA StyleAllen, L. P., Baez, J., Stern, M. E. C., Takahashi, K., & George, F. (2018). Trends and the Economic Effect of Asbestos Bans and Decline in Asbestos Consumption and Production Worldwide. International Journal of Environmental Research and Public Health, 15(3), 531. https://doi.org/10.3390/ijerph15030531