Article

Public’s Health Risk Awareness on Urban Air Pollution in Chinese Megacities: The Cases of Shanghai, Wuhan and Nanchang

1
School of Public Health, Nanchang University, 461 Bayi Road, Donghu District, Nanchang 330006, China
2
School of Public Health, Fudan University, 138 Yixueyuan Road, Xuhui District, Shanghai 200032, China
3
Global Health Institute, Wuhan University, 115 Donghu Road, Donghu District, Wuhan 430071, China
4
Department of Public Health Sciences, University of Hawaii at Mānoa, 1960 East-West Road, Honolulu, HI 96822, USA
*
Authors to whom correspondence should be addressed.
Int. J. Environ. Res. Public Health 2016, 13(9), 845; https://doi.org/10.3390/ijerph13090845
Submission received: 27 April 2016 / Revised: 2 August 2016 / Accepted: 22 August 2016 / Published: 25 August 2016

Abstract

:
This study assessed the public’s health risk awareness of urban air pollution triggered by three megacities in China, and the data are the responses from a sample size of 3868 megacity inhabitants from Shanghai, Nanchang and Wuhan. Descriptive analyses were used to summarize the respondents’ demographics, perceived health risks from air pollution and sources of health-related knowledge on urban air pollution. Chi-square tests were used to examine if participants’ demographics were associated with participant’s general attitudes towards current air quality and the three perceived highest health risks due to urban air pollution. We found low rate of satisfaction of current urban air quality as well as poor knowledge of air pollution related indicator. Participants’ gender, age and travel experience were found to be associated with the satisfaction of current air quality. The knowledge of air pollution related indicator was significantly affected by respondents’ education, monthly income, health status, and sites of study. As many as 46.23% of the participants expressed their feelings of anxiety when exposed to polluted air, especially females, older adults and those with poor health conditions. Most participants believed that coughs/colds, eye problems and skin allergies were the three highest health risks due to urban air pollution based on public education through television/radio, internet and newspaper/magazine. Further public health education is needed to improve public awareness of air pollution and its effects.

1. Introduction

Globally air quality has deteriorated seriously in the past few decades with economic development and modern industrialization [1,2,3]. Air pollution and its adverse effects on human health have drawn more global attention since the smog incident in Donora, Pennsylvania in 1948 [4] and the killer London smog event of 1952 [5]. Up to now, air pollution is estimated to cause 3.7 million premature deaths per year worldwide [6]. It has become the leading global risk for public health, and most megacities in developing countries are experiencing the worst air pollution [7]. Urban dwellers in developing countries are at higher risk of cardiovascular diseases, respiratory diseases and other illnesses [8,9,10]. Due to the pressures of social and economic development, many megacities in developing countries are facing more complicated and serious environmental problems and challenges. Air pollution in urban areas is a complex mixture of particles and gas-phase pollutants arising from a myriad of sources. Most megacities in low- and middle-income level countries experience extremely high levels of both visible (particulate matter) and invisible (gases) forms of air pollution [11,12,13], and their dwellers are at the highest risk [14].
There are more than 700 million urban populations in China. The recent migrations and relocation from rural areas to urban have directly resulted in more than 15 megacities with a population of more than 10 million [15]. According to China Environmental Bulletin, only 16 out of the 161 nationally selected cities have met the New Air Quality Standard for Testing launched in 2014 in China, yielding a 9.9% compliance rate [16]. The Organization for Economic Cooperation and Development (OECD) estimated that urban air pollution contributed to about 350,000 to 500,000 deaths per year in China’s major cities [17]. Large scale urbanization in China with unprecedented urban expansion and infrastructure development has led to the release of large amount of harmful pollutants to the atmosphere, seriously threatening people’s health [18,19].
Studies on public environmental health related risk perception originated in developed countries between the 1960s and 1970s, and most recent studies in this area were mainly conducted in Western countries [20,21]. In China, risk management on atmospheric pollution has been one of main important topics for the government [22], as urban air pollution has become a major health hazard to its people. Successful management of environmental risks, especially the urban air pollution risk, can hardly be achieved without the public’s understandings and cooperation [23]. Public perception of air pollution related health risks could also affect their personal environmental habits and behavior, and influence their judgments toward relevant risk management policy in a direct or indirect manner [24,25]. We are interested in evaluating the awareness of urban air pollution-health risk, and this study was designed to identify the main factors associated with the public’s health risk awareness toward urban air pollution, and to explore more effective way for urban air pollution control by bridging the gap between scientific research and public health risk awareness on urban air pollution.
To understand the megacity inhabitants’ health risk awareness of urban air pollution and its potential effect on public health, this study is aimed at assessing the first steps of developing a model of the social dilemma of unsafe air quality in Chinese megacities. In this paper, we evaluated the public’s awareness of health risk of urban air pollution using data from the three megacities along middle and lower reaches of the Yangtze River: Shanghai, Nanchang and Wuhan. The findings will not only have a huge impact on residents’ health-related behavior, but also provide the necessary scientific basis for government in their risk management of urban air pollution and better urban governance in the future [26,27,28].

2. Methods

2.1. Study Design and Data Collection

The Central Government of China launched the program called Yangtze River Economic Belt in 2014, which has accelerated development of middle and lower reaches of the Yangtze River Urban Agglomerations and it is being carried out in full swing. Hence, the three megacities in this area: Shanghai, Nanchang and Wuhan were chosen for this study as the most representative fast growing megacities in China. According to the previous related studies conducted in China [29], this study aimed at investigating the residents’ health risk awareness on urban air pollution in China’s megacities. The target populations were adults aged 18 years and above and have lived in the three megacities for at least one year. The qualified individuals were briefly introduced about this study and asked if they were willing to participate. Utilizing a face-to-face interview style, data was collected in parks, pedestrian streets, and shopping centers where the population density is high in each study site. The study was conducted by trained public health graduates from Fudan University, Wuhan University and Nanchang University during the spring and summer time of 2015. Each survey took five to eight minutes to complete.

2.2. Questionnaire

The questionnaire used in this study was designed by public health experts from University of Hawaii at Mānoa [29]. The questionnaire focused on public’s health risk awareness on urban air pollution in Chinese megacities. Respondents were asked to provide their home address at the beginning of the questionnaire in order to avoid repeated participation. Four subject areas of the survey questions were included: (1) social demographic characteristics including participants’ gender, age, educational level, monthly income, self-reported health status and travel experience; (2) attitudes towards current air quality in Chinese megacities, including participants’ satisfaction of current air quality, knowledge of air pollution related indicator (API) and anxious feelings when exposed to contaminated air; (3) participants’ beliefs about the high health risks due to urban air pollution, including coughs/colds, eye problems, difficulty breathing, asthma, etc.; (4) where the respondents get health-related knowledge on urban air pollution, including doctor/physician, friend or family member, television or radio and internet sites, etc.

2.3. Quality Control

The questionnaire was designed based on the local circumstances and the specific objectives of this study by public health professors of Fudan University, Wuhan University and Nanchang University. Qualified and trained graduate students from these three universities conducted the survey and collected the data. Pretest surveys among members of the target group were conducted to ensure face validity and comprehension of the survey, and the questionnaires were verified on site for quality control. Completed questionnaires were organized and numbered. Unqualified questionnaires, such as one questionnaire with all identical answers or with extensive missing answers, were excluded from the analysis. EpiData3.1 (Odense, Denmark) was used to set up the database, and logical verification of the questionnaires was done to ensure the accuracy of the data. Data were entered twice separately by two students into two different files and was cross-checked. Discordant information was verified by comparing to the original questionnaire.

2.4. Statistical Analysis

Using EpiData3.1, questionnaires were imported into the computer, Excel 2010 (Microsoft Ltd., Washington, DC, USA) was applied to manage data and the Statistical Package for the Social Sciences (SPSS) (SPSS Inc., Chicago, IL, USA) version 18.0 was used for data analysis. Two sided p-values of less than 5% were considered to be statistically significant. Descriptive statistics frequencies and proportions were used to summarize the general demographic characteristics, respondents’ perceived health risks of air pollution and sources of health-related knowledge on urban air pollution. Chi-square tests of independence were used to examine if participants’ gender, age, educational level, monthly income, self-reported health status and travel experience were associated with participant’s general attitudes towards current air quality in Chinese megacities and the three perceived highest health risks due to urban air pollution. We also reported the adjusted odds ratios (OR) and 95% confidence interval (CI) obtained from multivariable logistic regression models to identify the main factors that were most predictive of the respondents’ general attitudes towards current air quality. Pearson’s correlation coefficient was adopted to examine the strength and direction of the relationship between respondents’ general satisfaction, anxious feeling and knowledge of API toward current air quality.

2.5. Ethical Considerations

The study protocol was reviewed and approved by the Research Ethics Board of University of Hawaii at Mānoa, and local institution protocols followed (CHS#21267). To protect the respondents’ confidentiality, interviews were conducted anonymously with written informed consent. Informed consent information was attached on top of each questionnaire and introduced before the surveys.

3. Results

3.1. Sample Characteristics

Table 1 summarizes the general characteristics of the participants. A total of 3868 respondents participated in this study, including 1375 respondents from Shanghai, 1207 from Wuhan and 1286 from Nanchang; among which 1997 were male (51.63%) and 1871 female (48.37%). These respondents were classified into four age groups including <25, 25–45, 45–65 and >65, accounting for 23.40%, 33.40%, 29.96% and 13.24% of the total sample respectively. Over 90% of respondents had at least a junior high school education and 42.71% of the participants had monthly incomes ranging from 3000 to 4999 Yuan (RMB). Most of the participants had previous travel experience. Results of Chi-square tests showed that the three study sites varied in education level, monthly income and travel experience.

3.2. Respondents’ General Satisfaction of Current Air Quality

The respondents’ general satisfaction of current air quality is summarized in Table 2. More than half of the participants (56.69%) were not satisfied with current air quality. Chi-square test showed that participants’ gender, age and travel experience were associated with general satisfaction of current air quality. Multivariable logistic regression analysis (Table 3) indicated that female, older adults and those who had travel experiences were not satisfied with the current air quality.

3.3. Respondents’ Anxious Feelings When Exposed to Contaminated Air

Table 4 reported the relationship between demographic factors and respondents’ anxious feelings when exposed to contaminated air. About 46% of the participants expressed their anxious feelings when exposed to polluted air. Chi-square test illustrated that respondents’ negative feelings when exposed to polluted air is significantly affected by gender (χ2 = 5.739, p = 0.017), age (χ2 = 14.734, p = 0.002) and health status (χ2 = 61.438, p < 0.001). Moreover, Multivariable logistic regression analysis (Table 3) revealed that age 45–65 and above more likely to have anxious feelings compared to age <25 group (age 45–65, OR = 1.48, 95% CI: 1.12–3.25; age >65, OR = 2.09, 95% CI: 2.18–4.22).

3.4. Respondents’ Knowledge of Air Pollution Related Indicator (API)

Respondents’ knowledge of the API is summarized in Table 5. The results show that more than half of the respondents (57.50%) didn’t know what the API is. As shown in Table 4, the knowledge of API was significantly affected by respondents’ educational level (χ2 = 10.174, p = 0.006), monthly income (χ2 = 60.627, p < 0.001), health status (χ2 = 6.060, p = 0.014) and different study sites (χ2 = 8.610, p = 0.013). The results from Multivariable logistic regression analysis (Table 3) indicated that those with higher educational level, higher monthly income and poor self-rated health status population were more likely to pay attention to the API. Moreover, respondents from Shanghai had higher knowledge of API.
The results of Chi-square tests were summarized in Table 2 and Table 3, which identified that the respondents’ general satisfaction of current air quality, anxious feelings when exposed to contaminated air and knowledge of API was significantly related to one another. To better understand how those responses are correlated with one another, Pearson’s correlation coefficient, ϕ was calculated to evaluate the association between respondents’ general satisfaction, anxious feeling toward current air quality and knowledge of API (Table 6). Weak positive relationships were found between respondents’ general satisfaction of current air quality and anxious feelings (ϕ = 0.192, p < 0.001), and between respondents’ knowledge of API with general satisfaction of current air quality and anxious feelings (ϕ = 0.091, 0.059 respectively, p < 0.01 for both).

3.5. Respondents’ Perceived Health Risks from Urban Air Pollution

As shown in Figure 1, most participants responded that the main health risks due to air pollution are cough/cold (2662, 68.82%), eye problem (2436, 62.98%), skin allergies (1888, 48.81%) and difficulty breathing (1482, 38.31%). Table 7 illustrates the connection between respondents’ demographic factors and their beliefs about the three highest health risks due to urban air pollution. Chi-square test confirmed that females are more likely to believe cough/cold (χ2 = 5.368, p = 0.021), eye problem (χ2 = 38.963, p < 0.001) and skin allergies (χ2 = 8.672, p = 0.003) were the most common health risks related to air pollution. Linear trend chi-square test indicated that the older people believed cough/cold (χ2 = 44.377, p < 0.001) and eye problem (χ2 = 6.915, p = 0.009) were the most common health risks, while those with higher education level considered skin allergies (χ2 = 97.863, p < 0.001) was the most common health risk. Chi-square test also revealed that choosing cough/cold (2662, 68.82%), eye problem as the main health risks were significantly associated with respondents’ health status. It is interesting to find that different study sites had different opinions upon whether skin allergies were the main health risks due to air pollution.

3.6. Sources of Health-Related Knowledge on Urban Air Pollution for Respondents

Respondents’ resources of urban air pollution were also investigated in this study. As shown in Figure 2, most respondents reported that television or radio, internet sites and newspaper or magazine were the main sources for getting health-related knowledge about urban air pollution but less from doctor/physician or other health care professional.

4. Discussion

China has been going through a rapid development of urbanization and accelerated growth of its economy [30]. Many problems can be expected to occur at this stage, and urban air pollution is one of the most notable and challenging issues that must be faced [31,32]. As many major cities in China are undergoing an “urban reconstruction and modern industrialization” period, a substantial amount of infrastructure improvement has been undertaken. For instance, the fast-growing cities like Shanghai, Wuhan and Nanchang are racing to build subway systems that have attracted more migrant workers moving to these cities. Increased level of urban air pollution in these cities have placed the residents to more vulnerable adverse health condition: current researches have shown that many respiratory diseases werTABLEe due to air pollution, and long-term exposure to polluted air could damage people’s immune function [9,10,33,34,35].
This paper assessed the first steps in developing a model of the social dilemma of unsafe air quality in Chinese megacities and provided valuable insight to bridge the gap between scientific research and public health risk awareness of urban air pollution. Our study provides important theoretical references for air pollution risk management and decision-makers, as well as useful measures for risk prevention and reduction [36]. Understandings of the public perceptions of urban air pollution and related health risks and their influential factors are very important for the policymakers in their designing the relevant intervention programs [37]. On the other hand, it is critical for all individuals to rectify the misunderstanding of urban air pollution and related health risks, to enhance more comprehension and cooperation with environmental policy managements, and to lower the policy execution cost.
Our study showed that the public was generally satisfied with current air quality, however their anxious feelings about air pollution remained, especially among females and older adults. Zhang [31] reported that the females were particularly concerned about urban air pollution and related health risks, and ranked it in the first place. Our study also found that female expressed more negative and dissatisfied feelings when exposed to air pollutants. Kim et al. [32] showed that younger people had lower satisfaction levels with urban air quality; however we found that older respondents were less satisfied and more anxious. This disagreement could be due to the difference in general physical health condition between older adults and the younger. In addition, people who had a previous travel experience had lower satisfactions on local urban air quality because of their travel. In addition, public’s anxious feelings towards urban air pollution were also influenced by their health condition—healthier people were less anxious.
Previous studies showed that the public’s knowledge of air quality was associated with demographic characteristics [36,37,38]. Our study observed that educational level, income, health status and study sites were related to respondents’ understanding of air pollution related indicator (API). Those individuals with higher education, higher monthly income, and at good health status, had better knowledge about API. In addition, no differences of respondents’ general satisfaction and anxious feelings were found among the three study sites (Table 2, Table 3 and Table 5). However, the public’s knowledge of the API varies significantly among the three megacities (Table 4 and Table 5), which might be a reflection of variations in education and income level among these cities as shown in Table 1. This result is consistent with the findings reported in 1960s and some recent studies conducted in China [21,25,29].
Correlation analyses indicated weak positive correlations between respondents’ anxious feeling—general satisfaction, knowledge of API—general satisfaction and knowledge of API—anxious feeling. Hence, there is a need to establish the links between the urban air pollutant emissions and control, and public’s general feelings and attitudes toward the urban air quality and management actions through the investigation of public’s general satisfaction. It may veritably reflect and systematically understand the current situation of urban air quality management and its health related risk management from the angle of responders’ perception. This information could be very valuable for enhanced environmental management to local government. Since little was done in this study to explore the reasons why respondents’ general satisfaction, anxious feeling and knowledge of API toward current air quality attitudes correlated with each other, more in-depth investigation or open-ended questions survey to address this point needs to be designed and conducted in future.
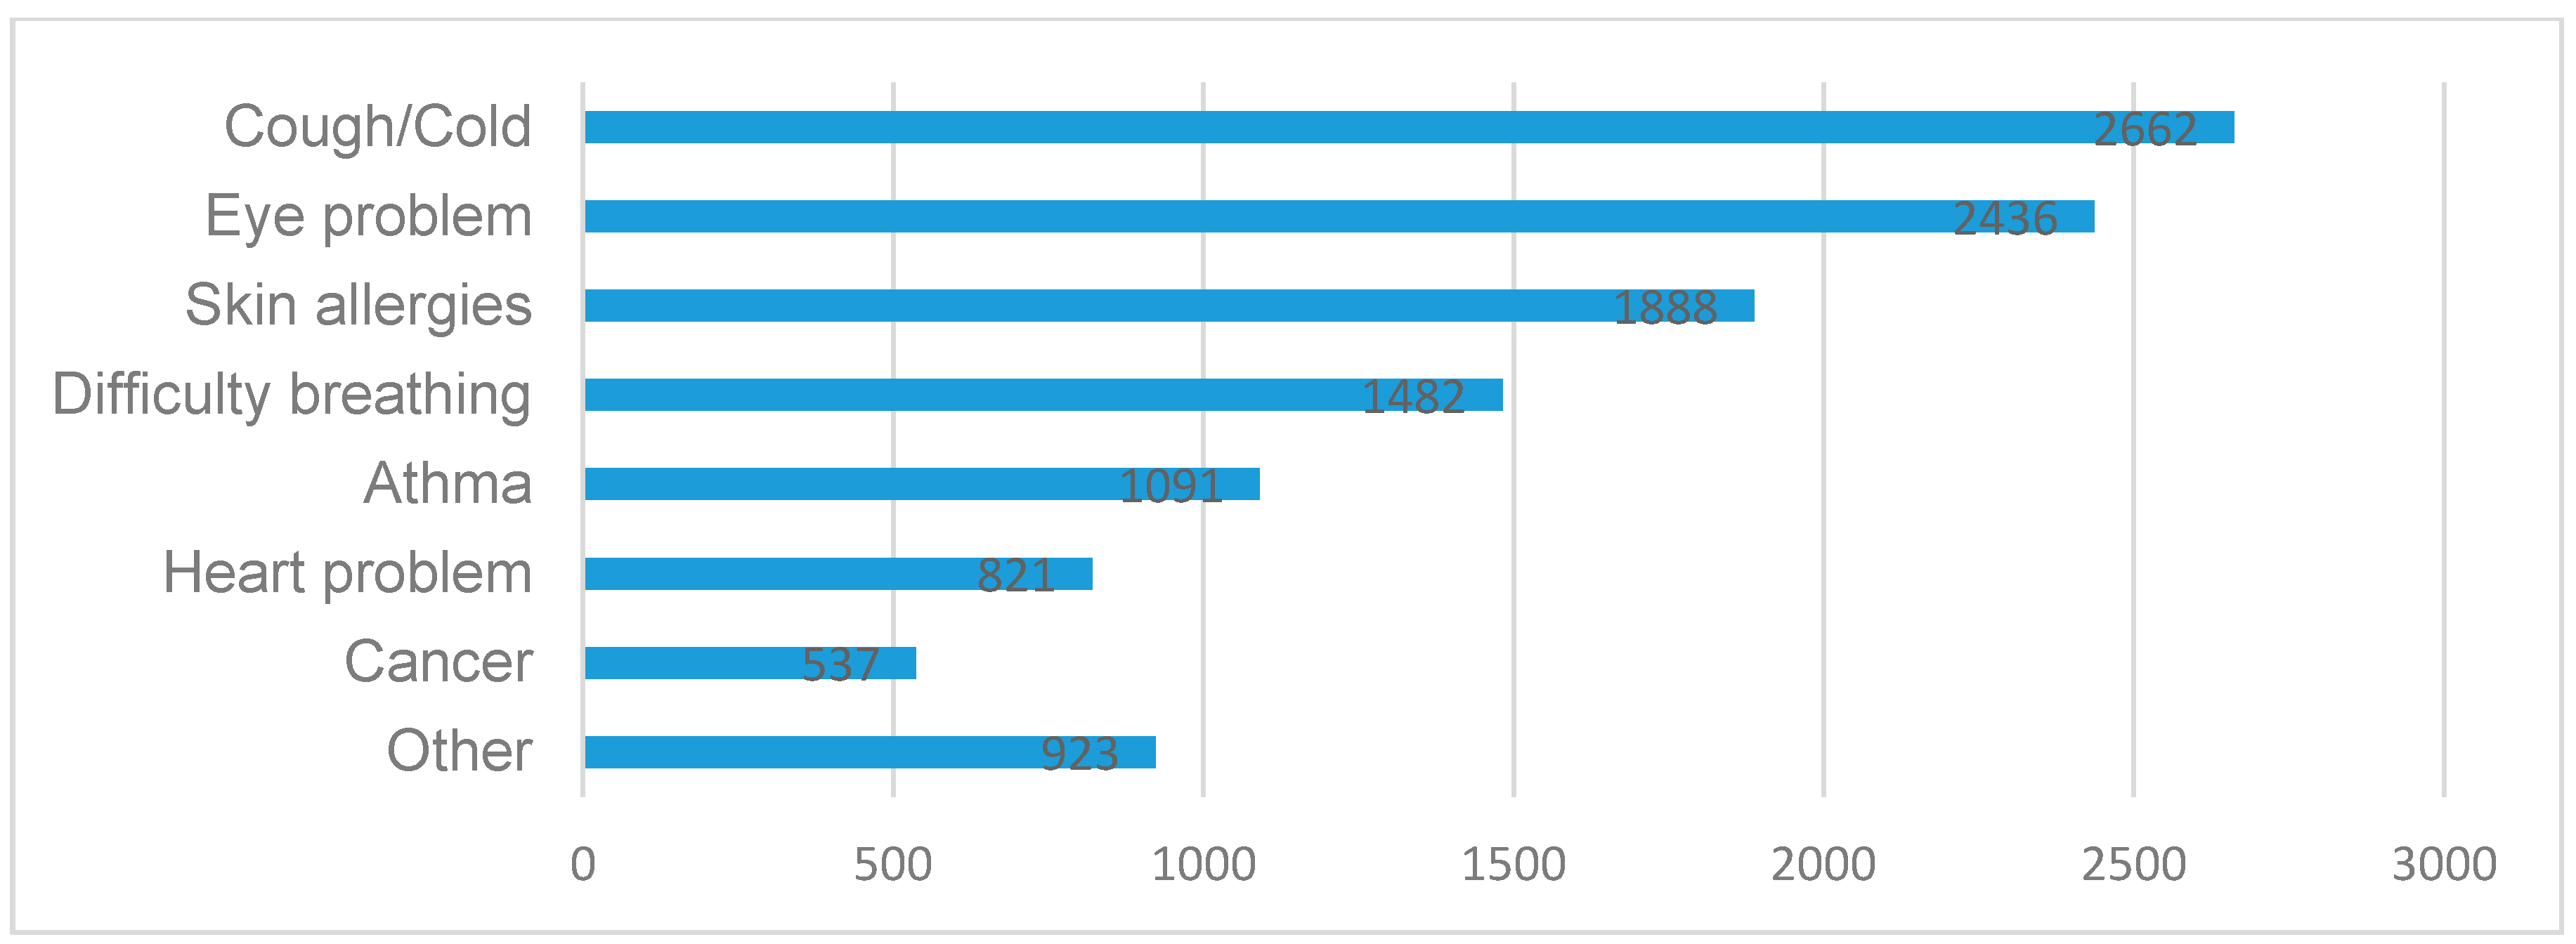
There are many studies suggesting that the serious effects of poor air quality on the human respiratory system have become much more apparent [33,34,35]. Some studies [39,40] reveal that gender and individual’s health status significantly affect the public’s perceptions of air pollution and related health risks. It is widely believed that air pollution can cause or aggravate respiratory and lung diseases. Particularly, individuals who frequently suffer from asthma or respiratory diseases such as coughs are more sensitive to atmospheric pollutants, since these illnesses are triggered by air pollution. In this study, most megacity inhabitants believed that coughs/colds, eye problems and skin allergies were the three highest health risks due to urban air pollution, especially to the females and the older adults.
Current reports have seemed to be inconclusive regarding the relationship between the public risks perception and their income level. Some studies [41,42] showed that residents living in the well-developed regions were more prone to believe that poor air quality is responsible for their respiratory health, allergies and skin problems, while other studies [43,44] reported that those people with lower income were more likely to believe that there is no connection between poor air quality and health impact. Our study also showed that the public health concerns about air pollution were not affected by their income level. In addition, this study found that people with higher education level were more likely to believe the poor air quality may cause skin allergies, which is worthy of being properly addressed in the future.
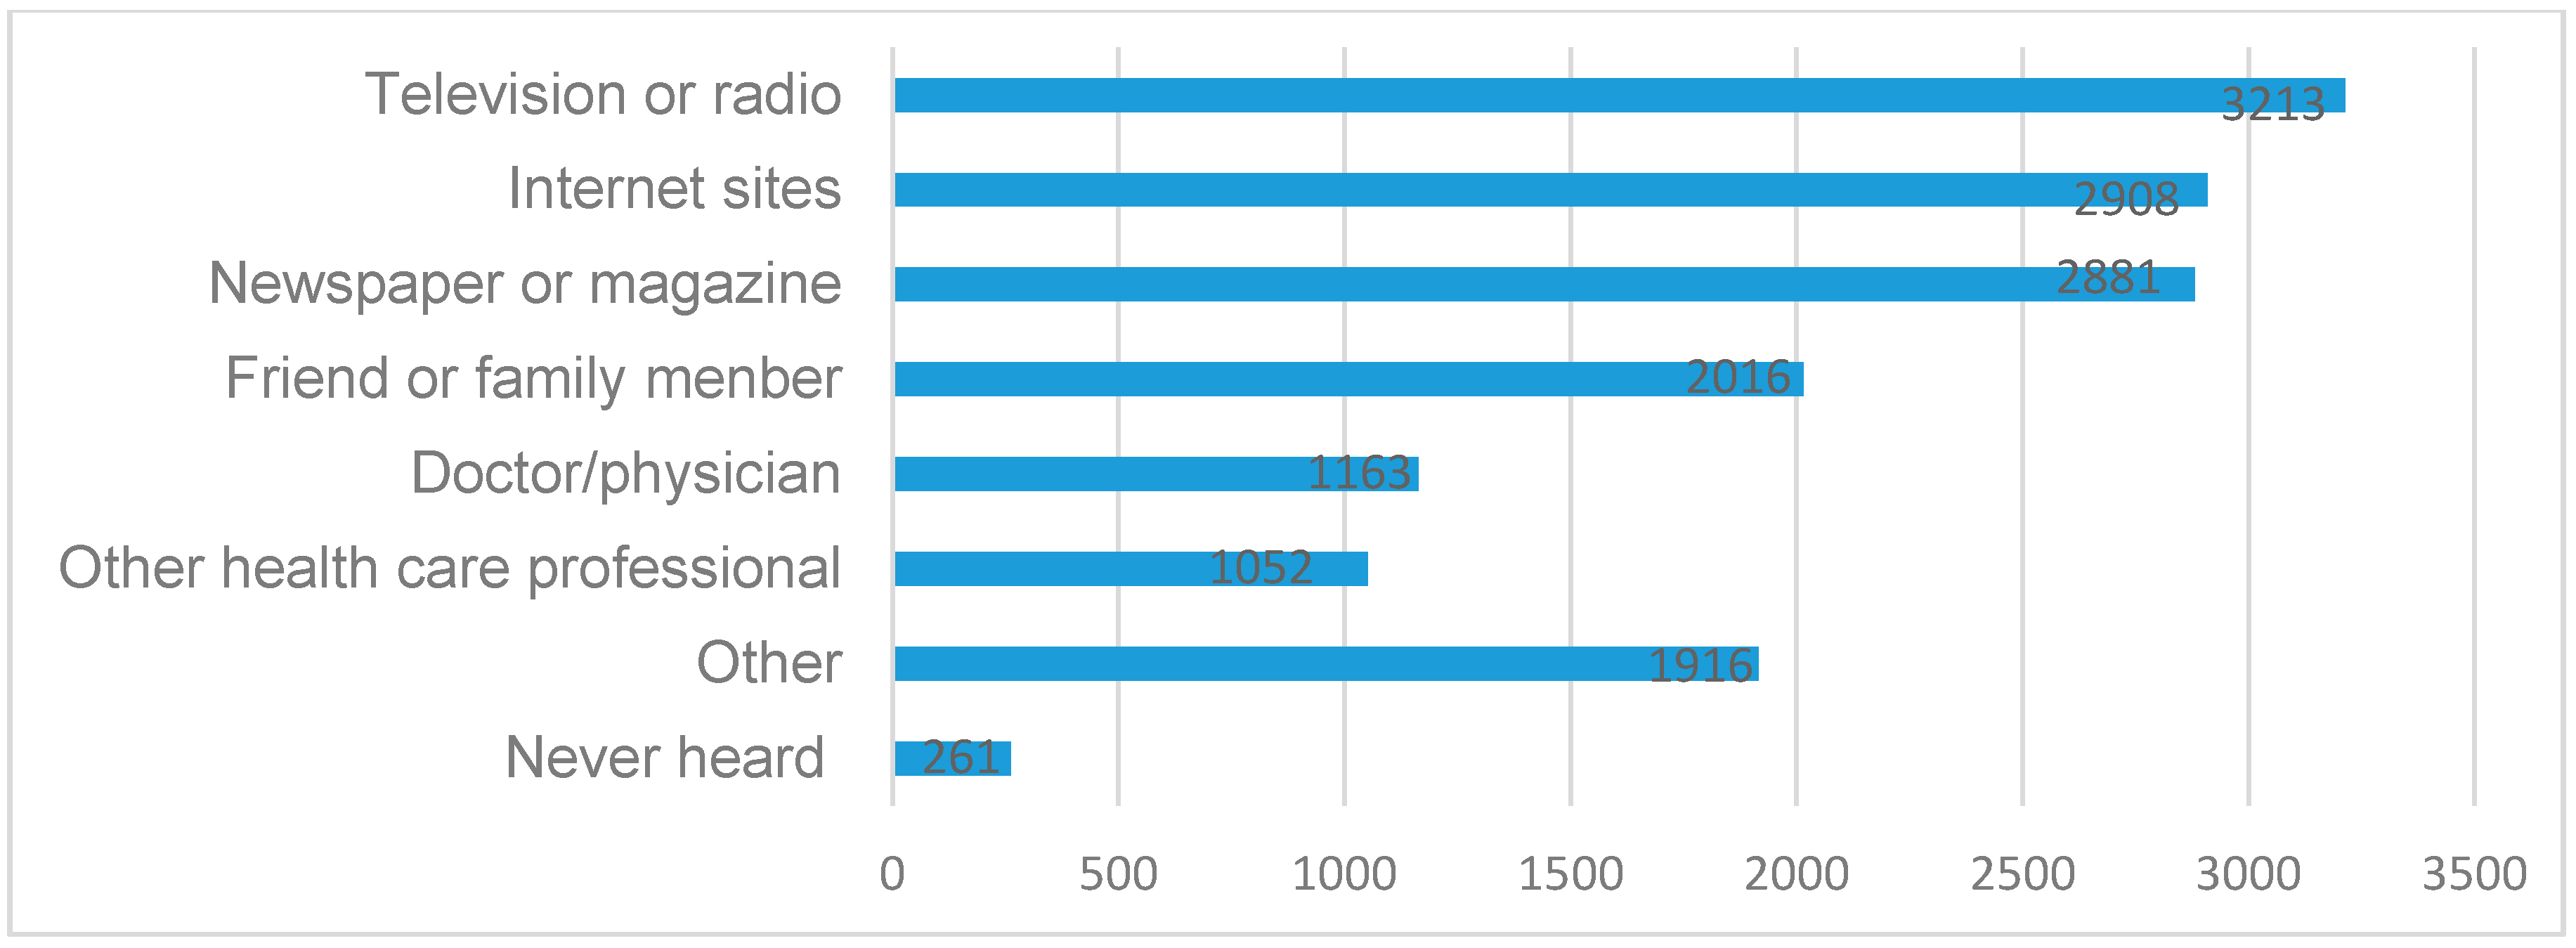
Finally, when the responders were asked where they learned health-related knowledge about urban air pollution, most respondents reported television/radio, internet sites and newspapers/magazines to be the main sources. However, Bickerstaff et al.’s study [45] showed that very few people judged the quality through the air pollution related indicator released by the media. Even though people usually do not check the API specifically, reports and comments about air pollution problems through different media such as television, radio, internet sites, newspaper or magazine, etc., have increasingly impacted people’s awareness of urban air pollution and its adverse health impact. The diversified communication form, frequency of the reported information, the wording and the channel of promulgating such information can be the important factors affecting the public’s health-related knowledge, attitude and practice on urban air pollution.
Internet and new media like Weibo—the Chinese version of Twitter—and blogs greatly promote the flow and exchange for the information, and will amplify the effect of the environmental health-related risk (the so-called media amplifier effect) [46]. On the other hand, informal communication or conversation among the public is also an important way for people to apperceive outside health-related risks, which may function as an essential supplement to adjust people’s subjective feelings. Discussion and information exchange on air pollution between relatives, friends and colleagues could also play an influential role on people’s risk perception. This study shows that there are a quite a few respondents reporting that they obtained health-related knowledge about urban air pollution through their friends, family members, doctors, physicians or other health care professional. Findings from this study emphasizes the need for more frequent education campaigns of environmental health risks and protections in order to enhance the public’s self-protection consciousness as well as to monitor and improve air quality.
Despite its vigorous design, there are several limitations in this study. This survey was conducted at three megacities in China, and our inclusion criteria for research object is only for those who aged 18 years and above and living in the those megacities for at least one year, so the design of this study has limited participants from rural areas or temporary migrants. Thus, application of these findings to other areas and other population groups should be done with caution. Moreover, open-ended questions need to be designed to reveal new problems and deepen the understanding of the respondents’ attitudes towards current air quality in China’s megacities. For example, what kind of styles and education campaigns they want to enhance the public’s self-protection consciousness as well as to monitor and improve air quality. These are what need to be properly addressed in further research. In addition, social desirability of the participants may also have an effect on their answers since the results were self-reported from the interviewees.

5. Conclusions

This paper represents the first study addressing the public’s health risk awareness on urban air pollution among residents living in different megacities in China. The total sample size of 3868 provides powerful results for all cities. We found that: (1) female and older respondents had lower satisfaction and stronger feelings of anxiety about urban air quality; (2) people who had previous travel experience tended to report lower satisfaction with local urban air quality; (3) there were low positive correlations between respondents’ general satisfaction—anxious feelings, respondents’ general satisfaction—knowledge of API and knowledge of API—anxious feelings; (4) Most respondents believed that coughs/colds, eye problems and skin allergies were the three highest perceived health risks due to urban air pollution, especially females and older adults; (5) people with higher education levels were more likely to believe the poor air quality may cause skin allergies; (6) responders believed that television/radio, internet sites and newspaper/magazine are the main sources for the public to get health-related knowledge on urban air pollution.
Effective communication styles and public education are likely to increase the health risk awareness and understanding on urban air pollution for the individuals, families and community, and will encourage people to positively adapt preventive measures for the interest of safeguarding public health. There is also need for further research on the role of risk perception for behavior change through the interdisciplinary perspective to understand how public risk perceptions shape people’s behaviors.

Acknowledgments

This study was conducted as part of the China’s International Public Health Cooperation Program, and supported in parts from Yuanan Lu’s Fudan Visiting Scholarship and Ganjiang Chair Professorship awards, the National Natural Science Foundation of China (No: 70763007), and China Postgraduate Scientific Research Foundation (No: YC2015-S039). The authors gratefully acknowledge the participation of all the respondents and those graduate students from Fudan and Wuhan Universities for their assistance in data collection for this study.

Author Contributions

Yuanan Lu, Zhaokang Yuan and Xiaojun Liu conceived and designed the study; Xiaojun Liu and Hui Zhu collected and analyzed the data and wrote the manuscript; Xiaojun Liu, Hui Zhu, Yongxin Hu, Sha Feng, Yuanyuan Chu, Yanyan Wu, Zhaokang Yuan and Yuanan Lu Collected and analyzed the data; Yuanan Lu, Xiaojun Liu, Yanyan Wu, Zhaokang Yuan, Chiyu Wang, and Yuxuan Zhang revised manuscript. All authors have approved the content of the submitted manuscript.

Conflicts of Interest

The authors declare no conflict of interest.

References

  1. Hajime, A. Global air quality and pollution. Science 2003, 302, 1716–1719. [Google Scholar]
  2. Mage, D.; Ozolins, G.; Peterson, P.; Webster, A.; Orthofer, R.; Vandeweerd, V. Urban air pollution in megacities of the world. Atmos. Environ. 1996, 30, 681–686. [Google Scholar] [CrossRef]
  3. Chan, C.K.; Yao, X. Air pollution in mega cities in China. Atmos. Environ. 2008, 42, 1–42. [Google Scholar] [CrossRef]
  4. Helfand, W.H.; Lazarus, J.; Theerman, P. Donora, Pennsylvania: An environmental disaster of the 20th century. Am. J. Public Health 2001, 91, 553. [Google Scholar] [PubMed]
  5. Davis, D.L.; Bell, M.L.; Tony, F. A look back at the London smog of 1952 and the half century since. Environ. Health Perspect. 2002, 110, 734–735. [Google Scholar] [CrossRef]
  6. World Health Organization (WHO). Ambient (Outdoor) Air Quality and Health. Available online: http://www.who.int/mediacentre/factsheets/fs313/en/ (accessed on 18 April 2016).
  7. World Health Organization (WHO). Air Quality Guidelines for Particulate Matter, Ozone, Nitrogen Dioxide and Sulfur Dioxide; WHO: Geneva, Switzerland, 2006; pp. 1–22. [Google Scholar]
  8. Samet, J.M.; Dominici, F.; Curriero, F.C.; Coursac, I.; Zeger, S.L. Fine particulate air pollution and mortality in 20 U.S. cities, 1987–1994. N. Engl. J. Med. 2001, 343, 1742–1749. [Google Scholar] [CrossRef] [PubMed]
  9. Pei, D. Study on the association between ambient air pollution and daily cardiovascular and respiratory mortality in an urban district of Beijing. Int. J. Environ. Res. Public Health 2011, 8, 2109–2123. [Google Scholar]
  10. Künzli, N.; Kaiser, R.; Medina, S.; Studnicka, M.; Chanel, O.; Filliger, P.; Herry, M.; Horak, F., Jr.; Puybonnieux-Texier, V.; Quénel, P.; et al. Public-health impact of outdoor and traffic-related air pollution: A European assessment. Lancet 2000, 356, 795–801. [Google Scholar] [CrossRef]
  11. Arku, R.E.; Vallarino, J.; Dionisio, K.L.; Willis, R.; Choi, H.; Wilson, J.G.; Hempgill, C.; Agyei-Mensah, S.; Spengler, J.D.; Ezzati, M. Characterizing air pollution in two low-income neighborhoods in Accra, Ghana. Sci. Total Environ. 2008, 402, 217–231. [Google Scholar] [CrossRef] [PubMed]
  12. Baumbach, G. Air Quality Control: Formation and Sources, Dispersion, Characteristics and Impact of Air Pollutants—Measuring Methods, Techniques for Reduction of Emissions and Regulations for Air Quality Control; Springer Science & Business Media: Berlin, Germany, 2012; pp. 22–26. [Google Scholar]
  13. Walters, R. Air pollution and invisible violence. In Invisible Crimes and Social Harms; Palgrave Macmillan: London, UK, 2014; pp. 1–18. [Google Scholar]
  14. Gurjar, B.R.; Jain, A.; Sharma, A.; Agarwal, A.; Gupta, P.; Nagpure, A.S.; Lelieve, J. Human health risks in megacities due to air pollution. Atmos. Environ. 2010, 44, 4606–4613. [Google Scholar] [CrossRef]
  15. National Bureau of Statistic of the People’s Republic of China. China National Statistics Yearbook. Available online: http://www.stats.gov.cn/tjsj/ndsj/ (accessed on 18 April 2016).
  16. Ministry of Environmental Protection of the People’s Republic of China. China Environmental Bulletin in 2014. Available online: http://jcs.mep.gov.cn/hjzl/zkgb/?COLLCC=214580716& (accessed on 18 April 2016).
  17. Chen, Z.; Wang, J.N.; Ma, G.X.; Zhang, Y.S. China tackles the health effects of air pollution. Lancet 2013, 382, 1959–1960. [Google Scholar] [CrossRef]
  18. Huang, J.; Zhang, W.; Zhu, X.; Gilliam, F.S.; Chen, H.; Lu, X.; Mo, J. Urbanization in China changes the composition and main sources of wet inorganic nitrogen deposition. Environ. Sci. Pollut. Res. 2015, 22, 6526–6534. [Google Scholar] [CrossRef] [PubMed]
  19. Xia, T.Y.; Wang, J.Y.; Song, K.; Da, L.J. Variations in air quality during rapid urbanization in Shanghai, China. Landsc. Ecol. Eng. 2014, 10, 181–190. [Google Scholar] [CrossRef]
  20. Bickerstaff, K.; Walker, G. The place(s) of matter: Matter out of place—Public understandings of air pollution. Prog. Hum. Geogr. 2003, 27, 45–67. [Google Scholar] [CrossRef]
  21. Elliott, S.J.; Cole, D.C.; Krueger, P.; Voorberg, N.; Wakefield, S. The power of perception: Health risk attributed to air pollution in an urban industrial neighbourhood. Risk Anal. 1999, 19, 621–634. [Google Scholar] [CrossRef] [PubMed]
  22. Chinese Law & Government. 4th Press Conference on the Fourteenth Stage of Atmospheric Pollution Control Work in Beijing Municipality. Chin. Law Gov. 2009, 42, 45–60. [Google Scholar]
  23. Egondi, T.; Kyobutungi, C.; Ng, N.; Muindi, K.; Oti, S.; van de Vijver, S.; Ettarh, R.; Rocklöv, J. Community Perceptions of Air Pollution and Related Health Risks in Nairobi Slums. Int. J. Environ. Res. Public Health 2013, 10, 4851–4868. [Google Scholar] [CrossRef] [PubMed]
  24. Vangeli, P.A.; Koutsidou, A. Public perception for monitoring and management of environmental risk: The case of the tires’ fire in Drama region, Greece. J. Risk Res. 2014, 17, 1183–1206. [Google Scholar] [CrossRef]
  25. Wang, R.; Yang, Y.; Chen, R.; Kan, H.; Wu, J.; Wang, K.; Maddock, J.E.; Lu, Y. Knowledge, Attitudes, and Practices (KAP) of the Relationship between Air Pollution and Children’s Respiratory Health in Shanghai, China. Int. J. Environ. Res. Public Health 2015, 12, 1834–1848. [Google Scholar] [CrossRef] [PubMed]
  26. Wakefield, S.E.; Elliott, S.J.; Eyles, J.D.; Cole, D.C. Taking environmental action: The role of local composition, context, and collective. Environ. Manag. 2006, 37, 40–53. [Google Scholar] [CrossRef] [PubMed]
  27. Peptenatu, D.; Pintilii, R.D.; Draghici, C. Environmental risk management of urban growth poles regarding national importance. Int. J. Environ. Sci. Technol. 2011, 8, 737–746. [Google Scholar] [CrossRef]
  28. Muindi, K.; Egondi, T.; Kimani-Murage, E.; Rocklov, J.; Ng, N. “We are used to this”: A qualitative assessment of the perceptions of and attitudes towards air pollution amongst slum residents in Nairobi. BMC Public Health 2014, 14, 226. [Google Scholar] [CrossRef] [PubMed]
  29. Zhang, L.; Yuan, Z.; Maddock, J.E.; Zhang, P.; Jiang, Z.; Lee, T.; Zou, J.; Lu, Y. Air quality and environmental protection concerns among residents in Nanchang, China. Air Qual. Atmos. Health 2014, 7, 441–448. [Google Scholar] [CrossRef]
  30. Zhou, Y.; Ma, L.J.C. China’s urbanization levels: Reconstructing a baseline from the fifth population census. China Q. 2015, 173, 176–196. [Google Scholar]
  31. Zhang, J. Environmental hazards in the Chinese public’s eyes. Risk Anal. 1994, 14, 163–167. [Google Scholar] [PubMed]
  32. Kim, M.H.; Yi, O.H.; Kim, H. The role of differences in individual and community attributes in perceived air quality. Sci. Total Environ. 2012, 425, 20–26. [Google Scholar] [CrossRef] [PubMed]
  33. Fossati, S.; Metruccio, F.; Urso, P.; Ruggeri, L.; Ciammella, M.; Colombo, S.; Cerchiello, M.; Mauro, A.; Tibiletti, M.; de Vito, G.; et al. Effects of short-term exposure to urban particulate matter on cardiovascular and respiratory systems—The PM-CARE study. Epidemiology 2006, 17, S528. [Google Scholar] [CrossRef]
  34. Zhang, H.; Ye, Y.; Diggle, P.; Shi, J. Joint modeling of time series measures and recurrent events and analysis of the effects of air quality on respiratory symptoms. J. Am. Stat. Assoc. 2008, 103, 48–60. [Google Scholar] [CrossRef]
  35. Gül, H.; Gaga, E.O.; Döğeroğlu, T.; Özden, Ö.; Ayvaz, Ö.; Özel, S.; Güngör, G. Respiratory Health Symptoms among Students Exposed to Different Levels of Air Pollution in a Turkish City. Int. J. Environ. Res. Public Health 2011, 8, 1110–1125. [Google Scholar] [CrossRef] [PubMed] [Green Version]
  36. Howel, D.; Moffatt, S.; Prince, H.; Bush, J.; Dunn, C.E. Urban air quality in north-east England: Exploring the influences on local views and perceptions. Risk Anal. 2002, 1, 121–130. [Google Scholar] [CrossRef]
  37. Omanga, E.; Ulmer, L.; Berhane, Z.; Gatari, M. Industrial air pollution in rural Kenya: Community awareness, risk perception and associations between risk variables. BMC Public Health 2014, 14. [Google Scholar] [CrossRef] [PubMed]
  38. Liao, X.; Tu, H.; Maddock, J.E.; Fan, S.; Lan, G.; Wu, Y.; Lu, Y. Residents’ perception of air quality, pollution sources, and air pollution control in Nanchang, China. Atmos. Pollut. Res. 2015, 6, 835–841. [Google Scholar] [CrossRef]
  39. Badland, H.M.; Duncan, M.J. Perceptions of air pollution during the work-related commute by adults in Queensland, Australia. Atmos. Environ. 2009, 43, 5791–5795. [Google Scholar] [CrossRef]
  40. Shi, X. Factors influencing the environmental satisfaction of local residents in the coal mining area, China. Soc. Indic. Res. 2015, 120, 67–77. [Google Scholar] [CrossRef]
  41. Brody, S.D.; Peck, B.M.; Highfield, W.E. Examining localized patterns of air quality perception in Texas: A spatial and statistical analysis. Risk Anal. 2004, 6, 1561–1574. [Google Scholar] [CrossRef] [PubMed]
  42. Ferreira, S.; Akay, A.; Brereton, F.; Cuñado, J.; Martinsson, P.; Moro, M.; Ningal, T.F. Life satisfaction and air quality in Europe. Ecol. Econ. 2012, 88, 1–10. [Google Scholar] [CrossRef]
  43. Onkal-Engin, G.; Demir, I.; Hiz, H. Assessment of urban air quality in Istanbul using fuzzy synthetic evaluation. Atmos. Environ. 2004, 38, 3809–3815. [Google Scholar] [CrossRef]
  44. Fang, M.; Yao, C.X. Managing air quality in a rapidly developing nation: China. Atmos. Environ. 2009, 43, 79–86. [Google Scholar] [CrossRef]
  45. Bickerstaff, K.; Walker, G. Public understandings of air pollution: The “localization” of environmental risk. Glob. Environ. Chang. 2001, 11, 133–145. [Google Scholar] [CrossRef]
  46. Vijaykumar, S.; Jin, Y.; Nowak, G. Social media and the virality of risk: The risk amplification through media spread (RAMS) model. J. Homel. Secur. Emerg. Manag. 2015, 12, 653–677. [Google Scholar] [CrossRef]
Figure 1. Respondents’ perceived health risks from air pollution: the top three needing more attention.
Ijerph 13 00845 g001
Figure 2. Where the respondents get health-related knowledge on urban air pollution.
Ijerph 13 00845 g002
Table 1. Demographic information of the participants in three study sites (n = 3868).
Demographic FactorsShanghaiWuhanNanchangTotal
n%n%n%n%
Gender
  Male70351.1360650.2168853.50199751.63
  Female67248.8760149.7959846.50187148.37
Age
  <2533124.0728823.8628622.2490523.40
  25–4545332.9541033.9742933.36129233.40
  45–6541229.9636229.9938529.94115929.96
  >6517913.0214712.1818614.4651213.24
Education level *
  ≤Elementary School936.7613911.5213810.733709.56
  Junior High–High School72052.3762852.0365951.24200751.89
  ≥College56240.8744036.4548938.03149138.55
Monthly income (RMB) *
  ≤299926619.3529124.1130823.9586522.36
  3000–499957842.0452243.2555242.92165242.71
  5000–799935225.6028623.6930523.7294324.38
  ≥800017913.021088.951219.4140810.55
Travel experience *
  Yes118686.25100883.5197583.83327284.59
  No18913.7519916.4920816.1759615.41
Good health status
  Yes83660.8072660.1579361.66235560.88
  No53939.2048139.8549338.34151339.12
Total1375100120710012861003868100
* Chi-square significant at 5% level (for education level: χ2 = 21.471, p < 0.001; for monthly income: χ2 = 22.704, p = 0.010; for travel experience: χ2 = 7.602, p = 0.022).
Table 2. Respondents’ general satisfaction of current air quality.
Demographic FactorsSatisfactoryUnsatisfactoryχ2p-Value
n%n%
Gender 9.9890.002
  Male92846.47106953.53
  Female77541.42109658.58
Age * 22.634<0.001
  <2541645.9748954.03
  25–4558044.8971255.11
  45–6553145.8262854.18
  >6517634.3733665.63
Education level 0.0130.993
  ≤Elementary School16243.7820856.22
  Junior High–High School88544.10112255.90
  ≥College65644.0083556.00
Monthly income (RMB) 0.9190.821
  ≤299938944.9747655.03
  3000–499972143.6493156.36
  5000–799940843.2753556.73
  ≥800018545.3422354.66
Travel experience 4.4800.034
  Yes141743.31185556.69
  No28647.9931052.01
Good health status 0.7610.383
  Yes105044.59130555.41
  No65343.1686056.84
Anxious feelings 142.55<0.001
  Yes73235.20134864.80
  No97154.3181745.69
Knowledge of API 31.15<0.001
  Yes89440.20133059.80
  No80949.2183550.79
Study Sites 0.4640.793
  Shanghai60243.7877356.22
  Wuhan54144.8266655.18
  Nanchang56044.5572656.45
Total170344.03216555.97
* Linear trend chi-square significant at 5% level (χ2 = 10.065, p = 0.002).
Table 3. Multivariable logistic regression analysis for the influencing factors among respondents’ satisfaction, anxious feelings and knowledge of API.
Variable(s)Satisfaction (Unsatisfactory)Anxious Feelings (Yes)Knowledge of API (Yes)
OROR 95% CIOROR 95% CIOROR 95% CI
Gender (Male = control group)
Female1.26 **1.07–1.381.51 *1.22–2.011.020.89–3.31
Age (<25 = control group)
25–451.30 *1.15–1.481.330.93–1.972.060.83–2.38
45–651.28 *1.23–2.061.48 **1.12–3.251.560.77–3.26
>651.59 **1.66–3.082.09 **2.18–4.220.970.33–5.07
Education level (≤Elementary School = control group)
Junior High–High School1.120.79–2.131.070.88–2.301.31 **3.22–8.91
≥College1.290.97–3.070.990.71–4.062.89 **5.81–13.07
Monthly income (RMB) (≤2999 = control group)
3000–49991.290.90–1.671.210.64–1.771.17 *1.05–4.32
5000–79991.580.78–1.361.790.19–3.022.51 **3.57–7.27
≥80002.020.98–3.311.350.38–1.213.06 **2.26–9.07
Travel experience (Yes = control group)
No0.78 *0.35–0.711.070.17–1.091.210.21–1.13
Good health status (Yes = control group)
No1.460.61–1.272.11 **3.01–5.061.37 *1.05–4.11
Study Sites (Shanghai = control group)
Wuhan1.030.79–3.010.920.71–2.010.81 *0.07–0.16
Nanchang1.110.84–2.970.870.77–1.790.76 *0.10–0.09
* p-value < 0.05, ** p-value < 0.01.
Table 4. Respondents’ feelings of anxiety when exposed to contaminated air.
Demographic FactorsYesNoχ2p-Value
n%n%
Gender 5.7390.017
  Male88644.37111155.63
  Female90248.2196951.79
Age * 14.7340.002
  <2540744.9749855.03
  25–4558144.9771155.03
  45–6552345.1363654.87
  >6527754.1023545.90
Education level 0.4360.804
  ≤Elementary School17747.8419352.16
  Junior High–High School92345.99108454.01
  ≥College68846.1480353.86
Monthly income (RMB) 1.1610.762
  ≤299940146.3646453.64
  3000–499976146.0789153.93
  5000–799942845.3951554.61
  ≥800019848.5321051.47
Travel experience 0.8790.348
  Yes150245.90177054.10
  No28647.9931052.01
Good health status 61.438<0.001
  Yes97041.19138558.81
  No81854.0669545.94
Knowledge of API 13.372<0.001
  Yes81649.2182850.79
  No97240.20125259.80
Study sites
  Shanghai62645.5374954.471.5810.454
  Wuhan57647.7263152.28
  Nanchang58645.5770054.43
Total178846.23208053.77
* Linear trend chi-square significant at 5% level (χ2 = 6.844, p = 0.009).
Table 5. Respondents’ knowledge of air pollution related indicator (API).
Demographic FactorsYesNoχ2p-Value
n%n%
Gender 0.4430.506
  Male85943.01113856.99
  Female78541.96108658.04
Age 0.2590.967
  <2538942.9851657.02
  25–4555042.5774257.43
  45–6549242.4566757.55
  >6521341.6029958.40
Education level * 10.1740.006
  ≤Elementary School13335.9523764.04
  Junior High–High School84241.95116558.05
  ≥College66944.8782255.13
Monthly income (RMB) * 60.627<0.001
  ≤299930535.2656064.74
  3000–499966240.0799059.93
  5000–799945247.9349152.07
  ≥800022555.1518344.85
Travel experience 1.4390.230
  Yes140442.91186857.09
  No24040.2735659.73
Good Health Status 6.0600.014
  Yes96440.93139159.07
  No68044.9483355.06
Study Sites 8.6100.013
  Shanghai62545.4575054.55
  Wuhan48139.8572660.15
  Nanchang53841.8474858.16
Total164442.50222457.50
* Linear trend chi-square significant at 5% level (for education level: χ2 = 9.443, p = 0.002; for monthly income: χ2 = 59.593, p < 0.001).
Table 6. Correlation coefficients (ϕ) between respondents’ general satisfaction, anxious feeling and knowledge of API toward current air quality.
VariablesGeneral SatisfactionAnxious FeelingKnowledge of API
General satisfaction1----
Anxious feeling0.192 **1--
Knowledge of API0.091 **0.059 **1
** p < 0.01.
Table 7. Respondents’ beliefs about the three highest health risks due to urban air pollution.
Demographic FactorsCough/ColdEye ProblemSkin Allergies
n%χ2p-Valuen%χ2p-Valuen%χ2p-Value
Gender 5.3680.021 38.963<0.001 8.6720.003
  Male134167.15 116458.29 92946.52
  Female132170.60 127267.98 95951.26
Age 49.627<0.001 8.7280.033 0.4040.940
  <2555461.22 53459.01 44749.39
  25–4589168.96 82363.70 63549.15
  45–6581370.15 74264.02 55948.23
  >6540478.9144.377 *<0.00133765.826.915 *0.00924748.240.344 *0.558
Education level 2.1600.340 0.9140.633 101.871<0.001
  ≤Elementary School24365.68 22861.62 13436.22
  Junior High–High School139569.51 125662.58 87943.80
  ≥College102468.680.275 *0.60195263.850.906 *0.34187558.6997.863 *<0.001
Monthly income (RMB) 0.7710.856 1.1800.758 1.3050.728
  ≤299959769.02 55363.93 43350.06
  3000–4999113768.83 104163.01 79548.12
  5000–799964167.97 59462.99 45548.25
  ≥800028770.340.011 *0.91724860.780.898 *0.34320550.250.024 *0.878
Good health status 6.4610.011 1.8880.016 2.1980.138
  Yes158567.30 146362.12 112747.86
  No107771.18 97364.31 76150.29
Study Sites 1.2980.523 1.5270.466 8.6850.013
  Shanghai96269.96 88264.15 71552.00
  Wuhan82368.19 74661.81 56847.06
  Nanchang87768.20 80862.83 60547.05
Total266268.82 243662.98 188848.81
* Those values represent linear trend chi-square.

