
Mapping Environmental Inequalities Relevant for Health for Informing Urban Planning Interventions—A Case Study in the City of Dortmund, Germany


Abstract
:1. Introduction
2. Materials and Methods
2.1. Case Study Area
2.2. Dataset and Methods
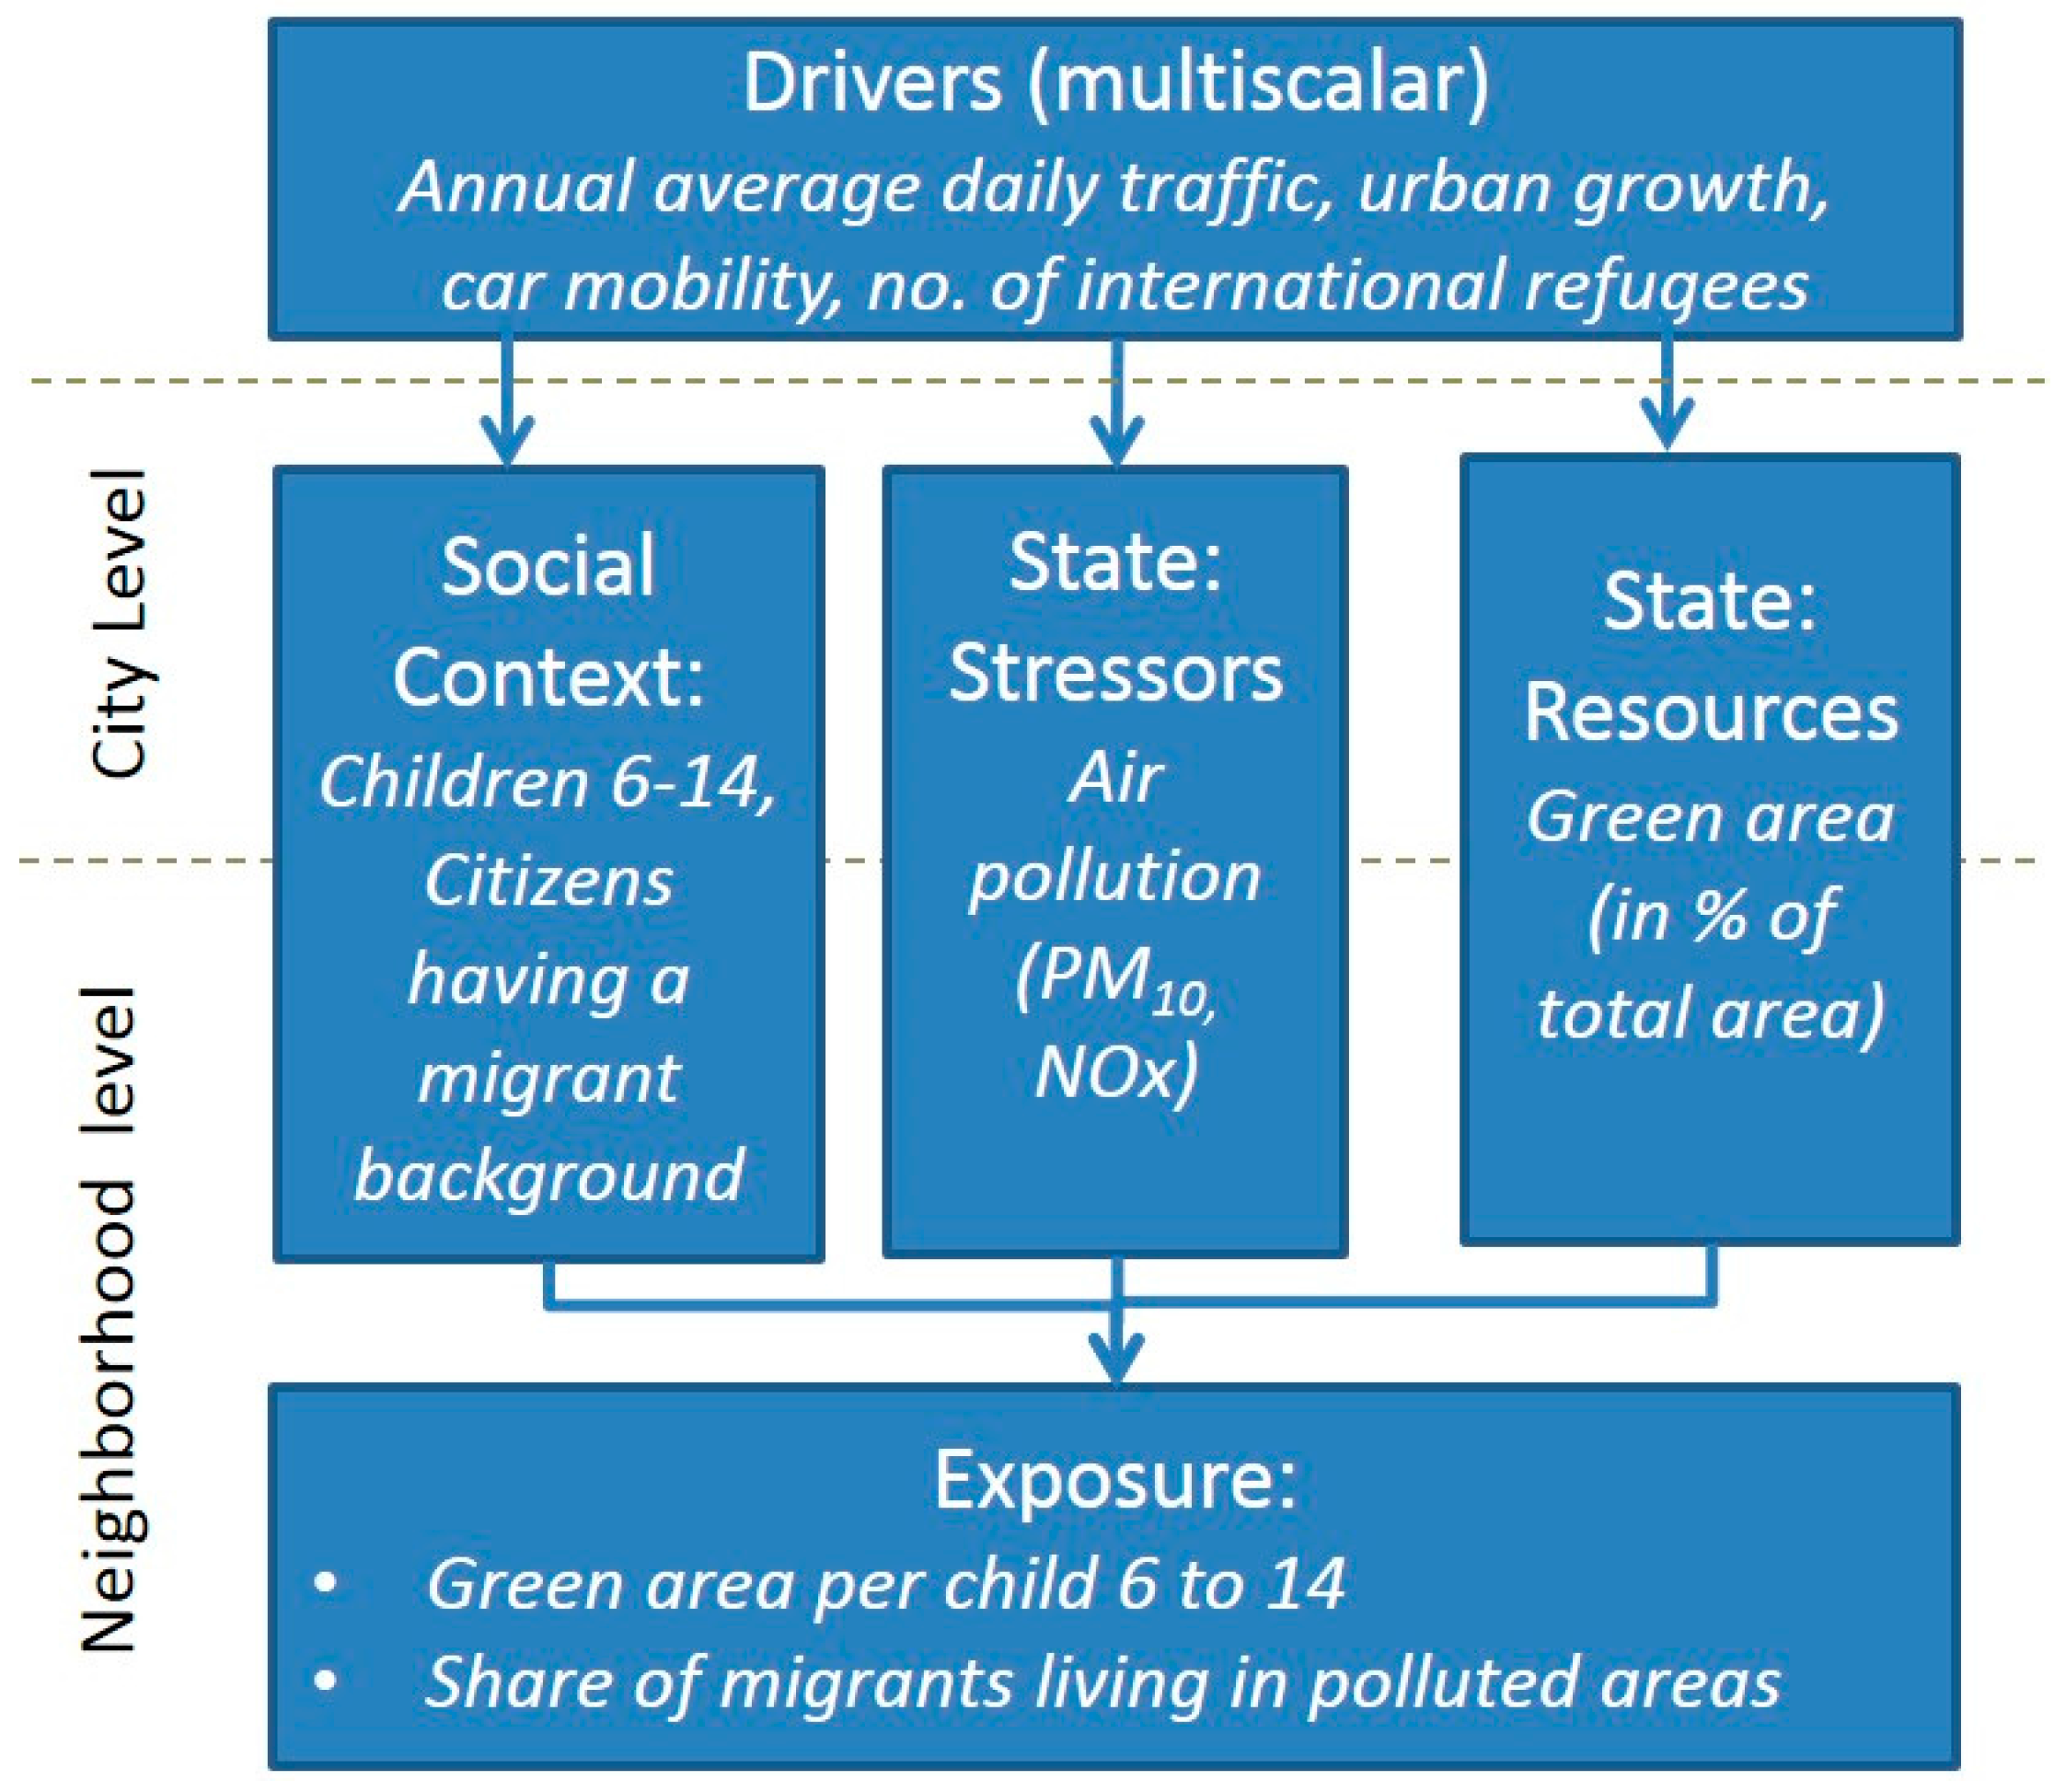
2.3. Indicator Development
3. Results
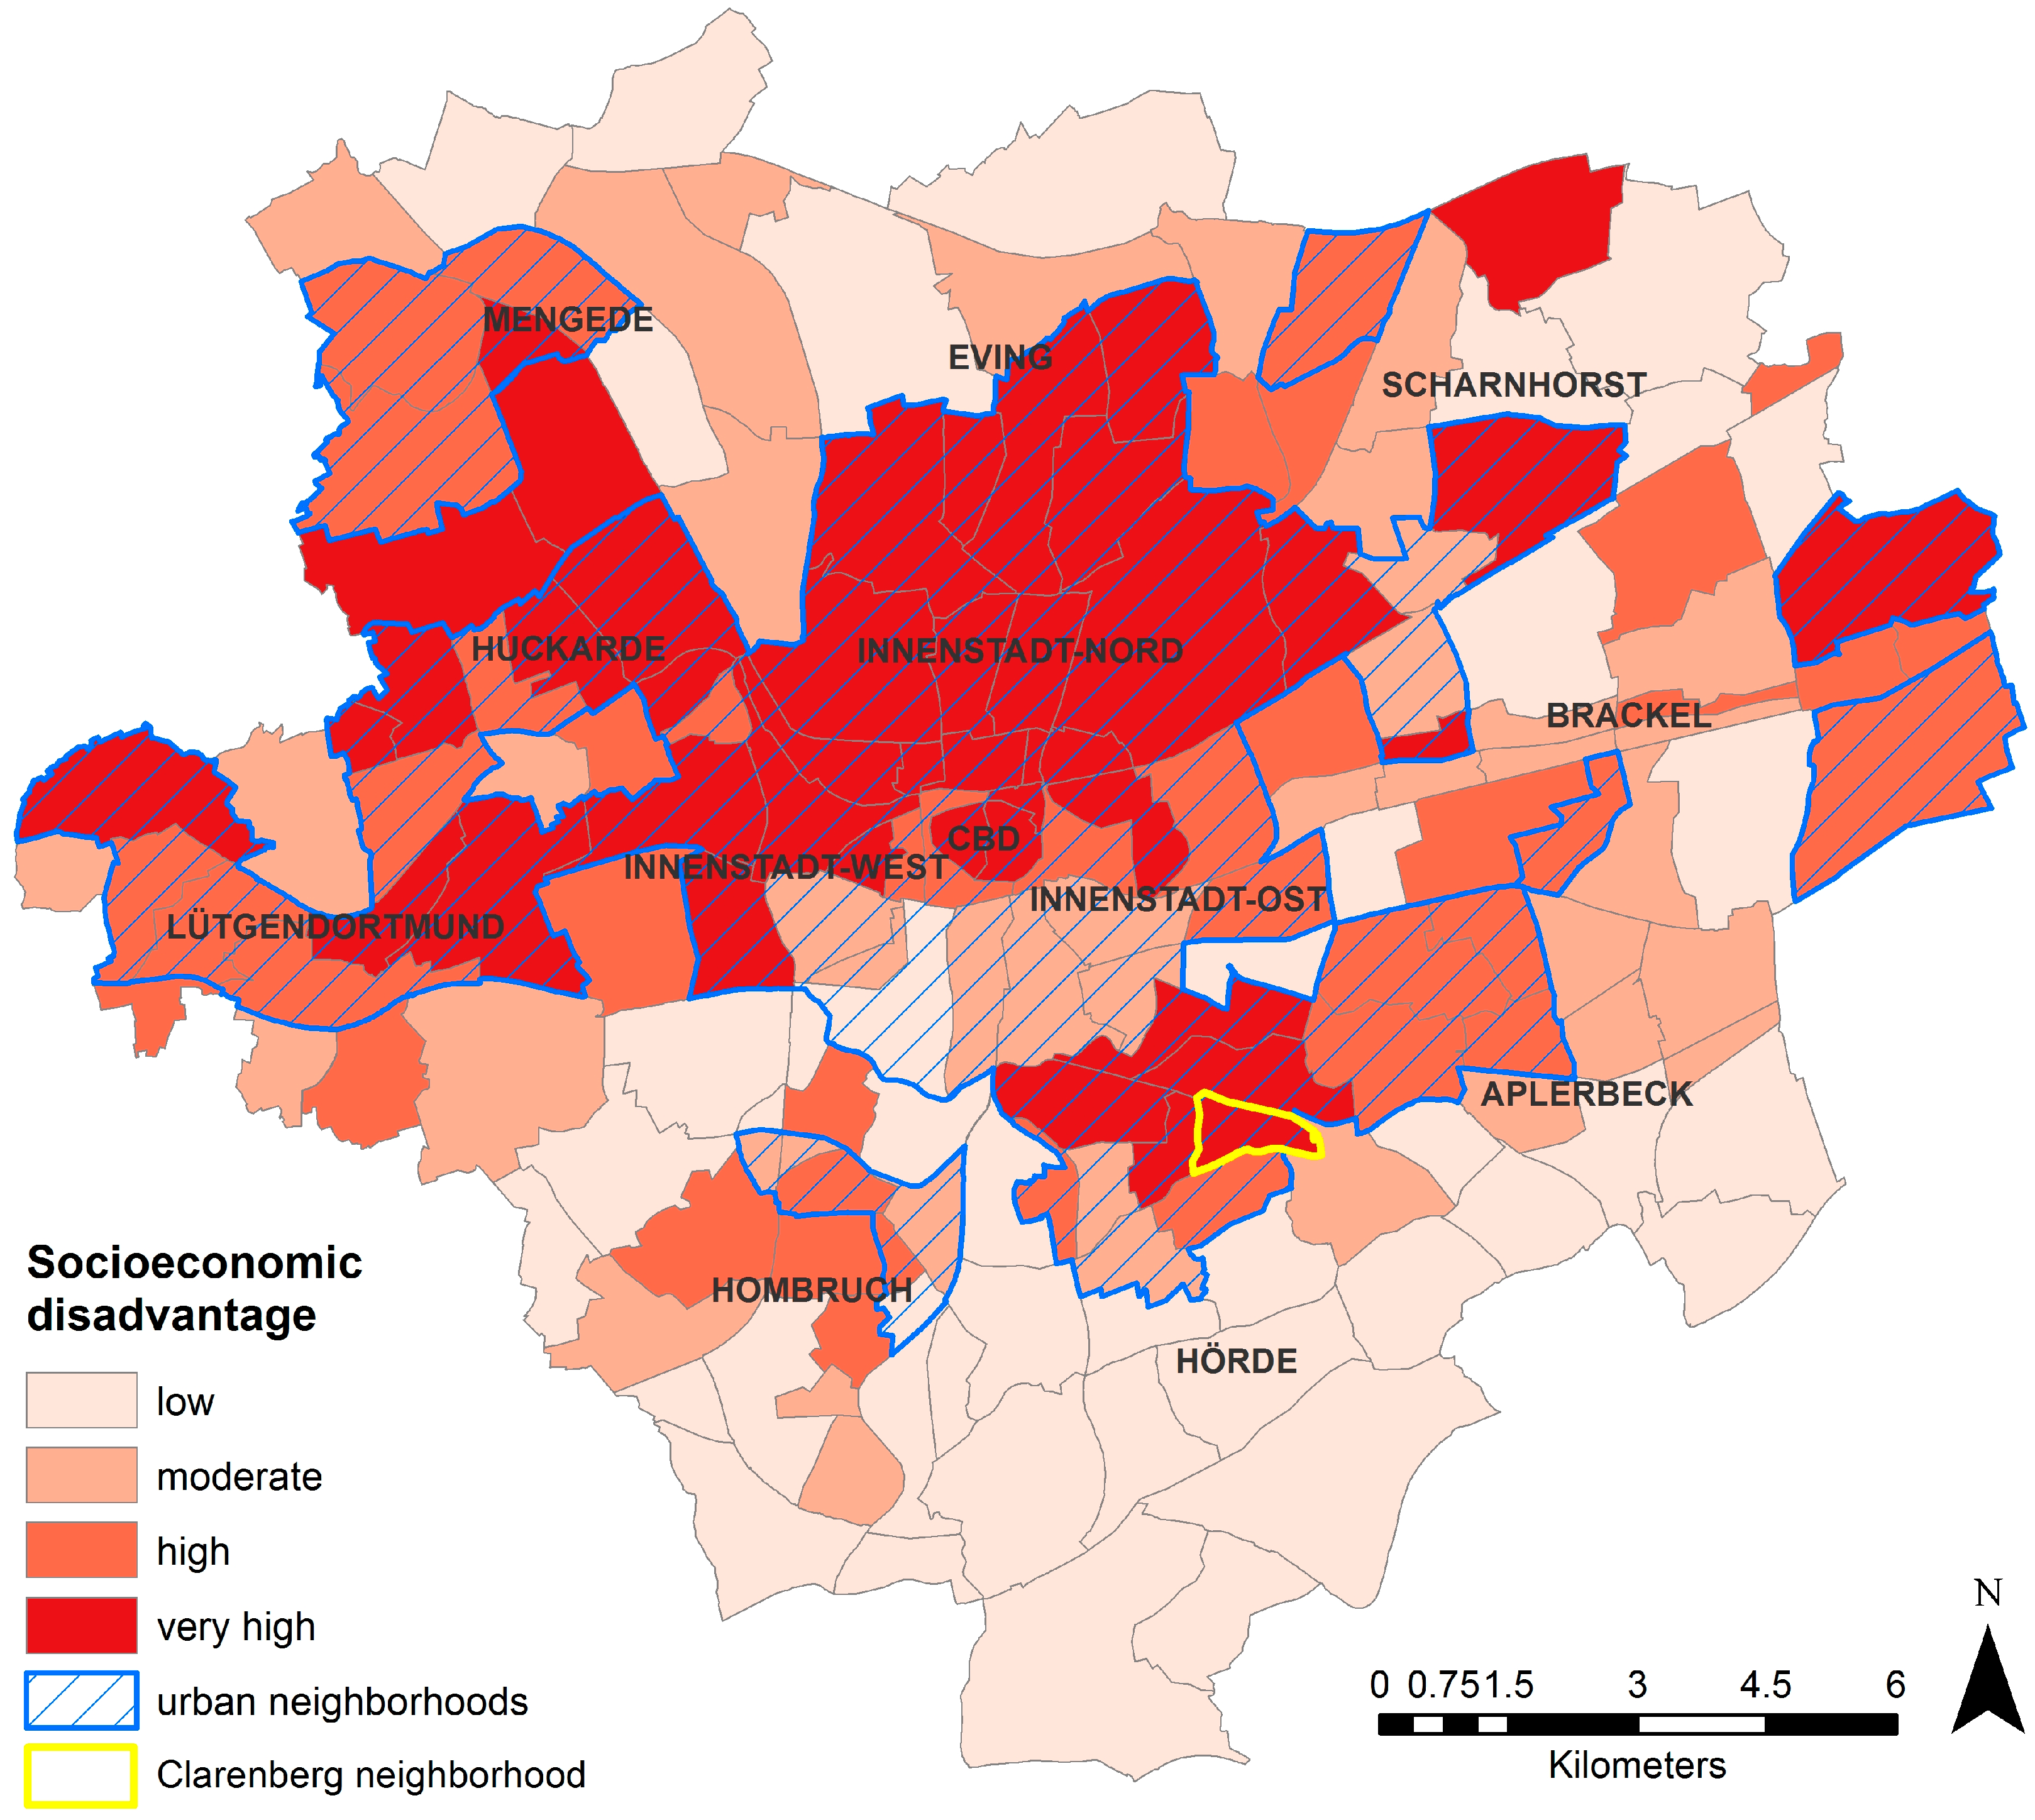
3.1. Social Context Indicators
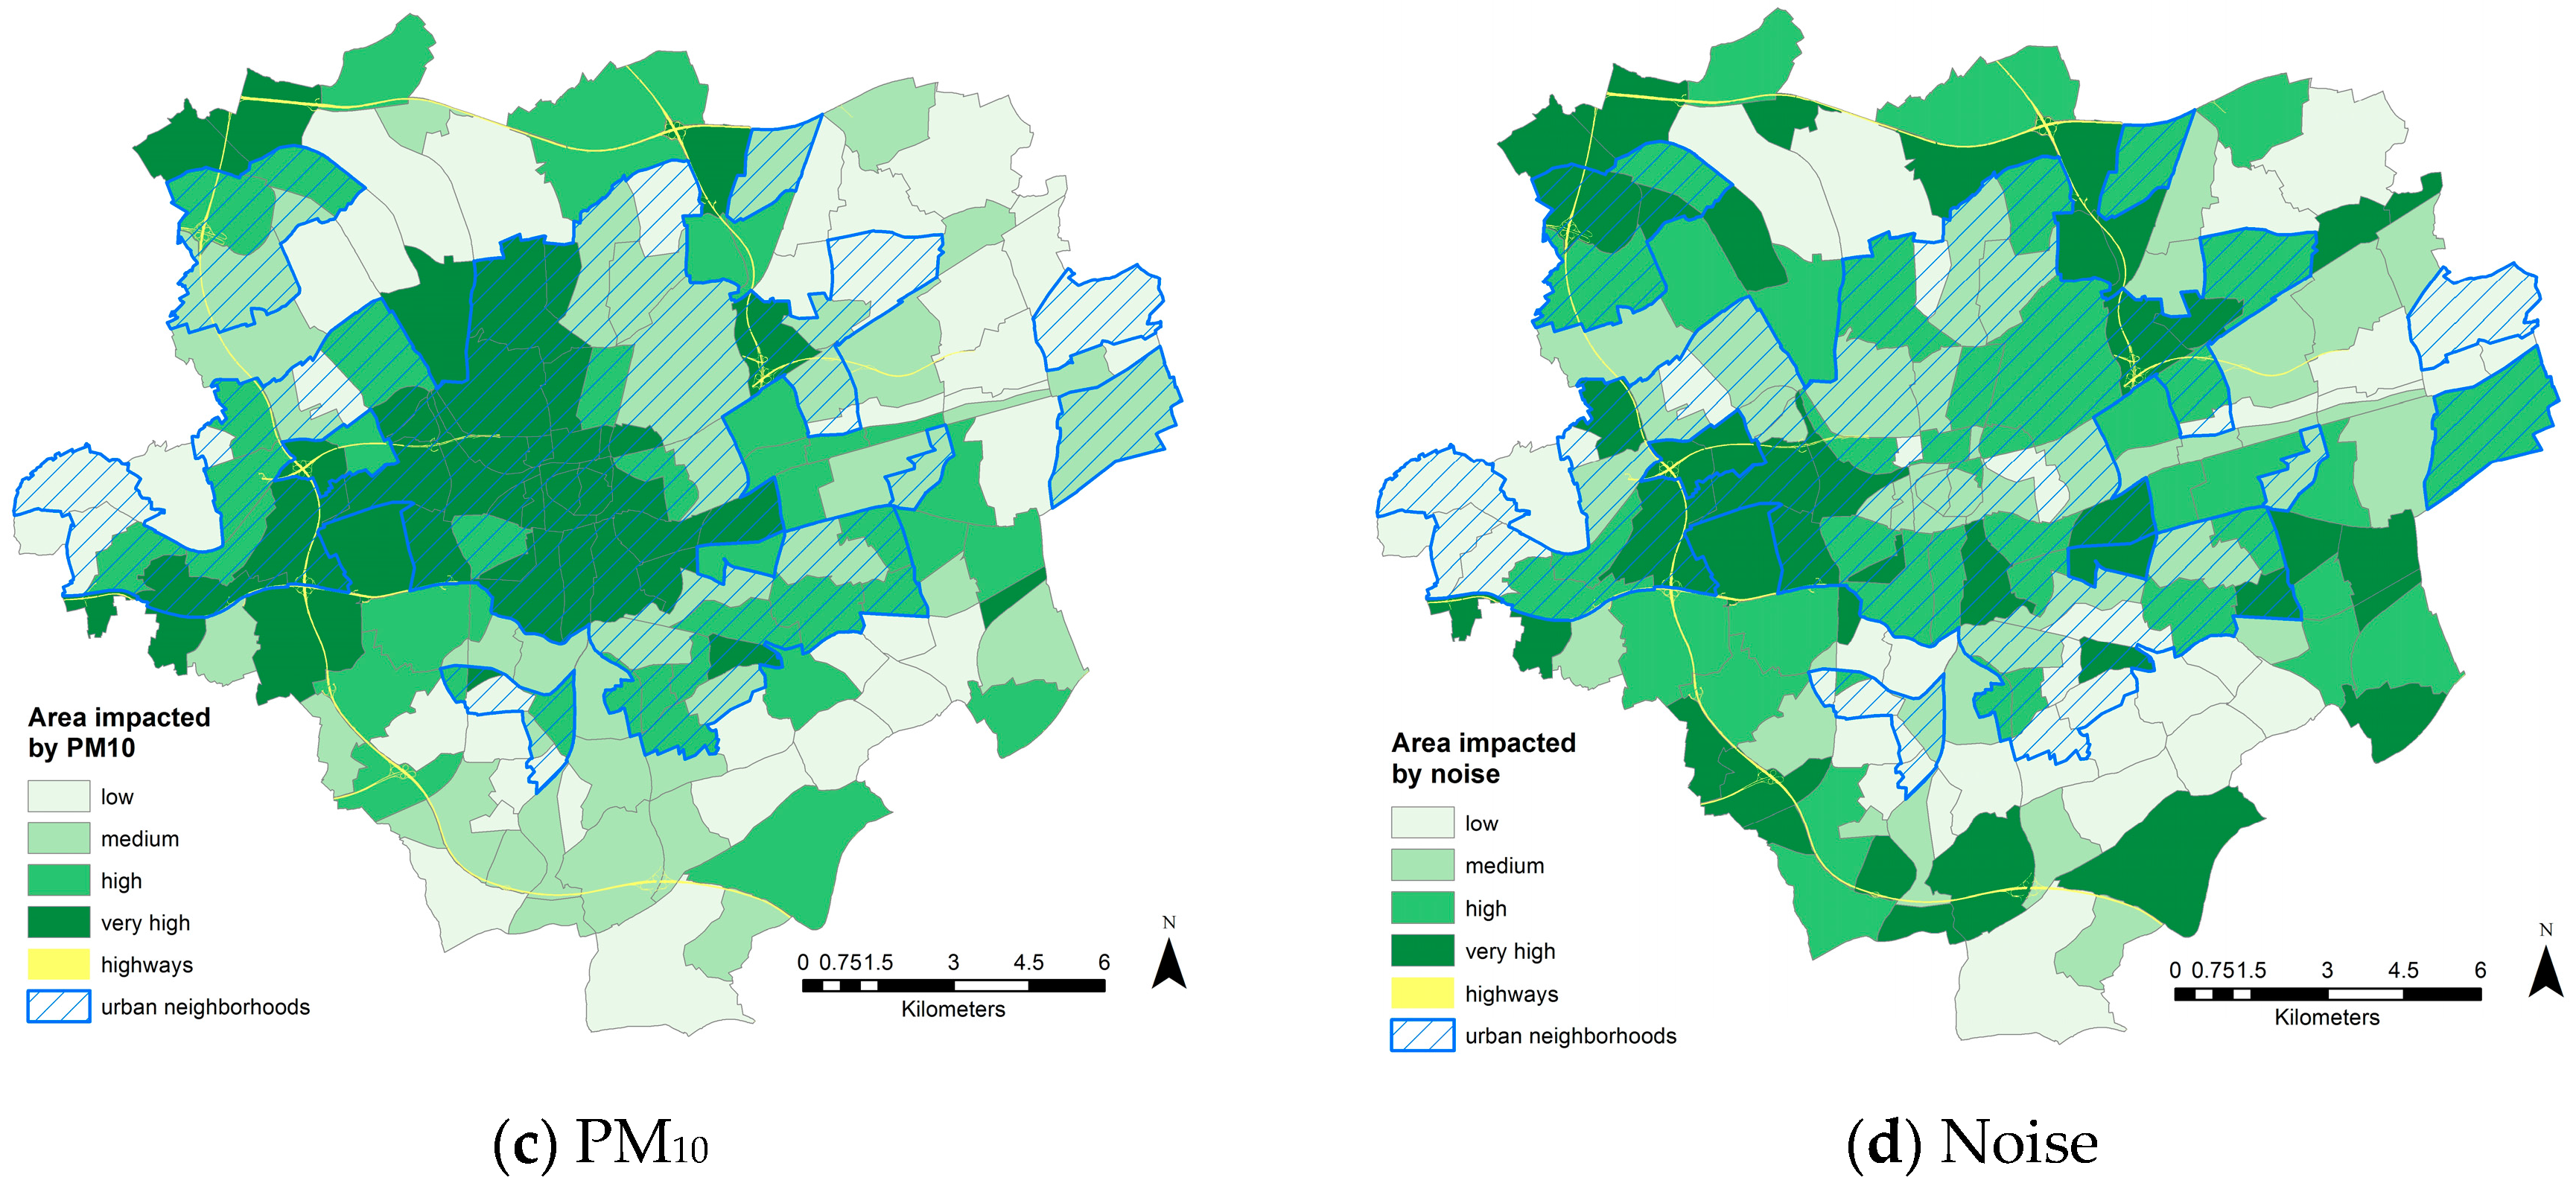
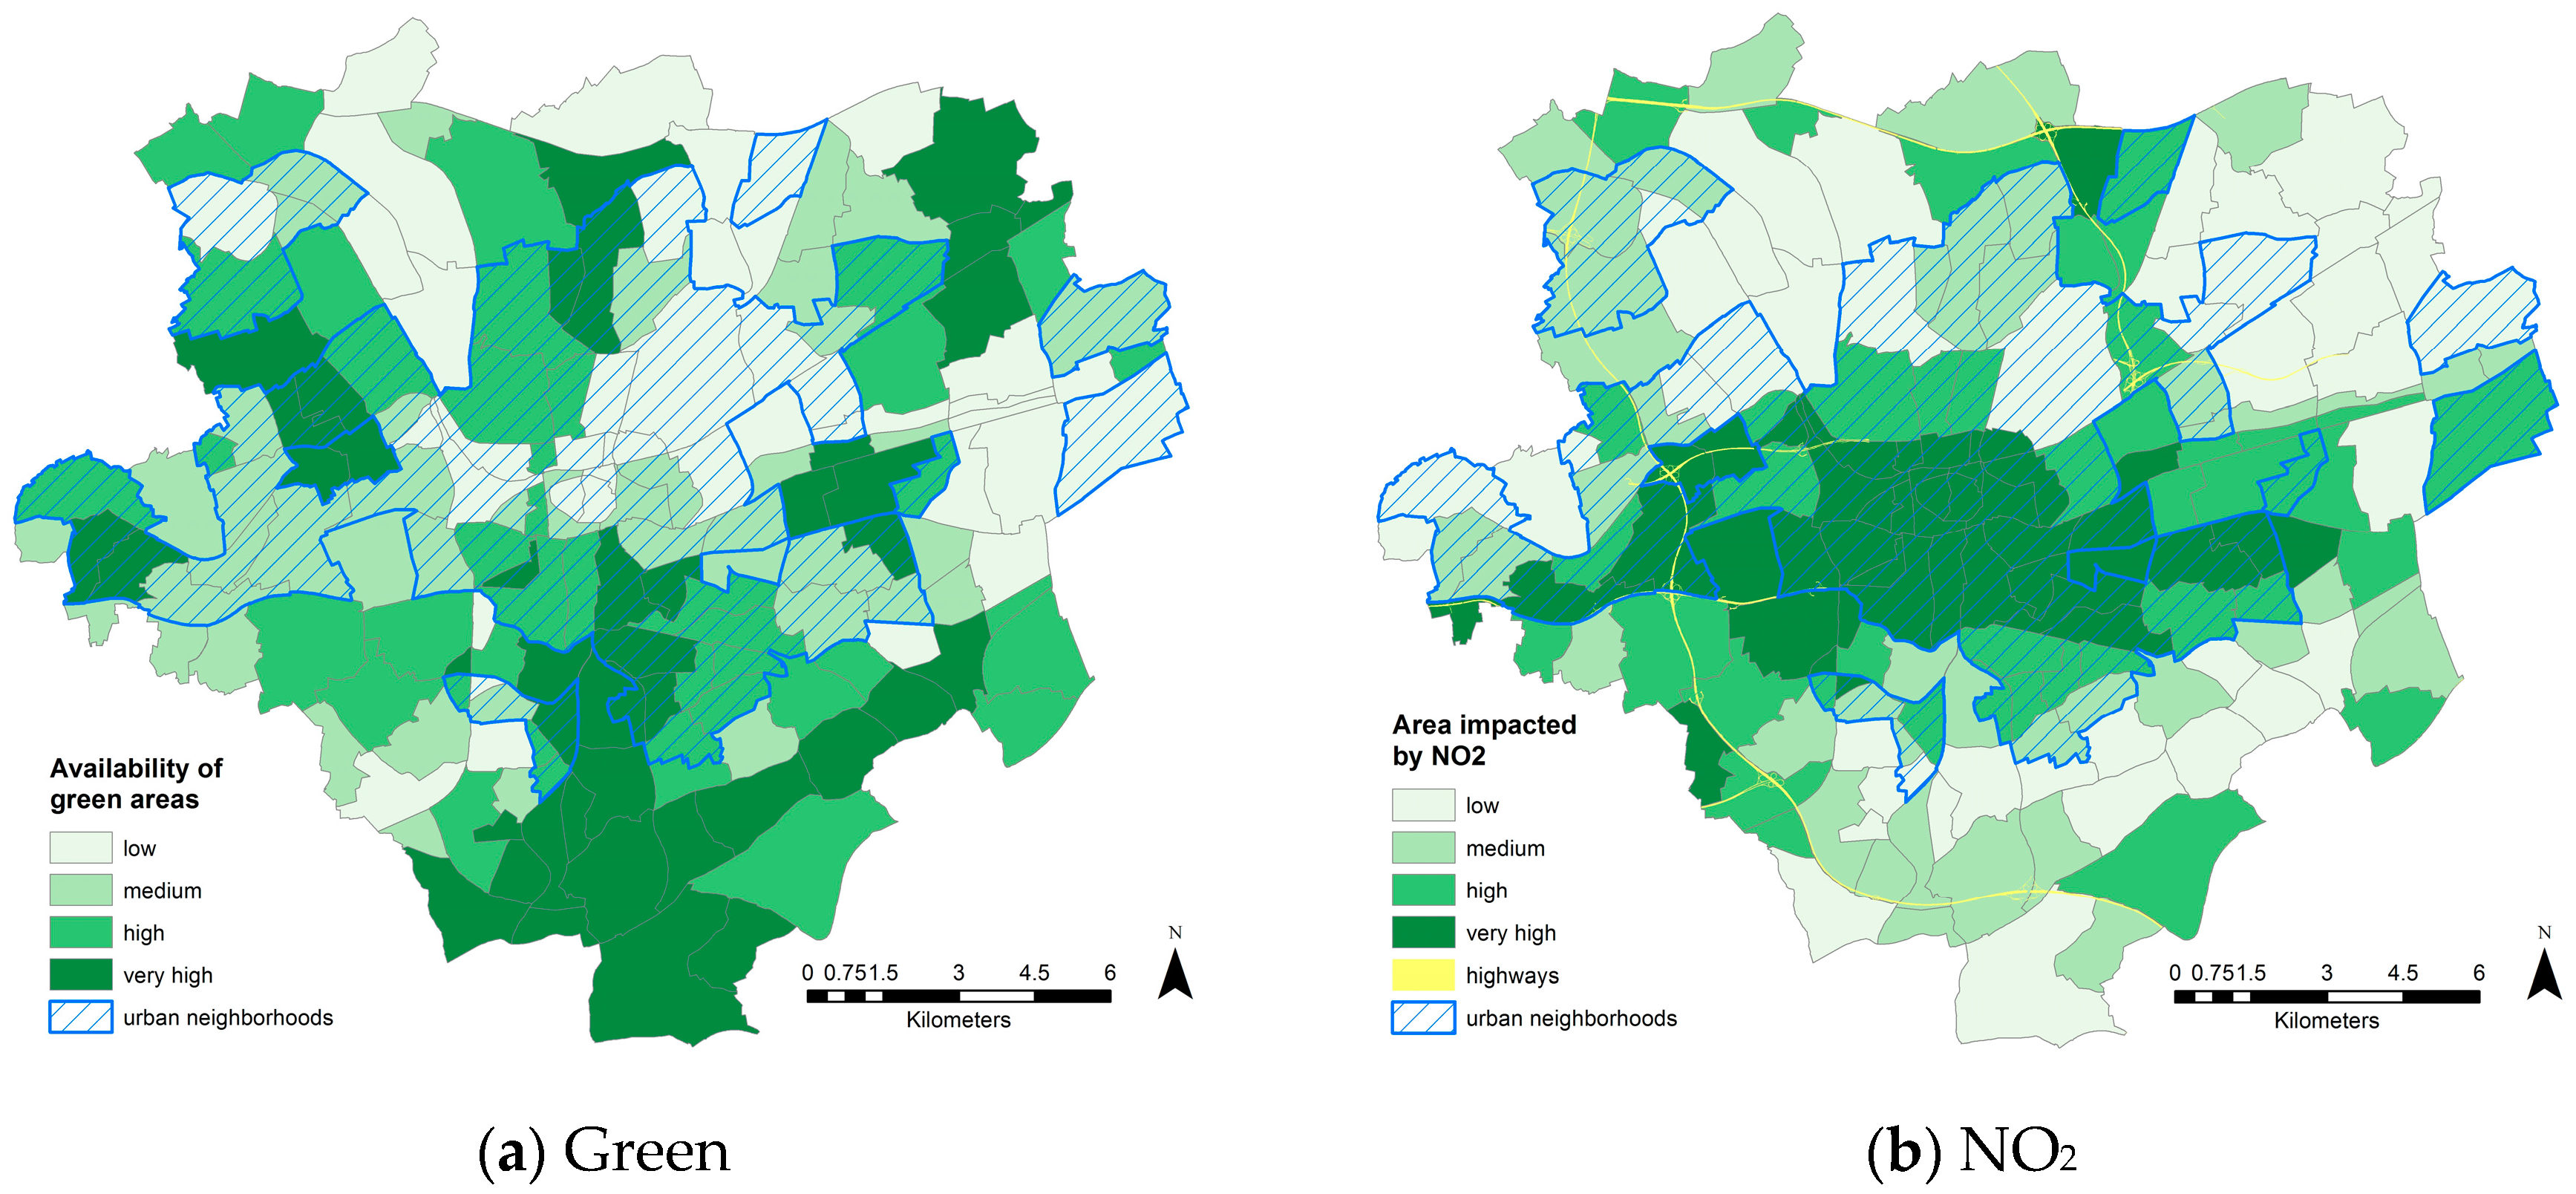
3.2. Environmental Indicators
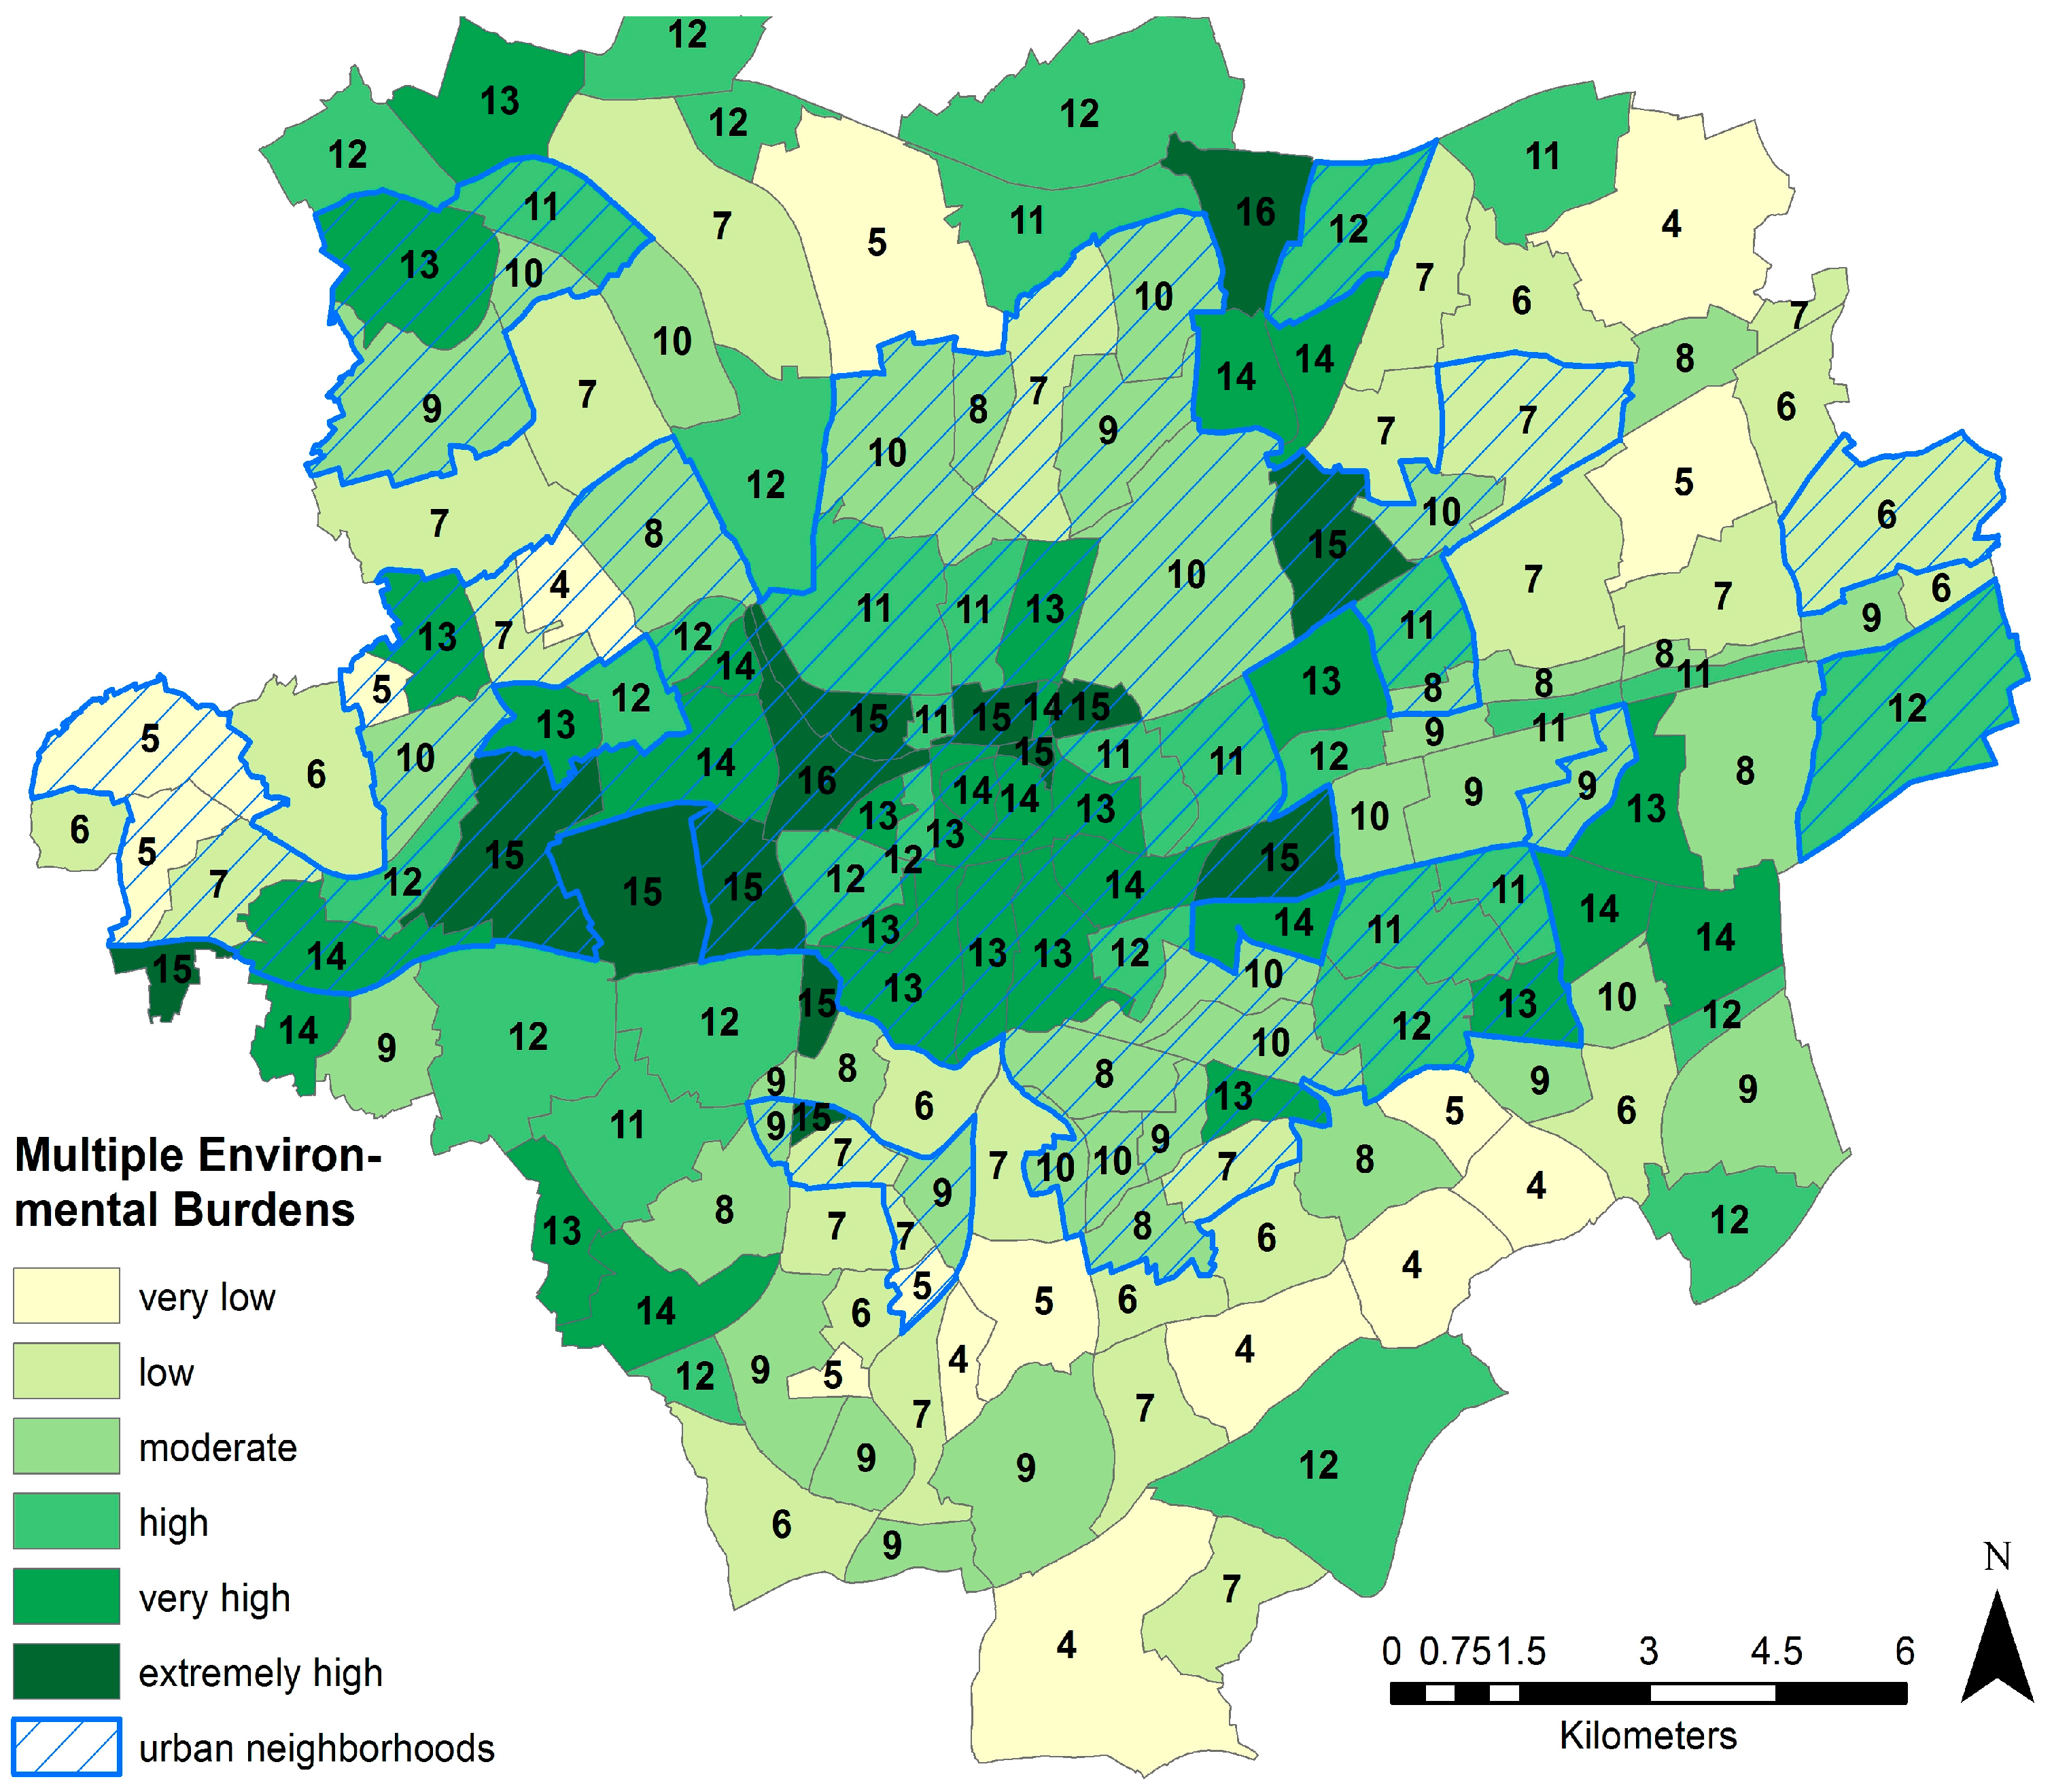
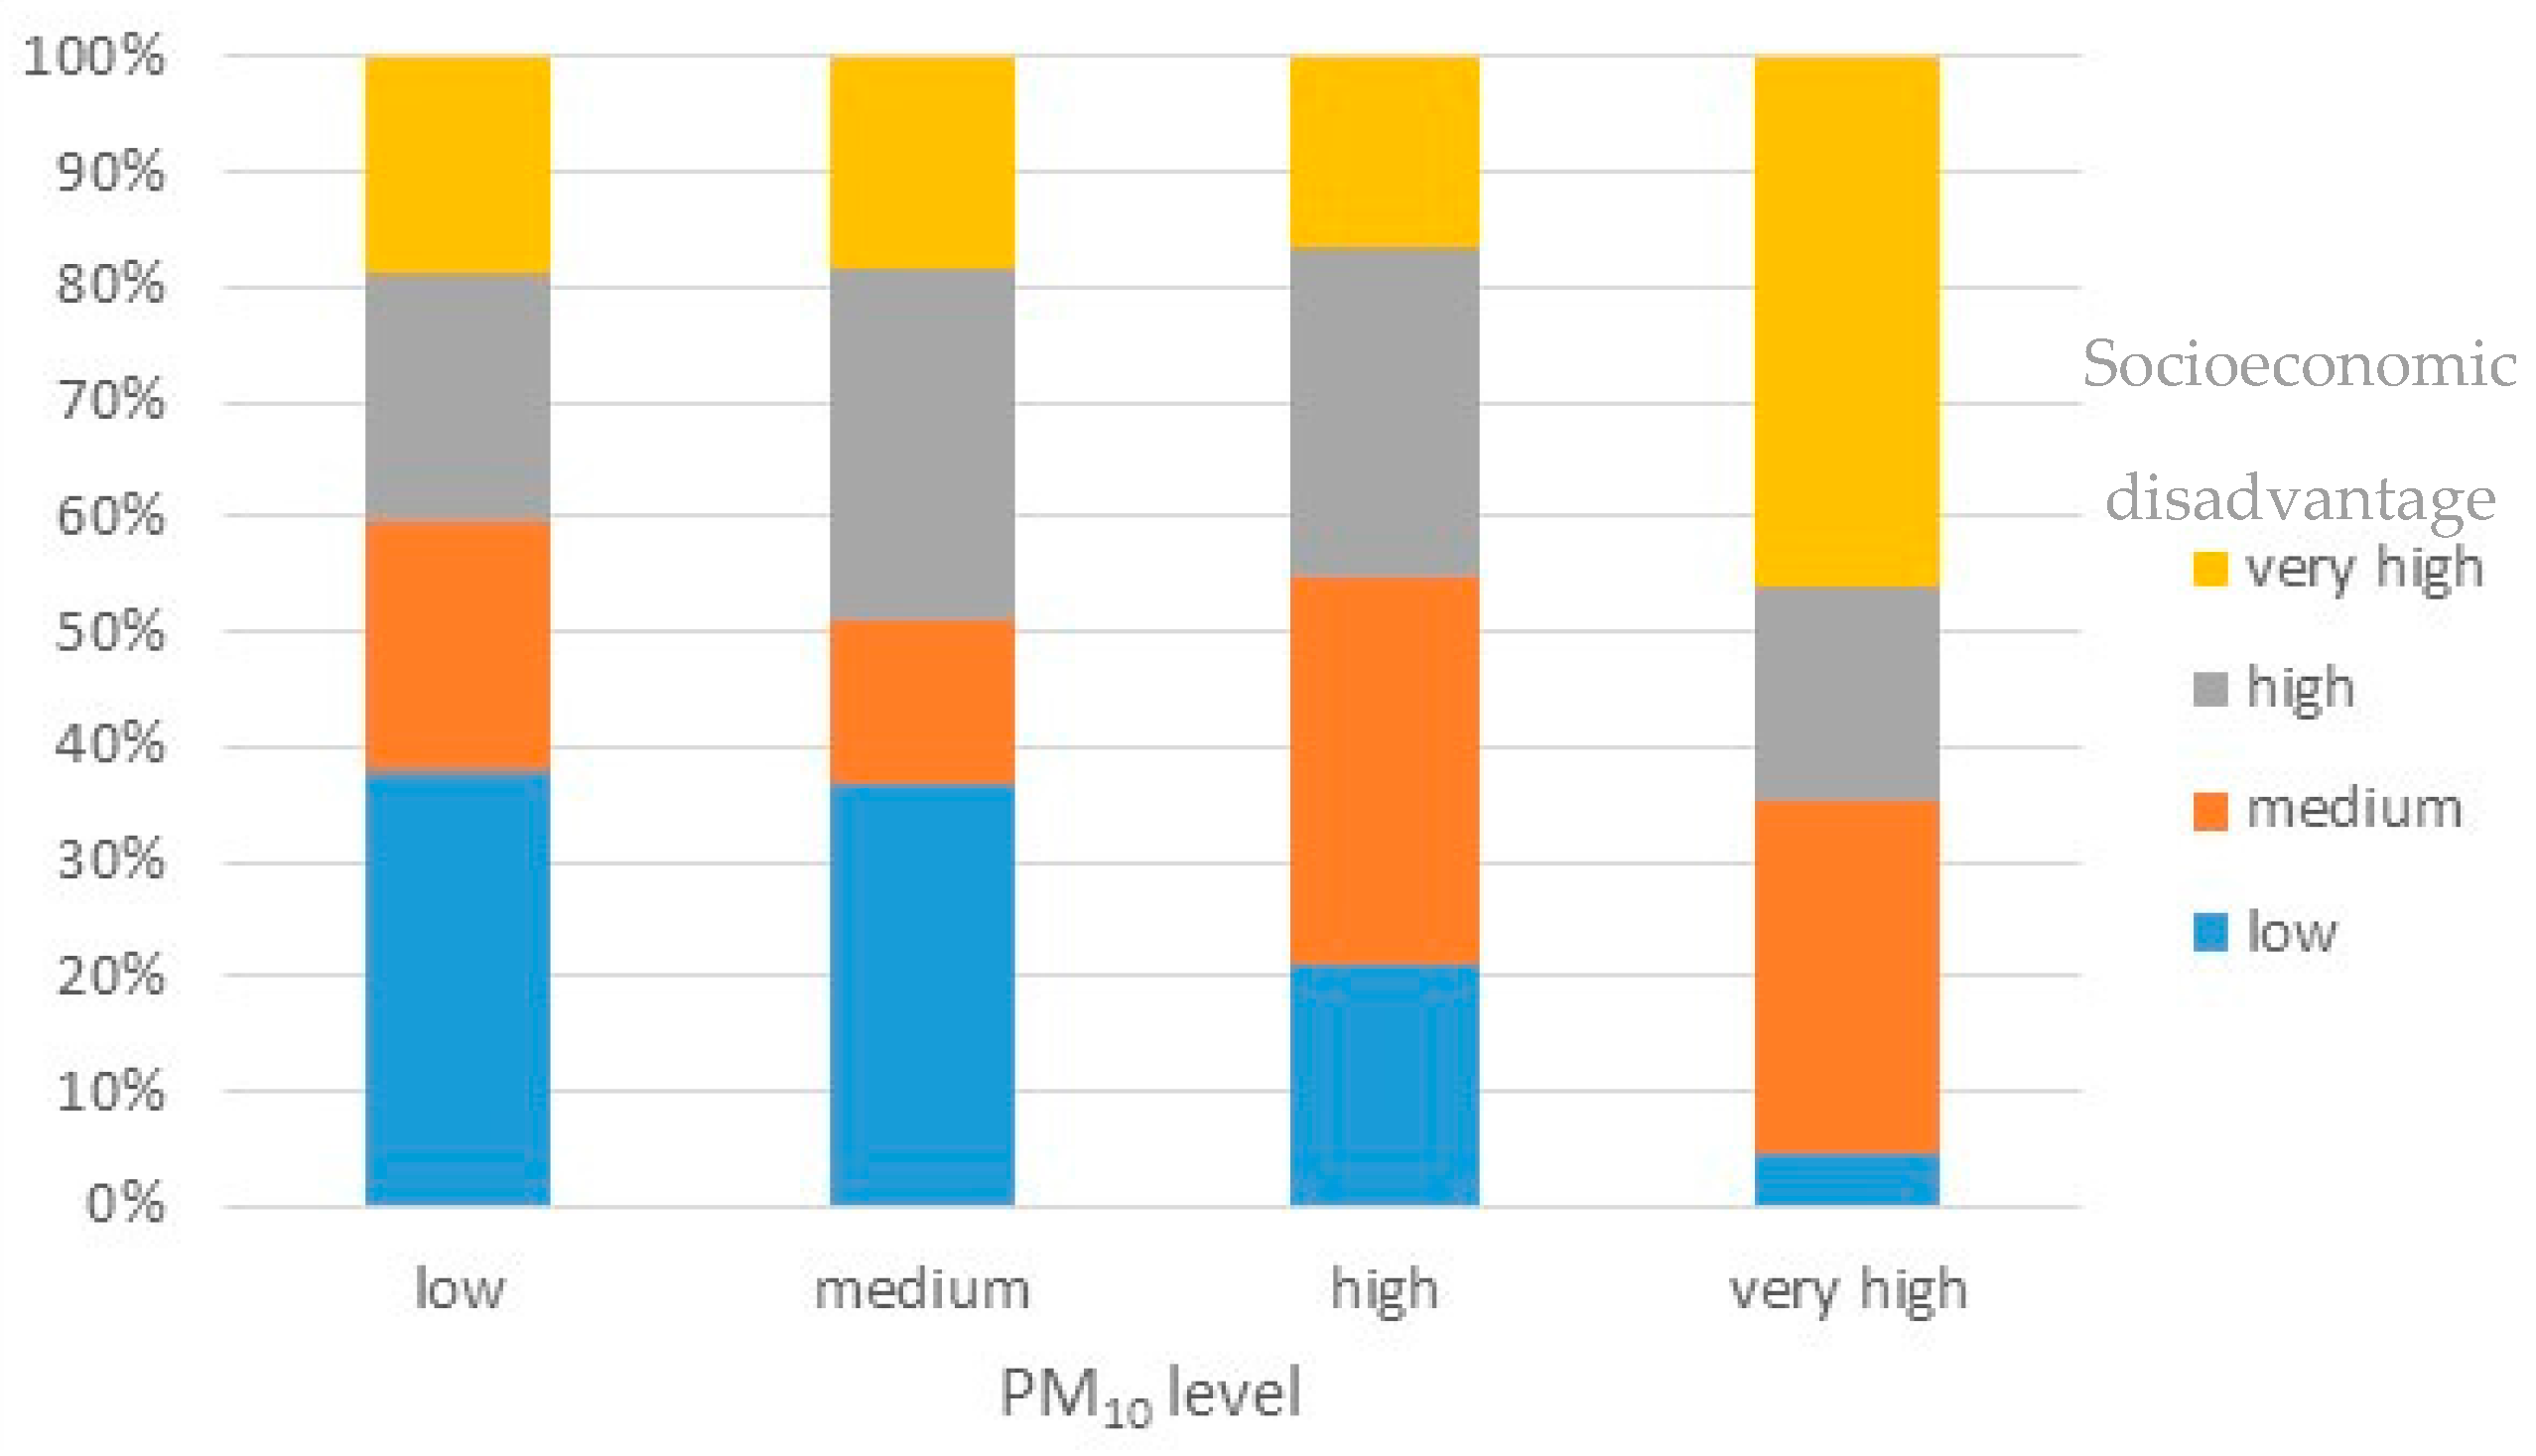
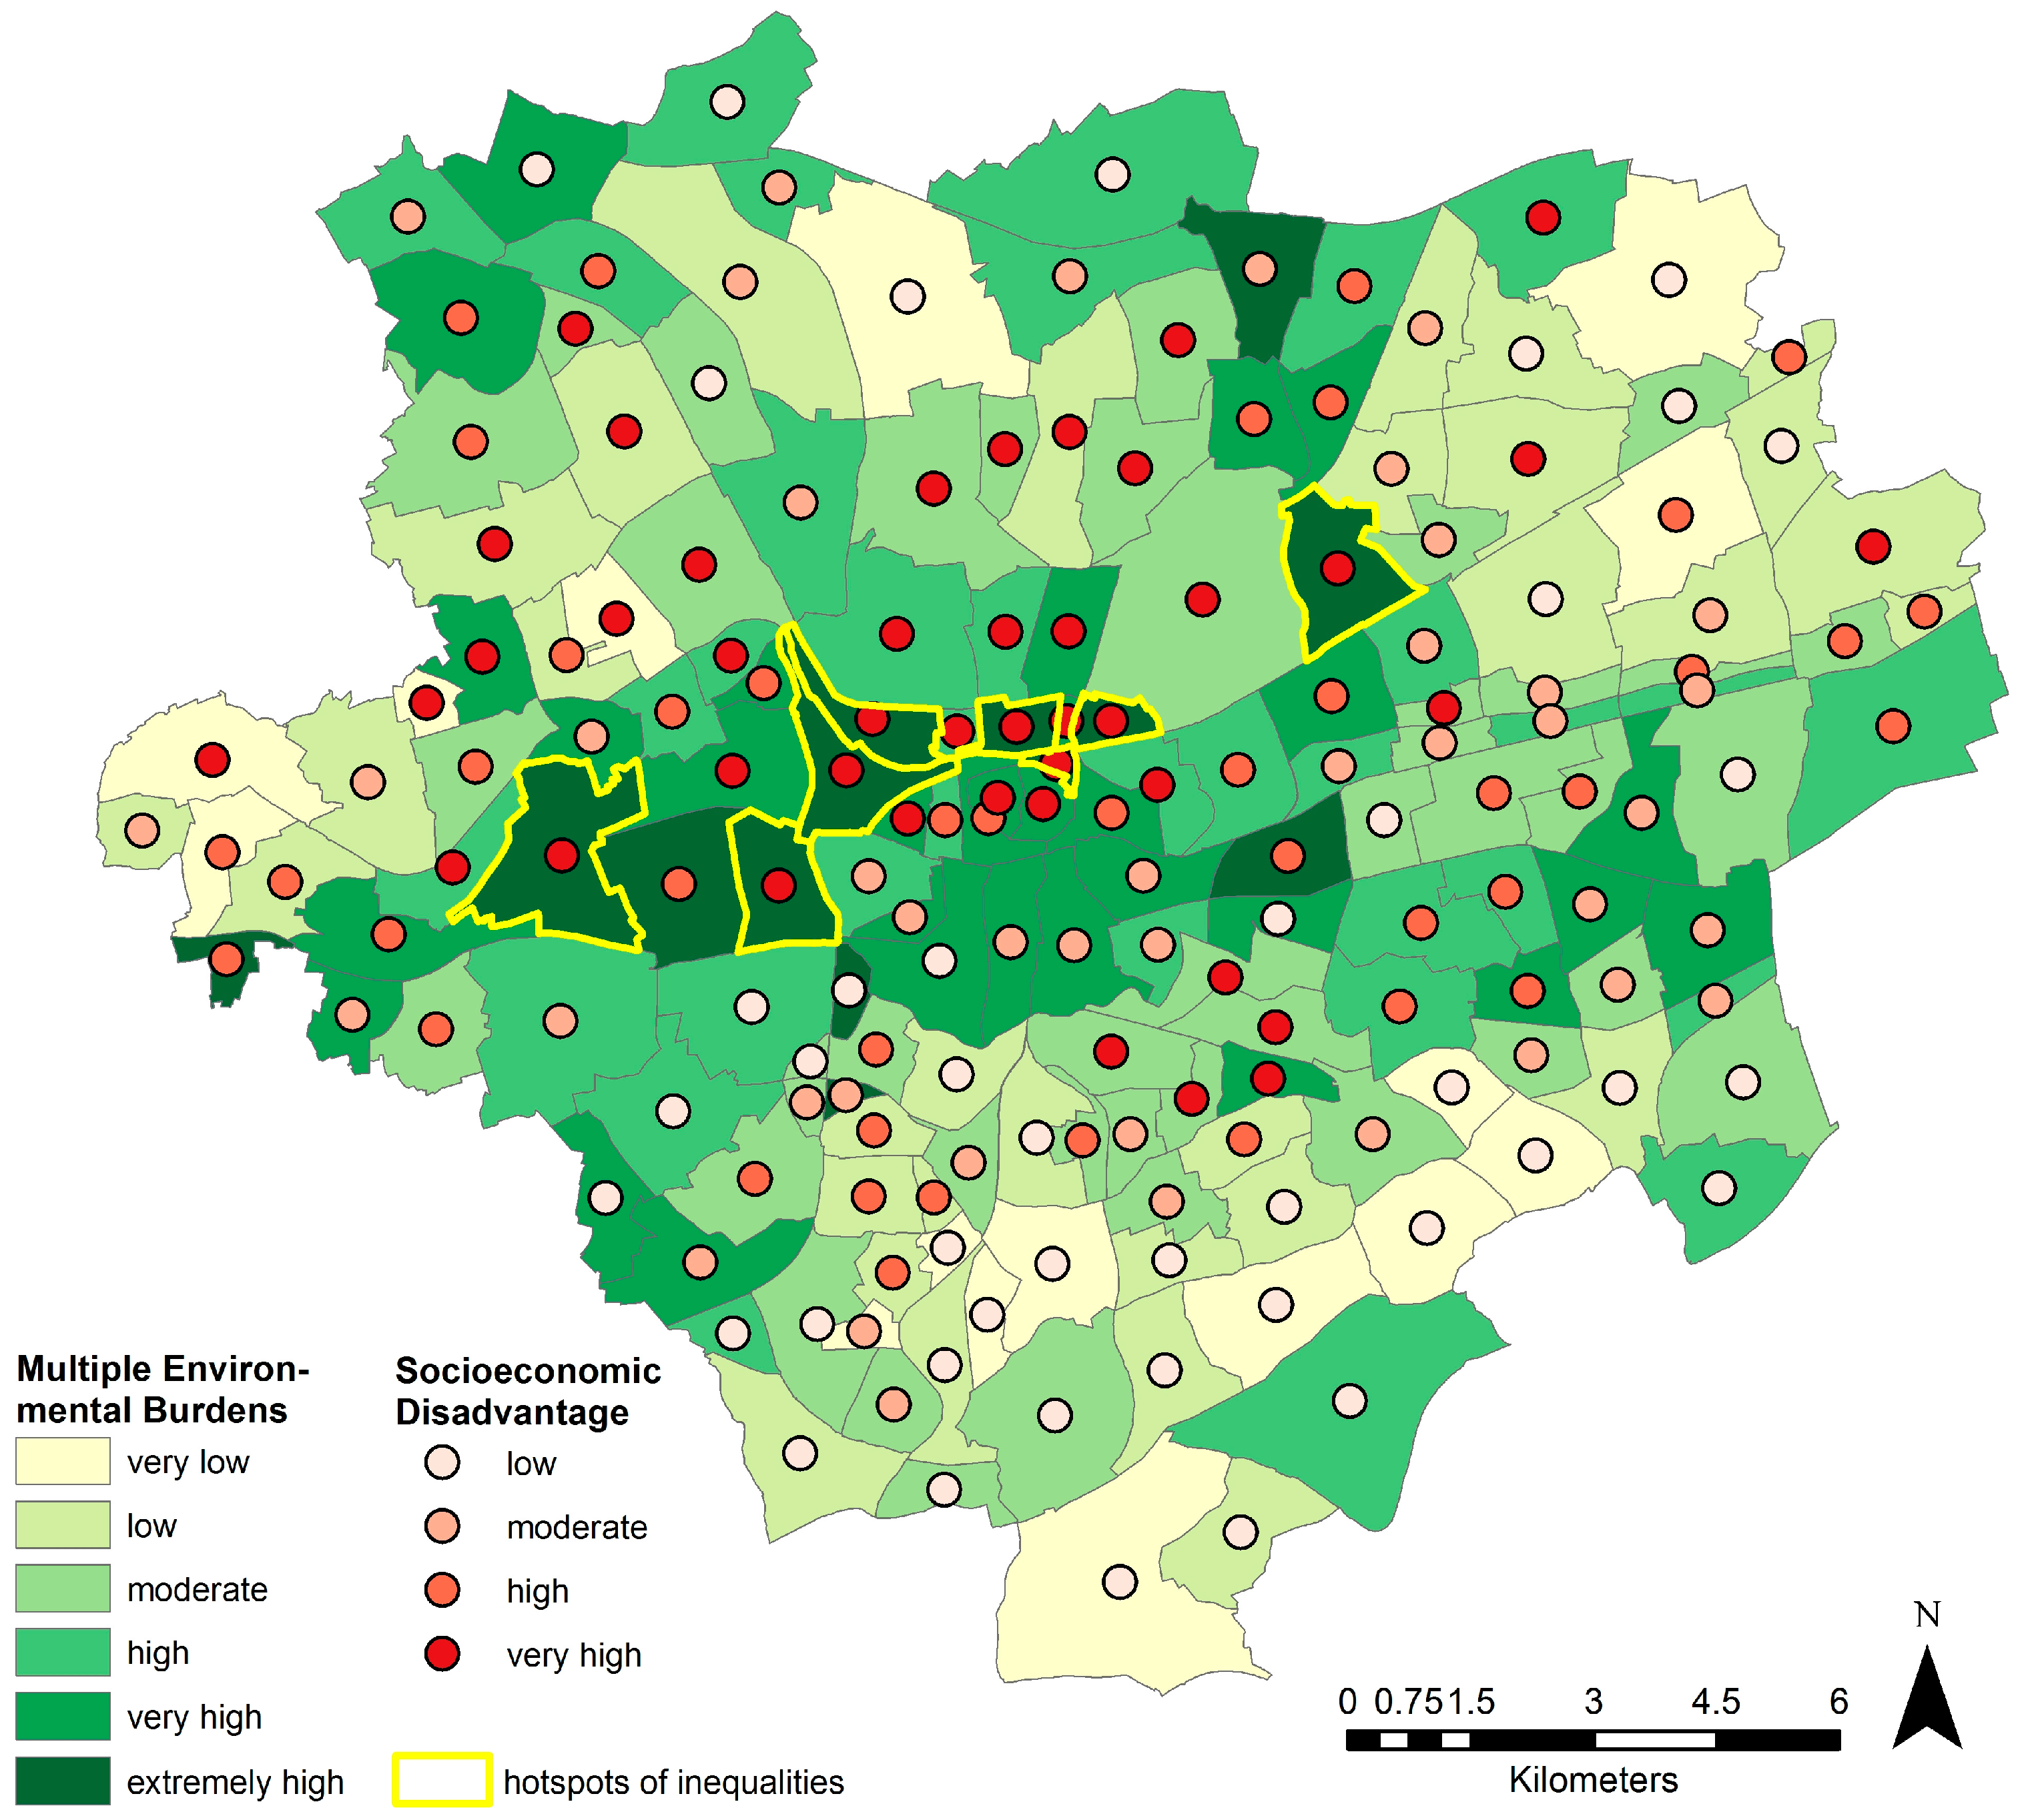
3.3. Exposure: Environmental Inequalities Relevant for Health
4. Discussion
5. Conclusions
Supplementary Materials
Acknowledgments
Author Contributions
Conflicts of Interest
References
- Corburn, J.; Cohen, A.K. Why we need urban health equity indicators: Integrating science, policy, and community. PLoS Med. 2012, 9, 1–6. [Google Scholar] [CrossRef] [PubMed]
- Commission on Social Determinants of Health (CSDH). Closing the Gap in a Generation: Health Equity through Action on the Social Determinants of Health—Final Report; WHO: Geneva, Switzerland, 2008. [Google Scholar]
- Bernard, P.; Charafeddine, R.; Frohlich, K.L.; Daniel, M.; Kestens, Y.; Potvin, L. Health inequalities and place: A theoretical conception of neighborhood. Soc. Sci. Med. 2007, 65, 1839–1852. [Google Scholar] [CrossRef] [PubMed]
- Diez Roux, A.V. Bringing context back into epidemiology: Variables and fallacies in multilevel analysis. Am. J. Public Health 1998, 88, 216–222. [Google Scholar] [CrossRef] [PubMed]
- Diez Roux, A.V. A glossary for multilevel analysis. J. Epidemiol. Commun. Health 2002, 56, 588–594. [Google Scholar] [CrossRef]
- Duncan, C.; Jones, K.; Moon, G. Context, composition and heterogeneity: Using multilevel models in health research. Soc. Sci. Med. 1998, 46, 97–117. [Google Scholar] [CrossRef]
- Macintyre, S.; Ellaway, A.; Cummins, S. Place effects on health: How can we conceptualise, operationalise and measure them? Soc. Sci. Med. 2002, 55, 125–139. [Google Scholar] [CrossRef]
- Ding, D.; Sallis, J.F.; Kerr, J.; Lee, S.; Rosenberg, D.E. Neighborhood environment and physical activity among youth a review. Am. J. Prev. Med. 2011, 41, 442–455. [Google Scholar] [CrossRef] [PubMed]
- Feng, J.; Glass, T.A.; Curriero, F.C.; Stewart, W.F.; Schwartz, B.S. The built environment and obesity: A systematic review of the epidemiologic evidence. Health Place 2010, 16, 175–190. [Google Scholar] [CrossRef] [PubMed]
- Pickett, K.E.; Pearl, M. Multilevel analyses of neighborhood socioeconomic context and health outcomes: A critical review. J. Epidemiol. Commun. Health 2001, 55, 111–122. [Google Scholar] [CrossRef]
- Riva, M.; Gauvin, L.; Barnett, T.A. Toward the next generation of research into small area effects on health: A synthesis of multilevel investigations published since July 1998. J. Epidemiol. Commun. Health 2007, 61, 853–861. [Google Scholar] [CrossRef] [PubMed]
- Van Holle, V.; Deforche, B.; van Cauwenberg, J.; Goubert, L.; Maes, L.; van de Weghe, N.; de Bourdeaudhuij, I. Relationship between the physical environment and different domains of physical activity in European adults: A systematic review. BMC Public Health 2012. [Google Scholar] [CrossRef] [PubMed]
- Voigtlander, S.; Berger, U.; Razum, O. The impact of regional and neighborhood deprivation on physical health in Germany: A multilevel study. BMC Public Health 2010. [Google Scholar] [CrossRef] [PubMed]
- Bolte, G.; Voigtländer, S.; Razum, O.; Mielck, A. Modelle zur erklärung des zusammenhangs zwischen sozialer lage, umwelt und gesundheit. In Umweltgerechtigkeit: Chancengleichheit bei Umwelt und Gesundheit: Konzepte, Datenlage und Handlungsperspektiven, 1st ed.; Bolte, G., Bunge, C., Hornberg, C., Köckler, H., Mielck, A., Eds.; H. Huber: Bern, Switzerland, 2012; pp. 39–50. [Google Scholar]
- Barzyk, T.M.; White, B.M.; Millard, M.; Martin, M.; Perlmutt, L.D.; Harris, F.; Nguyen, P.; Walts, A.; Geller, A. Linking socio-economic status, adverse health outcome, and environmental pollution information to develop a set of environmental justice indicators with three case study applications. Environ. Justice 2011, 4, 171–177. [Google Scholar] [CrossRef]
- Todd, H.; Zografos, C. Justice for the environment: Developing a set of indicators of environmental justice for Scotland. Environ. Values 2005, 14, 483–501. [Google Scholar] [CrossRef]
- Raddatz, L.; Mennis, J. Environmental justice in Hamburg, Germany. Prof. Geogr. 2013, 65, 495–511. [Google Scholar] [CrossRef]
- Walker, G.P. Environmental Justice: Concepts, Evidence and Politics; Routledge: London, UK; New York, NY, USA, 2012. [Google Scholar]
- Diez Roux, A.V.; Mair, C. Neighborhoods and health. Ann. N. Y. Acad. Sci. 2010, 1186, 125–145. [Google Scholar] [CrossRef] [PubMed]
- Barton, H.; Grant, M. Urban planning for healthy cities: A review of the progress of the European healthy cities programme. J. Urban Health 2013, 90, 129–141. [Google Scholar] [CrossRef] [PubMed]
- Gelormino, E.; Melis, G.; Marietta, C.; Costa, G. From built environment to health inequalities: An explanatory framework based on evidence. Prev. Med. Rep. 2015, 2, 737–745. [Google Scholar] [CrossRef] [PubMed]
- Bambra, C.; Gibson, M.; Sowden, A.; Wright, K.; Whitehead, M.; Petticrew, M. Tackling the wider social determinants of health and health inequalities: Evidence from systematic reviews. J. Epidemiol. Community Health 2010, 64, 284–291. [Google Scholar] [CrossRef] [PubMed]
- Braubach, M.; Grant, M. Evidence review on the spatial determinants of health in urban settings. In Urban Planning, Environment and Health: From Evidence to Policy Action—Meeting Report; WHO Regional Office for Europe: Copenhagen, Denmark, 2010; pp. 25–90. [Google Scholar]
- NSW Department of Health. Healthy Urban Development Checklist: A Guide for Health Services When Commenting on Development Policies, Plans and Proposals; NSW Department of Health: North Ryde BC, NSW, Australia, 2009. [Google Scholar]
- Abernethy, P. Bridging conceptual “silos”: Bringing together health promotion and sustainability governance for practitioners at the landscape scale. Local Environ. 2014, 21, 1–25. [Google Scholar] [CrossRef]
- Lowe, M.; Whitzman, C.; Badland, H.; Davern, M.; Aye, L.; Hes, D.; Butterworth, I.; Giles-Corti, B. Planning healthy, liveable and sustainable cities: How can indicators inform policy? Urban Policy Res. 2015, 33, 131–144. [Google Scholar] [CrossRef]
- Friel, S.; Akerman, M.; Hancock, T.; Kumaresan, J.; Marmot, M.; Melin, T.; Vlahov, D. Addressing the social and environmental determinants of urban health equity: Evidence for action and a research agenda. J. Urban Health 2011, 88, 860–874. [Google Scholar] [CrossRef] [PubMed]
- WHO. Environmental Health Indicators. Framework and Methodologies; WHO: Geneva, Switzerland, 1999. [Google Scholar]
- WHO & UN Habitat. Hidden Cities: Unmasking and Overcoming Health Inequities in Urban Settings; WHO & UN Habitat: Kobe, Japan, 2010. [Google Scholar]
- Fairburn, J.; Smith, G. Working towards a Better Quality of Life: Environmental Justice in South Yorkshire; Leeds: West Yorkshire, UK, 2008. [Google Scholar]
- Rothenberg, R.; Weaver, S.R.; Dai, D.; Stauber, C.; Prasad, A.; Kano, M. A flexible urban health index for small area disparities. J. Urban Health 2014, 91, 823–835. [Google Scholar] [CrossRef] [PubMed]
- Prasad, A.; Kano, M.; Dagg, K.A.-M.; Mori, H.; Senkoro, H.H.; Ardakani, M.A.; Elfeky, S.; Good, S.; Engelhardt, K.; Ross, A.; et al. Prioritizing action on health inequities in cities: An evaluation of urban health equity assessment and response tool (Urban HEART) in 15 cities from Asia and Africa. Soc. Sci. Med. 2015, 145, 237–242. [Google Scholar] [CrossRef] [PubMed]
- Flacke, J.; Köckler, H. Spatial urban health equity indicators—A framework-based approach supporting spatial decision making. In Sustainable Development and Planning VII; Özçevik, Ö., Brebbia, C., Şener, S., Eds.; Wit Press: Southampton, UK, 2015; pp. 365–376. [Google Scholar]
- Morris, G.; Beck, S.; Hanlon, P.; Robertson, R. Getting strategic about the environment and health. Public Health 2006, 120, 889–903. [Google Scholar] [CrossRef] [PubMed]
- Hambling, T.; Weinstein, P.; Slaney, D. A review of frameworks for developing environmental health indicators for climate change and health. Int. J. Environ. Res. Public Health 2011, 8, 1–22. [Google Scholar] [CrossRef] [PubMed]
- Alexeeff, G.V.; Faust, J.B.; August, L.M.; Milanes, C.; Randles, K.; Zeise, L.; Denton, J. A screening method for assessing cumulative impacts. Int. J. Environ. Res. Public Health 2012, 9, 648–659. [Google Scholar] [CrossRef] [PubMed]
- Baden, B.M.; Noonan, D.S.; Turaga, R.M.R. Scales of justice: Is there a geographic bias in environmental equity analysis? J. Environ. Plan. Manag. 2007, 50, 163–185. [Google Scholar] [CrossRef]
- Stadt Dortmund. Gebietstypisierung: Am Beispiel der 170 stastistischen Unterbezirke in Dortmund; Stadt Dortmund: Dortmund, Germany, 2010. [Google Scholar]
- Stadt Dortmund. Statistikatlas Dortmunder Stadtteile: Dortmunder Statistik 2015; Stadt Dortmund: Dortmund, Germany, 2015. [Google Scholar]
- Statista GmbH. Arbeitslosenquote in Deutschland von Mai 2015 bis Mai 2016. Available online: http://www.de.statista.com/statistik/daten/studie/1239/umfrage/aktuelle-arbeitslosenquote-in-deutschland-monatsdurchschnittswerte/ (accessed on 12 June 2016).
- Köckler, H.; Blaettner, B.; Bolte, G.; Flacke, J.; Ruediger, A.; Baumgart, S. Gesundheitsfördernde Stadtentwicklung für alle: Gemeinsam den Bestand entwickeln. UMID 2014, 2, 23–29. [Google Scholar]
- Strohmeier, K.; Bader, S. Demographic Decline, Segregation, and Social Urban Renewal in Old Industrial Metropolitan Areas. 2016. Available online: http://www.difu.de/publikationen/demographic-decline-segregation-and-social-urban-renewal-in.html (accessed on 1 July 2016).
- Salus, J.-F. Gesunde Staedte fuer alle: Gemeinsame Strategien von Stadtplanung und Public Health. Planerin 2012, 5, 47–48. [Google Scholar]
- Umgebungslaerm in NRW. Available online: www.umgebungslaerm.nrw.de (accessed on 11 July 2016).
- simuPLAN. Modellgestützte Ermittlung der Immissionsbeiträge aller relevanten Quellgruppen für das Stadtgebiet von Dortmund: Ergebnisbericht; Stadt Dortmund: Dorsten, Germany, 2013. [Google Scholar]
- New Insights into the Ruhr Region. Available online: http://www.metropoleruhr.de/en/start/ (accessed on 11 July 2016).
- Hinkel, J. “Indicators of vulnerability and adaptive capacity”: Towards a clarification of the science-policy interface. Glob. Environ. Chang. 2011, 21, 198–208. [Google Scholar] [CrossRef]
- WHO Regional Office for Europe. Urban Planning, Environment and Health: From Evidence to Policy Action—Meeting Report; World Health Organization: Copenhagen, Denmark, 2010. [Google Scholar]
- Lakes, T.; Brückner, M.; Krämer, A. Development of an environmental justice index to determine socio-economic disparities of noise pollution and green space in residential areas in Berlin. J. Environ. Plan. Manag. 2013, 57, 538–556. [Google Scholar] [CrossRef]
- Welsch, J.; Bömermann, H.; Nagel, H. Data Sources of the Berlin Pilot Project: The Berlin Environmental Atlas and Social Urban Development Monitoring. Available online: https://www.umweltbundesamt.de/sites/default/files/medien/515/publikationen/umid0211_0.pdf (accessed on 2 August 2011).
- Riedel, N.; Hoffmann, B.; Fuks, K.; Jöckel, K.-H.; Dagano, N. Health inequalities in the city: Assessing the concurrence of social and environmental risks in the Ruhr Area. UMID 2011, 2, 85–90. [Google Scholar]
- Von Alemann, U.; Loss, K.; Vowe, G. Politik: Eine Einführung; VS Verlag für Sozialwissenschaften: Wiesbaden, Germany, 1994. [Google Scholar]
- Bruckner, E. Migration und Demographischer Wandel. Available online: https://www.bertelsmann-stiftung.de/fileadmin/files/BSt/Presse/imported/downloads/xcms_bst_dms_36564_36565_2.pdf (accessed on 24 April 2016).
- Kristen, C.; Granato, N. The educational attainment of the second generation in Germany: Social origins and ethnic inequality. Ethnicities 2007, 7, 343–366. [Google Scholar] [CrossRef]
- Expert Panel on Noise (EPoN). Good Practice Guide on Noise Exposure and Potential Health Effects: EEA Technical Report. Available online: http://www.eea.europa.eu/publications/good-practice-guide-on-noise (accessed on 9 November 2010).
- Deutscher Bundestag Drucksache 17/ 508 17. Wahlperiode 25. 01. 2010 Verordnung der Bundesregierung Neununddreißigste Verordnung zur Durchführung des Bundes-Immissionsschutzgesetzes (Verordnung über Luftqualitätsstandards und Emissionshöchstmengen—39. BImSchV). Available online: http://dipbt.bundestag.de/dip21/btd/17/005/1700508.pdf (accessed on 25 Janary 2015).
- Schneider, J.; Nagl, C.; Schmid, B. EU Air Quality Policy and WHO Guideline Values for Health; European Union: Brussels, Belgium, 2014. [Google Scholar]
- Higgs, G.; Fry, R.; Langford, M. Investigating the implications of using alternative GIS-based techniques to measure accessibility to green space. Environ. Plan. B 2012, 39, 326–343. [Google Scholar] [CrossRef]
- Kindler, A.; Weiland, U.; Franck, U. Socio-Spatial Distribution of Ambient Air Exposure in Berlin. Available online: https://www.umweltbundesamt.de/sites/default/files/medien/515/publikationen/umid0211_0.pdf (accessed on 2 August 2011).
- Shrestha, R.; Flacke, J.; Martinez, J.A.; van Maarseveen, M. Environmental health related socio-spatial inequalities: Identifying ‘hotspots’ of environmental burdens and social vulnerability. Int. J. Environ. Res. Public Health 2016, 13, 1–23. [Google Scholar] [CrossRef]
- Corburn, J. Healthy City Planning: From Neighborhood to National Health Equity; Routledge: New York, NY, USA, 2013. [Google Scholar]
- WHO Centre for Health Development. Urban HEART: Urban Health Equity Assessment and Response Tool; World Health Organization: Kobe, Japan, 2010. [Google Scholar]
- Chakraborty, J.; Maantay, J.; Brender, J. Disproportionate proximity to environmental health hazards: Methods, models, and measurement. Am. J. Public Health 2011, 101, S27–S36. [Google Scholar] [CrossRef] [PubMed]
- Feuillet, T.; Charreire, H.; Menai, M.; Salze, P.; Simon, C.; Dugas, J.; Hercberg, S.; Andreeva, V.A.; Enaux, C.; Weber, C.; et al. Spatial heterogeneity of the relationships between environmental characteristics and active commuting: Towards a locally varying social ecological model. Int. J. Health Geogr. 2015, 14, 1–14. [Google Scholar] [CrossRef] [PubMed]
- Chalkias, C.; Papadopoulos, A.G.; Kalogeropoulos, K.; Tambalis, K.; Psarra, G.; Sidossis, L. Geographical heterogeneity of the relationship between childhood obesity and socio-environmental status: Empirical evidence from Athens, Greece. Appl. Geogr. 2013, 37, 34–43. [Google Scholar] [CrossRef]
- Assessment and Management of Environmental Noise: Directive 2002/49/EC. 2002. Available online: http://eur-lex.europa.eu/legal-content/EN/TXT/?uri=celex%3A32002L0049 (accessed on 25 June 2002).
- Ambient Air Quality and Cleaner Air for Europe: Directive 2008/50/EC. Available online: http://eur-lex.europa.eu/legal-content/EN/TXT/?uri=celex%3A32008L0050 (accessed on 21 May 2008).
- Köckler, H. Environmental justice—Aspects and questions for planning procedures. UVP Rep. 2014, 28, 139–142. [Google Scholar]
- ARL. Umwelt-und Gesundheitsaspekte im Programm Soziale Stadt–Ein Plädoyer für eine stärkere Integration: Positionspapier aus der ARL; ARL: Hannover, Germany, 2014. [Google Scholar]
- Sexton, K.; Linder, S.H. The role of cumulative risk assessment in decisions about environmental justice. Int. J. Environ. Res. Public Health 2010, 7, 4037–4049. [Google Scholar] [CrossRef] [PubMed]


| Data Set | Year | Details |
|---|---|---|
| Noise impact areas: noise levels measured as annual average of 24 h noise emissions, in Lden db(A) | 2013 | Noise pollution data are modelled for five sources of noise emissions (train, tram, cars, industry, airport), using a noise dispersion model [44] |
| Ambient air quality: PM10 and NO2 measured as annual average emissions, in μg/m3 | Data from 2008 to 2012, modeled in 2013 | Emissions from various sources (transport, industry, housing) modelled in a 125 × 125-m grid system using the dispersion model [45] |
| Land use 1: current land use, mapped in 150 categories | 2014 | Mapped from aerial photographs at the 1:5000 scale |
| Data Set | Year | Details |
|---|---|---|
| Total population | 2013 | Total number of inhabitants per neighborhood |
| Working population | 2013 | Total number of inhabitants per neighborhood between 15 and 65 (working age) |
| Unemployed population | 2013 | Total number of inhabitants per neighborhood receiving unemployment benefit subsistence (SGBII) |
| Population having a background of migration | 2013 | Total number of inhabitants per neighborhood having a background of migration (either themselves or at least one of their parents not being German) |
| Population receiving welfare aids | 2014 | Total number of inhabitants of non-working age per neighborhood receiving subsistence (welfare aids) |
| Indicator | Details |
|---|---|
| Migration | Inhabitants having a background of migration as a % of the total population in the neighborhood |
| Unemployment | Inhabitants receiving unemployment benefits as a % of the total population between 18 and 65 |
| Welfare | Inhabitants younger than 15 and older than 65 receiving social welfare aids as a % of the total population |
| Socioeconomic-Disadvantage | Sum of inhabitants receiving either unemployment benefits or social welfare aids as a % of the total population |
| Green | Share of green area (parks and forests), >1 ha, including green areas in a 400-m zone surrounding the neighborhood, as a % of the total area of the neighborhood |
| Noise | Share of area having a noise impact >55 dB(A) Lden as a % of the total area of the neighborhood |
| NO2 | Share of area having an annual average value of NO2 larger than or equal to 30 μg/m³ as a % of the total area of the neighborhood |
| PM10 | Share of area having an annual average value of PM10 larger than or equal to 25 μg/m³ as a % of the total area of the neighborhood |
| Indicators | Migration | Unemployment | Welfare | Socioeconomic Disadvantage |
|---|---|---|---|---|
| Migration | 1.00000 | 0.85655 * | 0.77527 * | 0.86507 * |
| Unemployment | 0.85655 * | 1.00000 | 0.81576 * | 0.98965 * |
| Welfare | 0.77527 * | 0.81576 * | 1.00000 | 0.86939 * |
| Socioeconomic disadvantage | 0.86507 * | 0.98965 * | 0.86939 * | 1.00000 |
| Indicators | Green | Noise | NO2 | PM10 |
|---|---|---|---|---|
| Green | 1.00000 | −0.15649 * | −0.23524 * | −0.17371 * |
| Noise | −0.15649 * | 1.00000 | 0.42975 * | 0.49360 * |
| NO2 | −0.23524 * | 0.42975 * | 1.00000 | 0.81598 * |
| PM10 | −0.17371 * | 0.49360 * | 0.81598 * | 1.00000 |
| Indicator | Green | Noise | NO2 | PM10 |
|---|---|---|---|---|
| Socioeconomic disadvantage | −0.279 * | −0.01652 | 0.31980 * | 0.25658 * |
© 2016 by the authors; licensee MDPI, Basel, Switzerland. This article is an open access article distributed under the terms and conditions of the Creative Commons Attribution (CC-BY) license (http://creativecommons.org/licenses/by/4.0/).
Share and Cite
Flacke, J.; Schüle, S.A.; Köckler, H.; Bolte, G. Mapping Environmental Inequalities Relevant for Health for Informing Urban Planning Interventions—A Case Study in the City of Dortmund, Germany. Int. J. Environ. Res. Public Health 2016, 13, 711. https://doi.org/10.3390/ijerph13070711
Flacke J, Schüle SA, Köckler H, Bolte G. Mapping Environmental Inequalities Relevant for Health for Informing Urban Planning Interventions—A Case Study in the City of Dortmund, Germany. International Journal of Environmental Research and Public Health. 2016; 13(7):711. https://doi.org/10.3390/ijerph13070711
Chicago/Turabian StyleFlacke, Johannes, Steffen Andreas Schüle, Heike Köckler, and Gabriele Bolte. 2016. "Mapping Environmental Inequalities Relevant for Health for Informing Urban Planning Interventions—A Case Study in the City of Dortmund, Germany" International Journal of Environmental Research and Public Health 13, no. 7: 711. https://doi.org/10.3390/ijerph13070711
APA StyleFlacke, J., Schüle, S. A., Köckler, H., & Bolte, G. (2016). Mapping Environmental Inequalities Relevant for Health for Informing Urban Planning Interventions—A Case Study in the City of Dortmund, Germany. International Journal of Environmental Research and Public Health, 13(7), 711. https://doi.org/10.3390/ijerph13070711