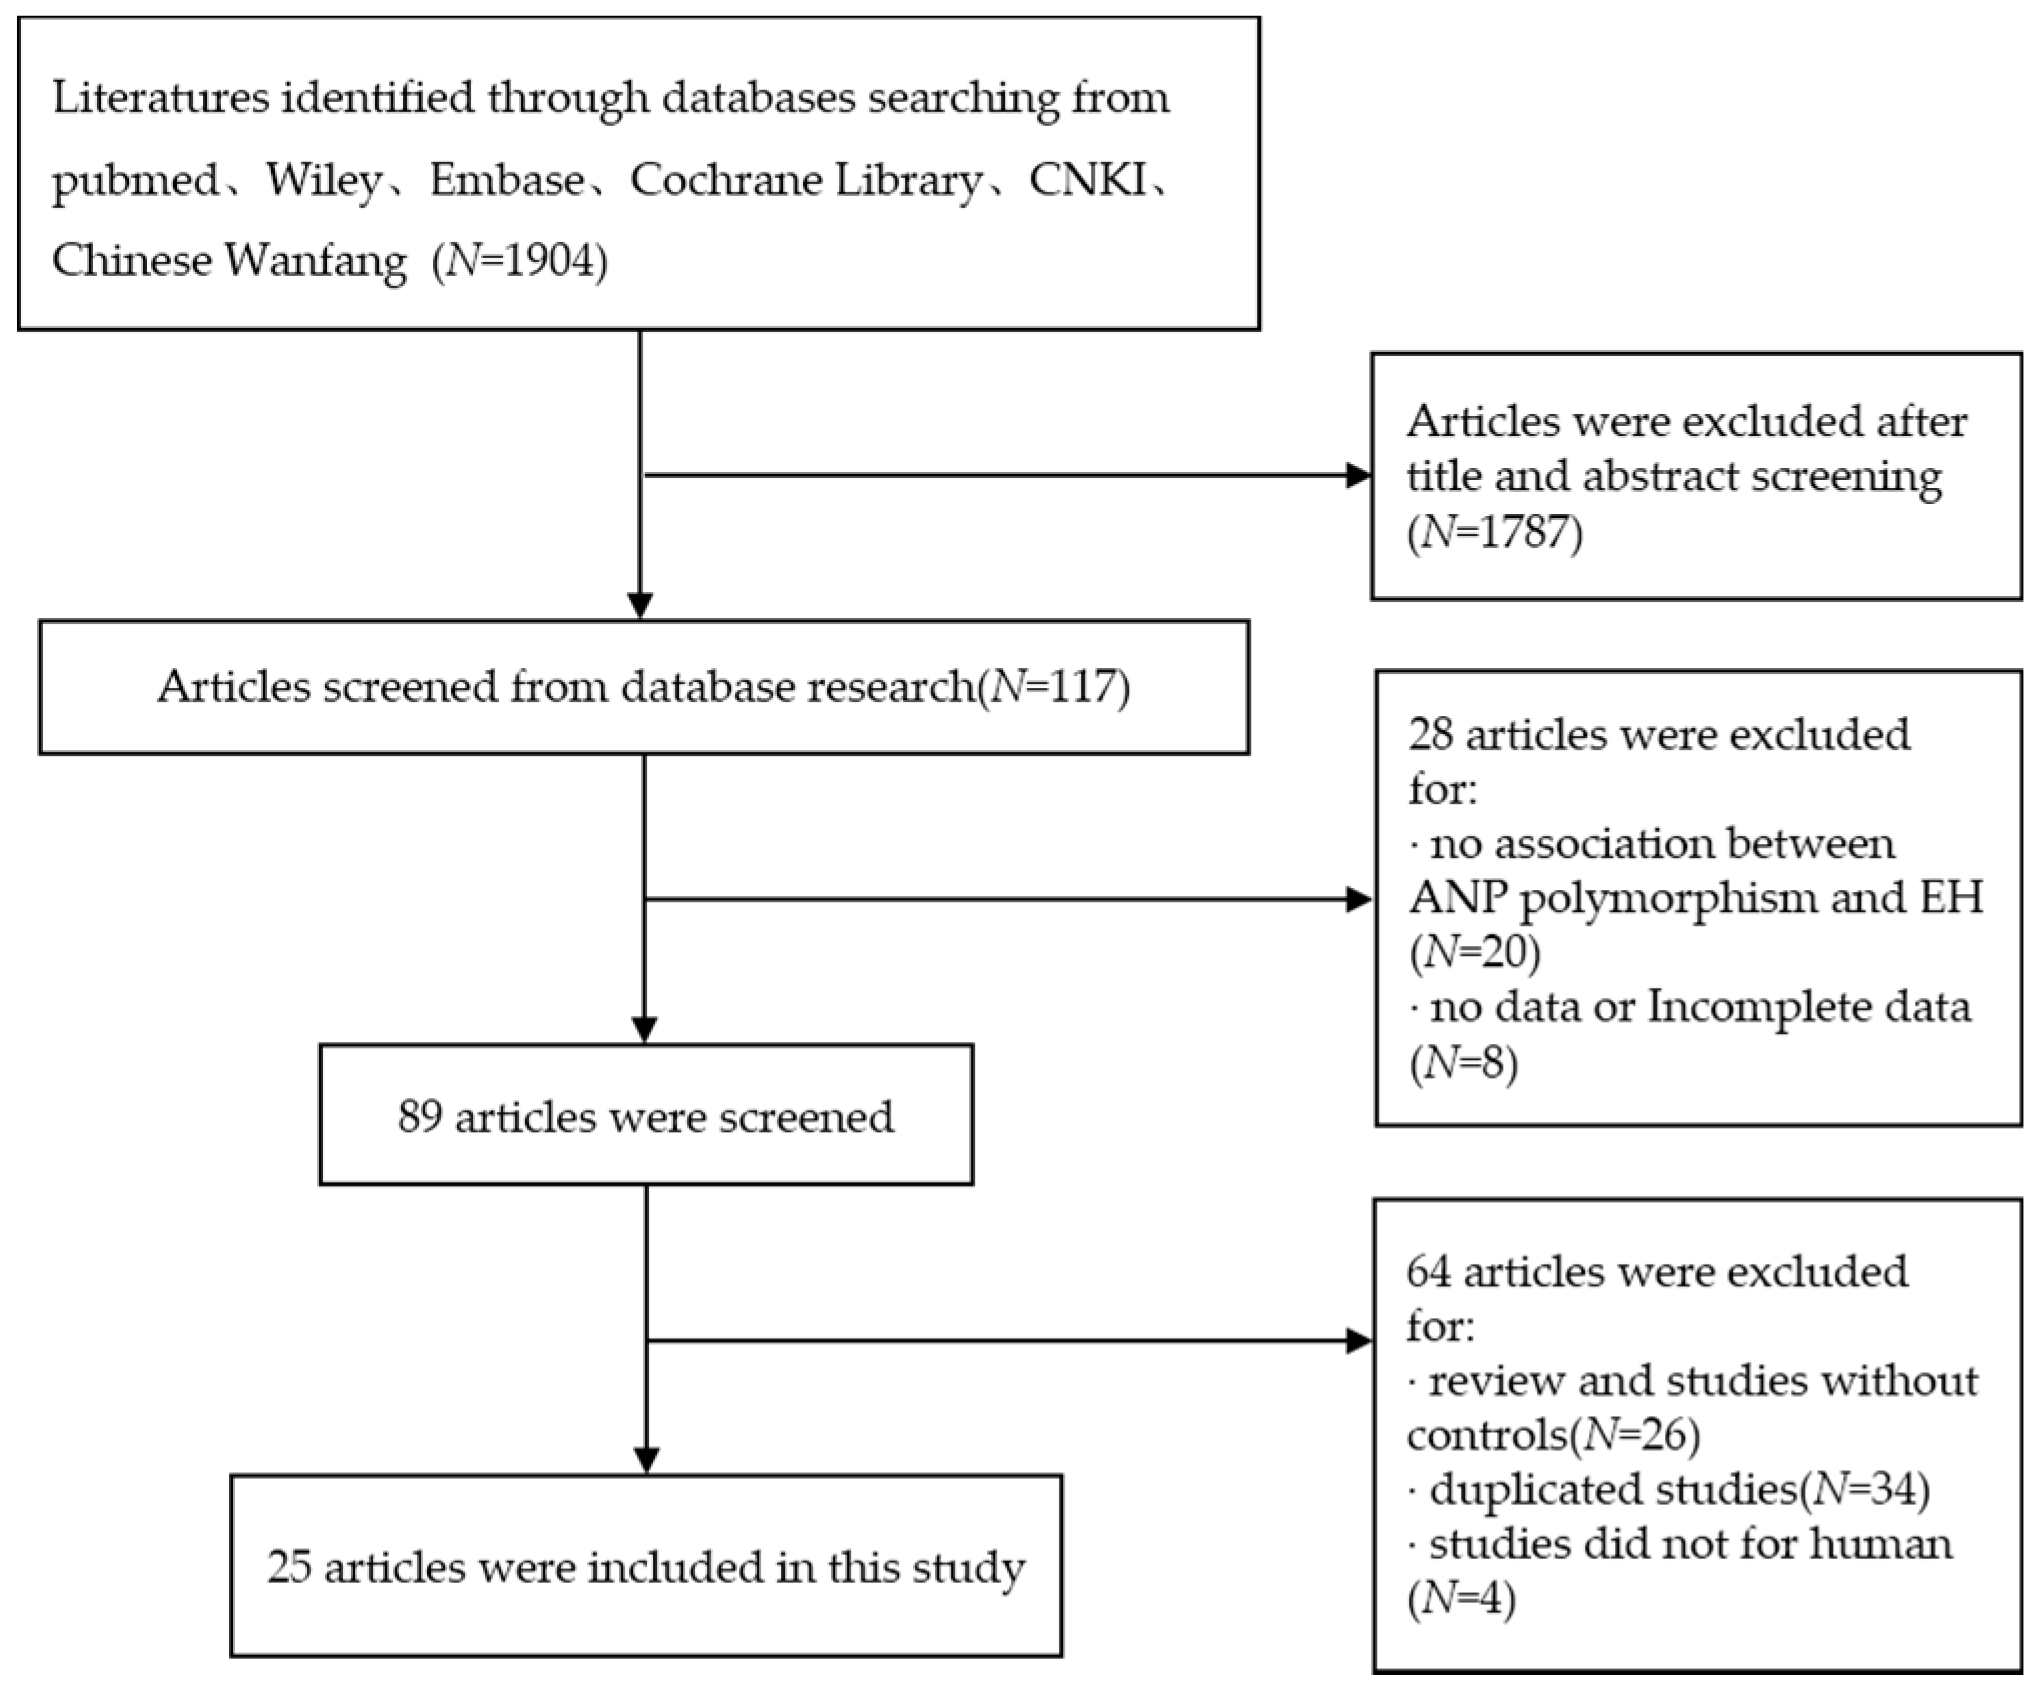
Article

Association of Polymorphisms in the Atrial Natriuretic Factor Gene with the Risk of Essential Hypertension: A Systematic Review and Meta-Analysis

1
Department of Epidemiology and Biostatistics, School of Public Health, Wuhan University, 115 Donghu Road, Wuhan 430071, China
2
Global Health Institute, Wuhan University, 115 Donghu Road, Wuhan 430071, China
*
Author to whom correspondence should be addressed.
Int. J. Environ. Res. Public Health 2016, 13(5), 458; https://doi.org/10.3390/ijerph13050458
Submission received: 12 March 2016 / Revised: 23 April 2016 / Accepted: 25 April 2016 / Published: 29 April 2016

Abstract

:
Background: Studies evaluating the association between the atrial natriuretic peptide (ANP) genetic polymorphism and the risk of essential hypertension (EH) have reported inconsistent results. The aim of this meta-analysis was to provide a more reliable estimation of the possible relationship between the atrial natriuretic peptide genetic polymorphism and the risk of essential hypertension (EH). Methods: Relevant articles were searched to identify all case-control or cohort design studies of the associations between ANP polymorphism and EH. The heterogeneity was checked using the Q test and the inconsistent index (I2). The odds ratio (OR) test and 95% confidence interval (CI) were calculated in a fixed or random effects model to evaluate the strength of association. Begg’s test and Egger’s test were applied to evaluate the publication bias. Results: A total of 25 case-control studies including 5520 cases and 5210 controls exploring the association between ANP polymorphism and EH were available for this meta-analysis. No significant association between the T2238C polymorphism and overall EH risk under the five genetic models was found (C vs. T: OR = 1.1, 95%CI = 0.94–1.2, p = 0.38; TC vs. TT: OR = 1.1, 95%CI = 0.88–1.5, p = 0.32; CC vs. TT: OR = 1.3, 95%CI = 0.90–1.9, p = 0.16; (CC + TC) vs. TT: OR = 1.1, 95%CI = 0.88–1.4, p = 0.35; CC vs. (TT + TC): OR = 1.1, 95%CI = 0.83–1.4, p = 0.55). We also found that the G1837A polymorphism had no significant association with overall EH risk (A vs. G: OR = 1.3, 95%CI = 0.96–1.9, p = 0.090; GA vs. GG: OR = 1.5, 95%CI = 0.83–2.6, p = 0.19; AA vs. GG: OR = 0.87, 95%CI = 0.34–2.3, p = 0.78; (AA + GA) vs. GG: OR = 1.5, 95%CI = 0.86–2.5, p = 0.17; AA vs. (GG + GA): OR = 1.3, 95%CI = 0.85–2.0, p = 0.22). In the analysis of the T1766C polymorphism, after removing the study of Nkeh, the 1766C allele suggested a protective effect in the model of TC vs. TT (OR = 0.64, 95%CI = 0.47–0.86, p = 0.003) and (CC + TC) vs. TT (OR = 0.64, 95%CI = 0.48–0.87, p = 0.004). Conclusions: This meta-analysis suggested that no significant relationships between ANP T2238C, G1837A gene polymorphisms and the risk of essential hypertension exist. Conversely, the ANP T1766C gene polymorphism may be associated with the risk of essential hypertension, and the 1766C allele may be a protective factor against EH. However, due to the number of limited articles on the T1766C polymorphisms, further studies are still needed to accurately prove the association between the T1766C gene polymorphism and the risk of essential hypertension.

1. Introduction

Cardiovascular disease (CVD), including essential hypertension (EH), is the leading cause of mortality throughout the world [1]. Among the important worldwide public-health challenges, hypertension has become an independent predisposing factor for many cardiovascular diseases, including coronary heart disease, heart failure stroke and many other serious cardiovascular diseases. It is estimated that hypertension is the third most important risk factor for disability-adjusted life-years [2,3]. Although mortality caused by cardiovascular disease has recently declined, the burden of CVD remains high [4]. Hypertension is a complex disease regulated by many interactional systems that have remained unclear until now [5]. Hypertension is likely to be a type of multifactorial, polygenic and genetic disorder influenced by genetic variations [5,6], and there are some reports on possible candidate genes [7]. Genetic elements played a vital role in the range of blood pressure [8] in human essential hypertension; blood ANP levels are considered to be higher than those in normal subjects [9]. In recent years, many studies have discussed the relationships between genetic polymorphisms and essential hypertension, but some of the conclusions are inconsistent and unconvincing.
Atrial natriuretic peptide (ANP), which is also called atrial natriuretic factor (ANF), is a cardiac hormone that is synthesized and secreted in cardiac atrial [9,10,11]. The main physiological role of ANP is to make vascular smooth muscle diastolic and induce apoptosis in cultured cardiac myocytes; in addition, ANP can inhibit rennin-angiotensin-aldosterone and myocardial contractile activity [12,13]. ANP plays an important role in the regulation of blood pressure [14]. In order to provide evidence for the prevention of essential hypertension, many researchers have conducted a series of studies exploring the potential relationships between atrial natriuretic peptide (ANP) genetic polymorphism and essential hypertension [7,15,16]. According to existing studies, several candidate genes have been identified as risk factors of EH; the human ANP gene may be a possible candidate gene contributing to the risk of EH or other cardiovascular diseases [17,18]. Consequently, the current meta-analysis was conducted to examine whether the ANP polymorphisms are associated with patients with essential hypertension.

2. Materials and Methods

2.1. Literature Search Strategy

We systematically searched PubMed, the Cochrane Library, Wiley, Embase, China National Knowledge Infrastructure (CNKI), and the Chinese WanFang Database for reports of populations based on case-control or cohort design studies published before 1 December 2015. The databases were searched by two authors independently using the following keywords: (“essential hypertension” or “primary hypertension” or “hypertension” or “blood pressure” or “arterial pressure”) AND (“atrial natriuretic factor” or ‘‘ANF’’ or ‘‘atrial natriuretic peptide’’ or ‘‘ANP’’ or ‘‘atrial natriuretic hormone’’ or “ANH” or ‘‘natriuretic peptides’’ or “NPPA” or“ natriuretic peptide precursor A”) AND (‘‘mutation’’ or ‘‘polymorphism, genetic’’ or ‘‘variation’’ or ‘‘polymorphism’’ ‘‘polymorphism, single nucleotide” or ‘‘single nucleotide polymorphism’’ or ‘‘SNP’’ or ‘‘variant’’ or “alleles” or “allele” or “genotype”). We also performed a manual search of the reference lists from relevant articles to find other potential articles. The search was conducted on studies published in English and Chinese.

2.2. Inclusion Criteria

Studies that met the following criteria were included:
(1)
studies of case-control or cohort design studies;
(2)
studies investigating the association between ANP polymorphism and essential hypertension;
(3)
full-text articles; and
(4)
hypertension was defined as at least three consecutive systolic blood pressure (SBP) measurements ≥ 140 mmHg or diastolic blood pressure (DBP) measurement ≥ 90 mmHg, or receiving antihypertensive pharmacotherapy treatment for at least 1 year; controls were healthy individuals in the same period.

2.3. Exclusion Criteria

Studies that did not meet the following criteria were excluded:
(1)
duplicated studies;
(2)
reviews and literature without detailed genotype data;
(3)
studies with no controls;
(4)
unpublished articles, abstracts and comments;
(5)
subjects in the study were not human; and
(6)
SBP < 140 mmHg or DBP < 90 mmHg in cases or secondary hypertension or other serious cardiovascular disease of cases were excluded.

2.4. Data Extraction

The following data were independently extracted by two reviewers, and disagreements between the two reviews were resolved through discussion until the reviewers reached a consensus. The data extraction included: the first author’s name, publication year, country, ethnicity, the number of cases and controls the sources of the subjects, genotyping methods, quality score, genotype distribution and allele frequency in cases and controls, and the Hardy-Weinberg equilibrium (HWE, p < 0.05 was considered a significant difference from HWE).

2.5. Quality Assessment of the Included Studies

The quality of the included studies was independently assessed by two reviewers, and disagreements between the two reviews were resolved through discussion until the reviewers reached a consensus. The quality of the included studies was evaluated using the Newcastle–Ottawa quality assessment scale [19]. The scale includes a total of three categories and eight entries. The number of stars represent the quality of studies. The highest quality research can be granted ten stars. Studies with six stars or higher than six stars were considered high quality.

2.6. Statistical Analysis

The STATA 12.0 software (Stata, College Station, TX, USA) was chosen as the statistical analysis software for data management. To evaluate the associations between the ANP T2238C, G1837A and T1766C polymorphisms and the risk of EH, odds ratios (ORs) and 95% confidence intervals (95%CI) were calculated using five models, including an additive model (C vs. T), co-dominant model (TC vs. TT; CC vs. TT), dominant model ((CC + TC) vs. TT) and recessive model (CC vs. (TT + TC)) of the T2238C polymorphism and T1766C polymorphism. Pooled OR and 95%CI were also calculated under five genetic models including an additive model (A vs. G), co-dominant model (GA vs. GG; AA vs. GG), dominant model ((AA + GA) vs. GG) and recessive model (AA vs. (GG + GA)) of the G1837A polymorphism. p values and I2 were calculated using the Q-test. The I2 = [100% × (Q − df/Q)] test for heterogeneity between the results of different studies was conducted. The fixed effects model was used if p > 0.10 and I2 < 50%; the pooled OR and corresponding 95%CI were calculated using the Mantel-Haenszel method. Otherwise, a random effects model using the DerSimonian-Laird method was conducted to evaluate the pooled OR value. Begg’s test and Egger’s test were applied to evaluate the publication bias. p < 0.1 indicated that there was significant publication bias, and a relevant funnel plot was drawn.

3. Results

3.1. Characteristics of the Data Included in the Meta-Analysis

According to the inclusion and exclusion, a total of 25 studies including 5520 cases and 5210 controls were available for this meta-analysis. The specific flow chart is shown in Figure 1. The basic characteristics of the studies included are presented in Table 1 and Table 2. The HWE test was also conducted to identify the genotype distribution of the controls in all of the studies. Three SNPs were analyzed, including T2238C, G1837A and T1766C, in 25 studies. Among the studies included in this meta-analysis, 15 articles explored the relationship between hypertension and T2238C polymorphism, six articles were about G1837A polymorphism and four articles were about T1766C polymorphism. Stratification occurred according to the source of subjects; two design methods were conducted including (P-B) population-based and (H-B) hospital-based; according to the ethnicity of the subjects, three races were considered, including Asian, White and Black. The four genotyping methods included PCR, polymerase chain reaction and restriction fragment length polymorphism (PCR-RFLP), gene chips and Q-PCR.

3.2. Meta-Analysis

The results of the heterogeneity test of the total population of the association between T2238C polymorphisms and EH were as follows: C vs. T: p* = 0.19, I2 = 23.6%; TC vs. TT: p* = 0.053, I2 = 41.4%; CC vs. TT: p* = 0.46, I2 = 0.0%; (CC + TC) vs. TT: p* = 0.066, I2 = 39.2%; CC vs. (TT + TC): p* = 0.18, I2 = 27.7% (p*: p value of heterogeneity). The results of the test for heterogeneity of the overall population of G1837A polymorphisms and EH were as follows: A vs. G: p* = 0.051, I2 = 54.7%; GA vs. GG: p* = 0.005, I2 = 70.1%; AA vs. GG: p* = 0.48, I2 = 0.0%; (AA + GA) vs. GG: p* = 0.009, I2 = 67.5%; AA vs. (GG + GA): p* = 0.53, I2 = 0.0% (p*: p value of heterogeneity). In the overall population, if the test level α = 0.10, in the T2238C polymorphism analysis, except for the co-dominant model (TC vs. TT) and dominant model ((CC + TC) vs. TT), the other three models all met the level p > 0.10 and I2 < 50%; a random effects model was used in the co-dominant model (TC vs. TT) and dominant model ((CC + TC) vs. TT), and a fixed effects model was conducted in the other three genetic models. The forest plots of five genetic models of the total population between T2238C polymorphism and EH are presented in Figure 2, Figure 3, Figure 4, Figure 5 and Figure 6; the P value of significance test(s) of OR = 1 is shown in Table 3. Overall, no statistically significant associations between T2238C polymorphisms and EH were found in five models of the total population. The results of meta-analysis of the G1837A polymorphism and EH are shown in Table 4; five genetic models of the overall population were also conducted. The results of meta-analysis of the T1766C polymorphism and EH are presented in Table 5.

3.3. Sensitivity Analysis

A sensitivity analysis was performed on three gene loci to evaluate the influence of each individual study on the pooled OR. The sensitivity analysis of the T2238C polymorphism showed that none of the fifteen studies included in this meta-analysis dramatically influenced the combined results under all of the five genetic models. The sensitivity analysis of the G1837A polymorphism suggested that Rutledge [30] significantly influenced the combined results under all of the five genetic models; the tests for heterogeneity changed significantly if the study of Rutledge was removed. The results indicated that the source of heterogeneity may be caused by ethnicity, as shown in Table 4 and Table 6.
The forest plot of sensitivity analysis is presented in Figure 7. Because the study of Rutledge [30] met the inclusion criteria, stricter interpretation needs to be conducted. Through the sensitivity analysis of T1766C polymorphism, the results become statistically significant under the genetic models of (TC vs. TT) and ((CC + TC) vs. TT) after excluding the study of Benedicta [35]. The results are shown in Table 5 and Table 7, and the forest plot of sensitivity analysis is presented in Figure 8. The results of this study need to be interpreted carefully because this study met the inclusion criteria.

3.4. Subgroup Analysis

According to the ethnicity of subjects, genotyping methods, and the source of controls, a stratified analysis was performed on the T2238C polymorphism to explore the sources of heterogeneity as follows. In the test for heterogeneity of ethnic subgroups in the T2238C additive model, the P value of heterogeneity in Asian and White subgroups was 0.472 and 0.015, respectively, and the I2 in Asian and White subgroups was 0.0% and 76.1%, respectively, so a random effects model was conducted to estimate the summary OR and corresponding 95%CI. Ethnic subgroup analysis of the association between T2238C polymorphisms and EH of the other four models is shown in Figure 9, Figure 10, Figure 11, Figure 12 and Figure 13 and Table 3. According to the test for heterogeneity of the subgroups analysis in the sources of controls of the T2238C additive model (C vs. T), the p value of heterogeneity in HB and PB was 0.289 and 0.264, respectively, and the I2 in HB and PB was 19.7% and 19.5%, respectively, so a fixed effects model was conducted to estimate the summary OR and corresponding 95%CI. The subgroup analysis of the sources of controls of the association between T2238C polymorphisms and EH of the other four models are shown in Figure 14, Figure 15, Figure 16, Figure 17 and Figure 18 and Table 3. In the subgroup analysis of genotyping methods of the association between T2238C polymorphisms and EH, the fixed effects model was used in the co-dominant model-2 (CC vs. TT), and a random effects model was conducted in the other four models. The forest plots of the five models and the results of the meta-analysis are shown in Figure 19, Figure 20, Figure 21, Figure 22 and Figure 23 and Table 3.

3.5. Publication Bias

An evaluation of publication bias of T2238C polymorphism was conducted for the 15 articles included in this meta-analysis. No obvious publication bias was found in the meta-analysis under the five genetic models. Both Begg’s test and Egger’s test were conducted. The p values of Begg’s and Egger’s test under the five genetic models all satisfied p > 0.1, the results indicated that there was no significant publication bias, and Begg’s test funnel plot was drawn, as seen in Figure 24.

4. Discussion

Many gene loci in human ANP gene associated with essential hypertension have been found, including the T2238C, G1837A, T1766C, C664G, C1364A, G658A and G664A gene polymorphisms. Robert explored the relationship between the ANF gene and essential hypertension in terms of causation. However, the results provided no evidence for the involvement of the ANF gene polymorphism with EH [37]. Rutledge investigated gene polymorphisms within the atrial natriuretic peptide of African Americans at intron two and exon three in essential hypertension and found that the HpaII polymorphism was associated with hypertension [30]. Cheung discovered that the allele distribution H1 and H2 of the HpaII polymorphism of the atrial natriuretic peptide gene in hypertensive patients and normotensive controls were 0.12 and 0.88, and 0.11 and 0.89, respectively. The results indicated no obvious association with hypertension in this population [32]. Zorc-Pleskovic analyzed the T2238C ScaI gene polymorphism of the ANF gene in a group of children with EAH, and the results also failed to find an association between the T2238C gene polymorphism and EH in children [27]. In our study, no obvious association was found in the gene locus of T2238C, G1837A and EH.
More epidemiological studies investigating the correlation between the atrial natriuretic peptide (ANP) genetic polymorphism and the risk of essential hypertension worldwide have emerged. However, these studies have reported inconsistent, even contradictory results. Considering the limited sample size of individual studies and the great clinical heterogeneity, meta-analysis can provide a more reliable estimation using quantitative synthesis methods. A meta-analysis can collect all the relevant studies published or unpublished systematically and comprehensively. The aim of this meta-analysis is to make a more reliable estimation of the possible relationship between the atrial natriuretic peptide genetic polymorphism and the risk of essential hypertension. A few meta-analyses have been conducted to explore the associations between the ANP gene polymorphisms and the risk of EH. However, this meta-analysis is the first to collect relevant articles published on three common gene loci of the ANP gene polymorphism and EH. Although Niu [38] conducted a meta-analysis of the relationship between a natriuretic peptide precursor, the T2238C polymorphism and hypertension, the articles included were limited and the gene locus only included the T2238C polymorphism. In Niu [38], only seven studies were included; the results indicated that the 2238C allele decreased risk of developing hypertension, a results that is inconsistent with the results of this meta-analysis.
A sensitivity analysis was also conducted in the present study on three gene loci to evaluate the influence of each individual study on the pooled OR. The sensitivity analysis of the T2238C polymorphism showed that none of the fifteen studies included in this meta-analysis substantially influenced the combined results under all five genetic models. The forest plot of sensitivity analysis of the overall population of the T2238C polymorphism is shown in Figure 25. The sensitivity analysis of the G1837A polymorphism suggested that Rutledge [30] significantly influenced the combined results under all five genetic models; the tests for heterogeneity changed significantly if the study of Rutledge [30] was removed. The ethnicity of Rutledge [30] was Black, and the remaining five studies were all Asians, which indicated that the source of heterogeneity may be caused by ethnicity. Through sensitivity analysis of the T1766C polymorphism, the results become statistically significant under the genetic models of (TC vs. TT) and ((CC + TC) vs. TT) after excluding the study of Benedicta [35]. Therefore, the results of this study need to be interpreted carefully.
In the meta-analysis of Niu [38], the subgroup analysis of the T2238C polymorphism by study design presented opposite results for the HB and PB groups. However, in the subgroup analysis of this meta-analysis of the ANP T2238C polymorphism by the ethnicity of subjects, no obvious association was found in Asians, Whites and Blacks under the five genetic models in the overall population. Moreover, in the subgroup analysis of the ANP T2238C polymorphism by genotyping methods, no significant difference was found in PCR, PCR-RFLP, gene chips and Q-PCR under the five genetic models. Similarly, in the subgroup analysis of the ANP T2238C polymorphism by the source of controls, there was no apparent association between the T2238C polymorphism and EH in the (PB) population-based and (HB) hospital-based controls under the five genetic models. The forest plots in the subgroup analysis of the ANP T2238C polymorphism by the ethnicity of subjects, genotyping methods and the source of controls under the five genetic models were presented in Figure 9, Figure 10, Figure 11, Figure 12, Figure 13, Figure 14, Figure 15, Figure 16, Figure 17, Figure 18, Figure 19, Figure 20, Figure 21, Figure 22 and Figure 23.

5. Conclusions

In conclusion, this meta-analysis indicates that the ANPT2238C, G1837A gene polymorphism may have no relationship with EH; conversely, the ANP T1766C gene polymorphism is likely to be associated with EH. Considering the limited articles included in this meta-analysis of T1766C polymorphism, more articles are needed for future studies. According to the sensitivity analysis and publication bias evaluation, no obvious publication bias was found, which indicates that the conclusion of this article is basically reliable and stable.

Acknowledgments

We sincerely thank all the members who participated in this study and the help of Wuhan University.

Author Contributions

Jinyao Wang and Chuanhua Yu extracted the data, Jinyao Wang and Zhenkun Wang assessed the quality of the included studies, Jinyao Wang analyzed data. All authors were involved in writing the paper.

Conflicts of Interest

The authors declare that there are no conflicts of interest.

References

  1. Franceschini, N.; Reiner, A.P.; Heiss, G. Recent findings in the genetics of blood pressure and hypertension traits. Am. J. Hypertens 2011, 24, 392–400. [Google Scholar] [CrossRef] [PubMed]
  2. Kearney, P.M.; Whelton, M.; Reynolds, K.; Muntner, P.; Whelton, P.K.; He, J. Global burden of hypertension: Analysis of worldwide data. Lancet 2005, 365, 217–223. [Google Scholar] [CrossRef]
  3. Hajjar, I.; Kotchen, T.A. Trends in prevalence, awareness, treatment, and control of hypertension in the United States, 1988–2000. JAMA 2003, 290, 199–206. [Google Scholar] [CrossRef] [PubMed]
  4. Lloyd-Jones, D.; Adams, R.; Carnethon, M.; De Simone, G.; Ferguson, T.B.; Flegal, K.; Ford, E.; Furie, K.; Go, A.; Greenlund, K.; et al. Heart disease and stroke statistics—2009 update: A report from the American Heart Association Statistics Committee and Stroke Statistics Subcommittee. Circulation 2009, 119, e21–e181. [Google Scholar] [PubMed]
  5. Takahashi, N.; Smithies, O. Gene targeting approaches to analyzing hypertension. J. Am. Soc. Nephrol. 1999, 10, 1598–1605. [Google Scholar] [PubMed]
  6. Ilhan, N.; Kucuksu, M.; Kaman, D.; Ilhan, N.; Ozbay, Y. The 677 C/T MTHFR polymorphism is associated with essential hypertension, coronary artery disease, and higher homocysteine levels. Arch. Med. Res. 2008, 39, 125–130. [Google Scholar] [CrossRef] [PubMed]
  7. Bulut, D.; Potthast, R.; Hanefeld, C.; Schulz, T.; Kuhn, M.; Mügge, A. Impaired vasodilator responses to atrial natriuretic peptide in essential hypertension. Eur. J. Clin. Invest. 2003, 33, 567–573. [Google Scholar] [CrossRef] [PubMed]
  8. Tanira, M.O.; Al, B.K. Genetic variations related to hypertension: A review. J. Hum. Hypertens 2005, 19, 7–19. [Google Scholar] [CrossRef] [PubMed]
  9. Nakayama, T. The genetic contribution of the natriuretic peptide system to cardiovascular diseases. Endocr J. 2005, 52, 11–21. [Google Scholar] [CrossRef] [PubMed]
  10. Kishimoto, I.; Rossi, K.; Garbers, D.L. A genetic model provides evidence that the receptor for atrial natriuretic peptide (guanylyl cyclase-A) inhibits cardiac ventricular myocyte hypertrophy. Proc. Natl. Acad. Sci. USA 2001, 98, 2703–2706. [Google Scholar] [CrossRef] [PubMed]
  11. Rubattu, S.; De Giusti, M.; Farcomeni, A.; Abbolito, S.; Comito, F.; Cangianiello, S.; Greco, E.S.; Dito, E.; Pagliaro, B.; Cotugno, M.; et al. T2238C ANP gene variant and risk of recurrent acute coronary syndromes in an Italian cohort of ischemic heart disease patients. J. Cardiovasc. Med. (Hagerstown) 2014. [Google Scholar] [CrossRef] [PubMed]
  12. Zhang, L.; Cheng, L.; He, M.; Hu, B.; Wu, T. ANP T2238C, C-664G gene polymorphism and coronary heart disease in Chinese population. J. Huazhong Univ. Sci. Technolog. Med. Sci. 2006, 26, 528–530. [Google Scholar] [CrossRef] [PubMed]
  13. Qureshi, S.F.; Ali, A.; Venkateshwari, A.; Rao, H.; Jayakrishnan, M.P.; Narasimhan, C.; Shenthar, J.; Thangaraj, K.; Nallari, P. Atrial natriuretic peptide gene—A potential biomarker for long QT syndrome. EXCLI J. 2014, 13, 834–842. [Google Scholar] [PubMed]
  14. Soualmiaa, H.; Ayadi, I.; Kallel, A. ScaI atrial natriuretic peptide gene polymorphism and hypertension in the Tunisian population. Int. J. Sci. Basic Appl. Res. (IJSBAR) 2014, 16, 232–241. [Google Scholar]
  15. Conen, D.; Cheng, S.; Steiner, L.L.; Buring, J.E.; Ridker, P.M.; Zee, R.Y. Association of 77 polymorphisms in 52 candidate genes with blood pressure progression and incident hypertension: the Women’s Genome Health Study. J. Hypertens. 2009, 27, 476–483. [Google Scholar] [CrossRef] [PubMed]
  16. Zhang, S.; Mao, G.; Zhang, Y.; Tang, G.; Wen, Y.; Hong, X.; Jiang, S.; Yu, Y.; Xu, X. Association between human atrial natriuretic peptide Val7Met polymorphism and baseline blood pressure, plasma trough irbesartan concentrations, and the antihypertensive efficacy of irbesartan in rural Chinese patients with essential hypertension. Clin. Ther. 2005, 27, 1774–1784. [Google Scholar] [CrossRef] [PubMed]
  17. Hu, D.C.; Zhao, X.L.; Shao, J.C.; Wang, W.; Qian, J.; Chen, A.H.; Zhang, H.Q.; Guo, H.; Jiang, J.; Li, H.Y. Interaction of six candidate genes in essential hypertension. Genet Mol. Res. 2014, 13, 8385–8395. [Google Scholar] [CrossRef] [PubMed]
  18. Rubattu, S.; Sciarretta, S.; Volpe, M. Atrial natriuretic peptide gene variants and circulating levels: Implications in cardiovascular diseases. Clin. Sci. (Lond.) 2014, 127, 1–13. [Google Scholar] [CrossRef] [PubMed]
  19. Stang, A. Critical evaluation of the Newcastle-Ottawa scale for the assessment of the quality of nonrandomized studies in meta-analyses. Eur. J. Epidemiol. 2010, 25, 603–605. [Google Scholar] [CrossRef] [PubMed]
  20. Liang, X.; Xu, X.; He, L. Association of gene polymorphism of atrial natriuretic peptide with essential hypertension in Han and Kazakh population in Xingjiang. J. Chin. Pract. Diagn. Ther. 2011, 25, 11–13. [Google Scholar]
  21. Xiong, W.; Luo, Y.; Yang, C. Clinical analysis of essential hypertension-related gene polymorphism. Chin. J. Gerontol. 2010, 30, 3276–3277. [Google Scholar]
  22. Tian, C.; Cheng, L. Association of Polymorphisms in Atrial and Brain Natriuretic Peptide Gene with Essential Hypertension. Huazhong Univ. Sci. Technol. (Med. Sci.) 2010, 39, 13–17. [Google Scholar]
  23. Wang, Z.; Mao, Y. The relationship between endothelial atrial natriuretic peptide T2238C and type-C natriuretic peptide receptor A-55Cgene polymorphisms and essential hypertension in elderly. J. Clin. Med. 2009, 26, 620–622. [Google Scholar]
  24. Li, H. The Correlation between Atrial Natriuretic Peptide Gene Single Nucleotide Polymorphism and Essential Hypertention of Hani and Yi Minority Group in Yunnan Province. Ph.D. Thesis, Yunnan University Genetics, Kunming, China, 20 May 2007. [Google Scholar]
  25. Zhang, Y. The Relationship Study bewteen ANP Gene and Essential Hypertension in Xinjiang Kazakhs. Ph.D. Thesis, Xinjiang Medical University, Xinjiaing, China, 29 May 2006. [Google Scholar]
  26. Li, N.; Zhang, Y.; Li, T.; Zhou, L. The relationship between ANP gene T2238C polymorphism and essential hypertention in xinjiang Kazakans. J. Clin. Cardiol. 2005, 21, 513–515. [Google Scholar]
  27. Zorc-Pleskovic, R.; Bidovec, M.; Bregar, D.; Milutinović, A.; Terzić, R.; Teran, N. The ScaI gene polymorphism of the atrial natriuretic factor and essential arterial hypertension in childhood. Coll Antropol. 2004, 28, 617–621. [Google Scholar] [PubMed]
  28. Nannipieri, M.; Manganiello, M.; Pezzatini, A.; De Bellis, A.; Seghieri, G.; Ferrannini, E. Polymorphisms in the hANP (human atrial natriuretic peptide) gene, albuminuria, and hypertension. Hypertension 2001, 37, 1416–1422. [Google Scholar] [CrossRef] [PubMed]
  29. Rahmutula, D.; Nakayama, T.; Soma, M.; Takahashi, Y.; Kunimoto, M.; Uwabo, J.; Sato, M.; Izumi, Y.; Kanmatsuse, K.; Ozawa, Y. Association study between the variants of the human ANP gene and essential hypertension. Hypertens Res. 2001, 24, 291–294. [Google Scholar] [CrossRef] [PubMed]
  30. Rutledge, D.R.; Sun, Y.; Ross, E.A. Polymorphisms within the atrial natriuretic peptide gene in essential hypertension. J. Hypertens 1995, 13, 953–955. [Google Scholar] [CrossRef] [PubMed]
  31. Zhang, Y.; Li, N.; Li, T.; Zhou, L.; Zhang, D.; Li, H.; Zhou, K. The relationship bewteen the ANP gene G1837A polymorphism and essential hypertension in Xinjiang Kazakans. Sci. Technol. Engineer 2005, 5, 1070–1072. [Google Scholar]
  32. Cheung, B.M.; Leung, R.; Shiu, S.; Tan, K.C.B.; Lau, C.-P.; Kumana, C.R. HpaII polymorphism in the atrial natriuretic peptide gene and hypertension. Am. J. Hypertens 1999, 12, 524–527. [Google Scholar] [CrossRef]
  33. He, L. Relationship Study bewteen ANP Gene Polymorphism and Essential Hypertension in Xinjiang Kazakhs. Ph.D. Thesis, Xinjiang Medical University, Xinjiang, China, 28 May 2007. [Google Scholar]
  34. He, L.; Xu, X.; Liang, X. Association of the T1766C polymorphism of atrial natriuretic peptide gene with essential hypertension in Xinjiang Kazakh. J. Xinjiang Med. Univ. 2007, 29, 967–969. [Google Scholar]
  35. Nkeh, B.; Tiago, A.; Candy, G.P.; Woodiwiss, A.J.; Badenhorst, D.; Luker, F.; Netjhardt, M.; Brooksbank, R.; Libhaber, C.; Sareli, P.; et al. Association between an atrial natriuretic peptide gene polymorphism and normal blood pressure in subjects of African ancestry. Cardiovasc. J. South Afr. 2002, 13, 97–101. [Google Scholar]
  36. Kato, N.; Sugiyama, T.; Morita, H.; Nabika, T.; Kurihara, H.; Yamori, Y.; Yazaki, Y. Genetic analysis of the atrial natriuretic peptide gene in essential hypertension. Clin. Sci. 2000, 98, 251–258. [Google Scholar] [CrossRef] [PubMed]
  37. Robert, Y.L.; Lou, Z.Y.; Griffiths, L.R.; Griffiths, L.R.; Morris, B.J. Molecular genetic analyses of RFLPs for PCR-Amplified growth hormone gene, renal kallikrein gene and atrial natriuretic factor gene in essential hypertension. Hypertens Res. 1993, 16, 113–120. [Google Scholar]
  38. Niu, W. The relationship between natriuretic peptide precursor a gene T2238C polymorphism and hypertension: A Meta-Analysis. Int. J. Hypertens 2011, 2011, 653698. [Google Scholar] [CrossRef] [PubMed]
Figure 1. Flow chart of studies included in this meta-analysis.
Ijerph 13 00458 g001
Figure 2. Forest plot of overall population of T2238C additive model (C vs. T).
Ijerph 13 00458 g002
Figure 3. Forest plot of overall population of T2238C co-dominant model-1 (TC vs. TT).
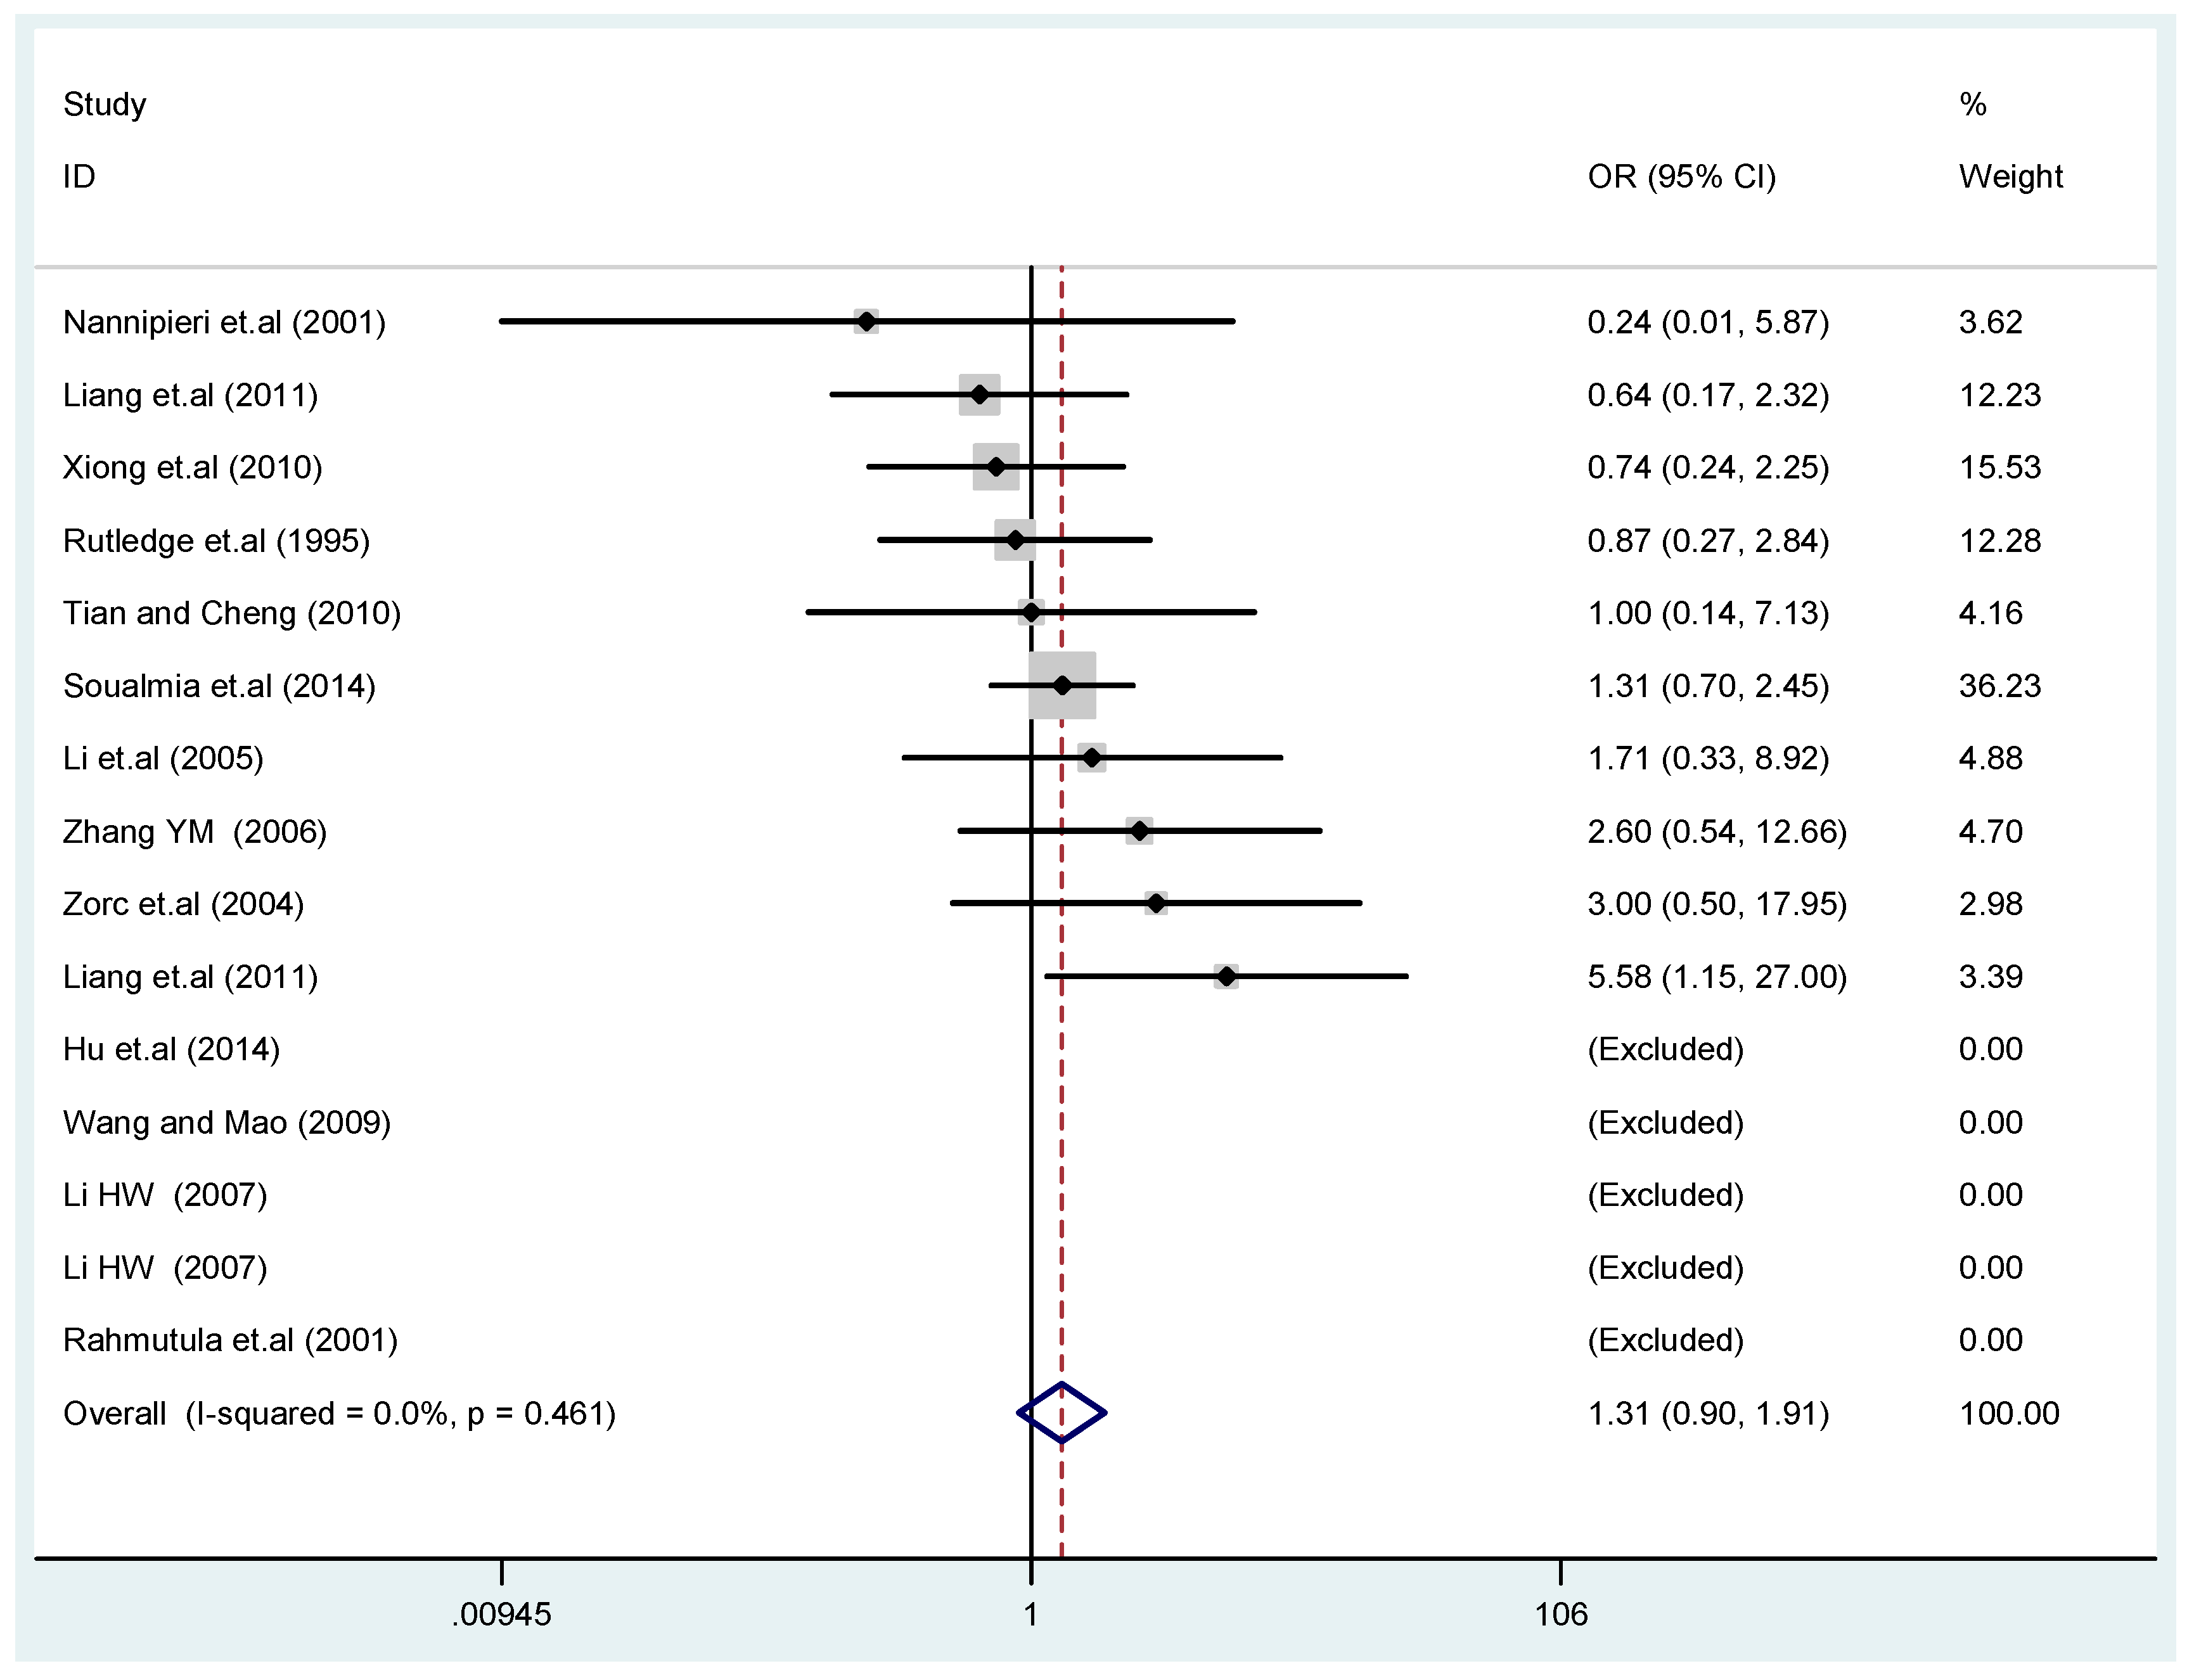
Ijerph 13 00458 g003
Figure 4. Forest plot of overall population of T2238C co-dominant model-2 (CC vs. TT).
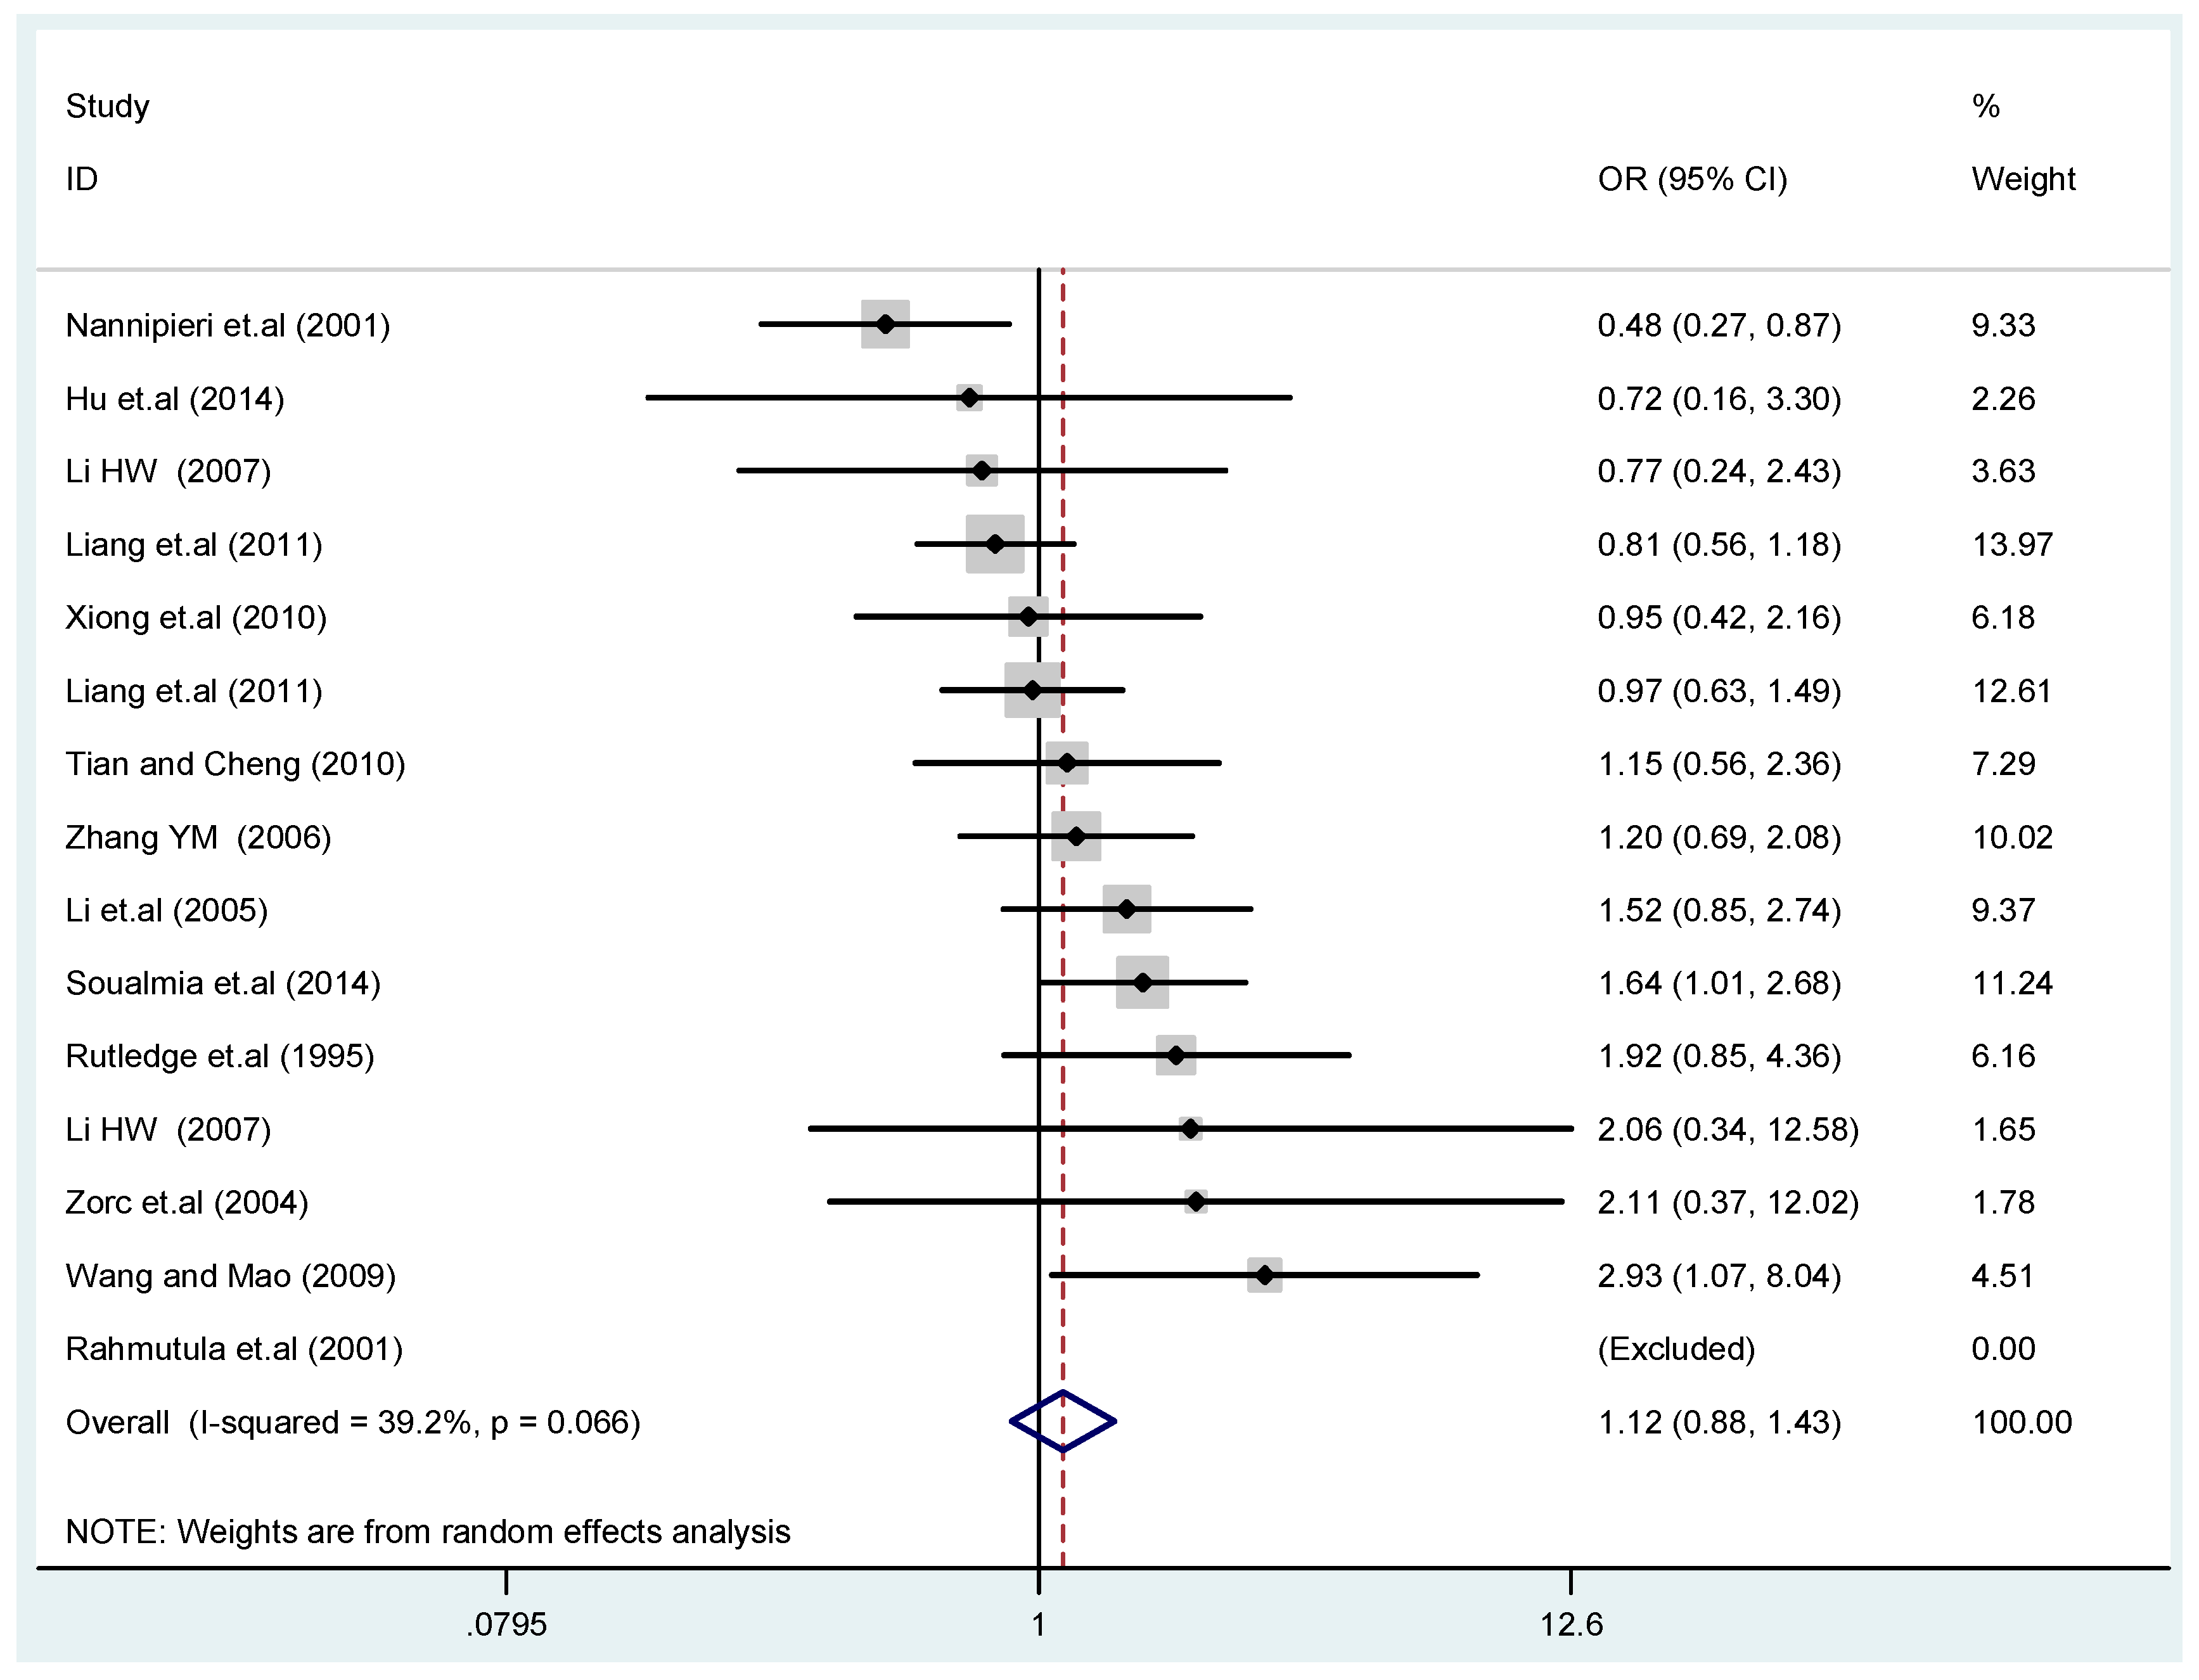
Ijerph 13 00458 g004
Figure 5. Forest plot of overall population of T2238C dominant model (CC + TC) vs. TT.
Ijerph 13 00458 g005
Figure 6. Forest plot of overall population of T2238C recessive model CC vs. (TT + TC).
Ijerph 13 00458 g006
Figure 7. Forest plot of sensitivity analysis of overall population of G1837A polymorphism and EH (GA vs. GG).
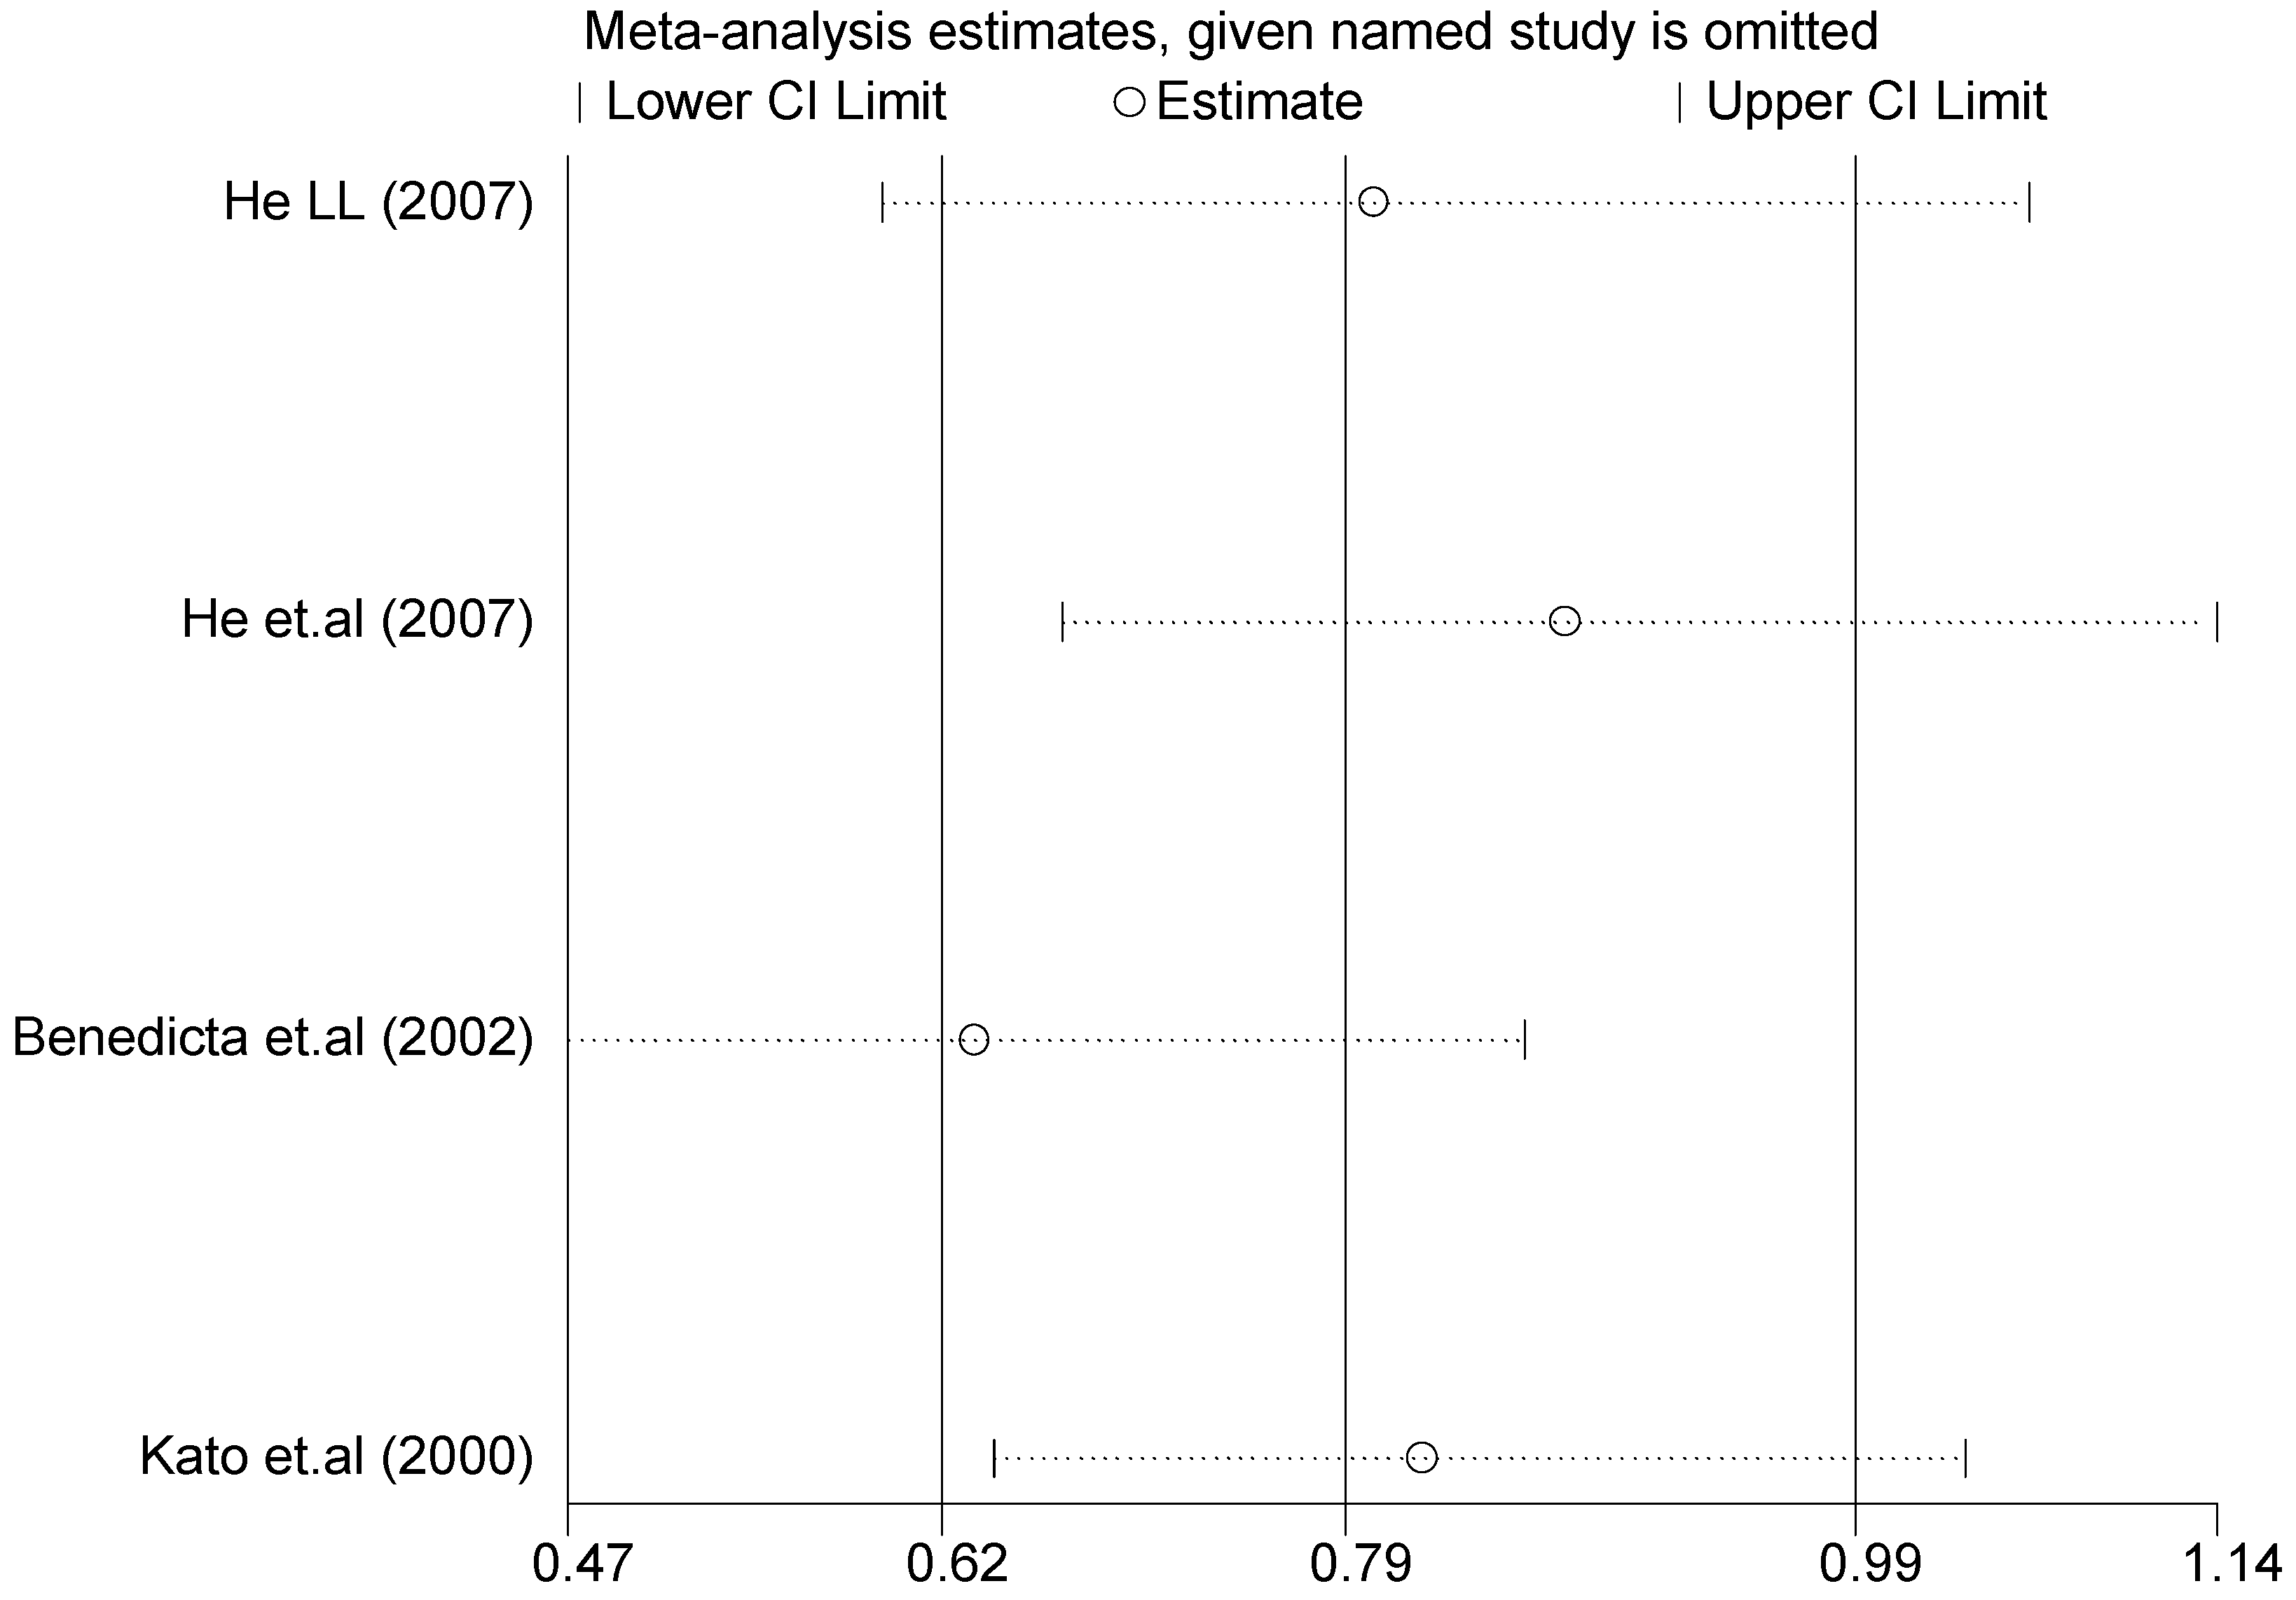
Ijerph 13 00458 g007
Figure 8. Forest plot of sensitivity analysis of overall population of T1766C polymorphism and EH (TC vs. TT).
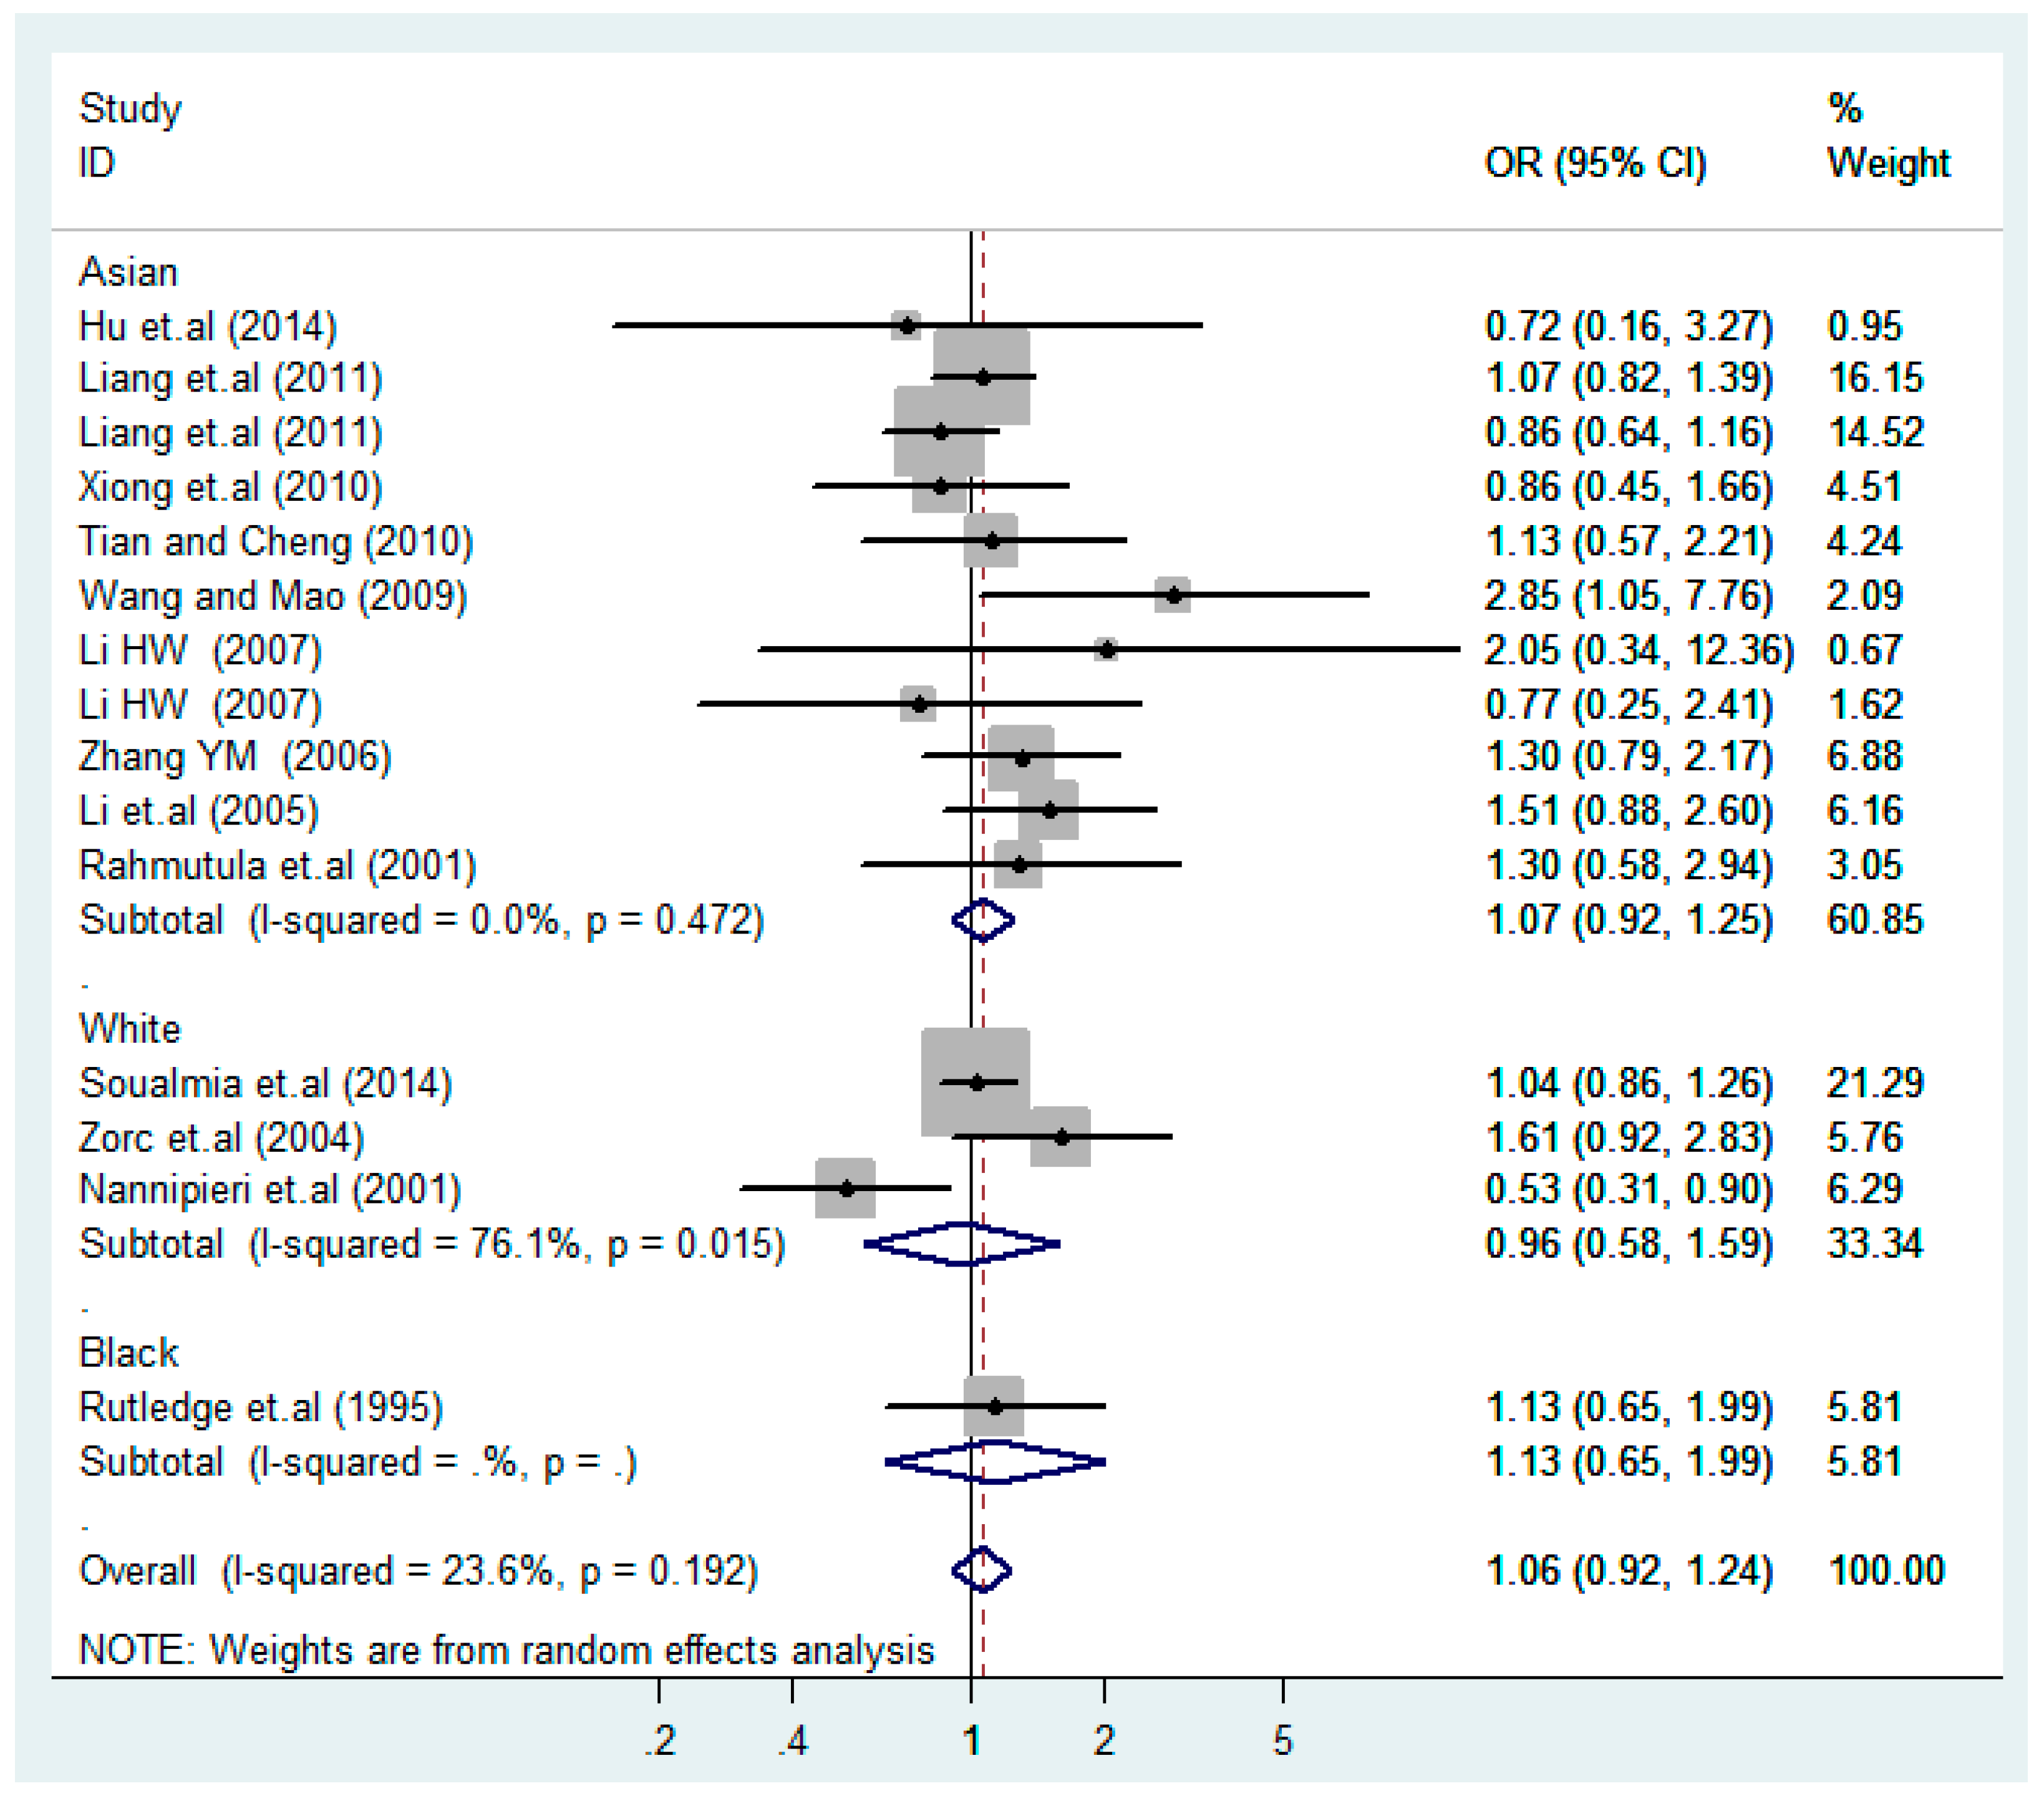
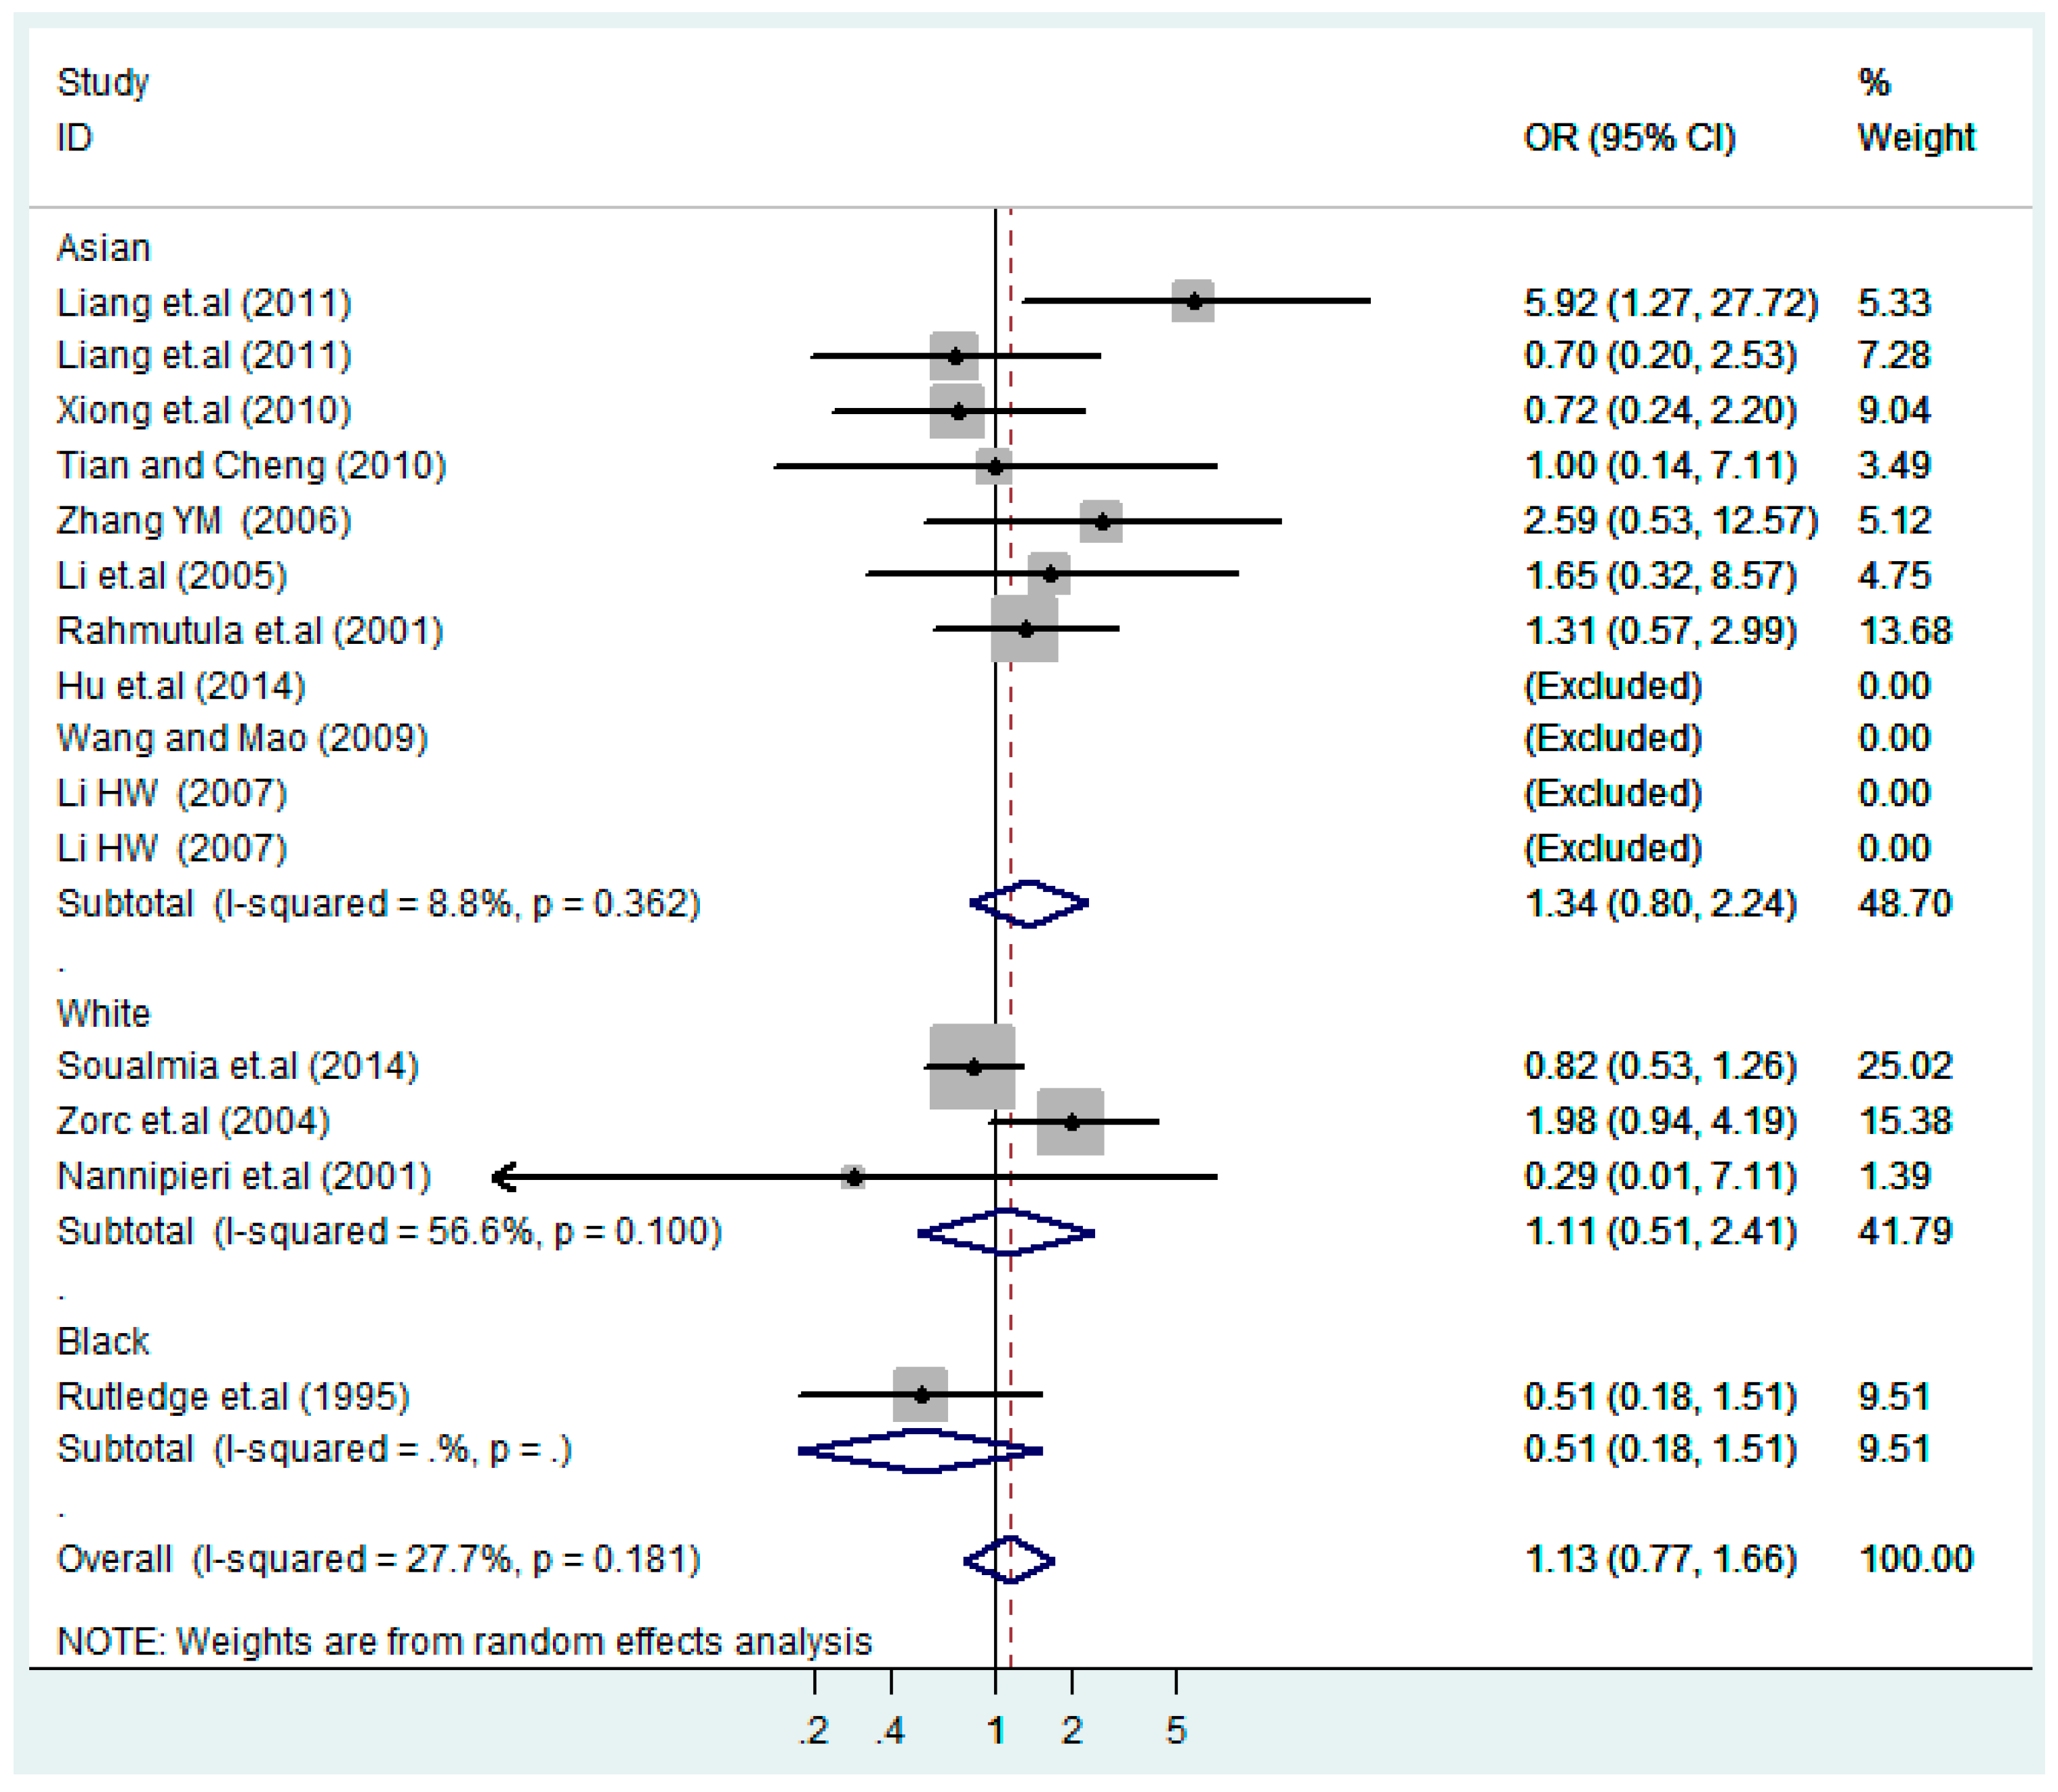
Ijerph 13 00458 g008
Figure 9. Ethnic subgroups analysis of T2238C additive model (C vs. T).
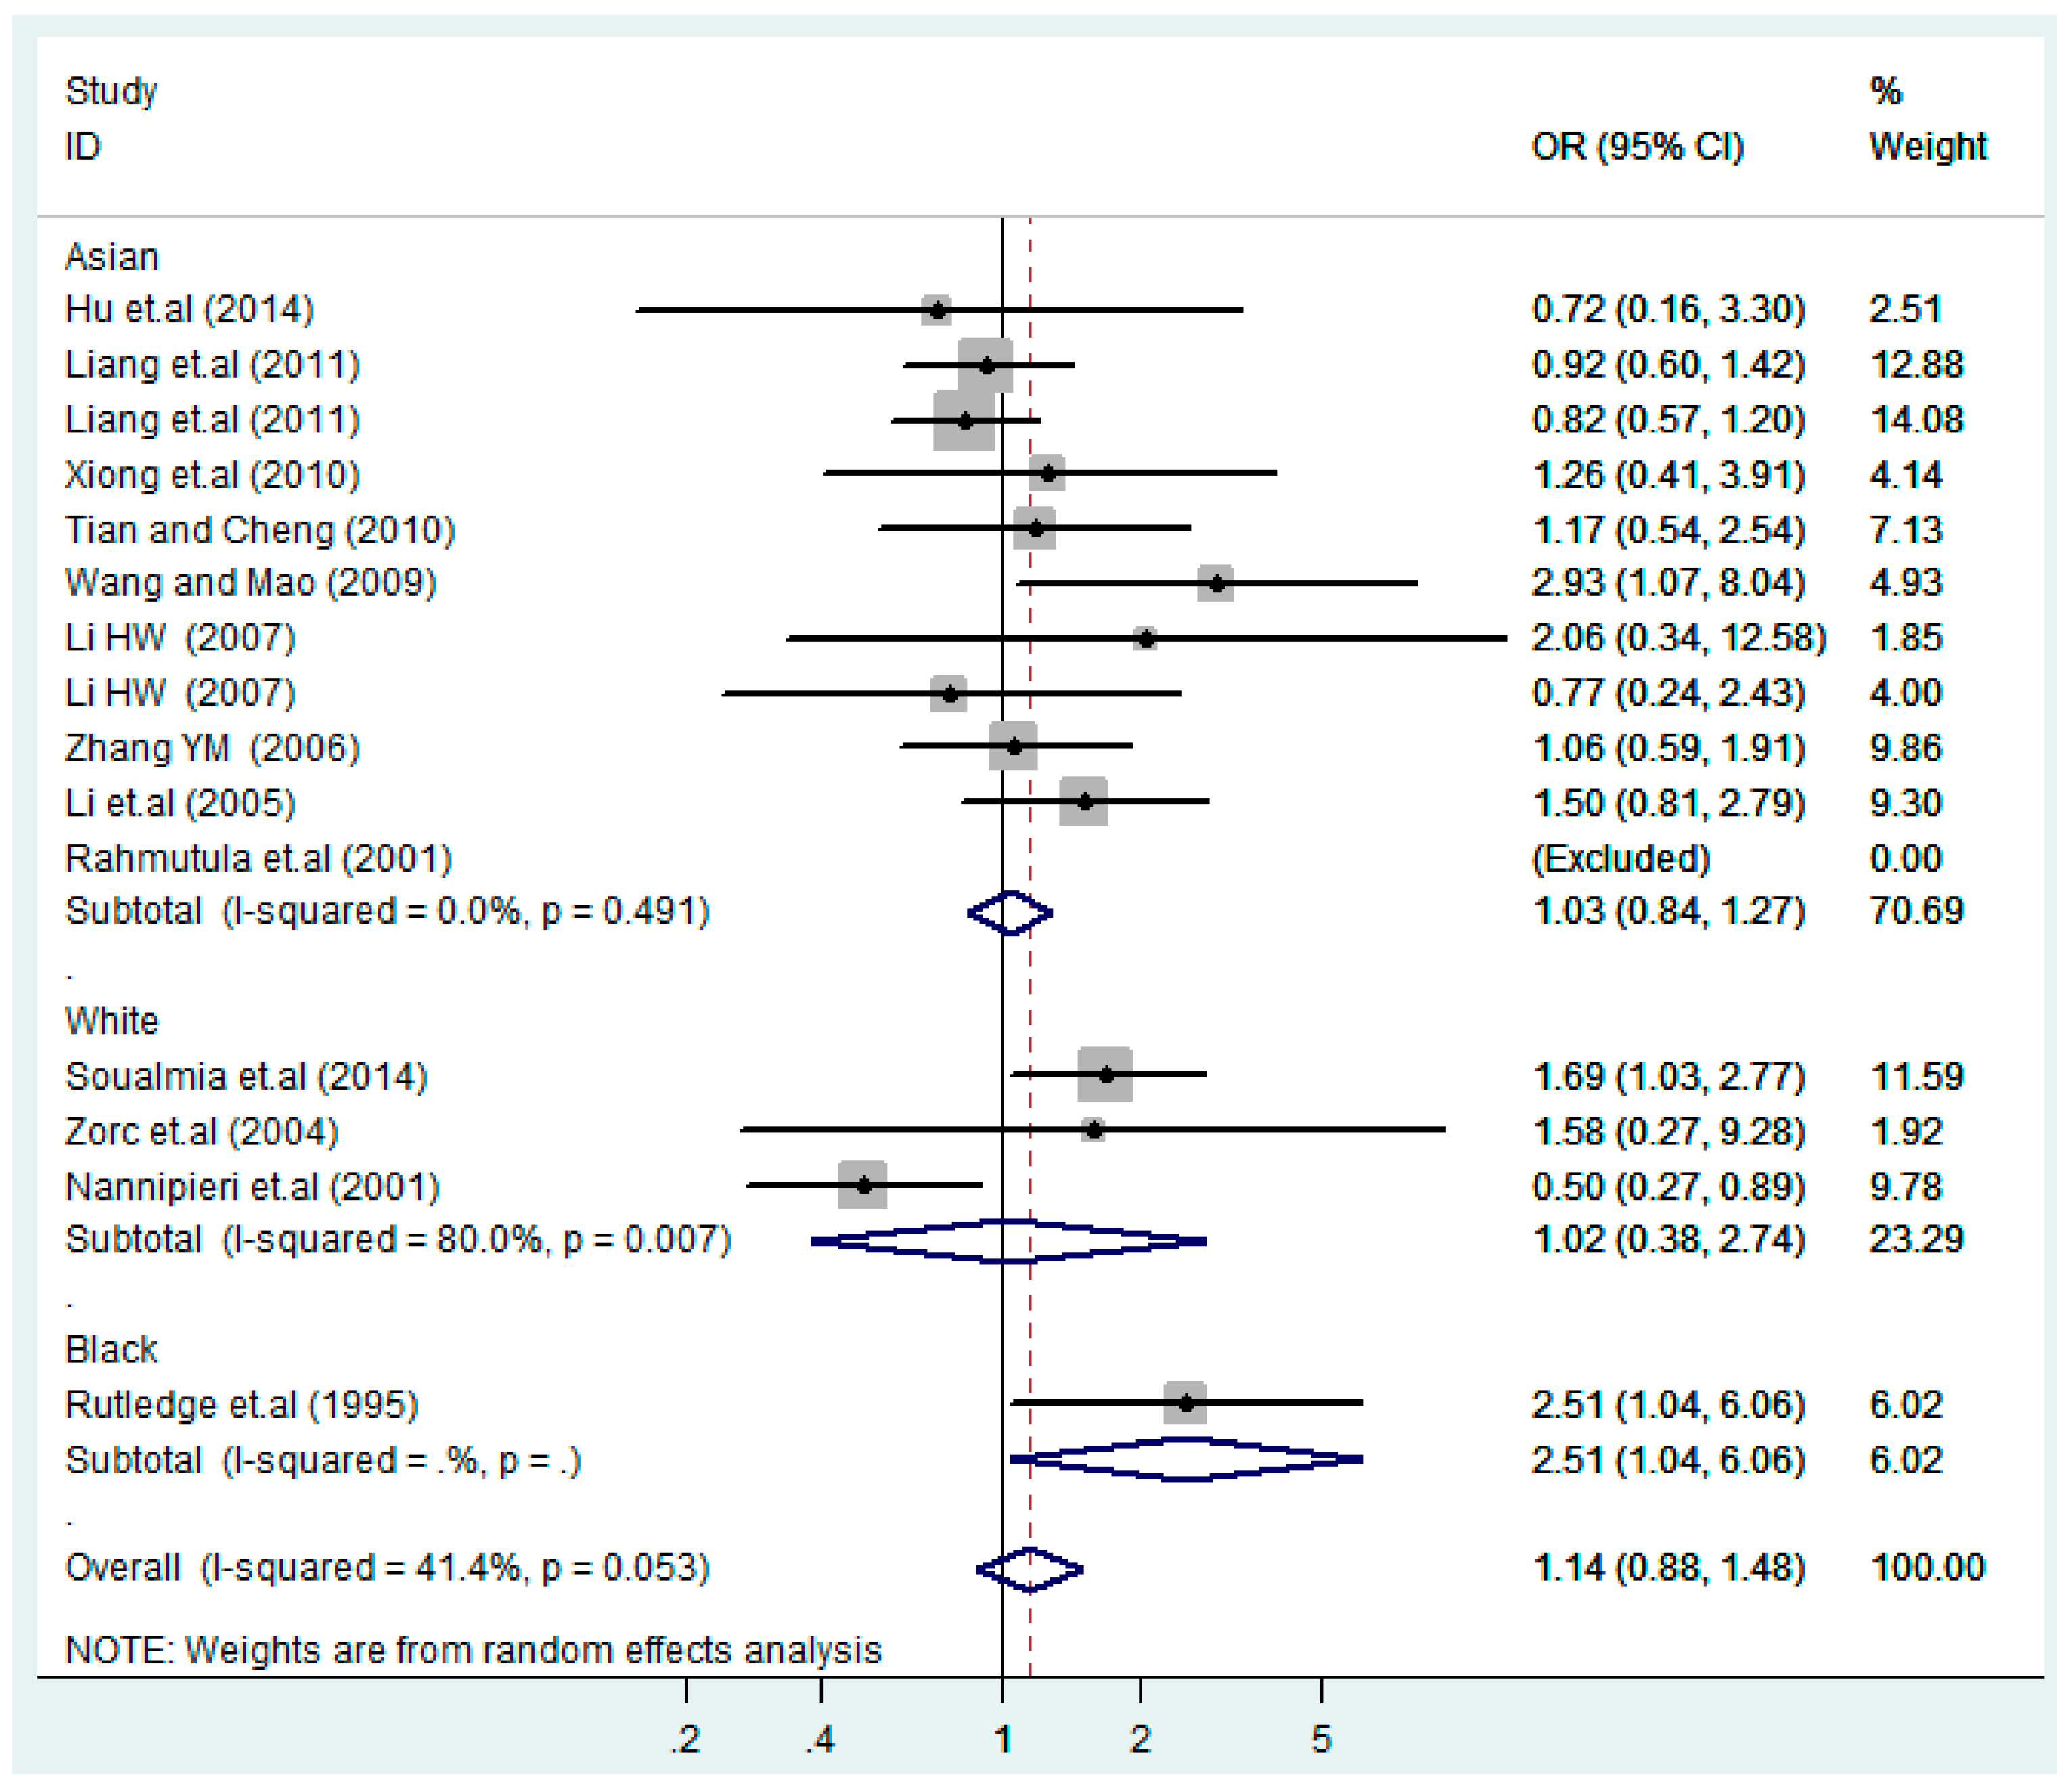
Ijerph 13 00458 g009
Figure 10. Ethnic subgroups analysis of T2238C co-dominant model-1 (TC vs. TT).
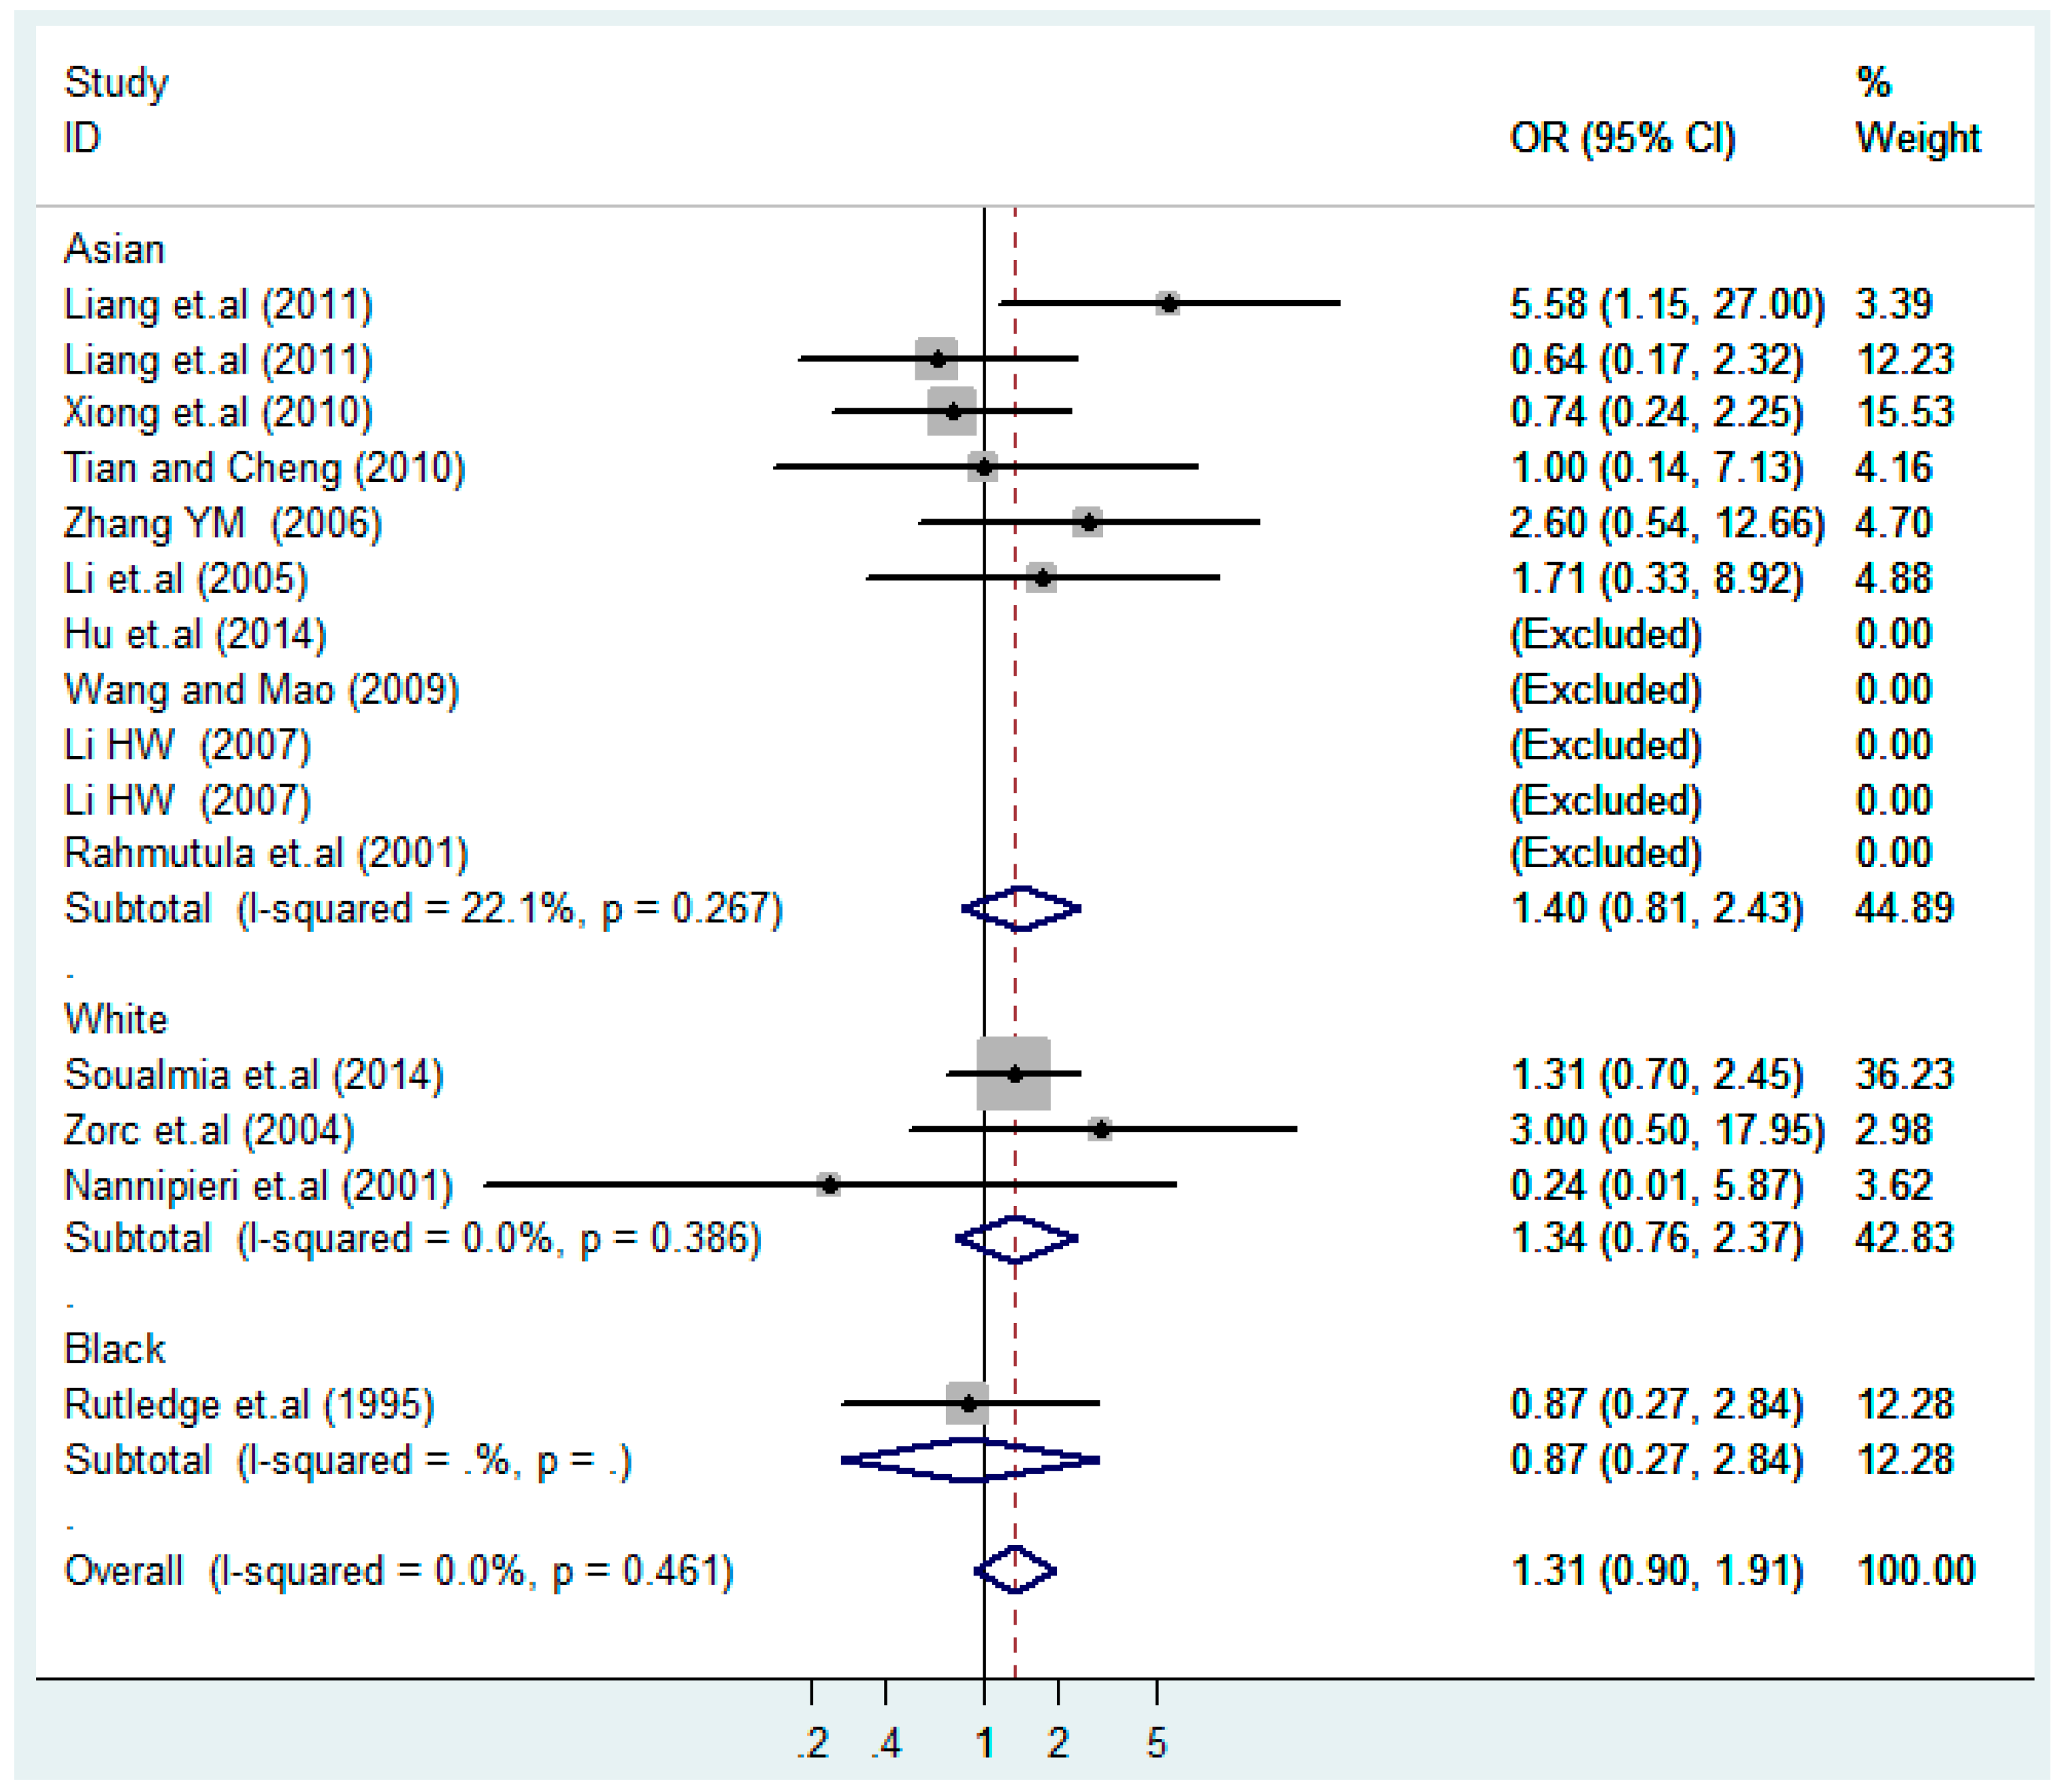
Ijerph 13 00458 g010
Figure 11. Ethnic subgroups analysis of T2238C co-dominant model-2 (CC vs. TT).
Ijerph 13 00458 g011
Figure 12. Ethnic subgroup analysis of T2238C dominant model (CC + TC) vs. TT.
Ijerph 13 00458 g012
Figure 13. Ethnic subgroup analysis of T2238C recessive model CC vs. (TT + TC).
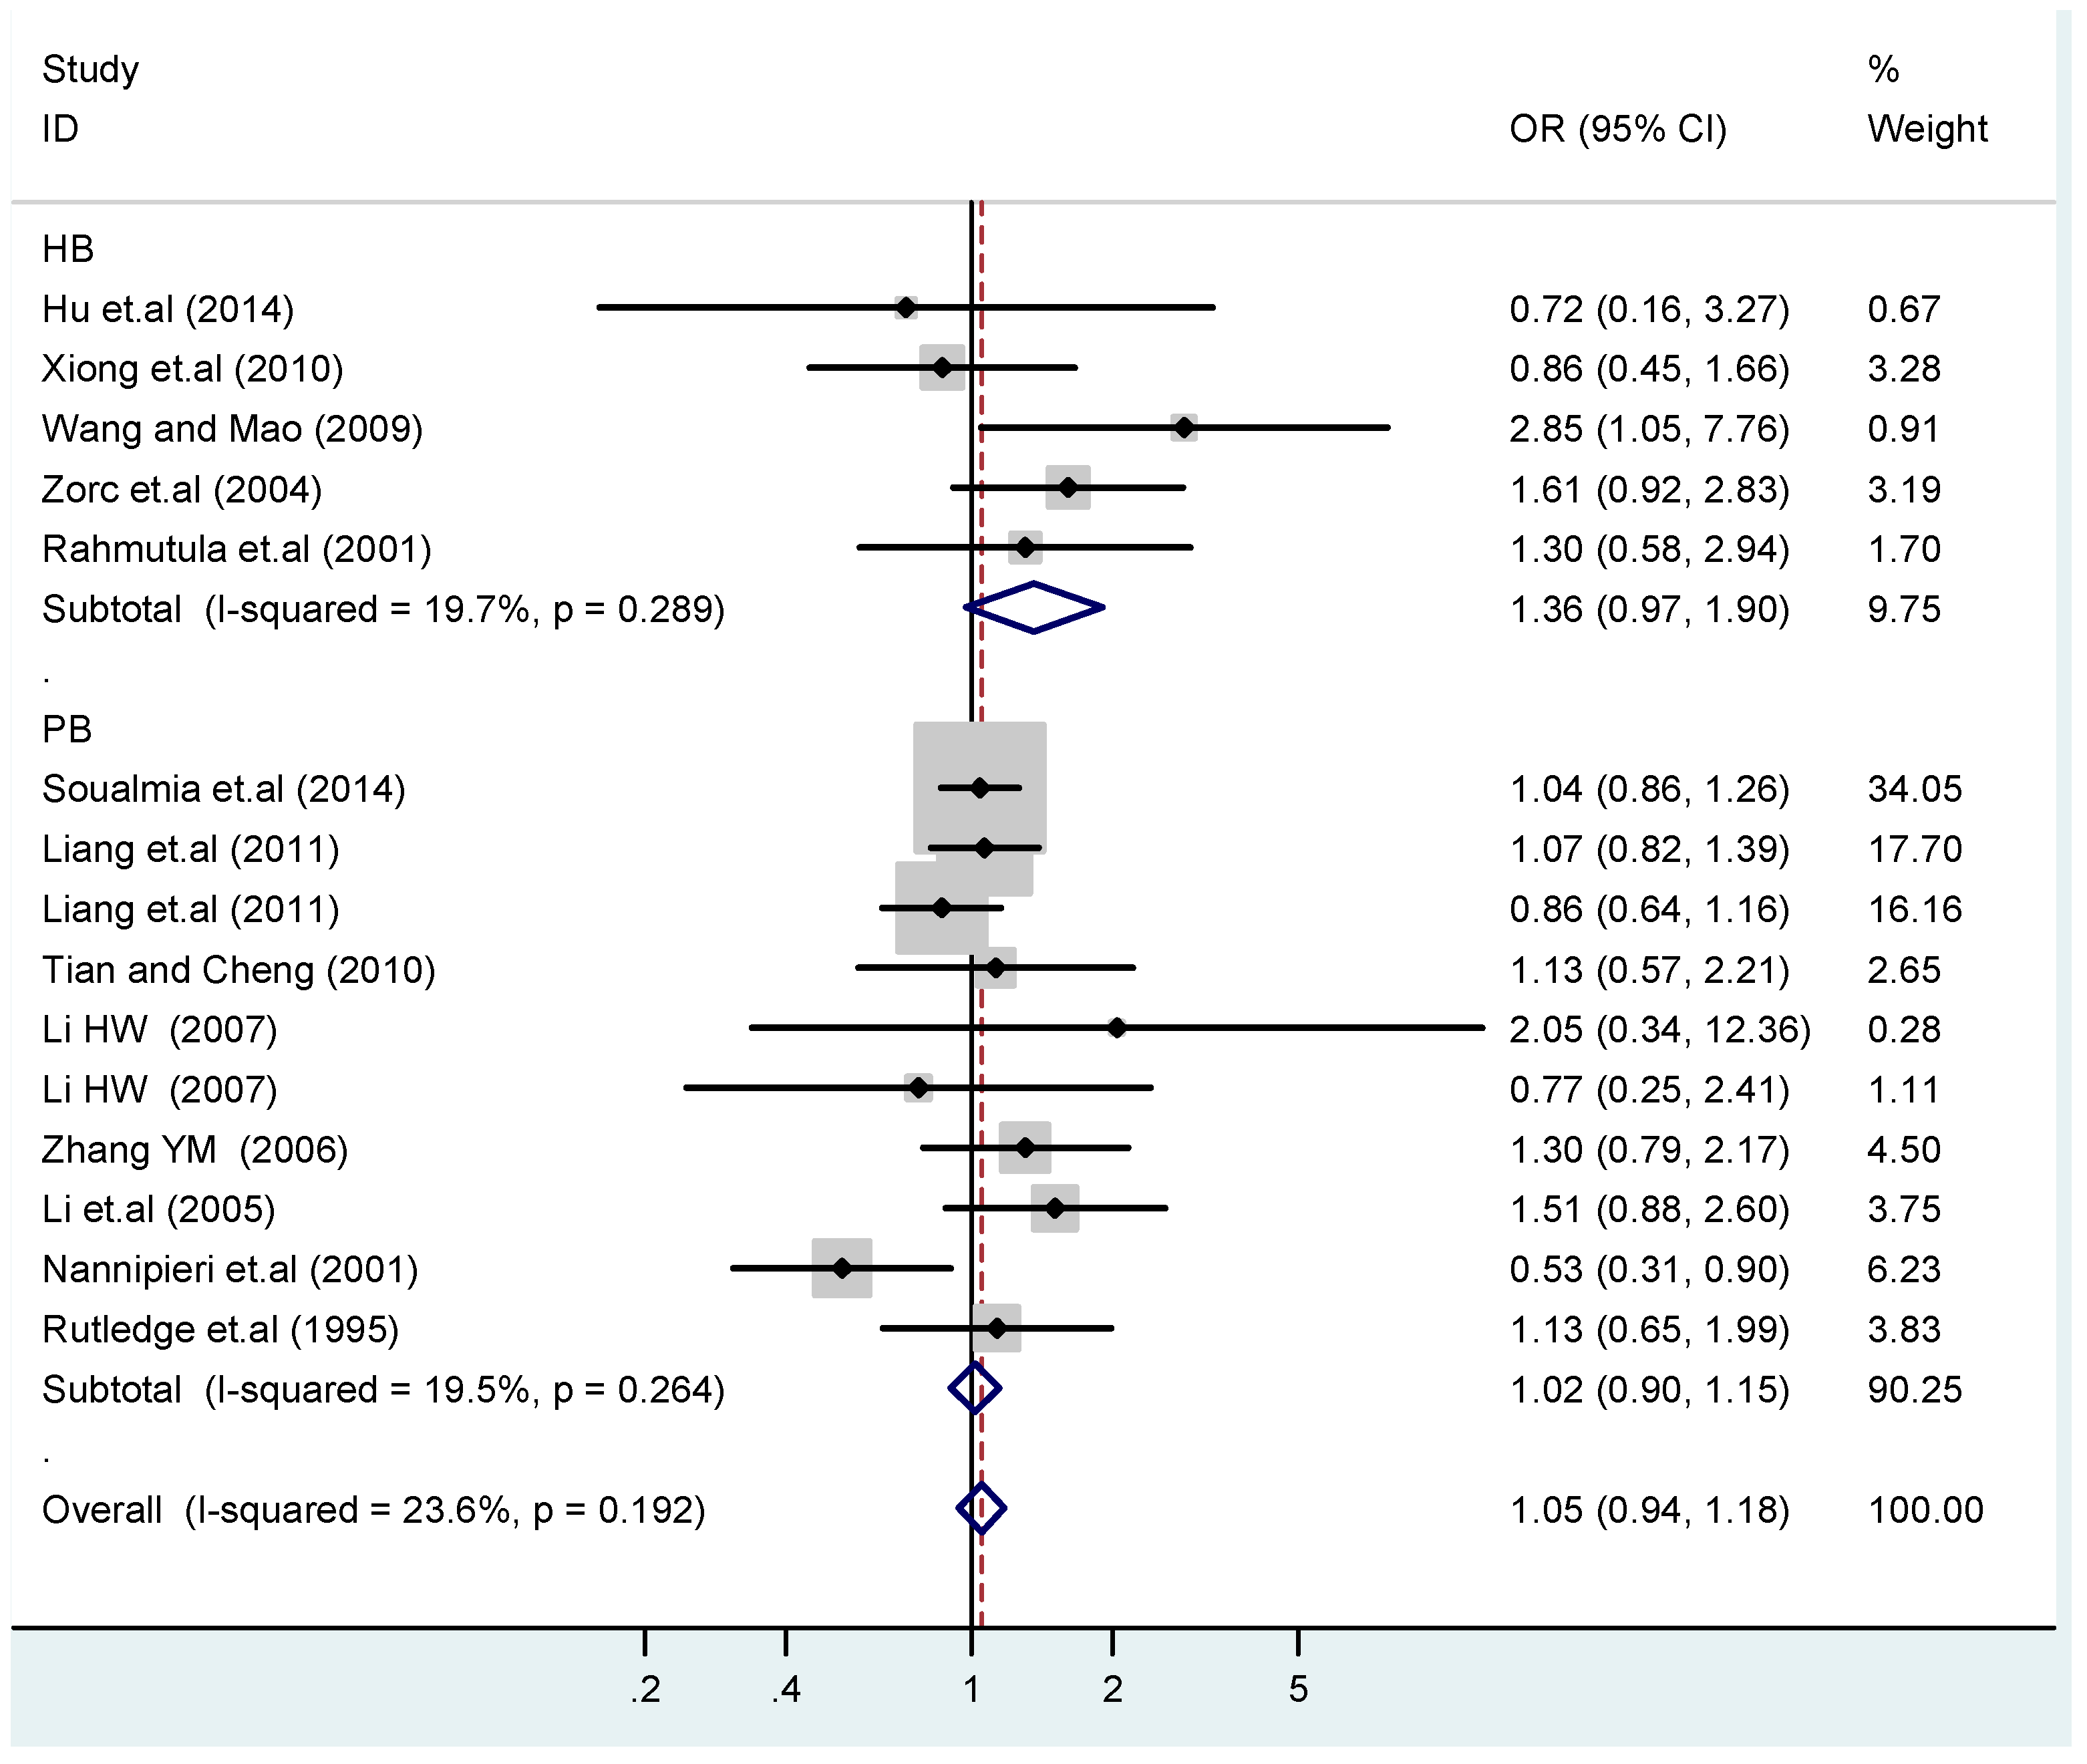
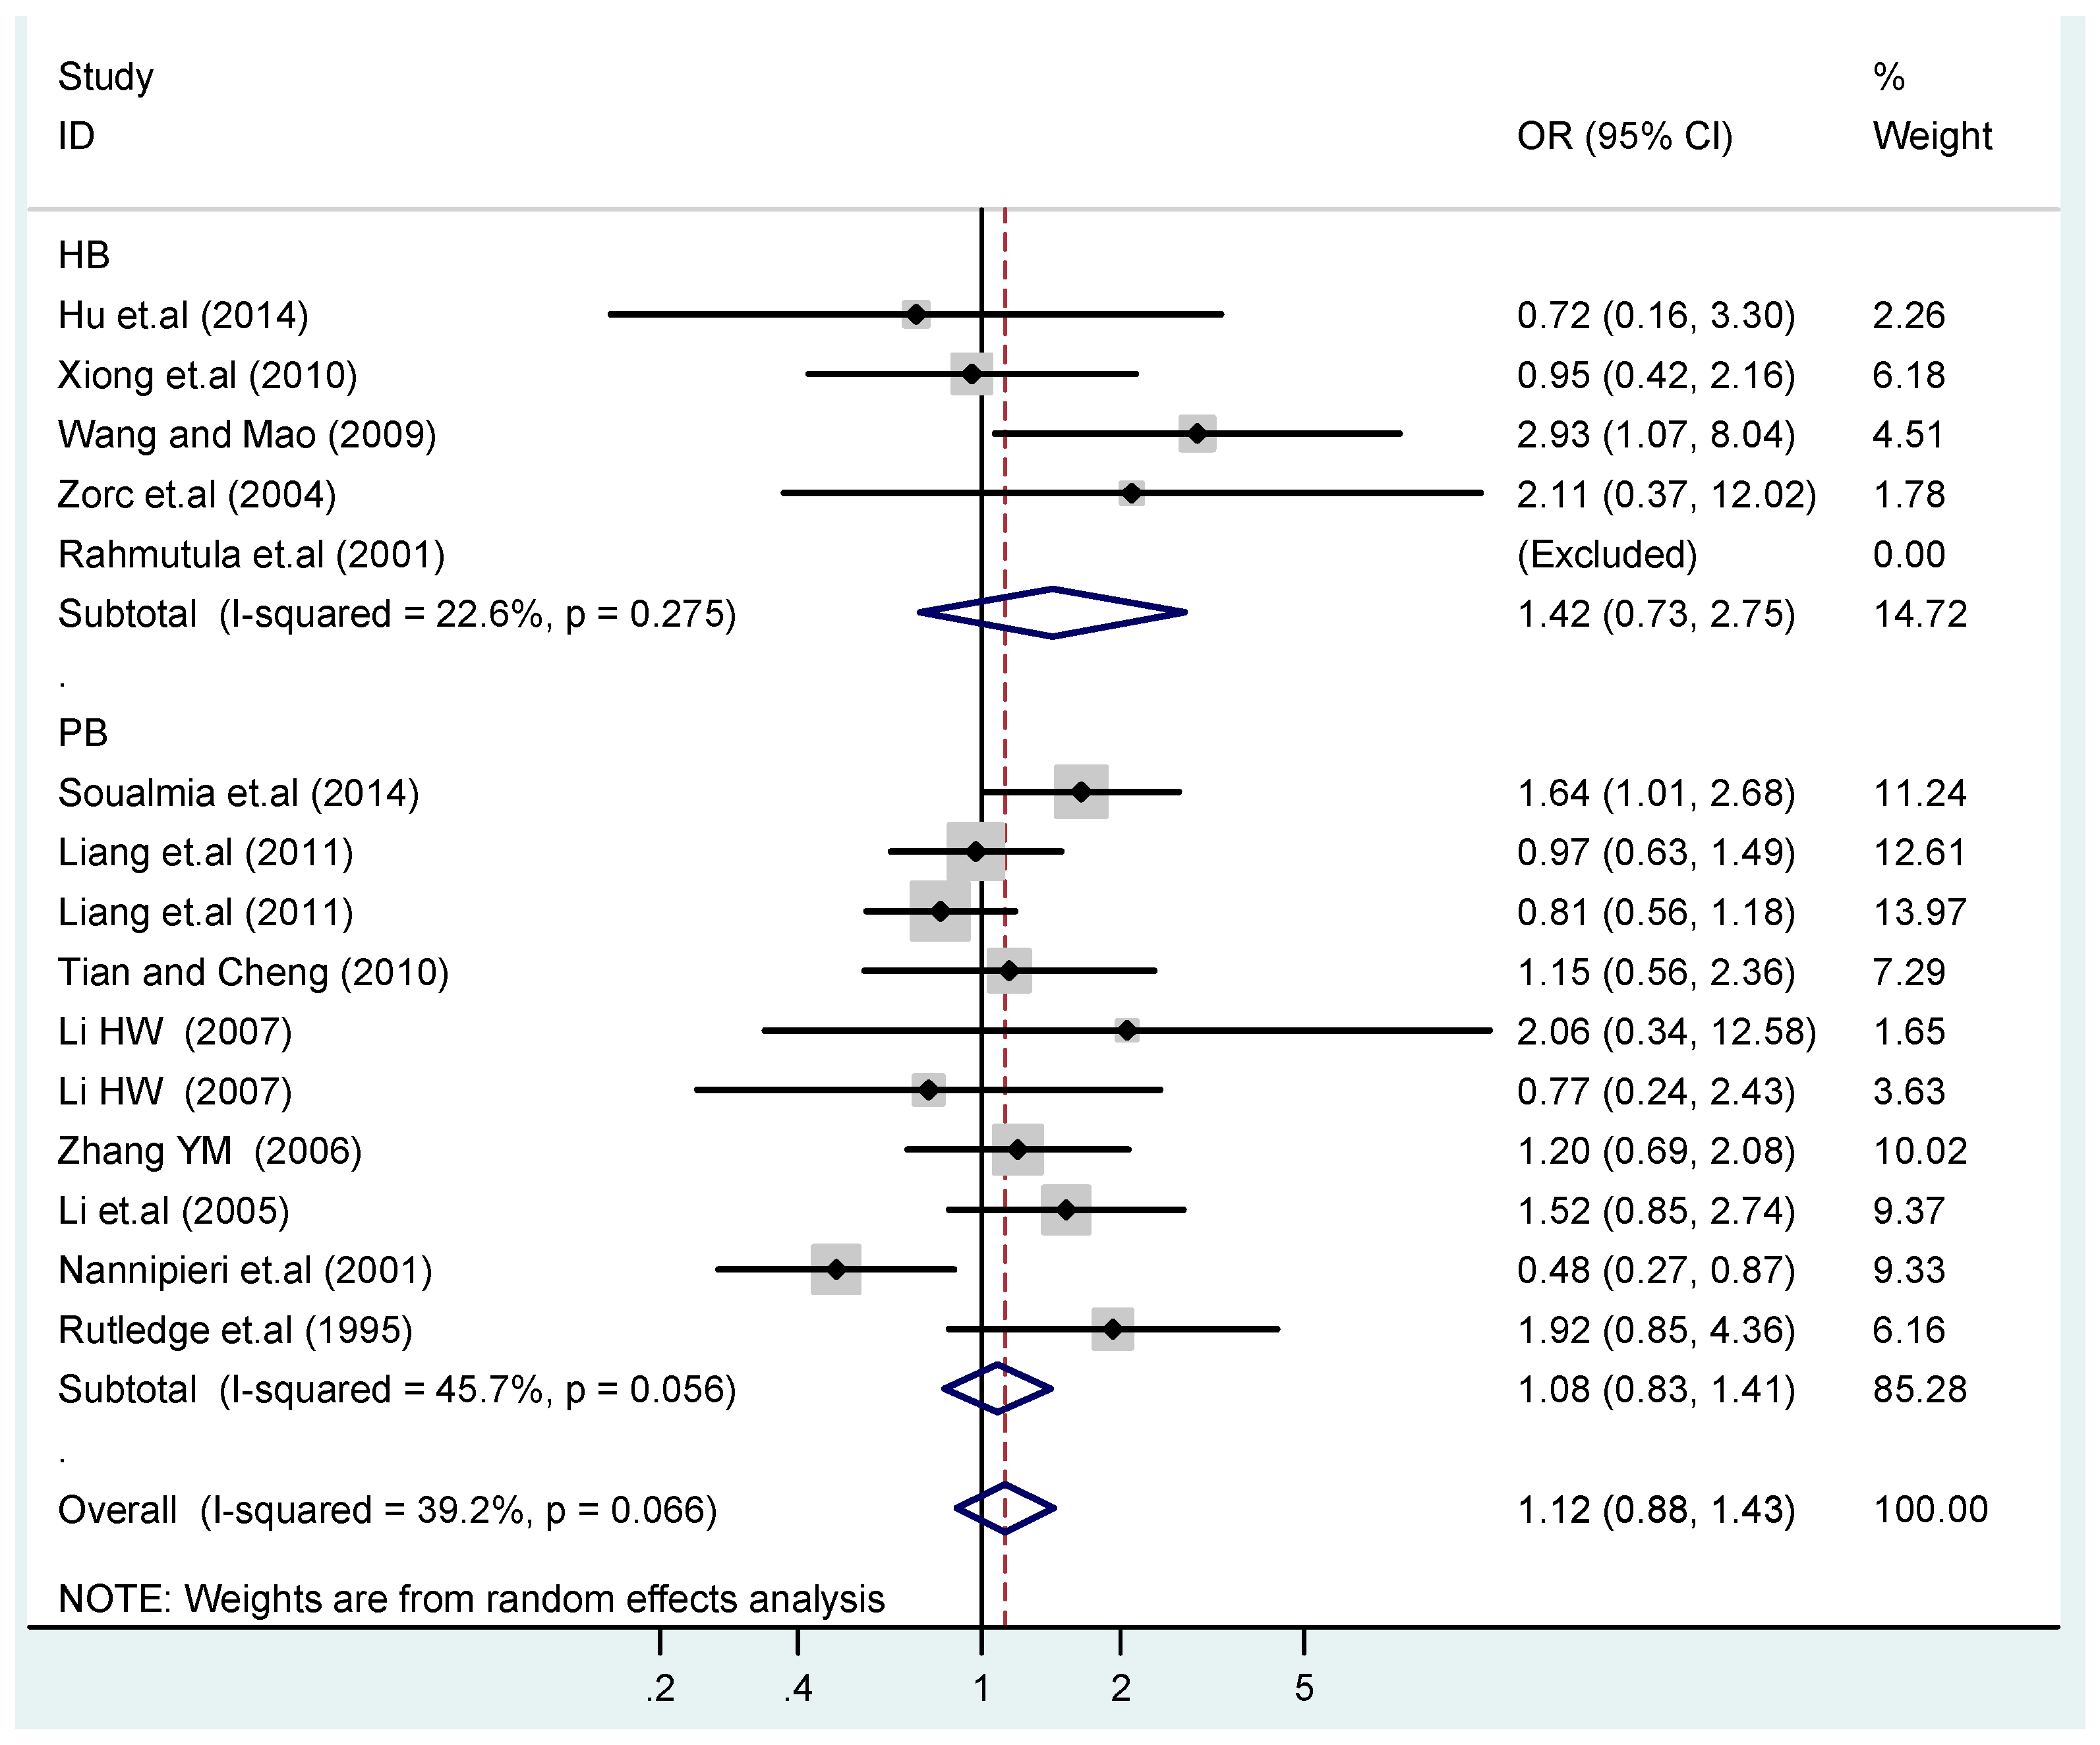
Ijerph 13 00458 g013
Figure 14. Subgroups in sources of controls of T2238C additive model (C vs. T).
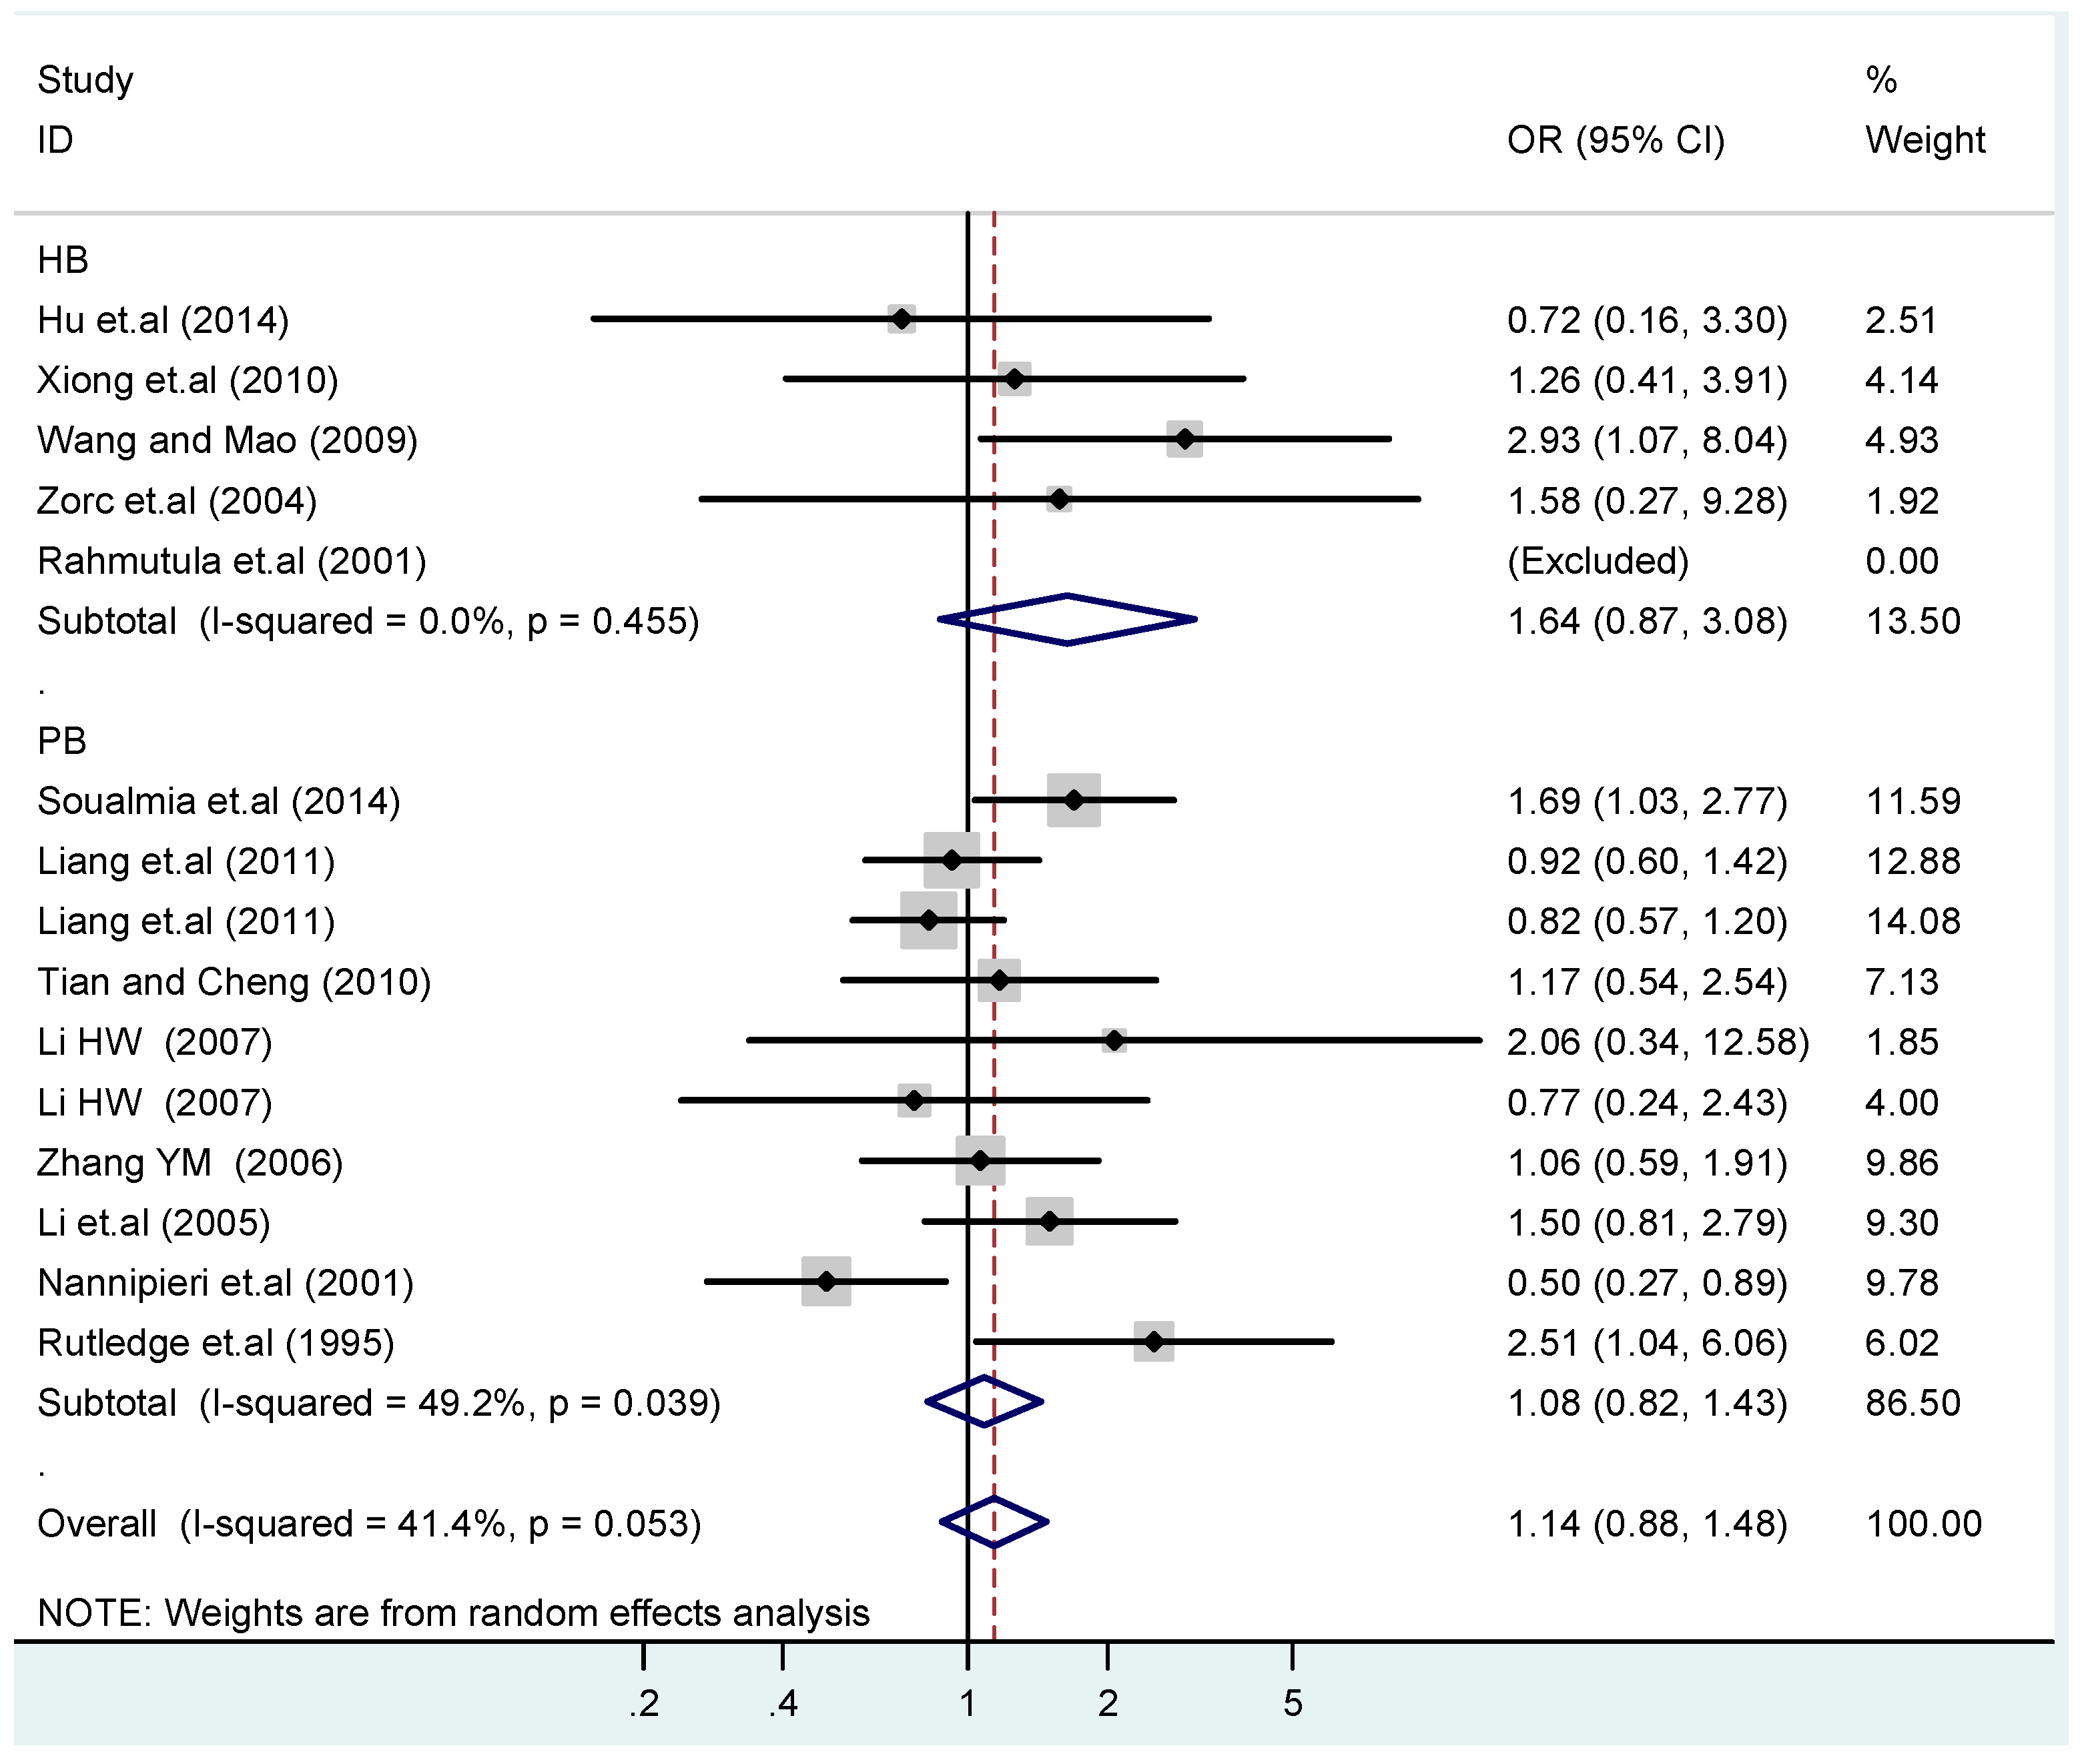
Ijerph 13 00458 g014
Figure 15. Subgroups in sources of controls of T2238C co-dominant model-1 (TC vs. TT).
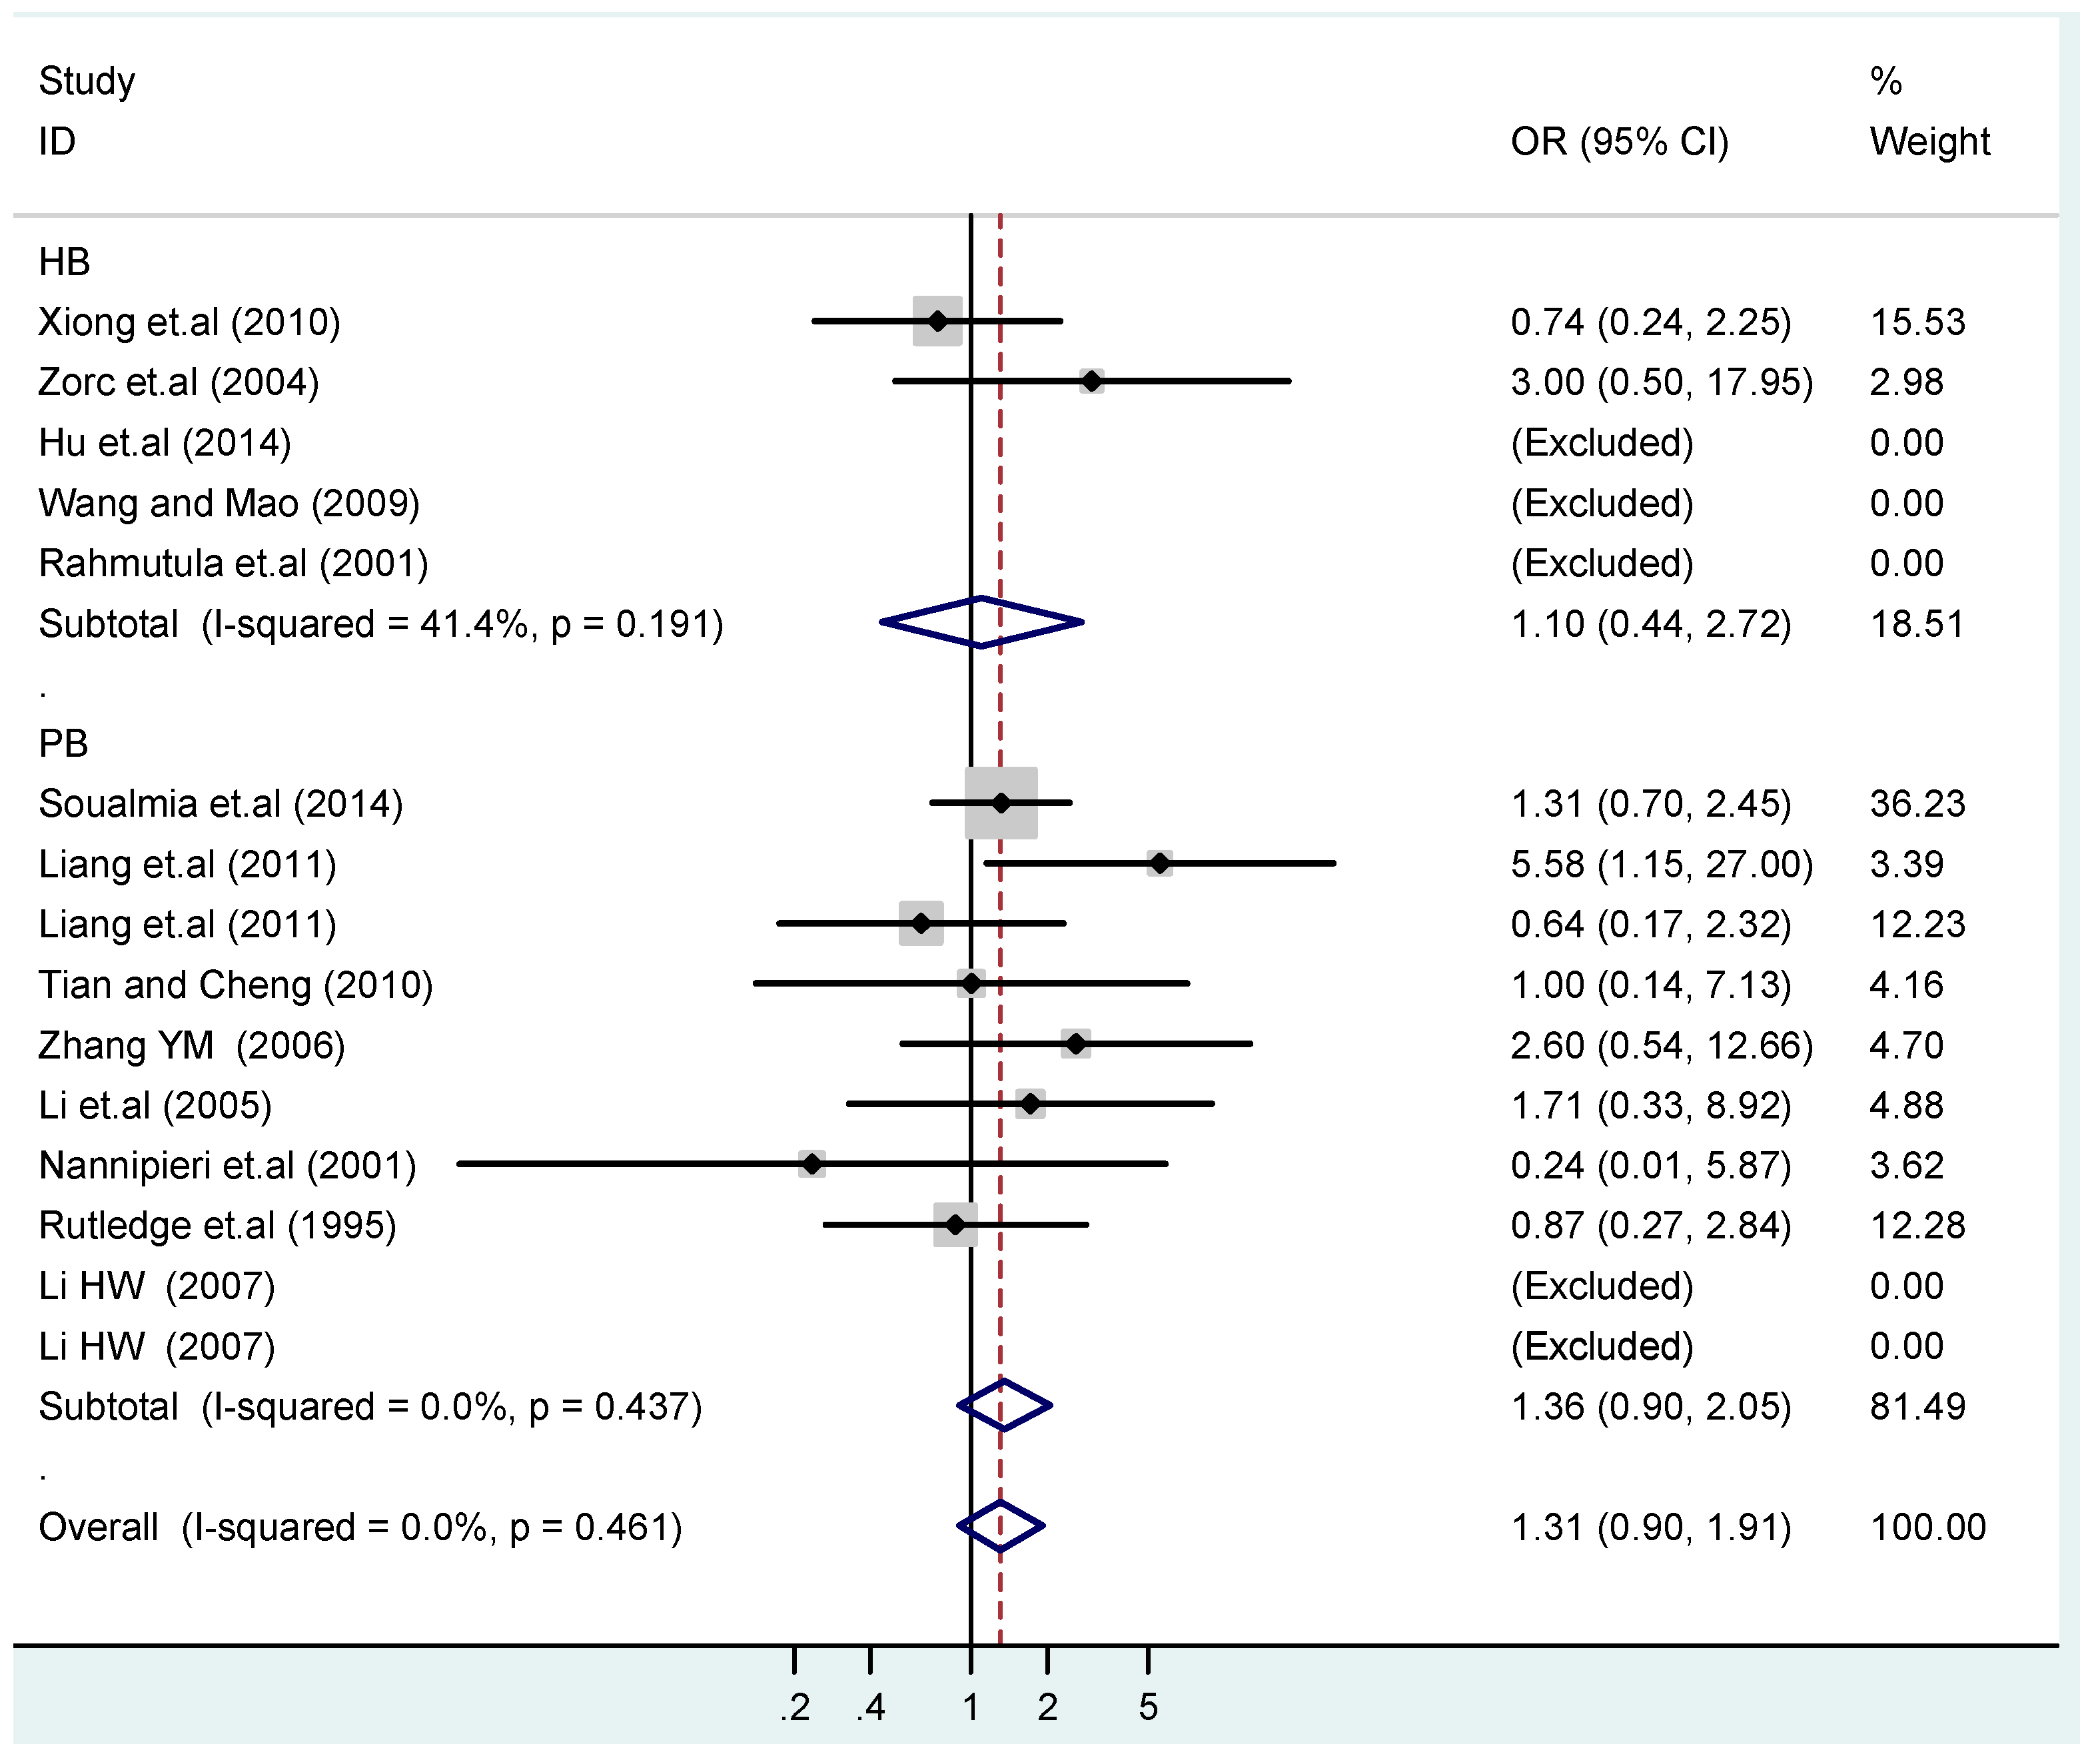
Ijerph 13 00458 g015
Figure 16. Subgroups in sources of controls of T2238C co-dominant model-2 (CC vs. TT).
Ijerph 13 00458 g016
Figure 17. Subgroups in sources of controls of T2238C dominant model (CC + TC) vs. TT.
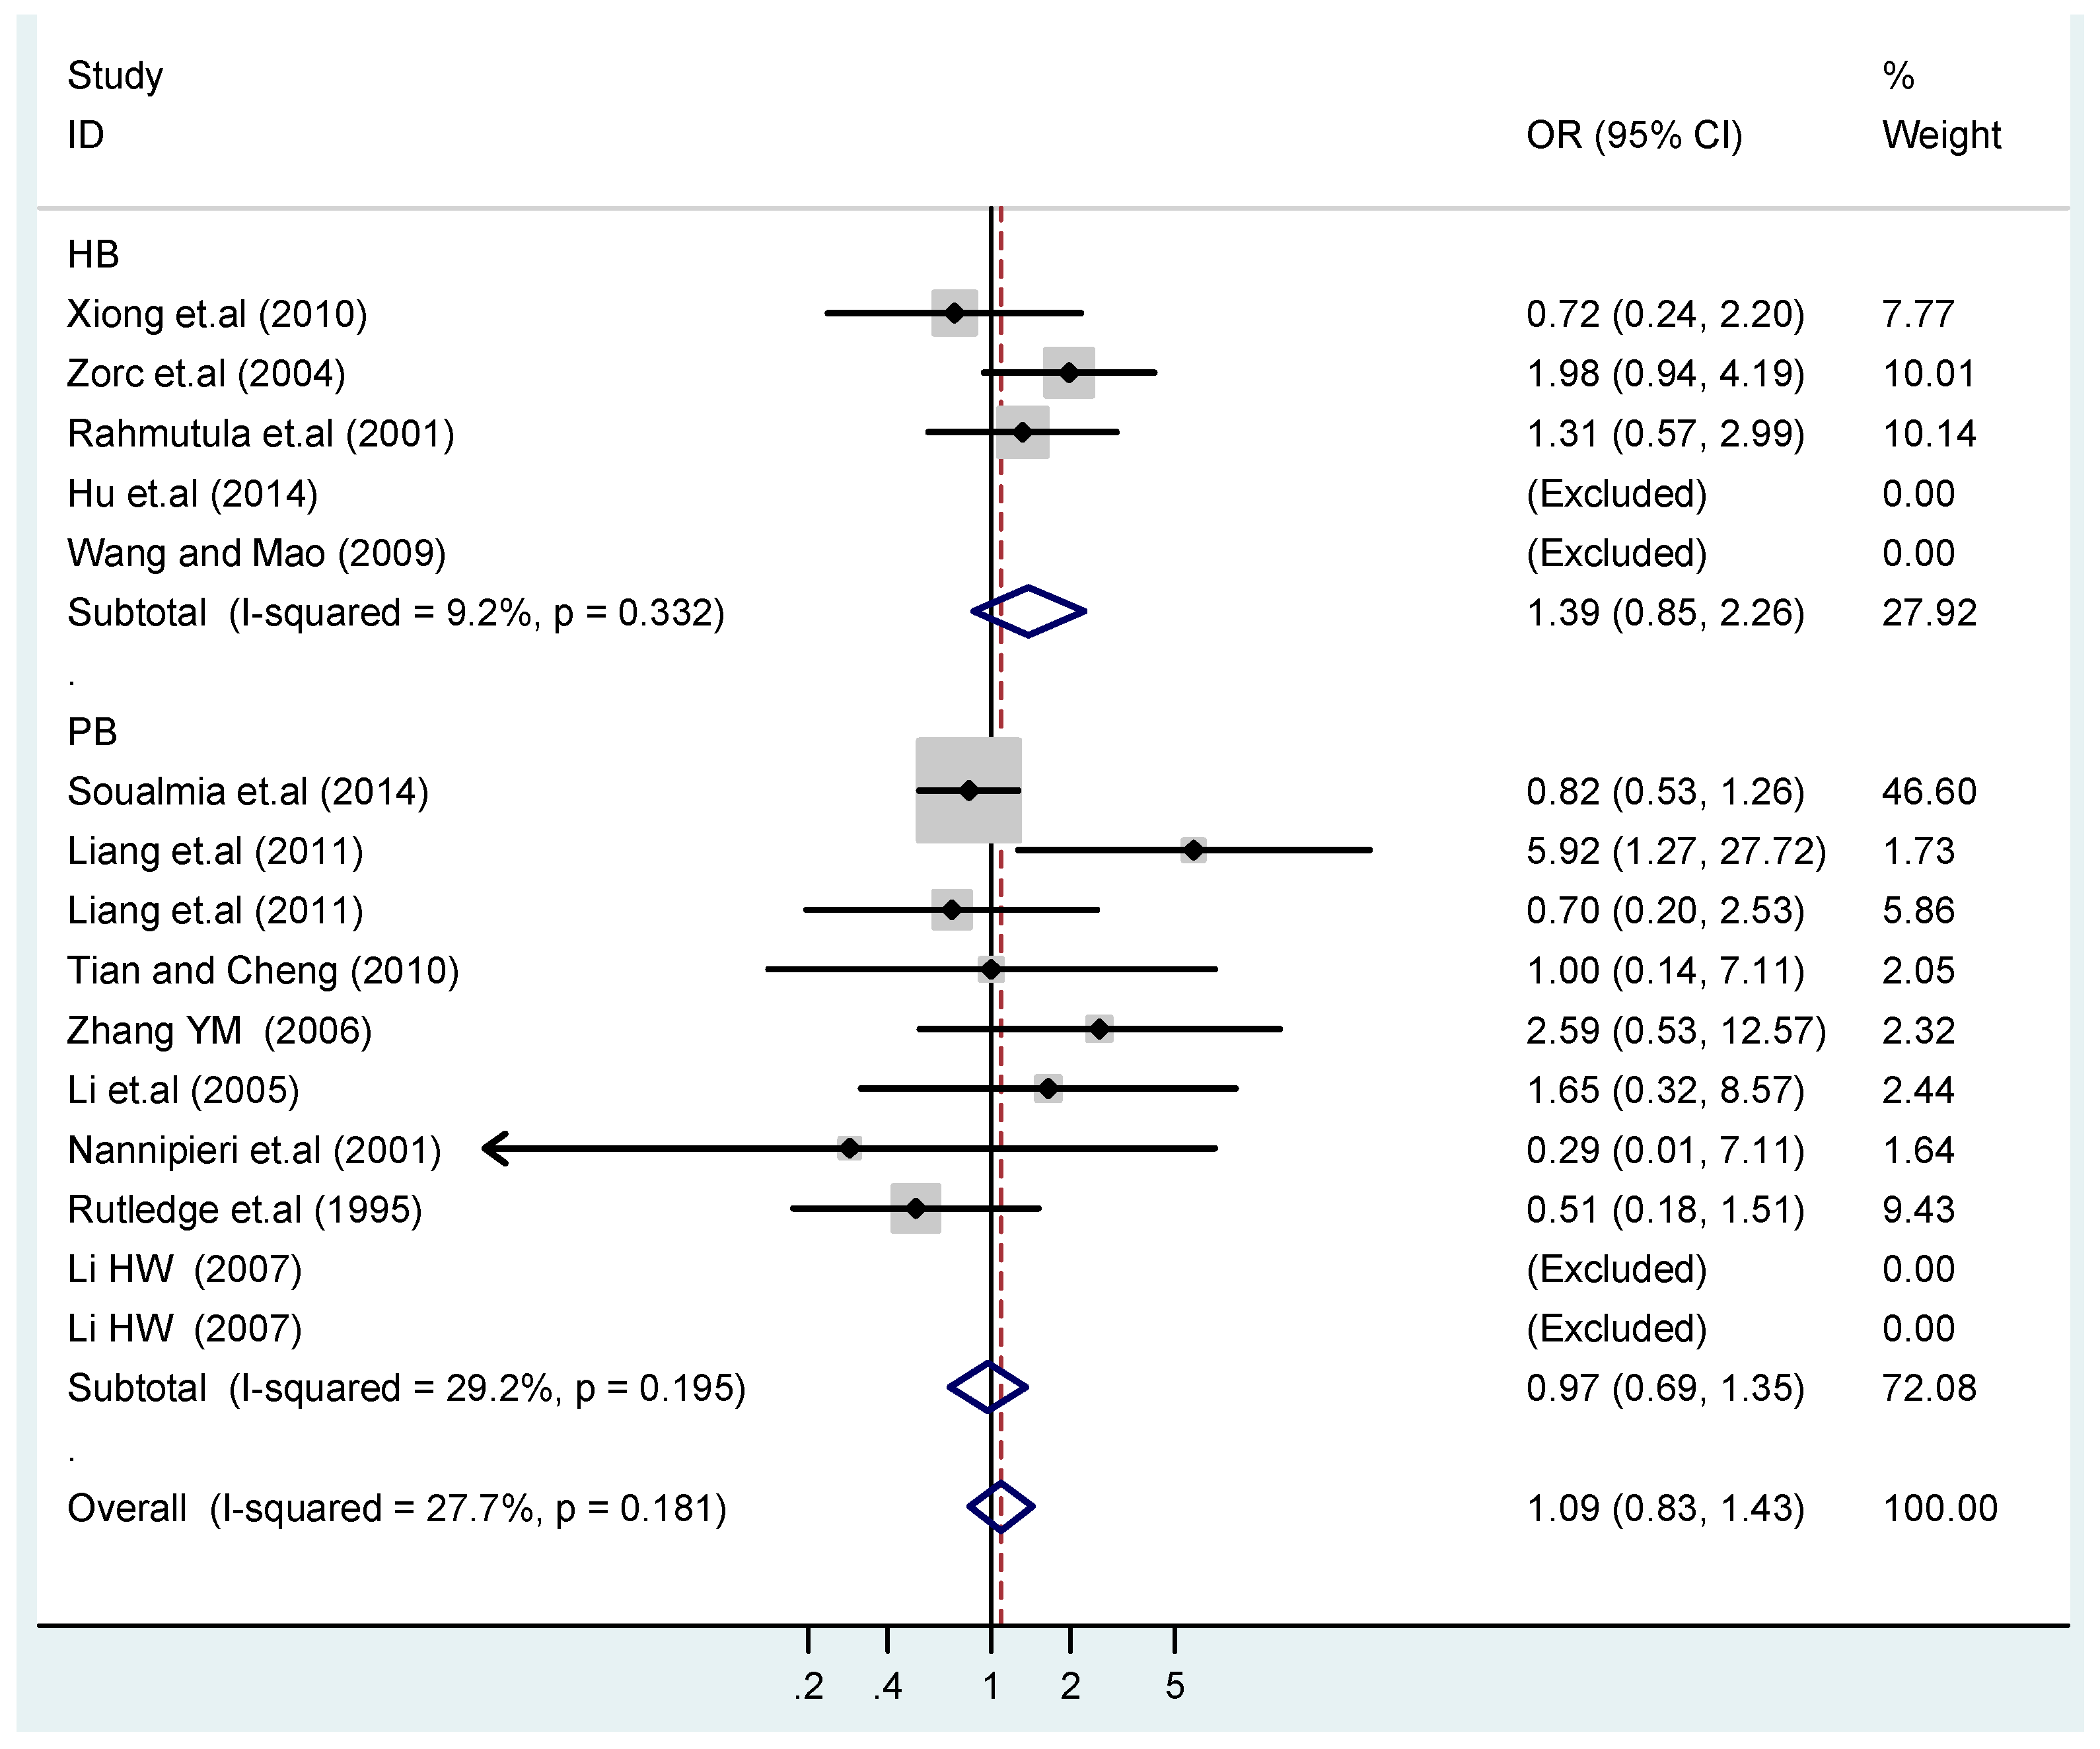
Ijerph 13 00458 g017
Figure 18. Subgroups in sources of controls of T2238C recessive model CC vs. (TT + TC).
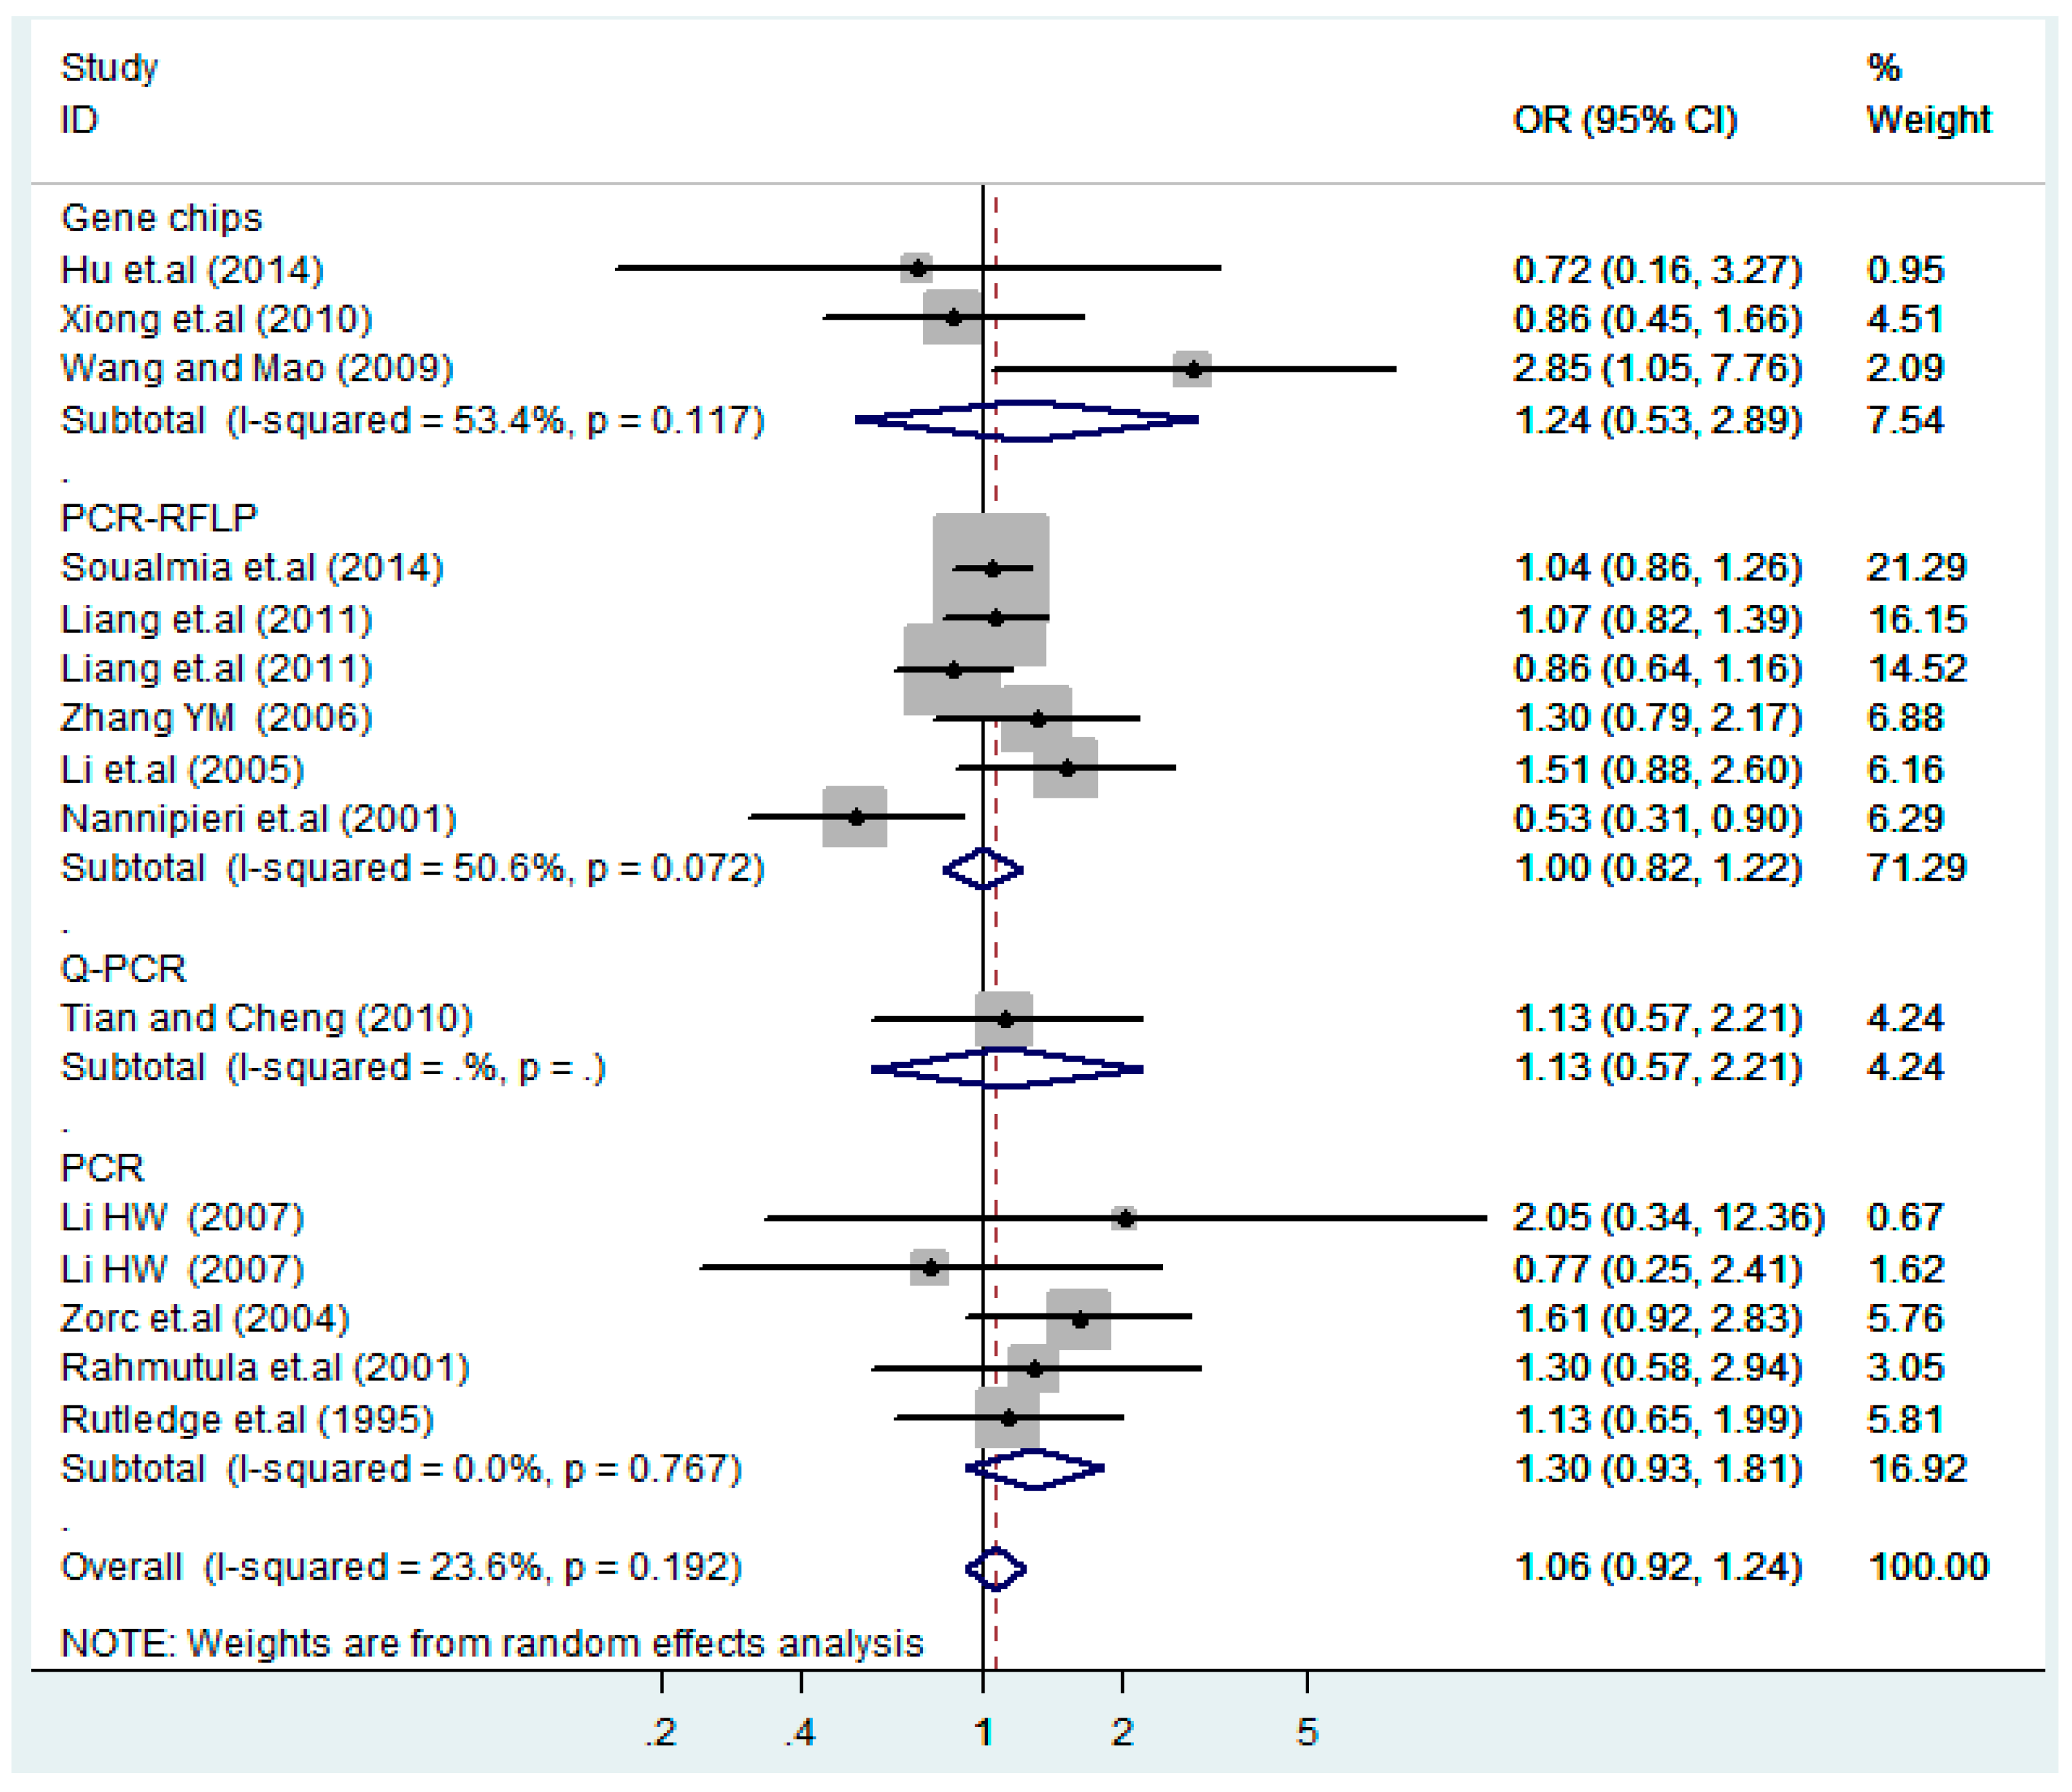
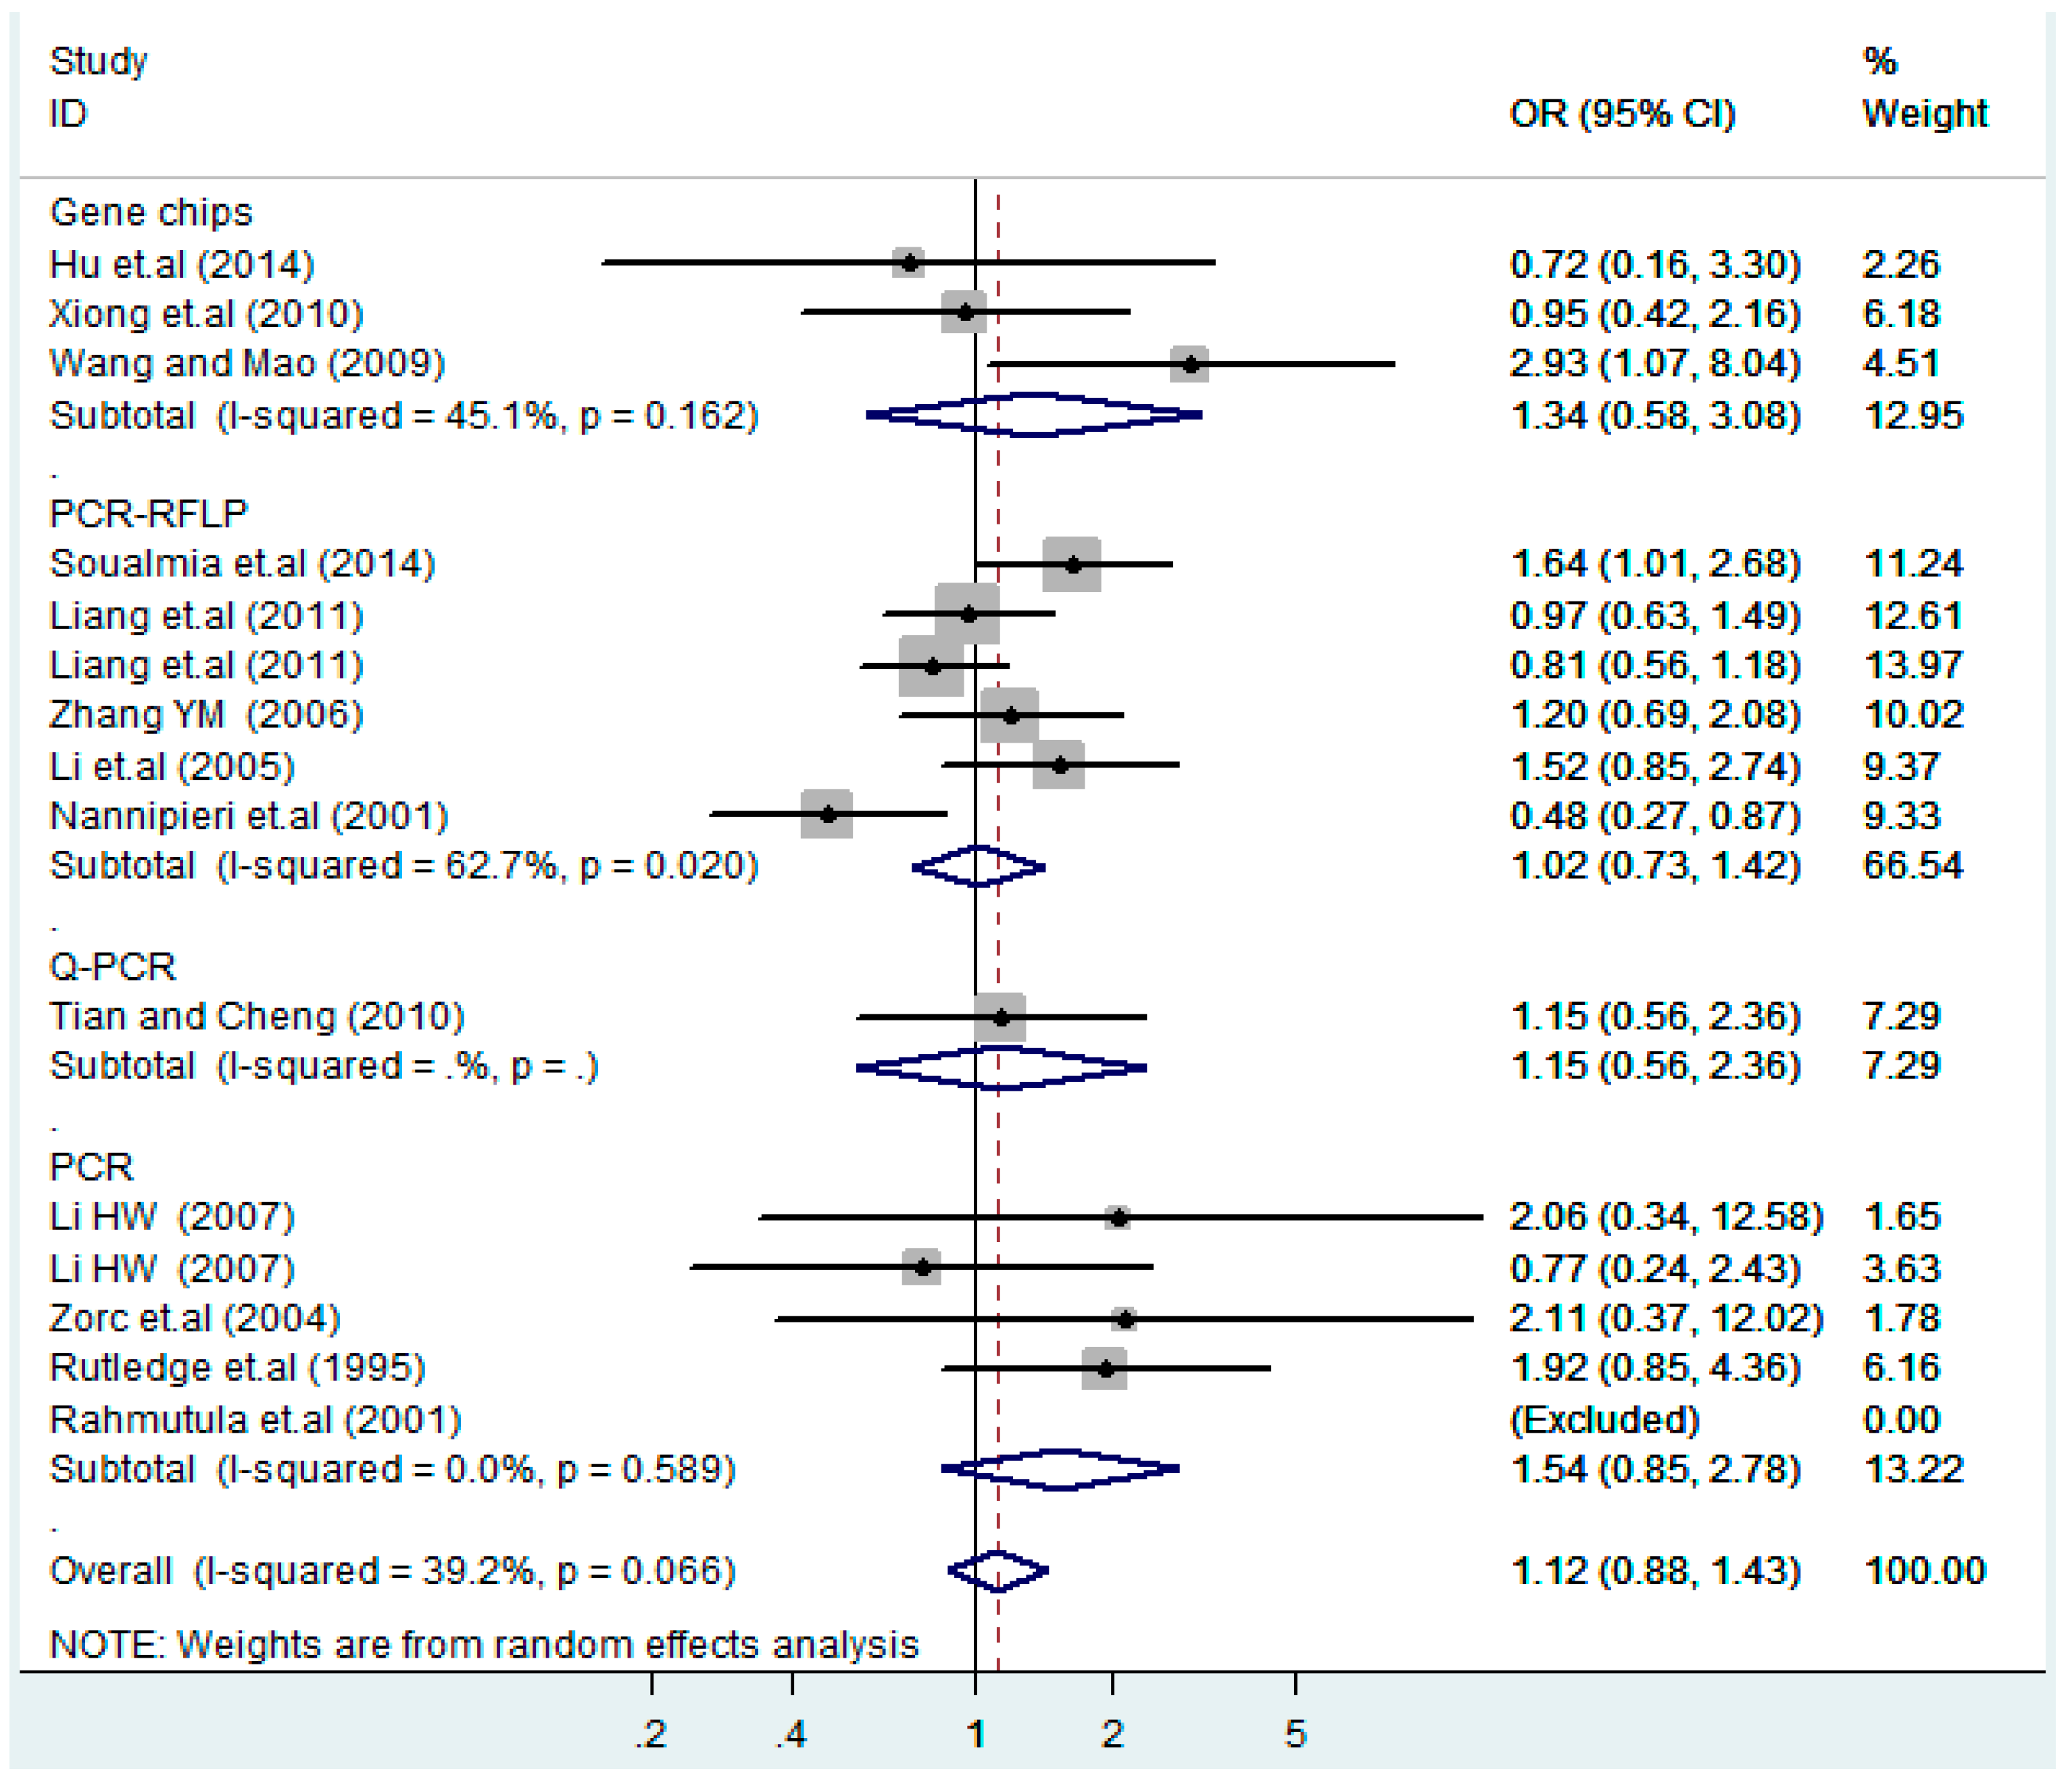
Ijerph 13 00458 g018
Figure 19. Subgroups of genotyping methods of T2238C additive model (C vs. T).
Ijerph 13 00458 g019
Figure 20. Subgroups of genotyping methods of T2238C co-dominant model-1 (TC vs. TT).
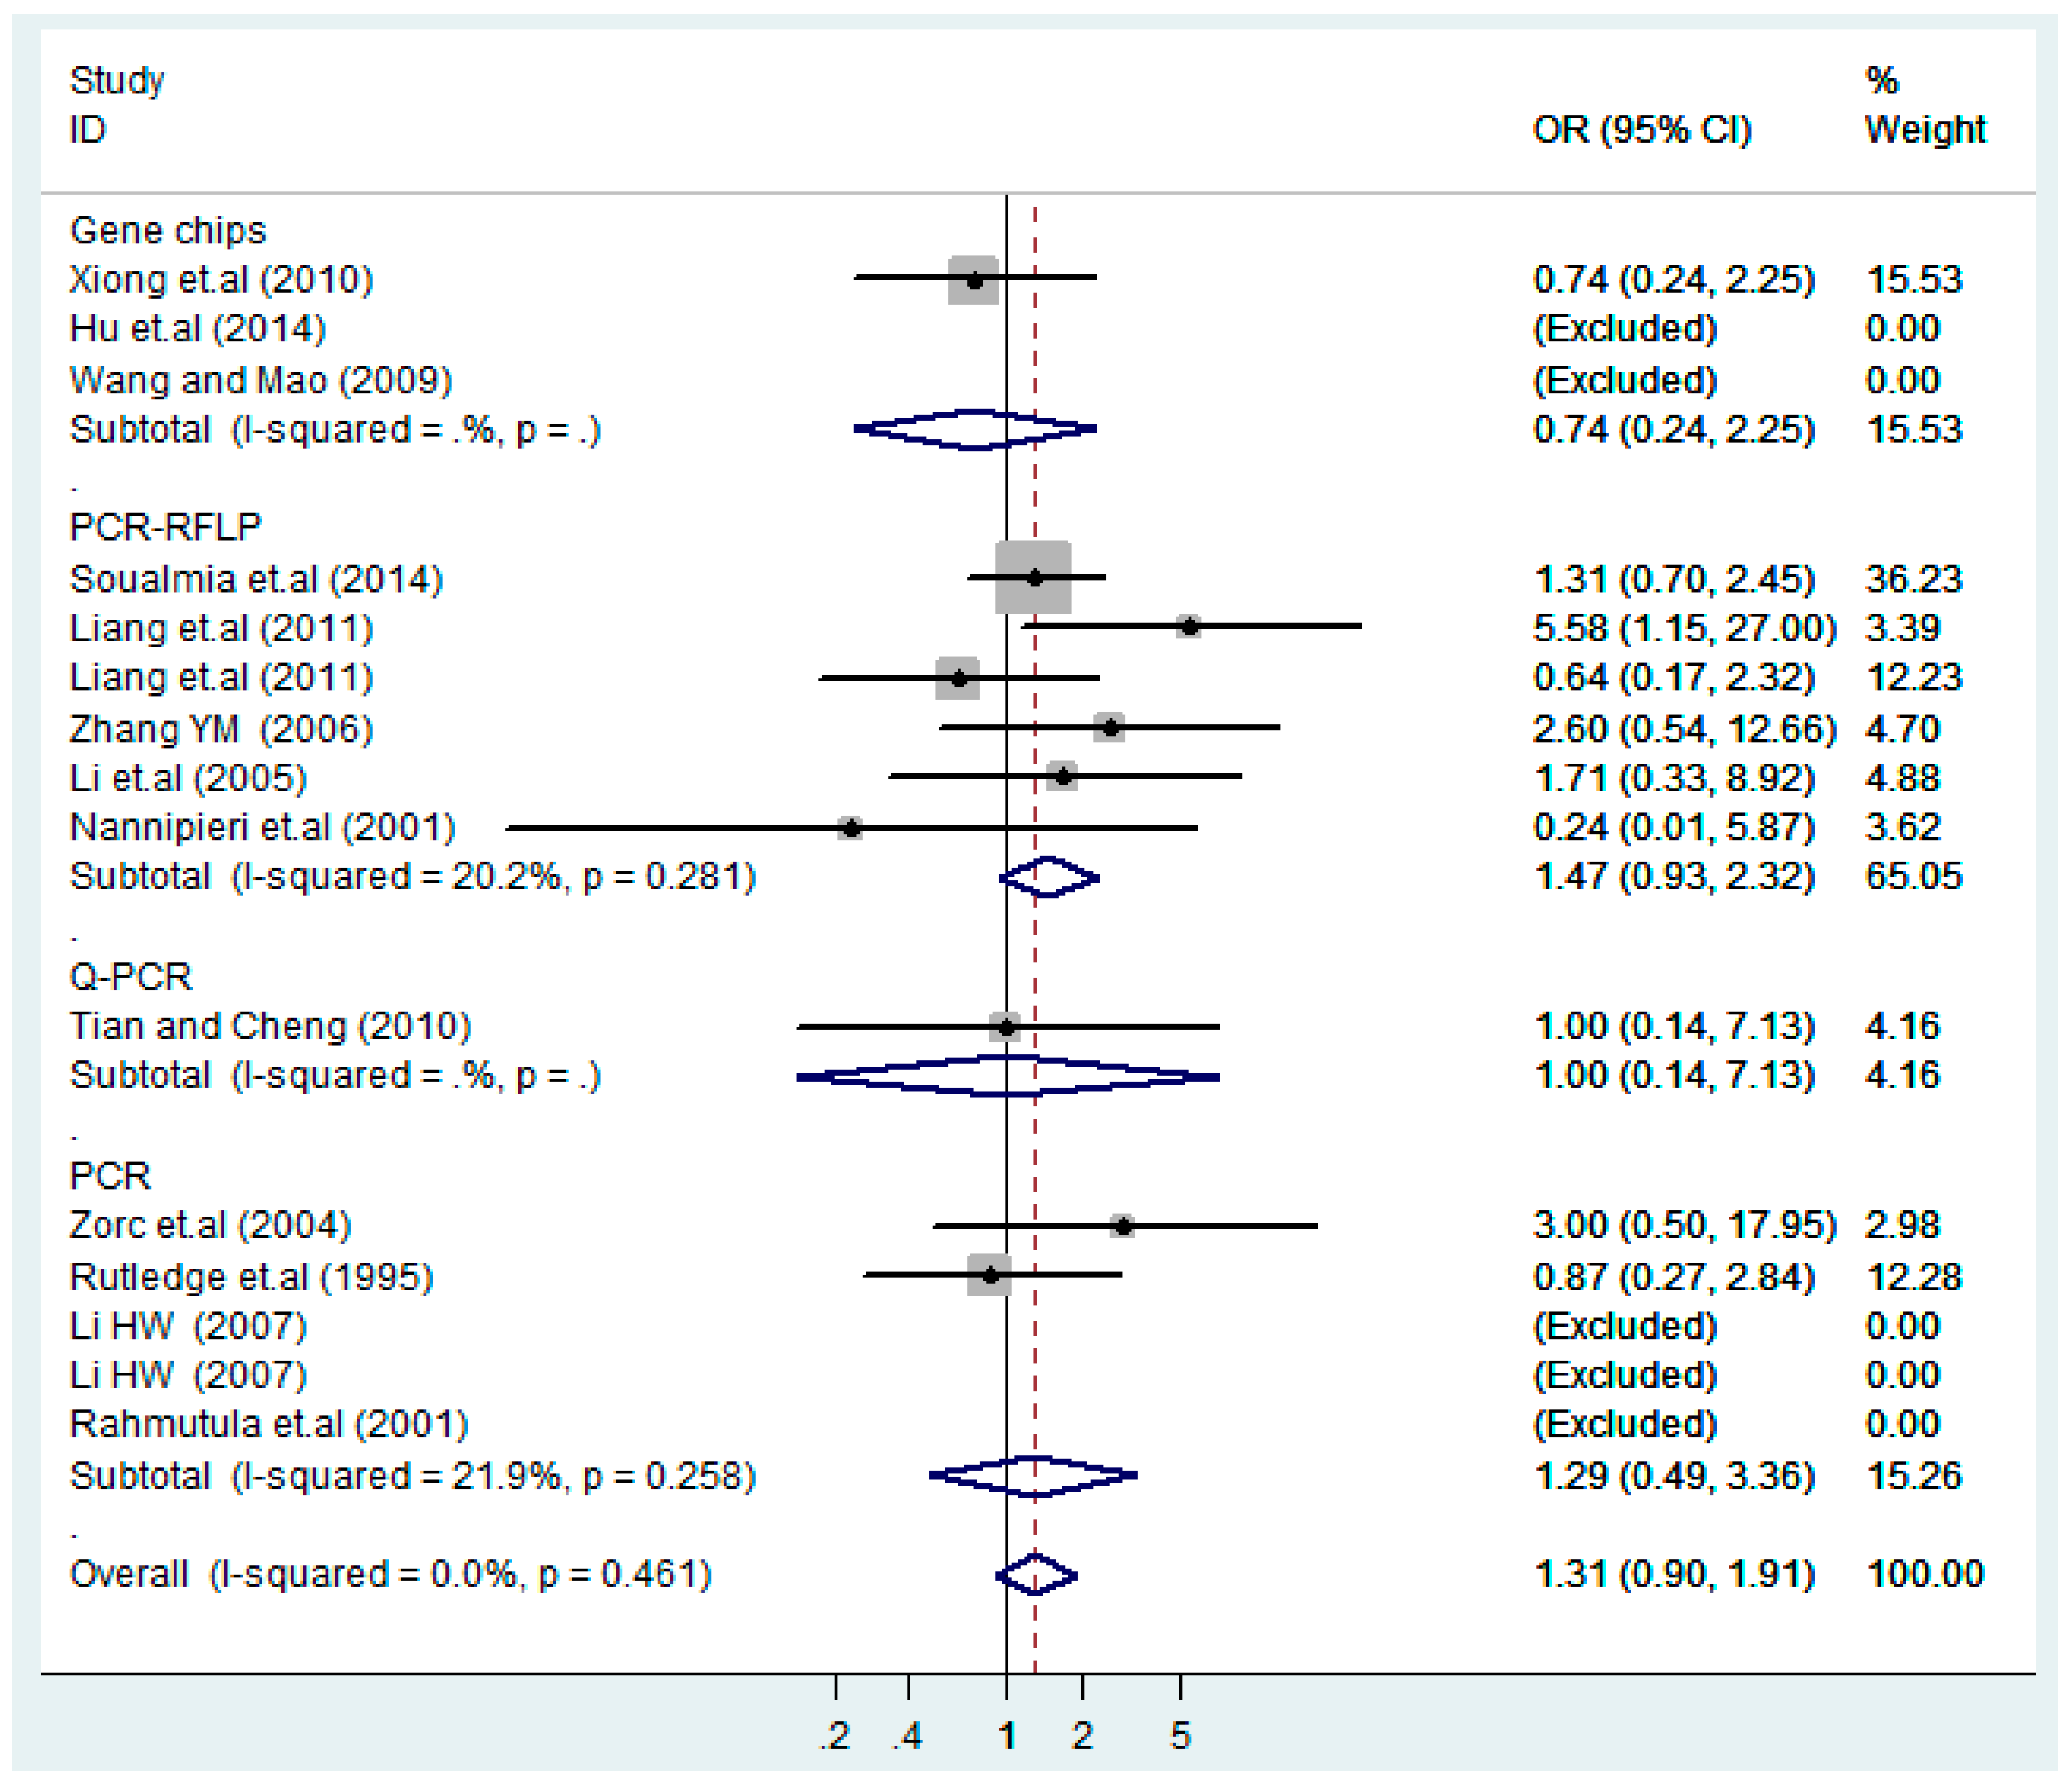
Ijerph 13 00458 g020
Figure 21. Subgroups of genotyping methods of T2238C co-dominant model-2 (CC vs. TT).
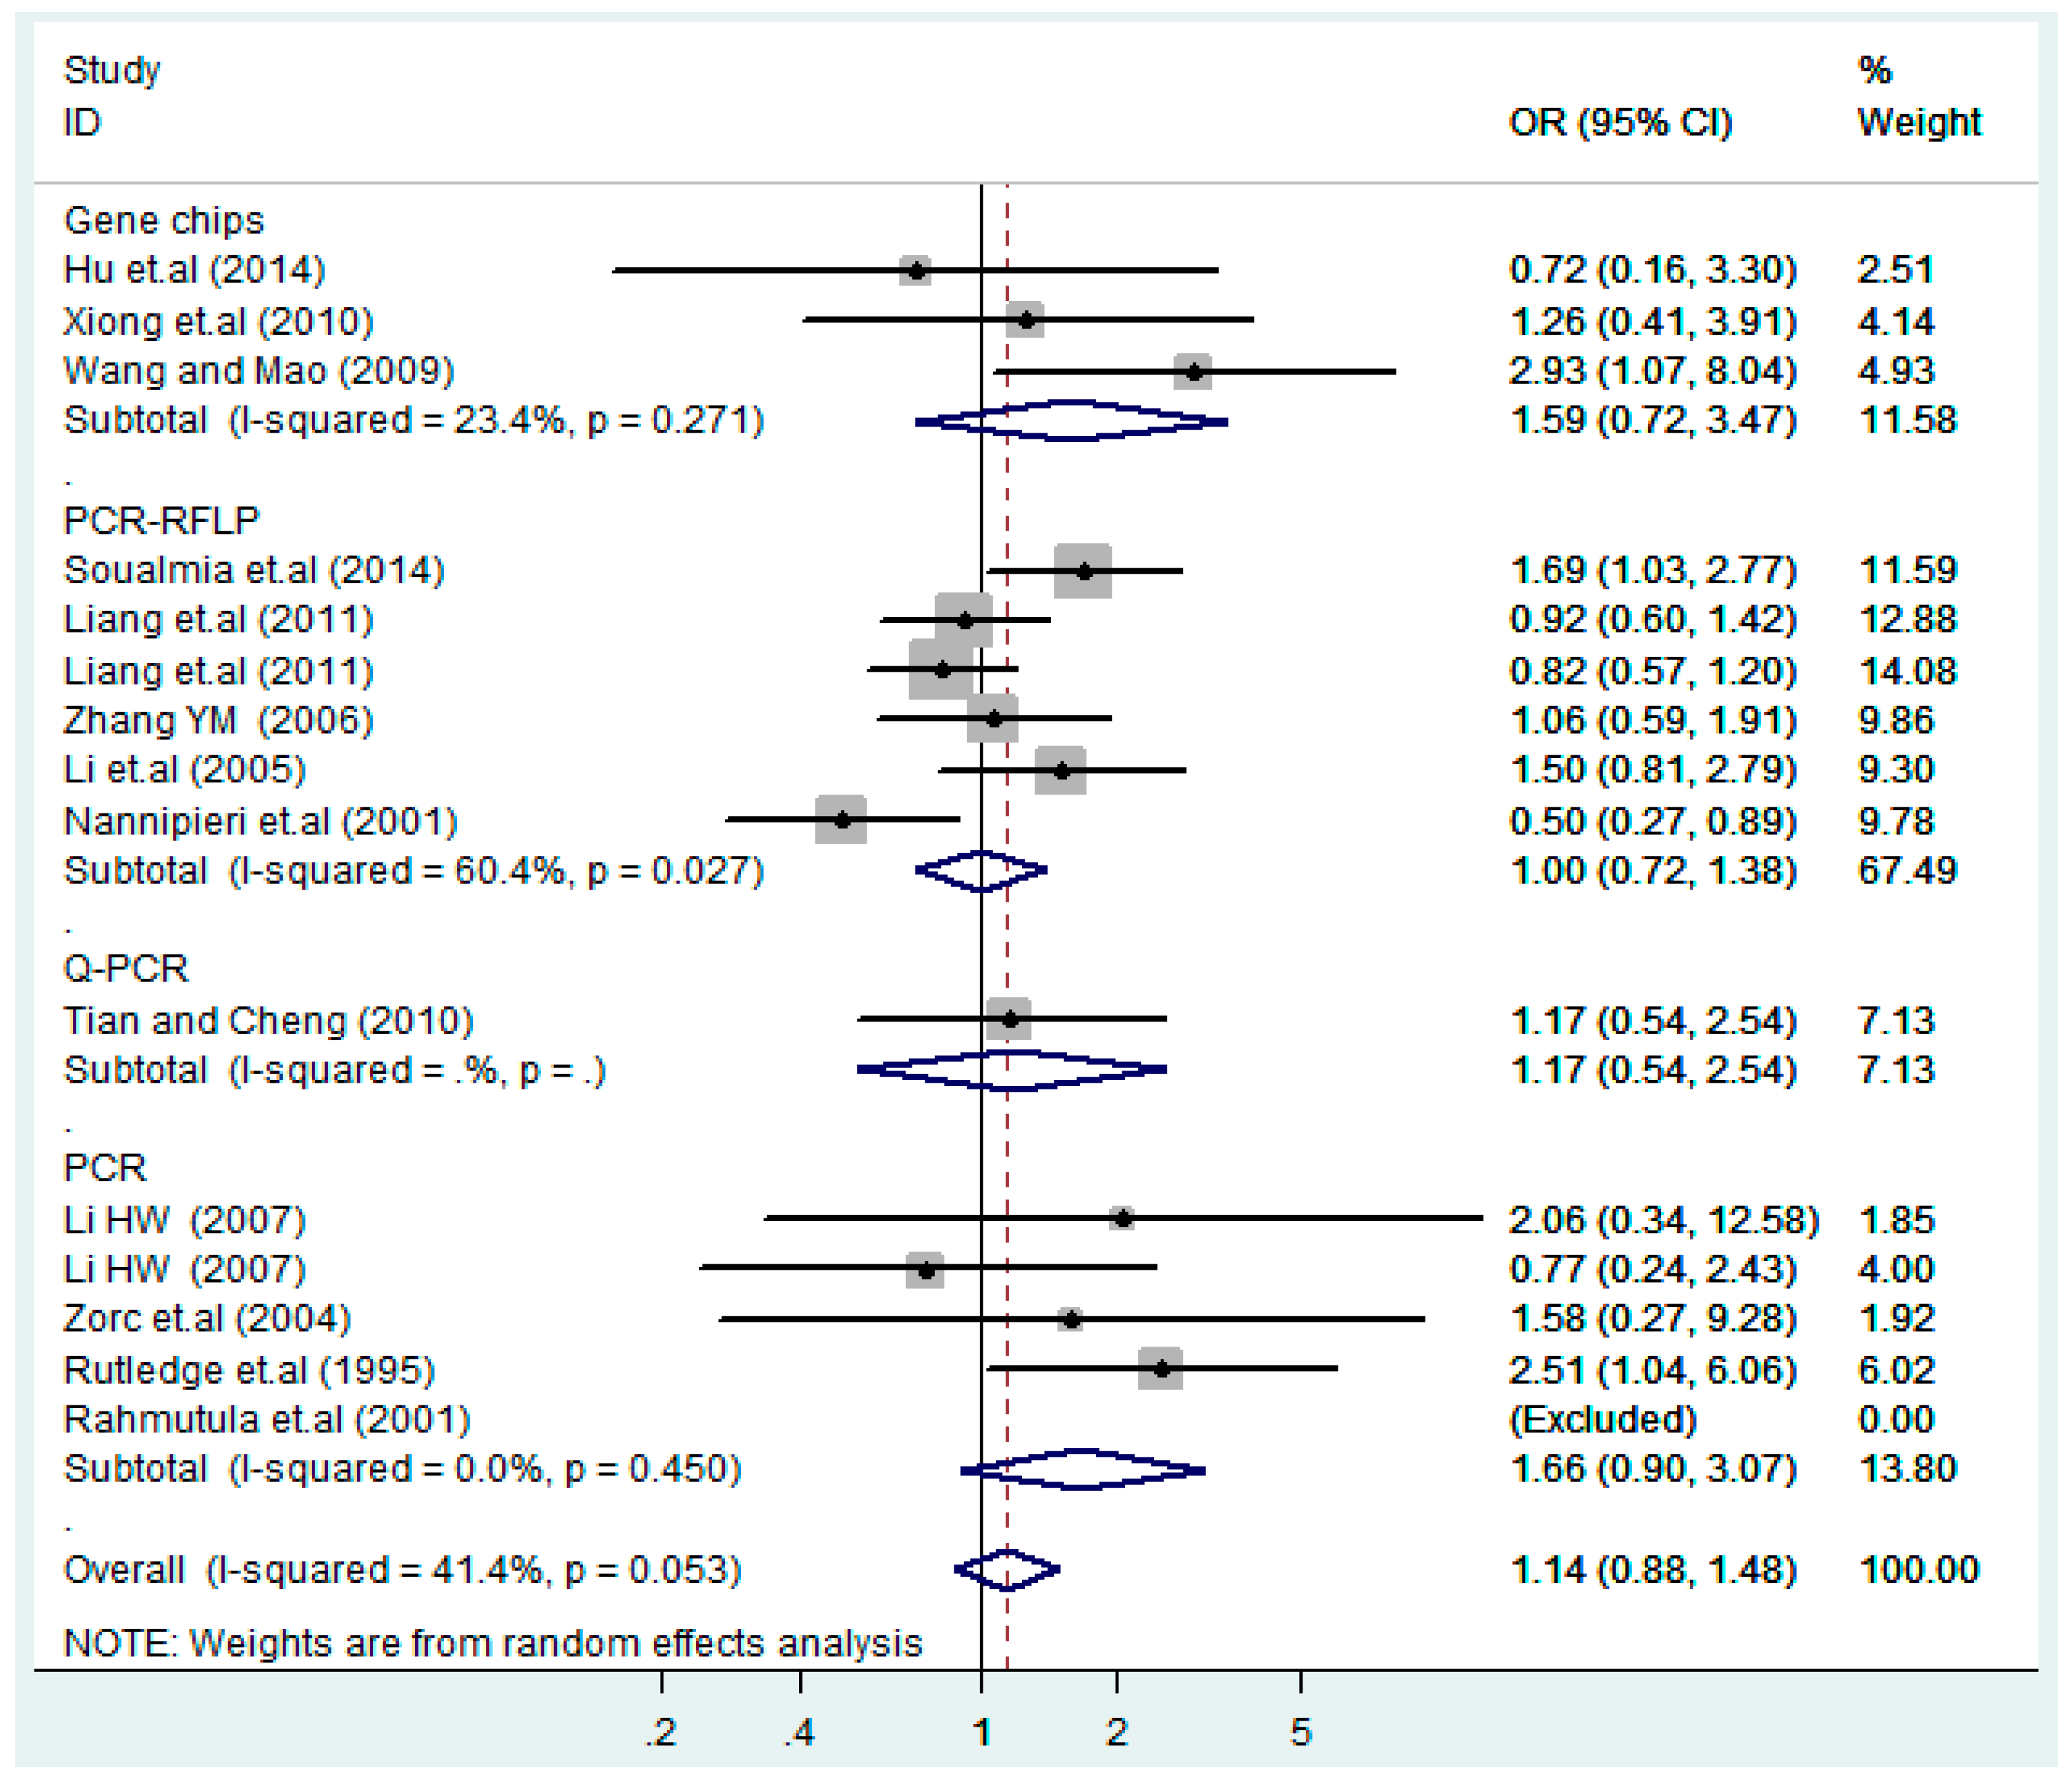
Ijerph 13 00458 g021
Figure 22. Subgroups of genotyping methods of T2238C dominant model (CC + TC) vs. TT.
Ijerph 13 00458 g022
Figure 23. Subgroups of genotyping of T2238C recessive model CC vs. (TT + TC).
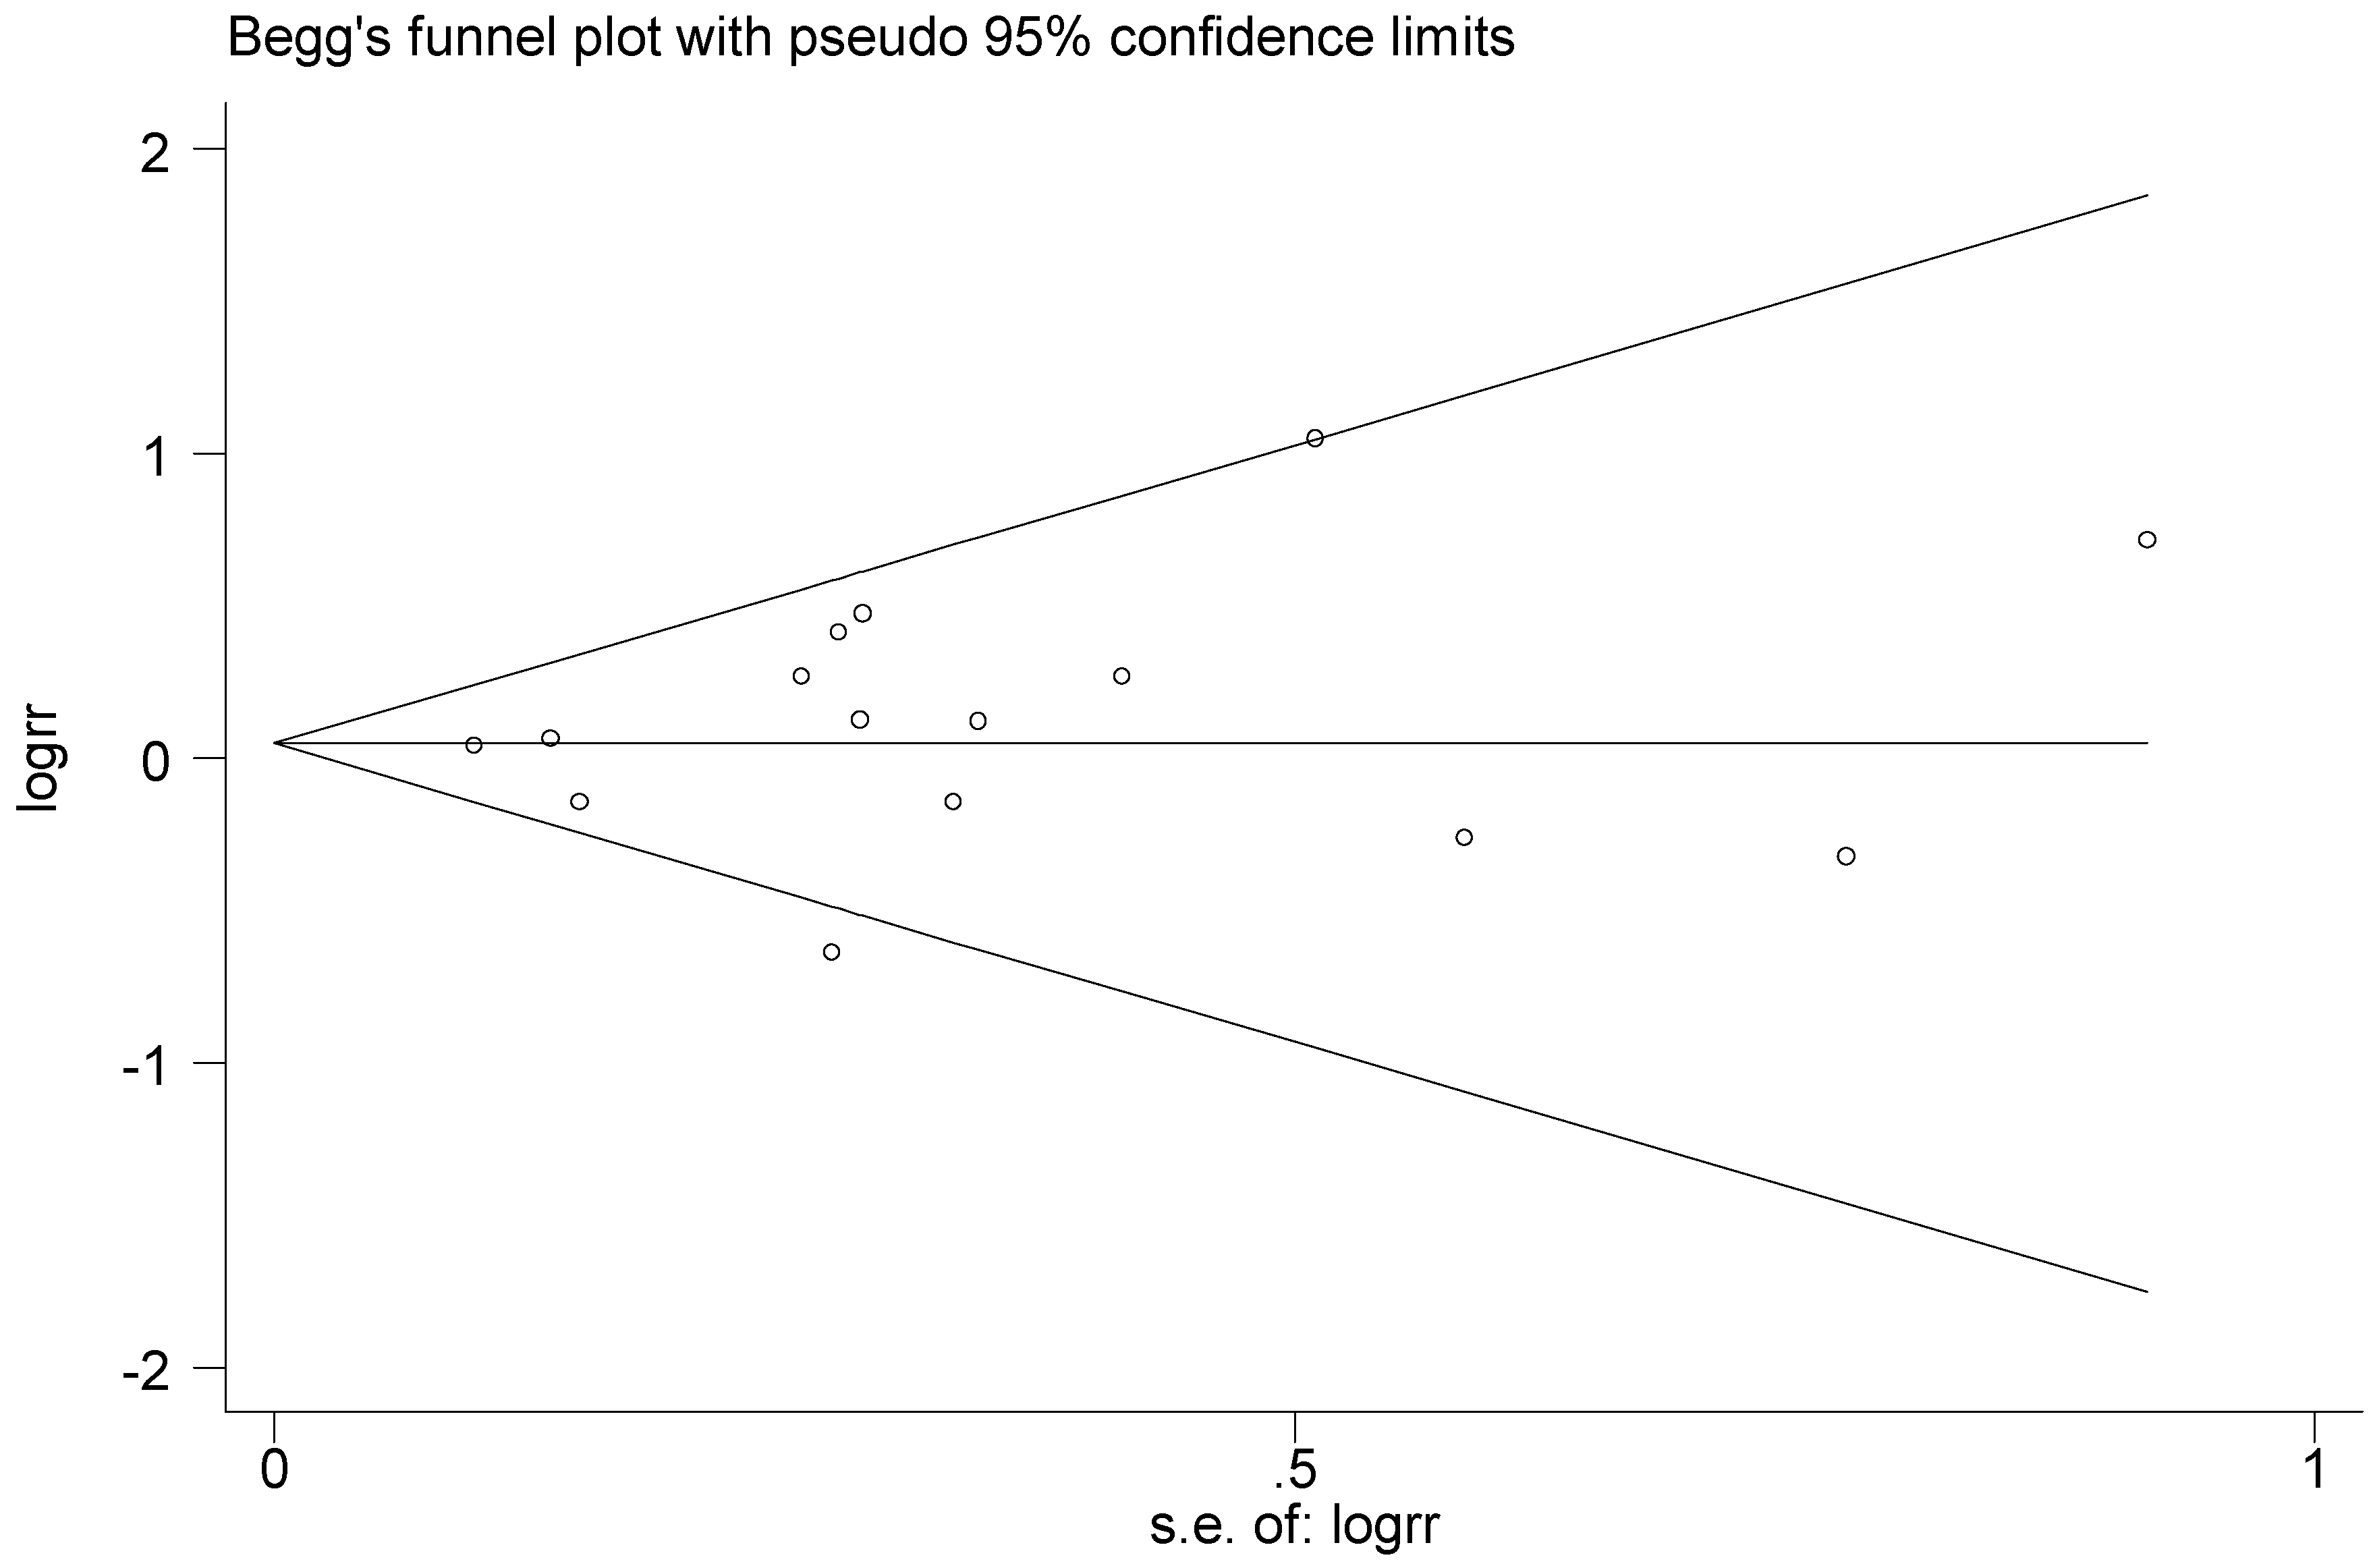
Ijerph 13 00458 g023
Figure 24. Begg’s funnel plot of T2238C polymorphism for the publication bias test (C vs. T).
Ijerph 13 00458 g024
Figure 25. Forest plot of sensitivity analysis of overall population of T2238C polymorphism and EH (C vs. T).
Ijerph 13 00458 g025
Table 1. Characteristics of studies included in the meta-analysis.
AuthorYearLocusSourceCountryEthnicityNumberGenotyping MethodsQuality Score
T2238CCaseControlCaseControl
Hu et al. [17]2014 H-BH-BChinaAsian (Han)10097Gene chips6
Soualmia et al. [14]2014 H-BP-BTunisiaWhite (Tunisian)384453PCR-RFLP7
Liang et al. [20]2011 P-BP-BChinaAsian (Han)205260PCR-RFLP6
Liang et al. [20]2011 P-BP-BChinaAsian (Kazakh)218232PCR-RFLP6
Xiong et al. [21]2010 H-BH-BChinaAsian (Han)81120Gene chips5
Tian and Cheng [22]2010 H-BP-BChinaAsian (Han)976976Q-PCR6
Wang and Mao [23]2009 H-BH-BChinaAsian (Han)238184Gene chips4
Li [24]2007 P-BP-BChinaAsian (Yi)99134PCR5
Li [24]2007 P-BP-BChinaAsian (Hani)172133PCR5
Zhang YM [25]2006 P-BP-BChinaAsian (Kazakh)314229PCR-RFLP6
Li et.al. [26]2005 P-BP-BChinaAsian (Kazakh)313205PCR-RFLP6
Zorc et.al. [27]2004 H-BH-BSloveniaCaucasian5857PCR6
Nannipieri et.al. [28]2001 P-BP-BEuropeansWhite121105PCR-RFLP6
Rahmutula et.al. [29]2001 H-BH-BJapanAsian233213PCR3
Rutledge et.al. [30]1995 H-BP-BAmericanBlack6044PCR6
G1837Acasecontrol casecontrol
Li [24]2007 P-BP-BChinaAsian (Yi)99134PCR5
Li [24]2007 P-BP-BChinaAsian (Hani)172133PCR5
Zhang et.al. [31]2005 P-BP-BChinaAsian (Kazakh)287190PCR-RFLP5
Rahmutula et.al. [29]2001 H-BH-BJapanAsian233213PCR3
Bernard et.al. [32]1999 H-BP-BChinaAsian108109PCR6
Rutledge et.al. [30]1995 H-BP-BAmericanBlack6044PCR6
T1766Ccasecontrol casecontrol
He [33]2007 P-BP-BChinaAsian (Kazakh)199198PCR-RFLP5
He et.al. [34]2007 P-BP-BChinaAsian (Kazakh)246244PCR-RFLP5
Benedicta et.al. [35]2002 H-BP-BAfricanBlack289278PCR-RFLP6
Kato et.al. [36]2000 H-BH-BJapanAsian255225PCR5
P-B: population-based; H-B: hospital-based.
Table 2. The allele gene and genotype frequency of ANP polymorphisms in the meta-analysis.
AuthorYearLocusAllele NumberGene NumberHWE
CaseControlCaseControl
T2238CTCTCTTTCCCTTTCCC
Hu et.al. [17]2014 1973190497309340YES
Soualmia et.al. [14]2014 37239644845827318395034855NO
Liang et.al. [20]2011 246164320200501469621962YES
Liang et.al. [20]2011 32211432913510810641031236YES
Xiong et.al. [21]2010 14616213277065103710YES
Tian and Cheng [22]2010 193418193616960142962122YES
Wang and Mao [23]2009 45818363522018017950YES
Li [24]2007 19532662963013220YES
Li [24]2007 338626061666012760YES
Zhang YM [25] 2006 5844443325277307206212YES
Li et.al. [26]2005 5814539020273355187162YES
Zorc et.al. [27]2004 308641732263043320YES
Nannipieri et.al. [28]2001 21626171399526067371YES
Rahmutula et.al. [29]2001 1145513413011222013200YES
Rutledge et.al. [30]1995 705054341736719169YES
G1837AGAGAGGGAAAGGGAAA
Li [24]2007 178202452379200113192YES
Li [24]2007 2964823333127423101311YES
Zhang et.al. [31]2005 5146034634228581158302YES
Rahmutula et.al. [29]2001 4242447379336194145167YES
Bernard et.al. [32]1999 19125195238619387211YES
Rutledge et.al. [30]1995 9030853303004130YES
T1766CTCTCTTTCCCTTTCCC
He [33]2007 30494291105108883951012YES
He et.al. [34]2007 290202267221491925292096YES
Benedicta et.al. [35]2002 33324531124587159438514152YES
Kato et.al. [36]2000 50644401025140215100YES
Table 3. Meta-analysis of T2238C polymorphism and EH.
Stratification FactorsNo.Additive Model (C vs. T)pCo-Dominant Model-1 (TC vs. TT)pCo-Dominant Model-2 (CC vs. TT)pDominant Model (CC + TC) vs. TTpRecessive Model CC vs. (TT + TC)p
OR(95%CI) aOR(95%CI) aOR(95%CI) aOR(95%CI) aOR(95%CI) a
Overall151.1(0.94–1.2)0.381.1(0.88–1.5)0.321.3(0.90–1.9)0.161.1(0.88–1.4)0.351.1(0.83–1.4)0.55
Ethnicity
Asian111.1(0.92–1.3)0.381.0(0.84–1.3)0.751.4(0.81–2.4)0.231.1(0.86–1.3)0.621.3(0.81–2.2)0.26
White30.96(0.58–1.6)0.891.0(0.38–2.7)0.961.3 (0.76–2.4)0.321.1(0.39–2.9)0.911.1(0.51–2.4)0.80
Black11.1(0.65–2.0)0.662.5(1.0–6.1)0.0400.87(0.27–2.8)0.821.9(0.85–4.4)0.120.51(0.18–1.5)0.23
Source of controls
HB51.4(0.97–1.9)0.0731.6(0.87–3.1)0.131.1(0.45–2.7)0.831.4(0.73–2.8)0.301.4(0.85–2.3)0.19
PB101.0(0.90–1.1)0.771.1(0.82–1.4)0.581.4(0.90–2.1)0.151.1(0.83–1.4)0.570.97(0.70–1.4)0.86
Genotyping methods
Gene chips31.2(0.53–2.9)0.621.6(0.72–3.5)0.250.74(0.24–2.2)0.591.3(0.58–3.1)0.500.72(0.24–2.2)0.57
PCR-RFLP61.0(0.82–1.2)1.01.0(0.72–1.4)0.991.5(0.93–2.3)0.0961.0(0.73–1.4)0.911.3(0.64–2.6)0.48
Q-PCR11.1(0.57–2.2)0.731.2(0.54–2.5)0.691.0(0.14–7.1)1.01.1(0.56–2.4)0.711.0(0.14–7.1)1.0
PCR51.3(0.93–1.8)0.131.7(0.90–3.1)0.101.3(0.49–3.4)0.611.5(0.85–2.8)0.151.2(0.58–2.5)0.62
a: pooled OR and relevant 95%CI; p: p value of significance test(s) of OR = 1.
Table 4. Meta-analysis of G1837A polymorphism and EH.
Gene TypeGenetic ModelOR a95%CIpI2p*Model
Overall
A vs. Gadditive model1.30.96–1.90.09054.7%0.051RE
GA vs. GGco-dominant model-11.50.83–2.60.1970.1%0.005RE
AA vs. GGco-dominant model-20.870.34–2.30.780.0%0.48FE
(AA + GA) vs. GGdominant model1.50.86–2.50.1767.5%0.009RE
AA vs. (GG + GA)recessive model1.30.85–2.00.220.0%0.53FE
Work of Rutledge removed
A vs. Gadditive model1.20.95–1.50.140.0%1.0FE
GA vs. GGco-dominant model-11.20.88–1.60.290.0%0.56FE
AA vs. GGco-dominant model-20.870.34–2.30.780.0%0.48FE
(AA + GA) vs. GGdominant model1.20.88–1.50.280.0%0.82FE
AA vs. (GG + GA)recessive model1.30.85–2.00.220.0%0.53FE
a: pooled OR and relevant 95%CI; p: p value of significance test(s) of OR = 1; p*: p value of heterogeneity; FE: fixed effect model; RE: random effect model.
Table 5. Meta-analysis of T1766C polymorphism and EH.
Gene TypeGenetic ModelOR a95%CIpI2p*Model
Overall
C vs. Tadditive model0.870.75–1.00.0630.0%0.42FE
TC vs. TTco-dominant model-10.730.49–1.10.1258.0%0.068RE
CC vs. TTco-dominant model-20.780.50–1.20.290.0%0.66FE
(CC + TC) vs. TTdominant model0.730.51–1.00.08451.1%0.11RE
CC vs. (TT + TC)recessive model0.790.53–1.20.260.0%0.77FE
Work of Benedicta removed
C vs. Tadditive model0.820.68–1.00.0528.4%0.34FE
TC vs. TTco-dominant model-10.640.47–0.860.00312.7%0.32FE
CC vs. TTco-dominant model-20.690.25–1.90.480.0%0.38FE
(CC + TC) vs. TTdominant model0.640.48–0.870.00418.1%0.30FE
CC vs. (TT + TC)recessive model0.990.37–2.70.990.0%0.59FE
a: pooled OR and relevant 95%CI; p: p value of significance test(s) of OR = 1; p*: p value of heterogeneity; FE: fixed effect model; RE: random effect model.
Table 6. 
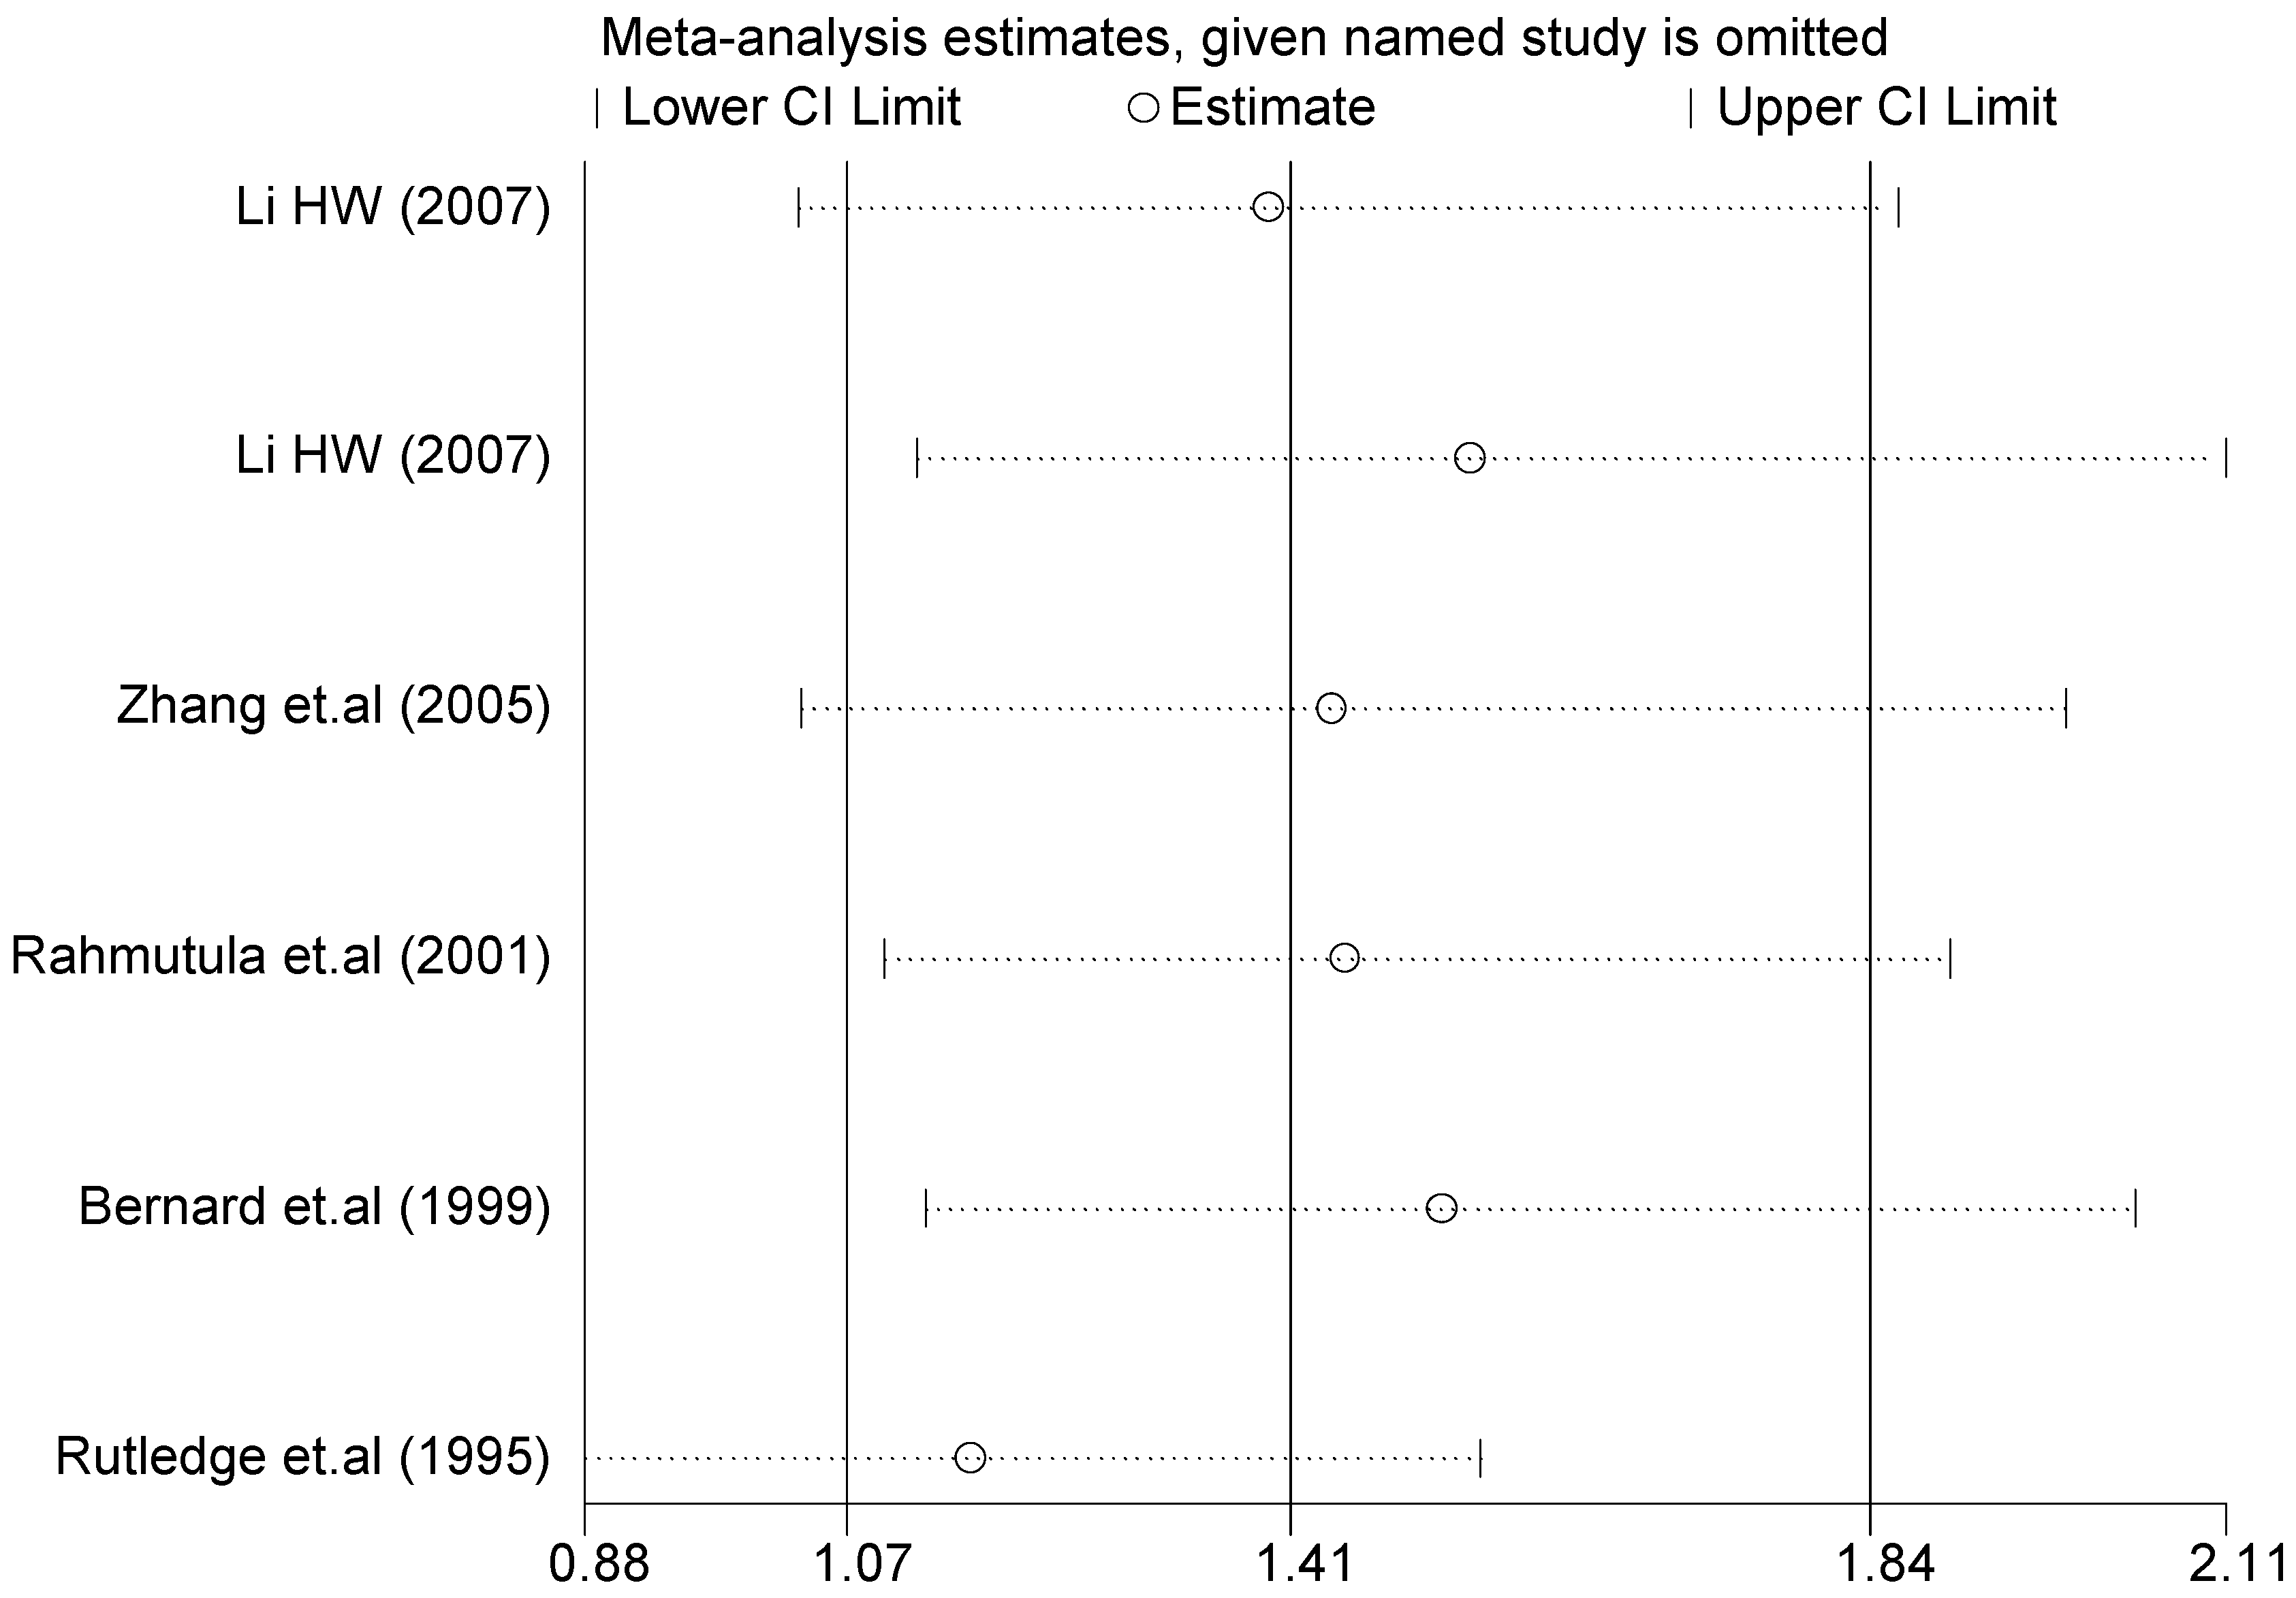
Sensitivity analysis of G1837A polymorphism and EH (GA vs. GG).
Study OmittedEstimate95%Confidence Interval
Li (2007) [24]1.41.0–1.9
Li (2007) [24]1.51.1–2.1
Zhang et.al. (2005) [31]1.41.0–2.0
Rahmutula et.al. (2001) [29]1.41.1–1.9
Bernard et.al. (1999) [32]1.51.1–2.0
Rutledge et.al. (1995) [30]1.20.88–1.6
Combined1.41.1–1.8
Table 7. Sensitivity analysis of T1766C polymorphism and EH (TC vs. TT).
Study OmittedEstimate95%Confidence Interval
He (2007) [33]0.800.60–1.1
He et.al.(2007) [34]0.880.67–1.1
Benedicta et.al.(2002) [35]0.640.47–0.86
Kato et.al.(2000) [36] 0.820.65–1.0
Combined 0.790.62–0.99

