
Association of Polymorphisms in the Atrial Natriuretic Factor Gene with the Risk of Essential Hypertension: A Systematic Review and Meta-Analysis


Abstract
:1. Introduction
2. Materials and Methods
2.1. Literature Search Strategy
2.2. Inclusion Criteria
- (1)
- studies of case-control or cohort design studies;
- (2)
- studies investigating the association between ANP polymorphism and essential hypertension;
- (3)
- full-text articles; and
- (4)
- hypertension was defined as at least three consecutive systolic blood pressure (SBP) measurements ≥ 140 mmHg or diastolic blood pressure (DBP) measurement ≥ 90 mmHg, or receiving antihypertensive pharmacotherapy treatment for at least 1 year; controls were healthy individuals in the same period.
2.3. Exclusion Criteria
- (1)
- duplicated studies;
- (2)
- reviews and literature without detailed genotype data;
- (3)
- studies with no controls;
- (4)
- unpublished articles, abstracts and comments;
- (5)
- subjects in the study were not human; and
- (6)
- SBP < 140 mmHg or DBP < 90 mmHg in cases or secondary hypertension or other serious cardiovascular disease of cases were excluded.
2.4. Data Extraction
2.5. Quality Assessment of the Included Studies
2.6. Statistical Analysis
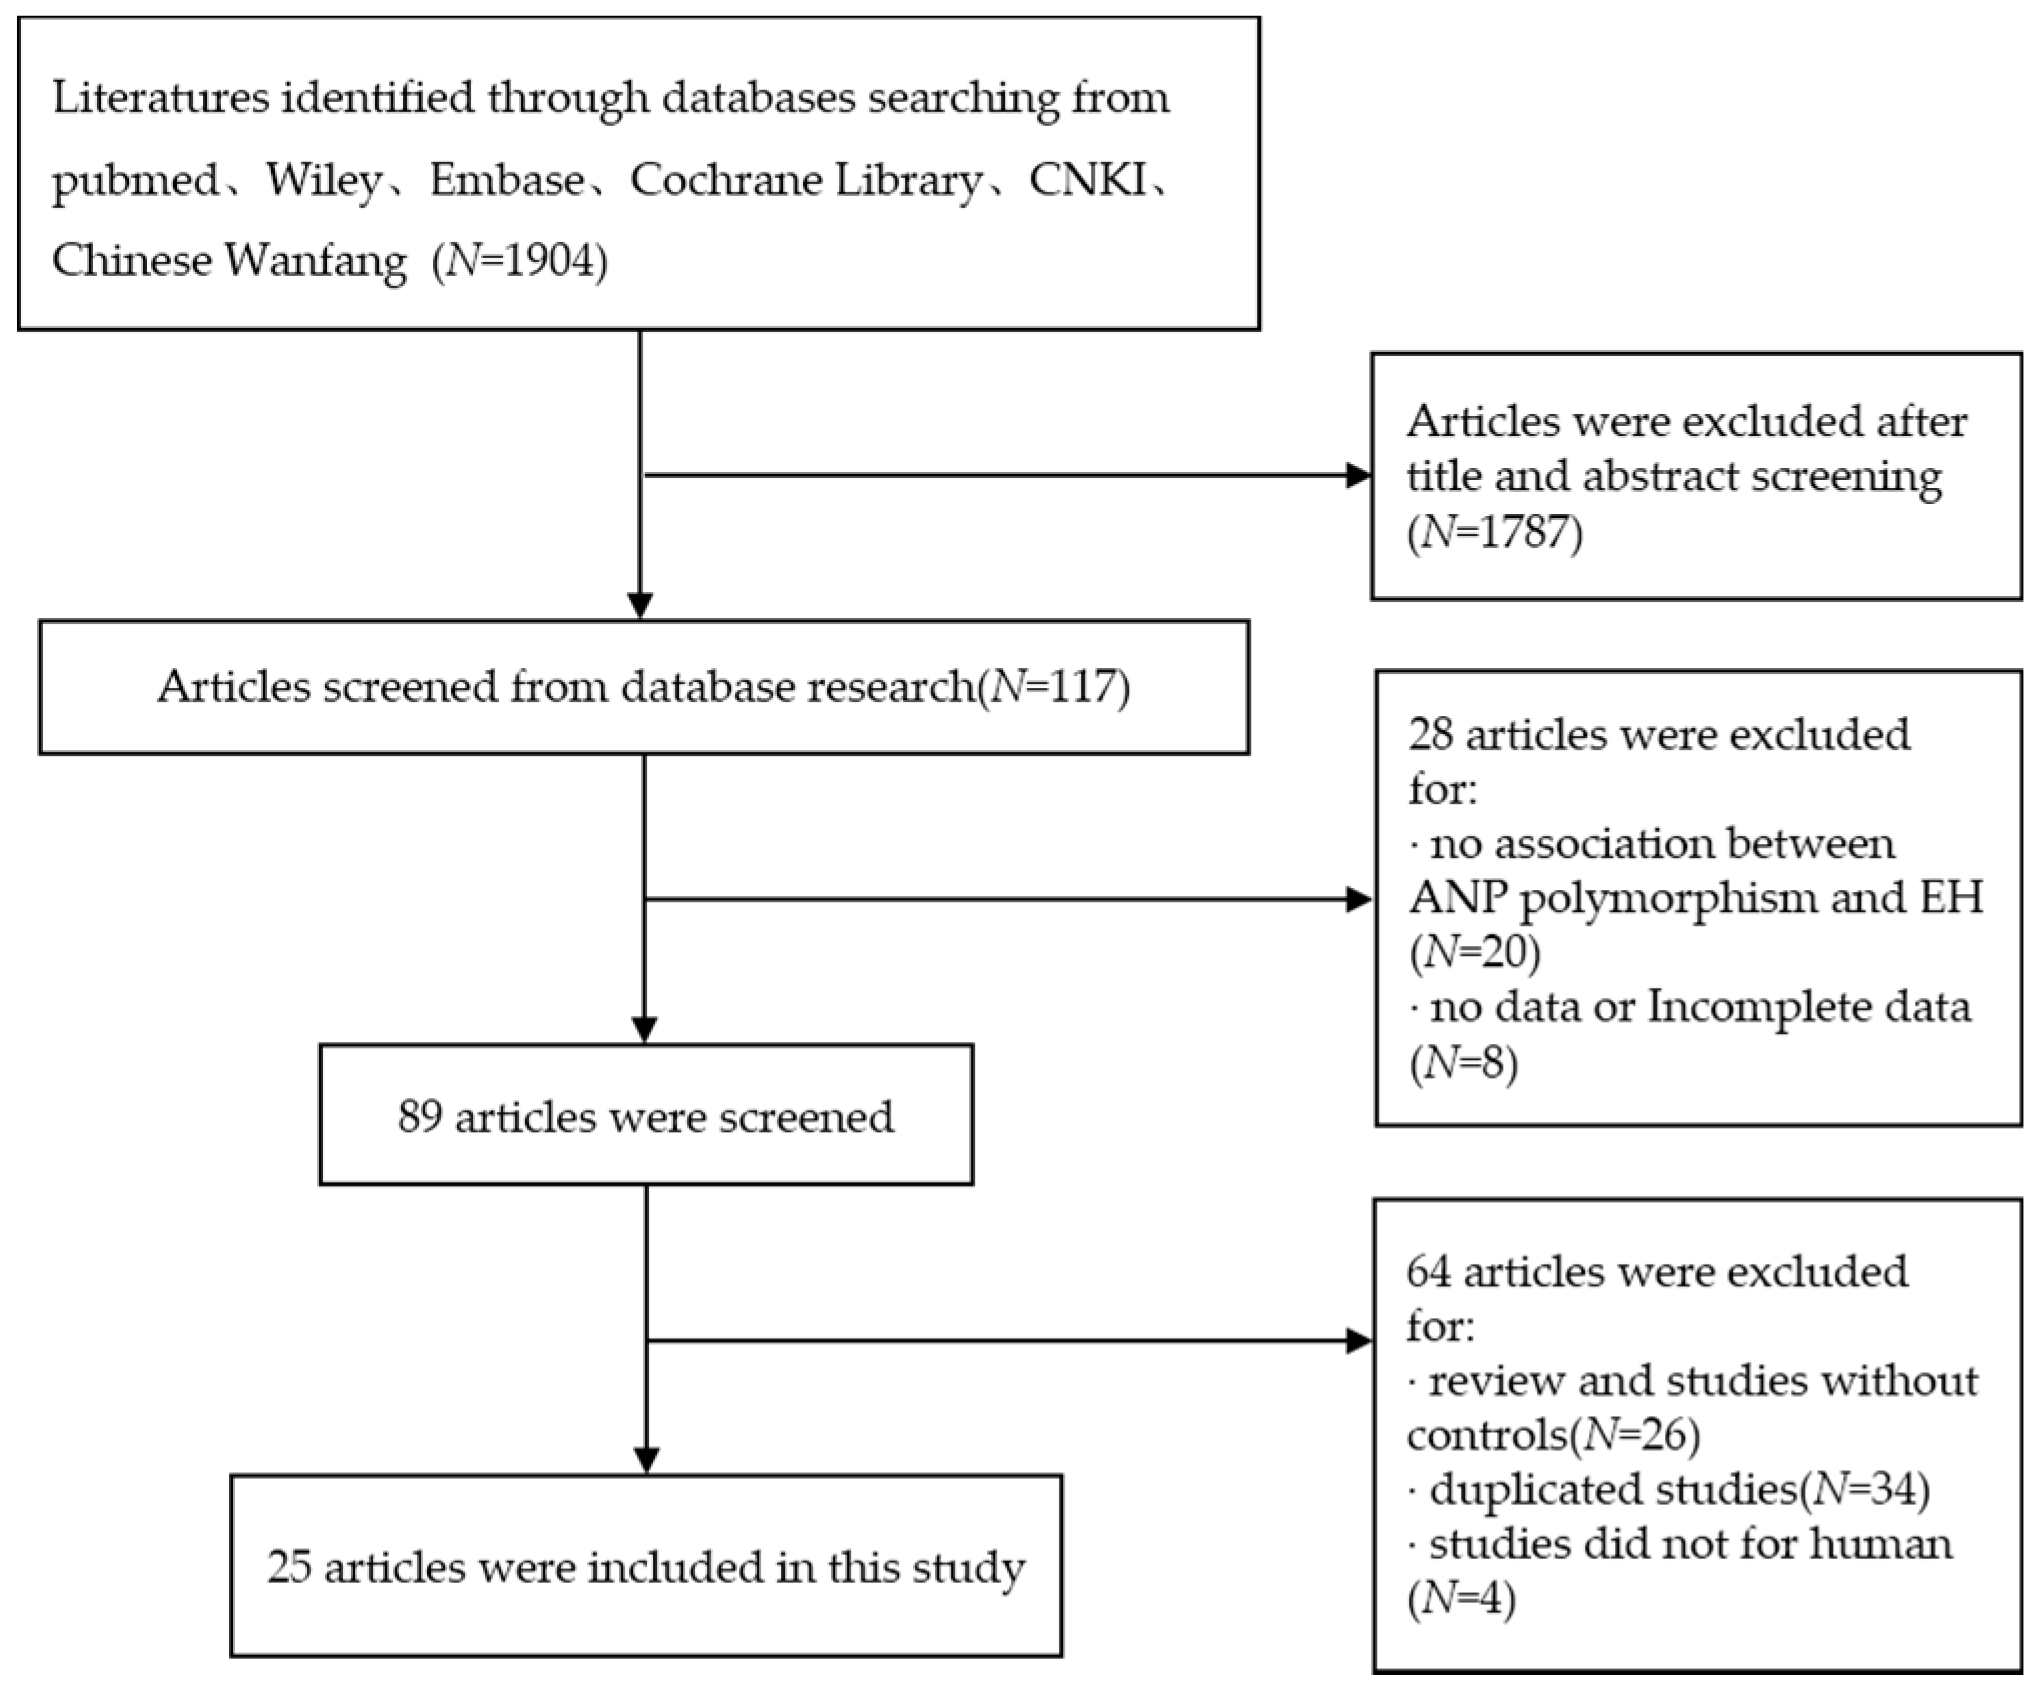
3. Results
3.1. Characteristics of the Data Included in the Meta-Analysis
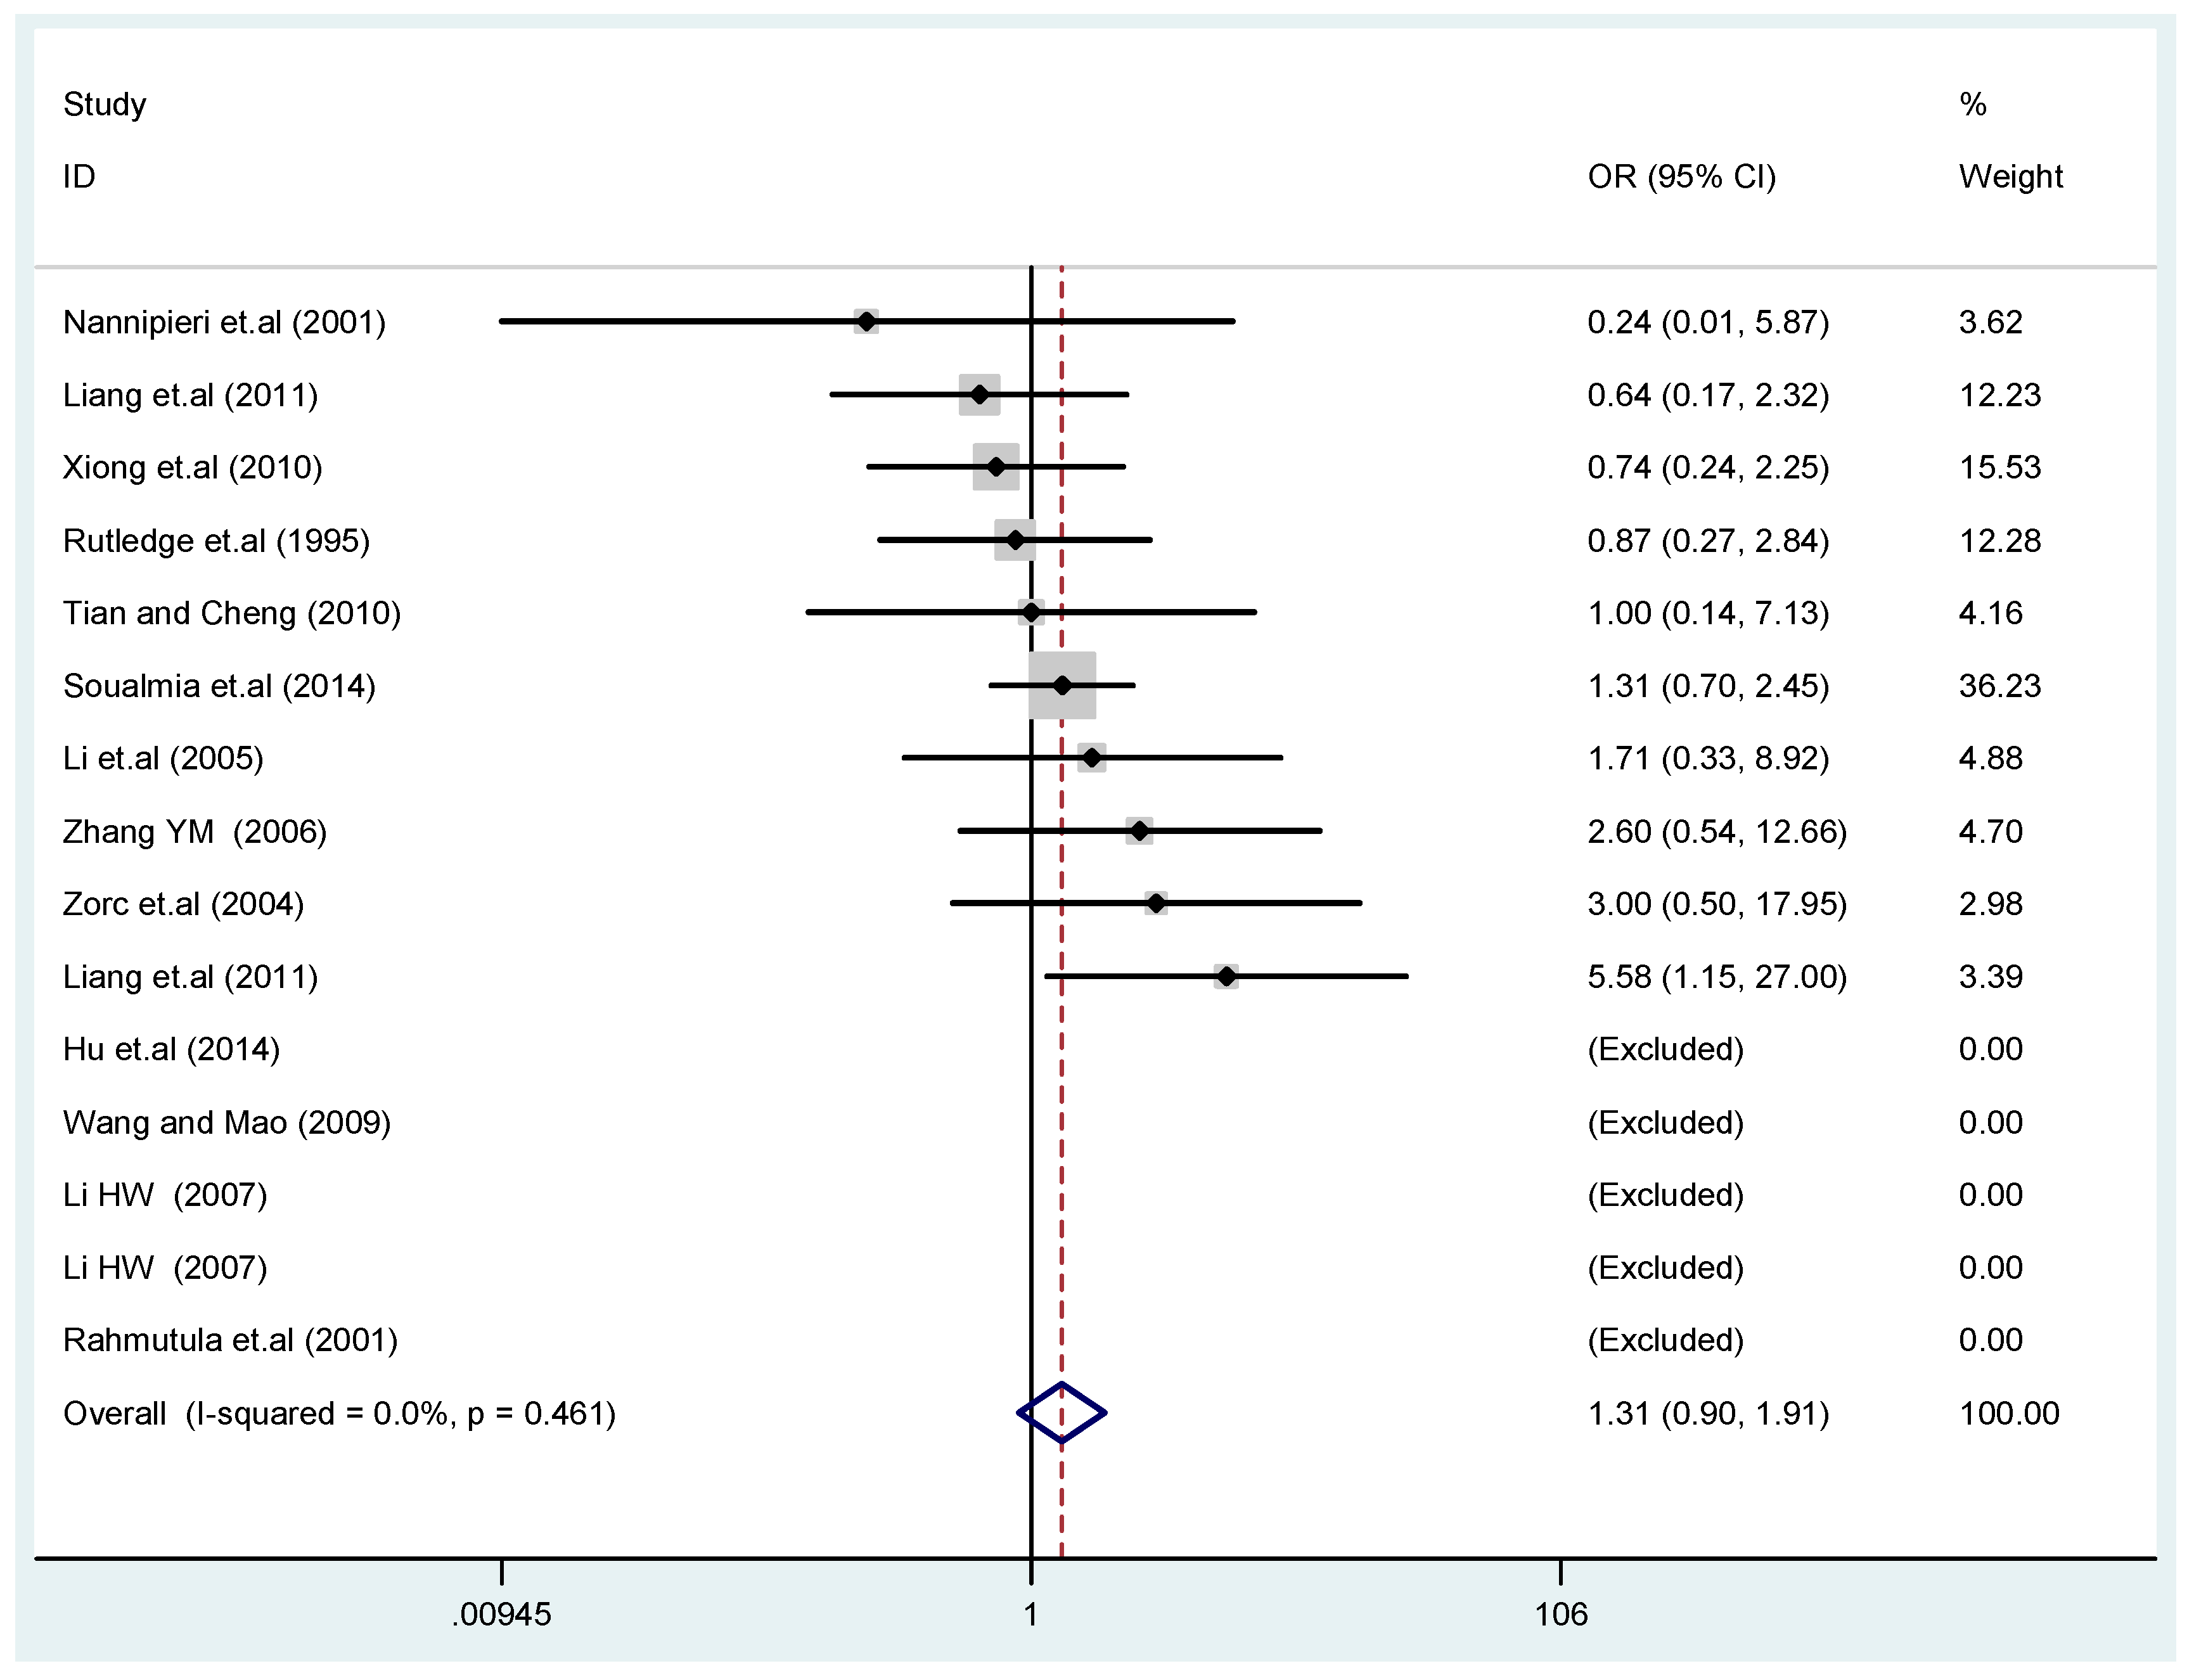
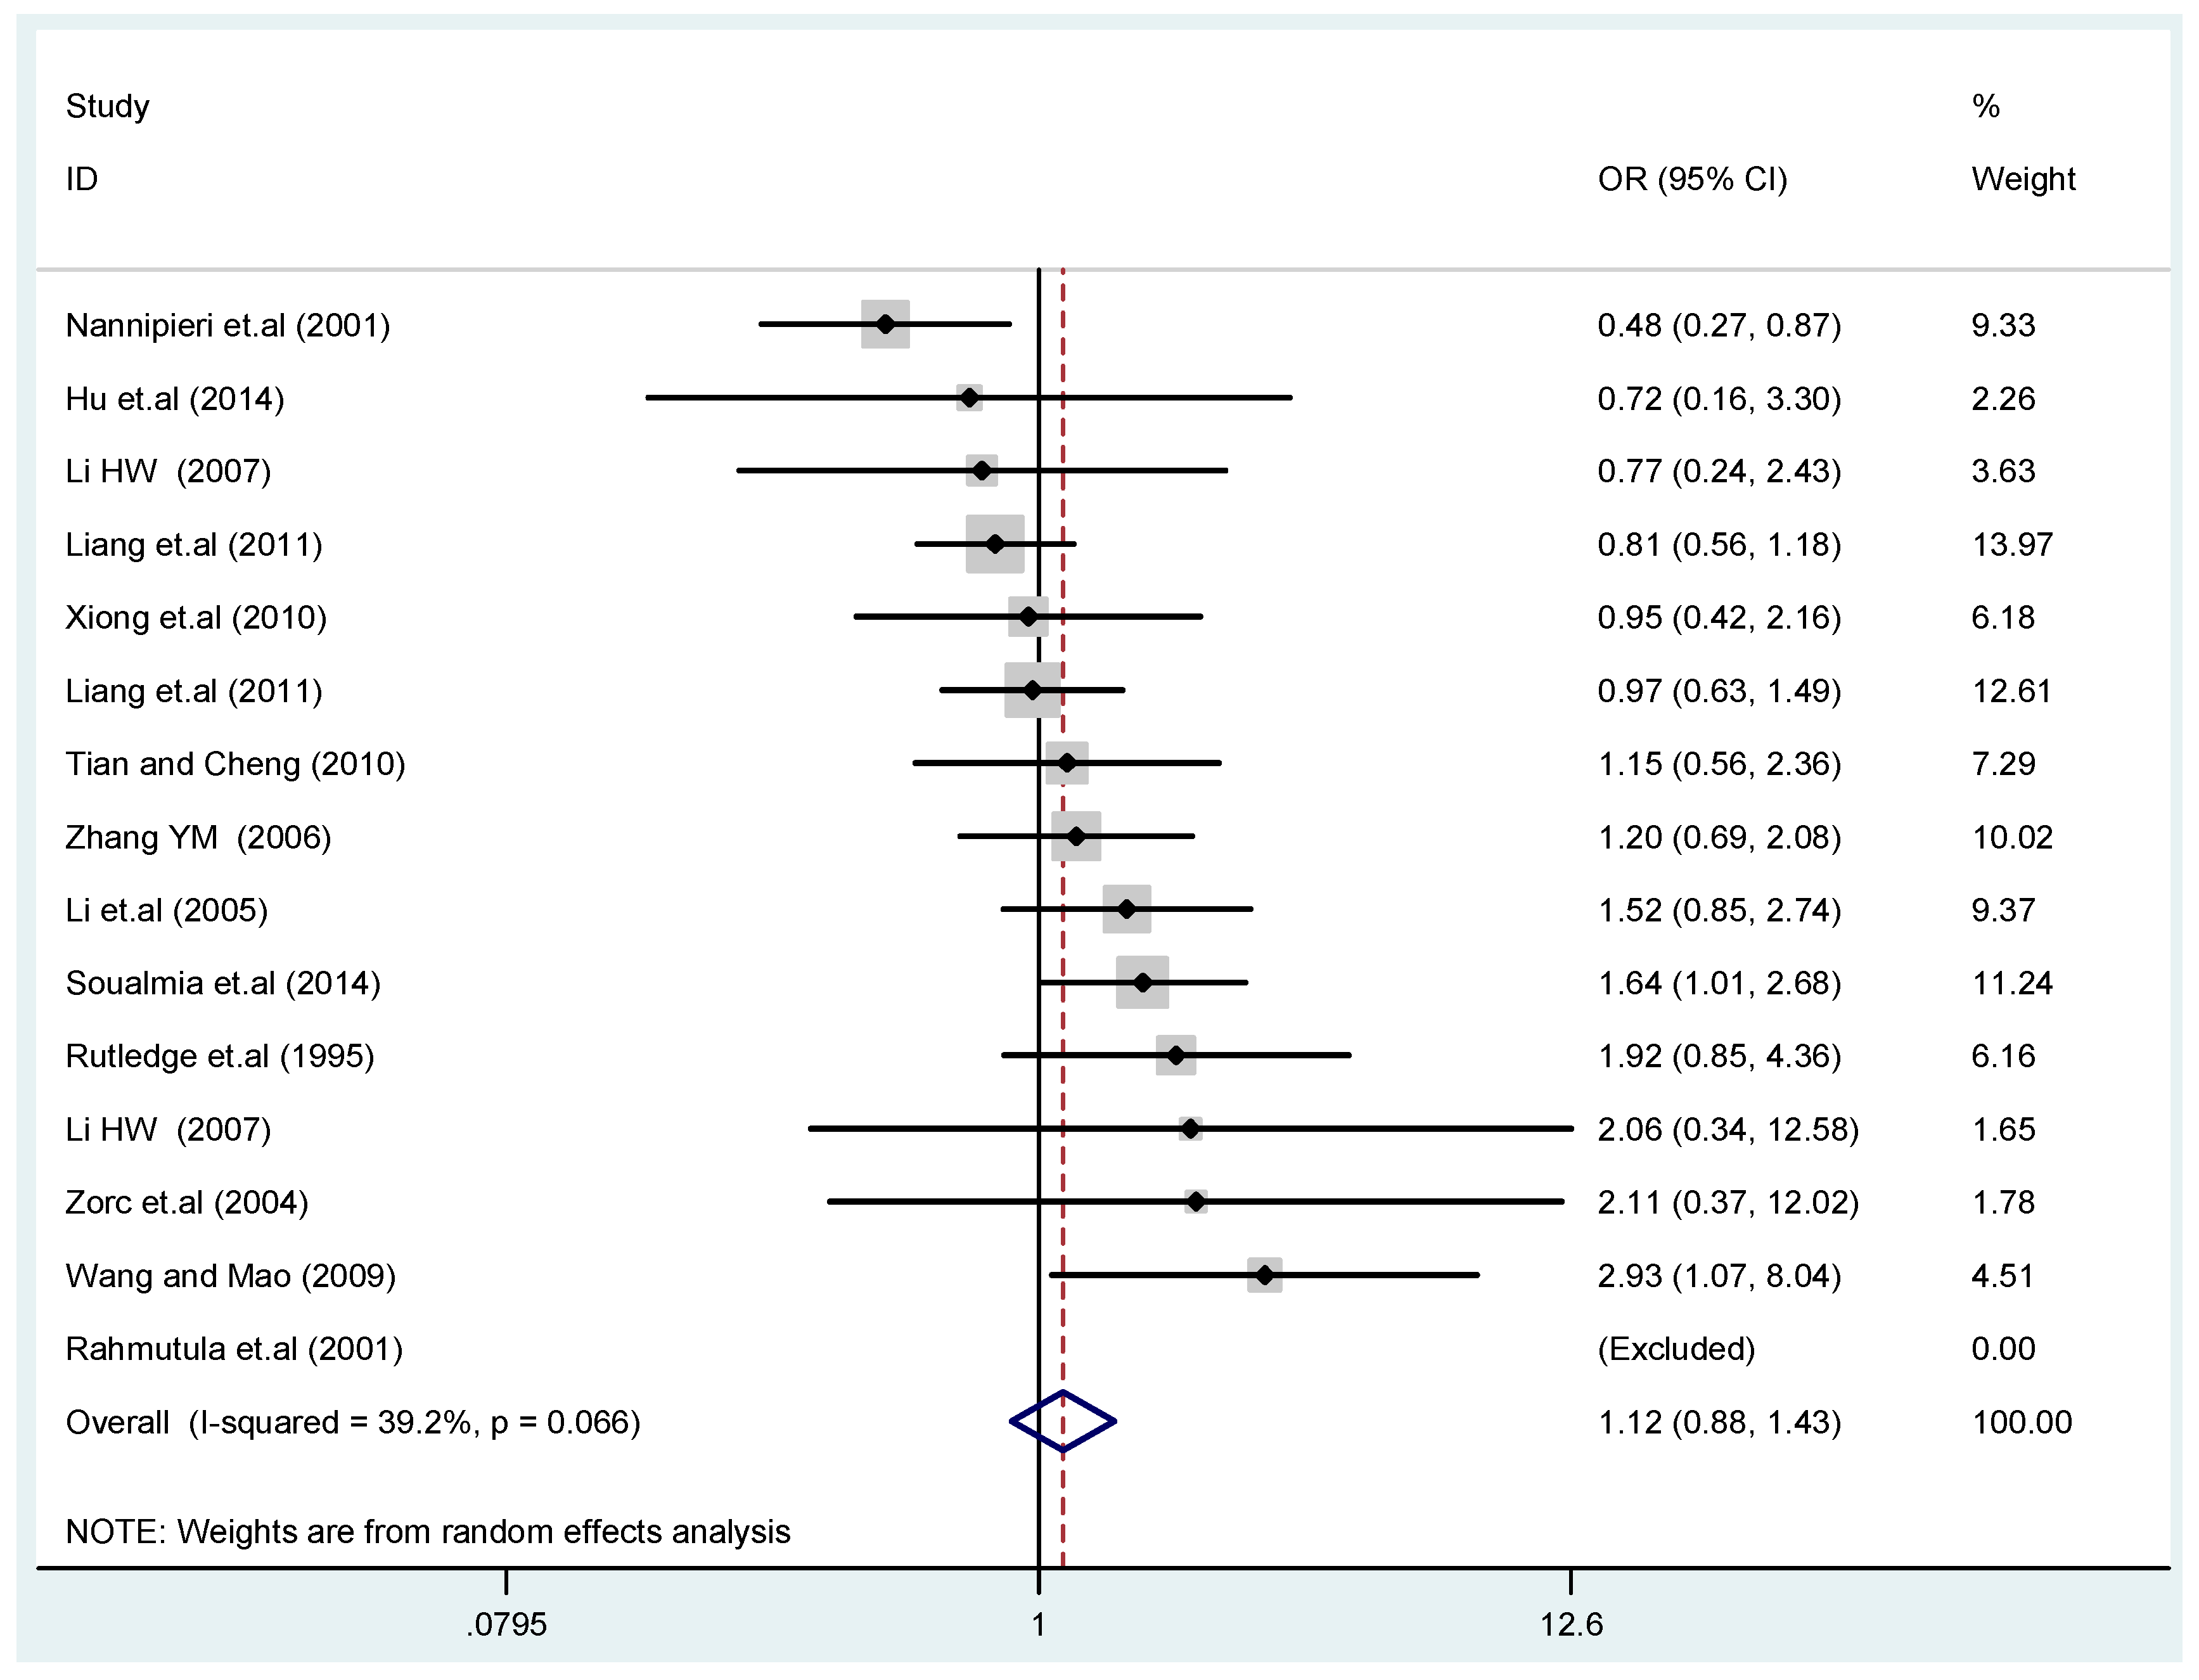
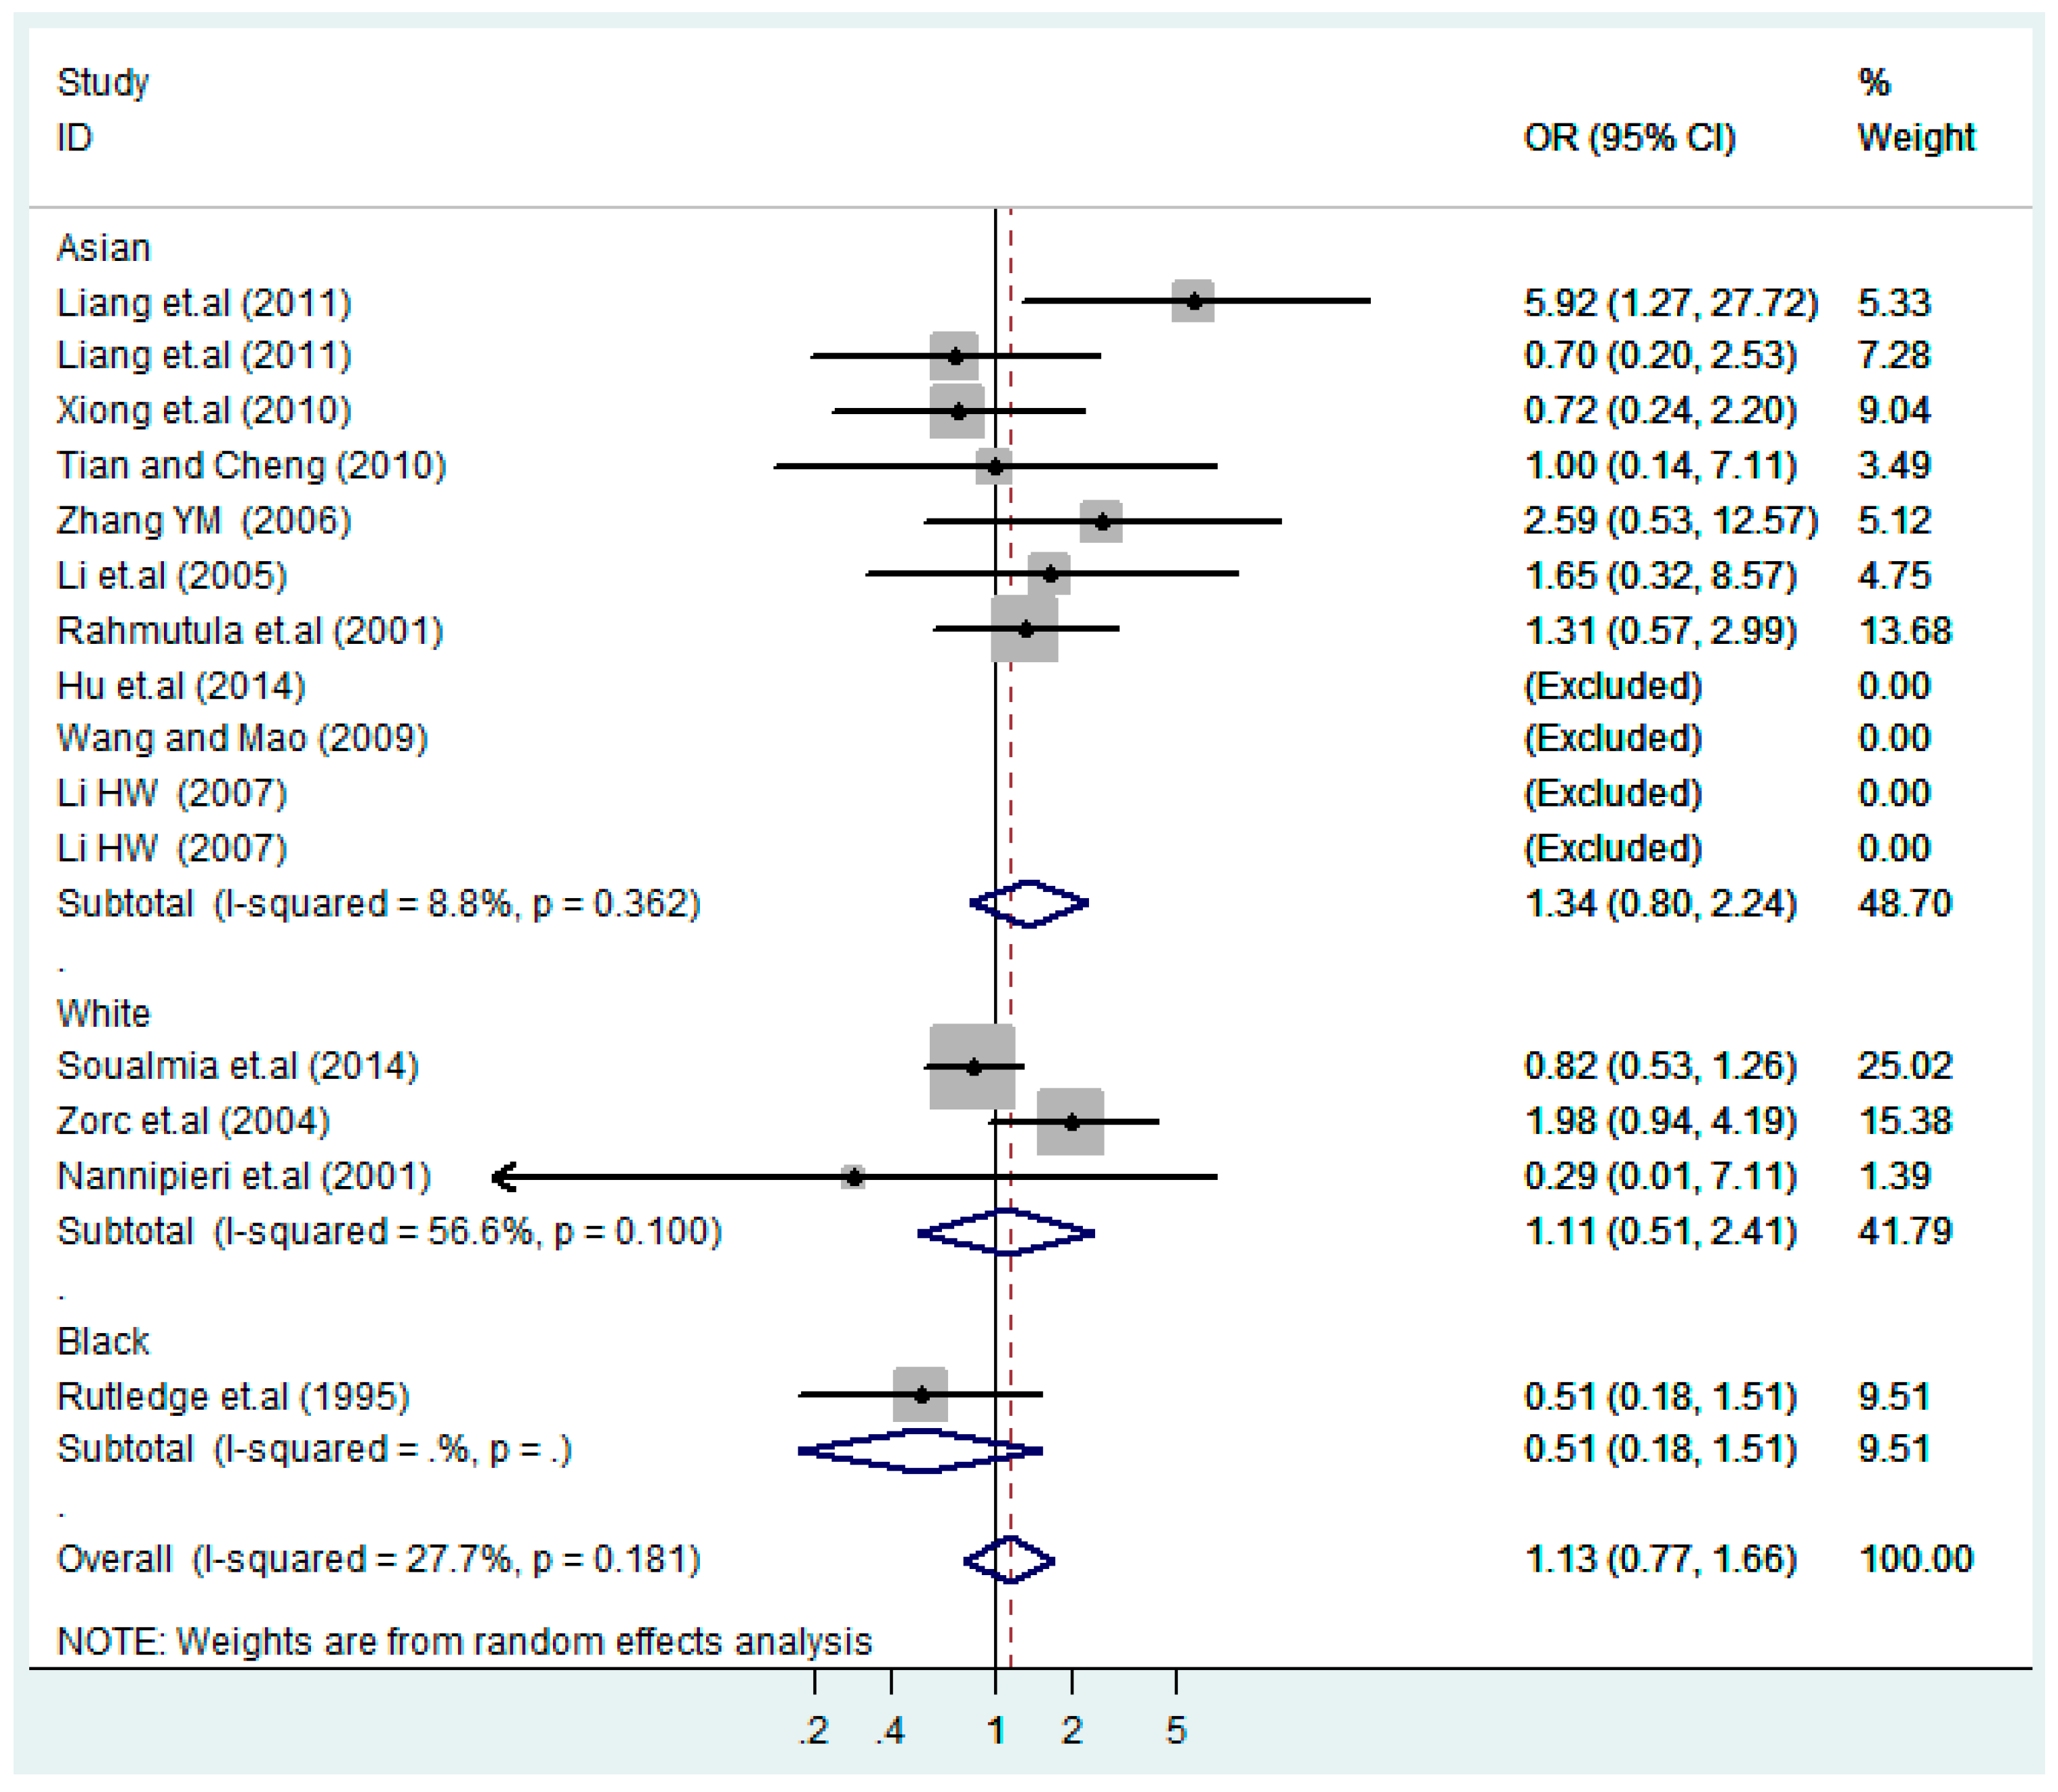
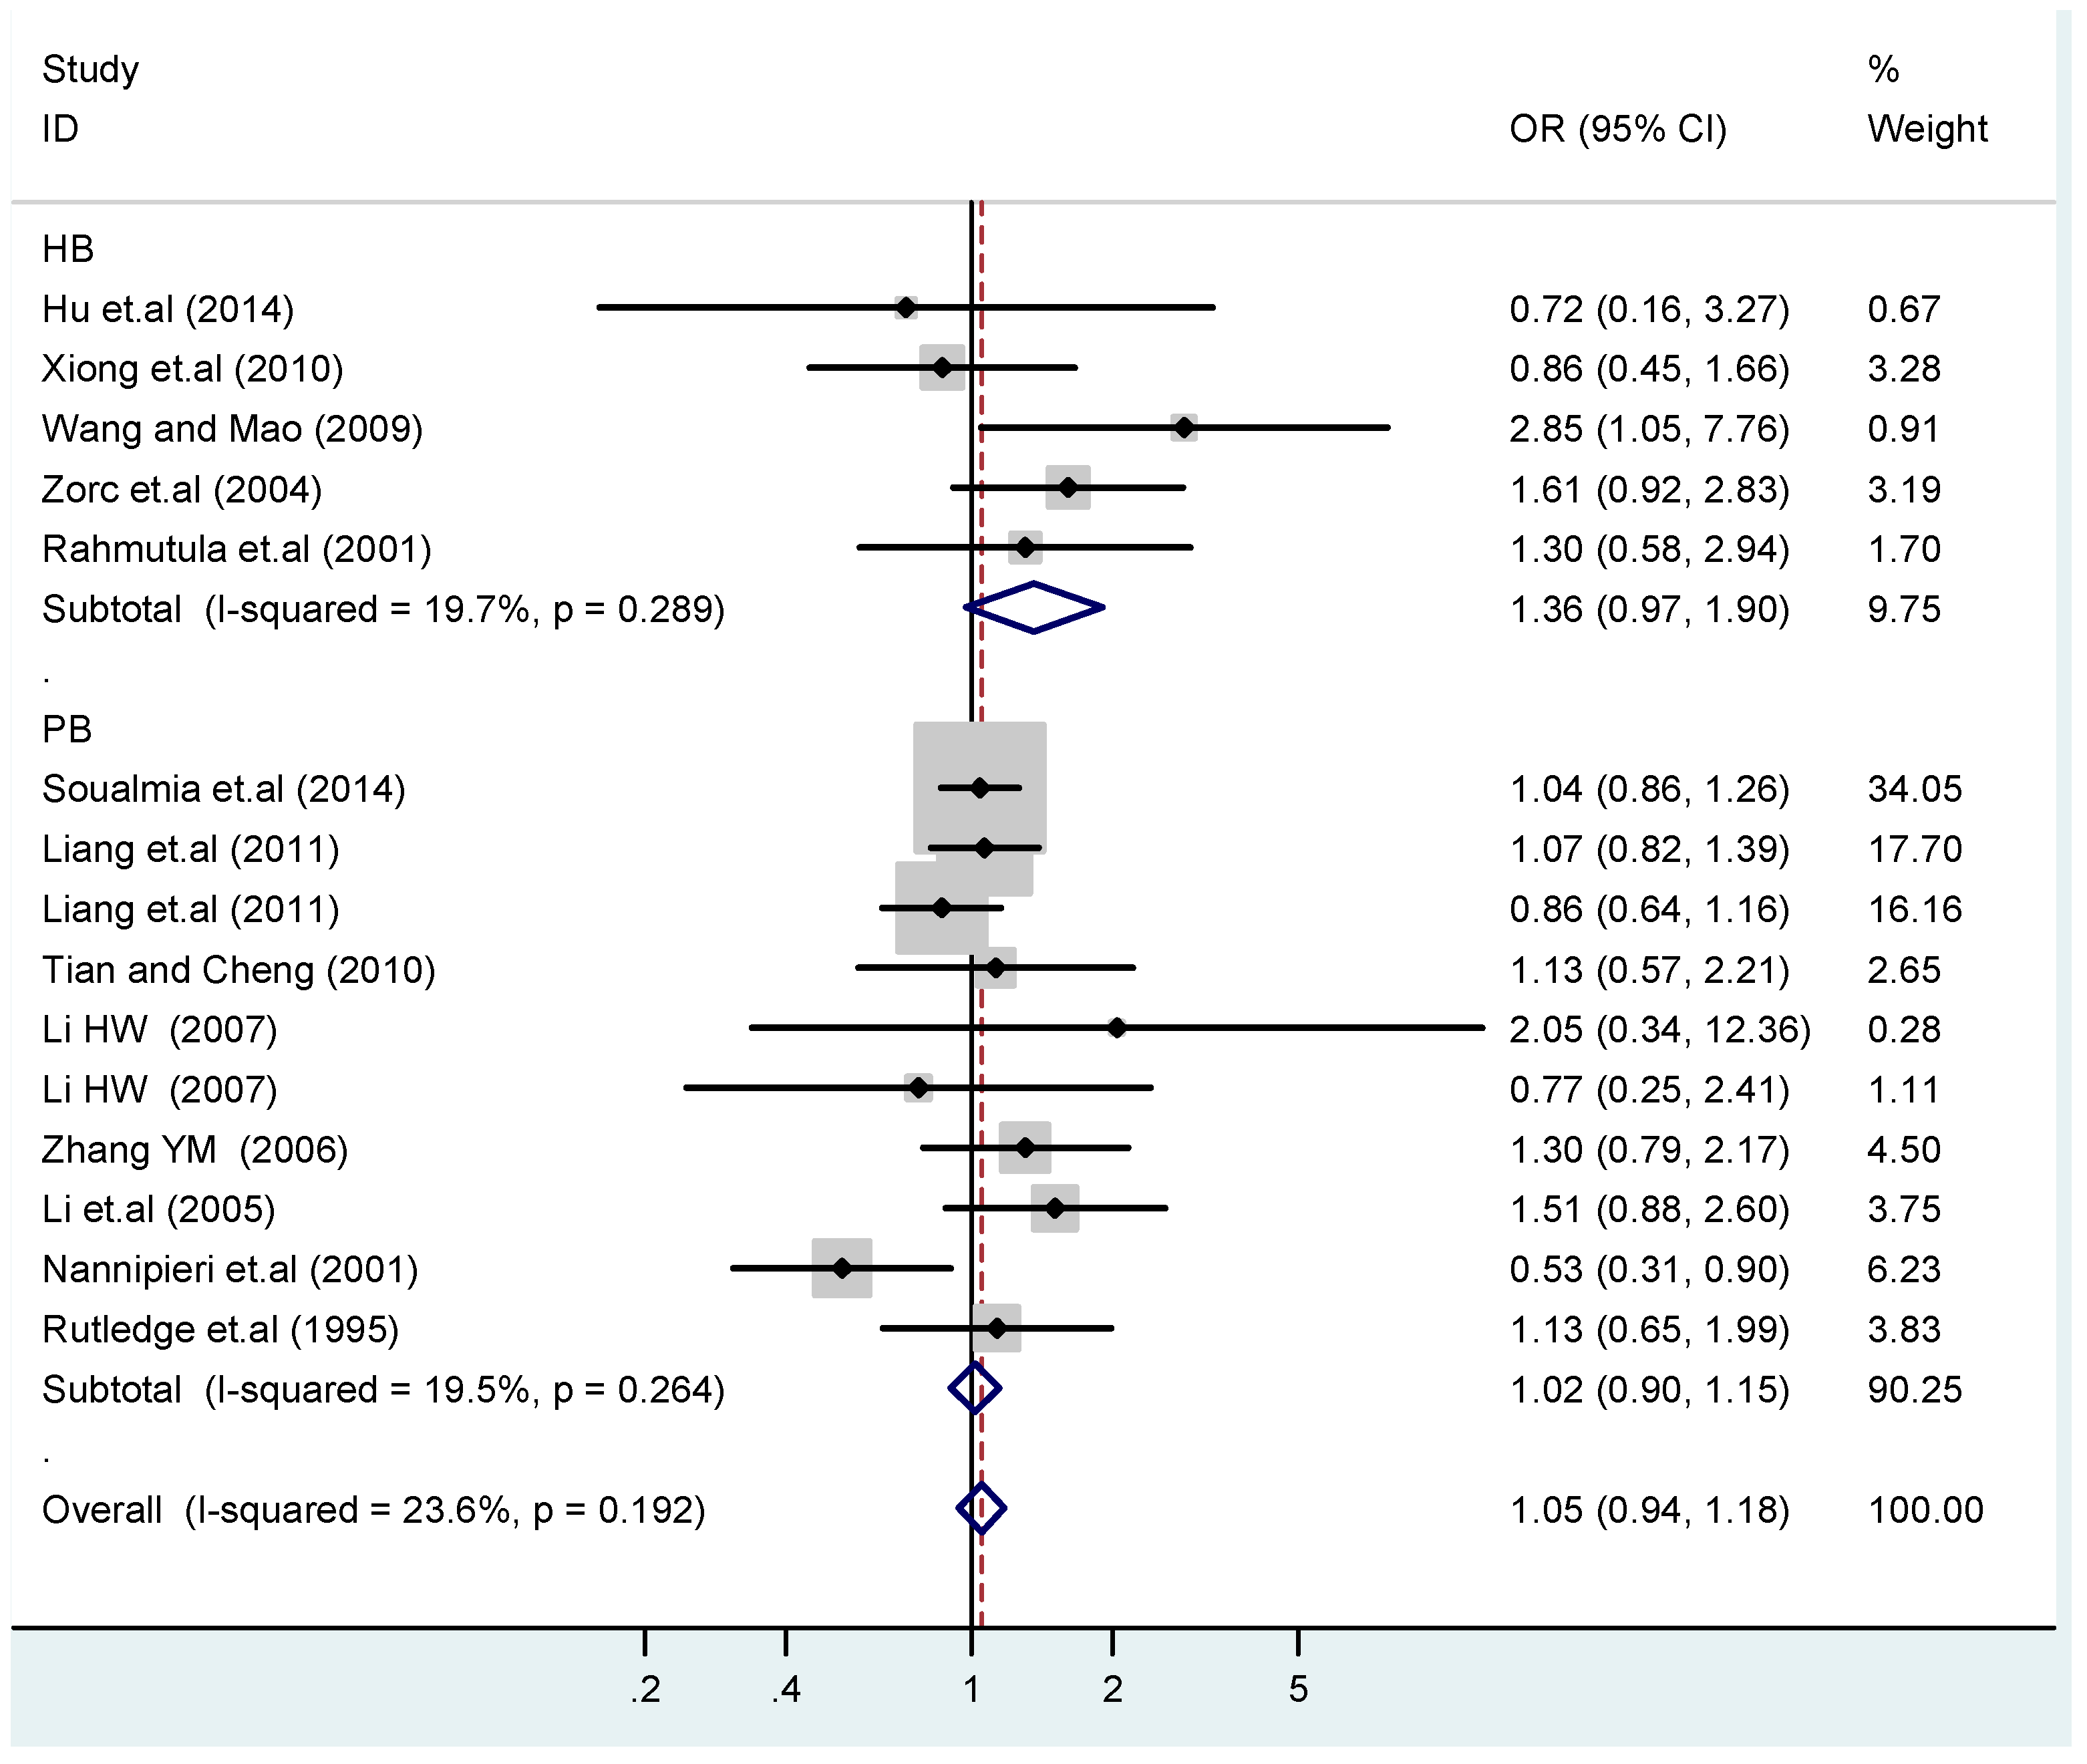
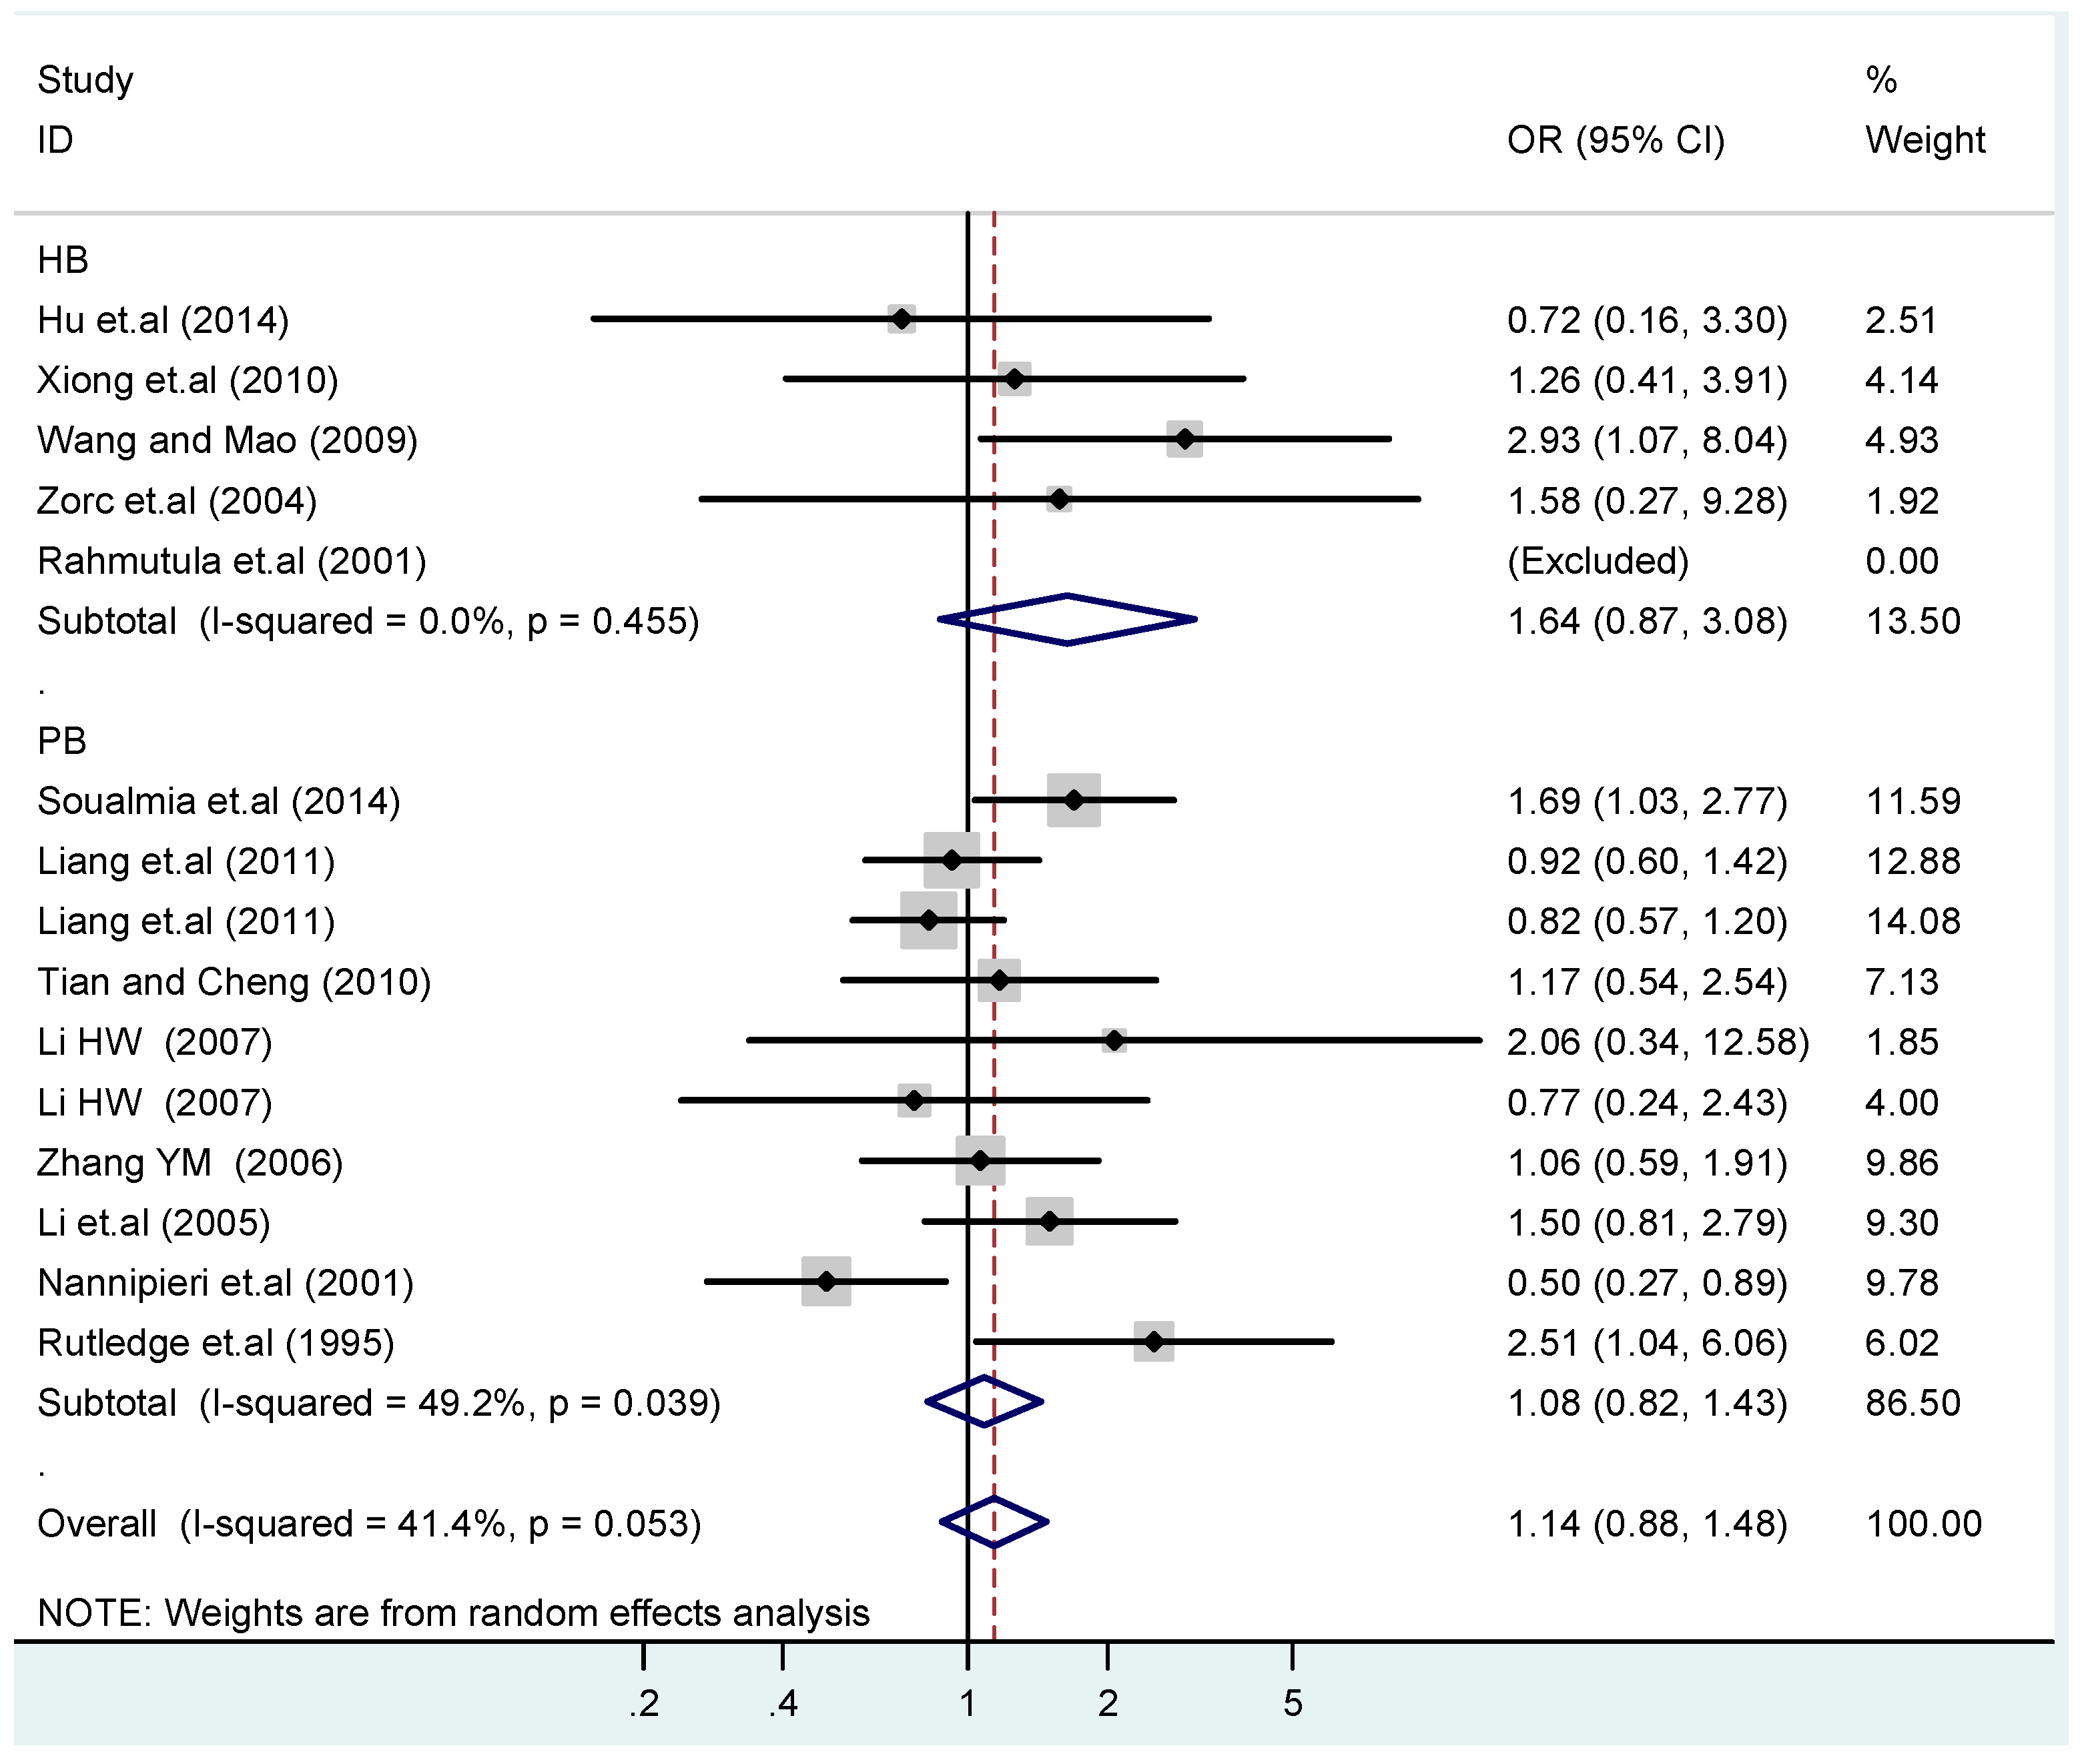
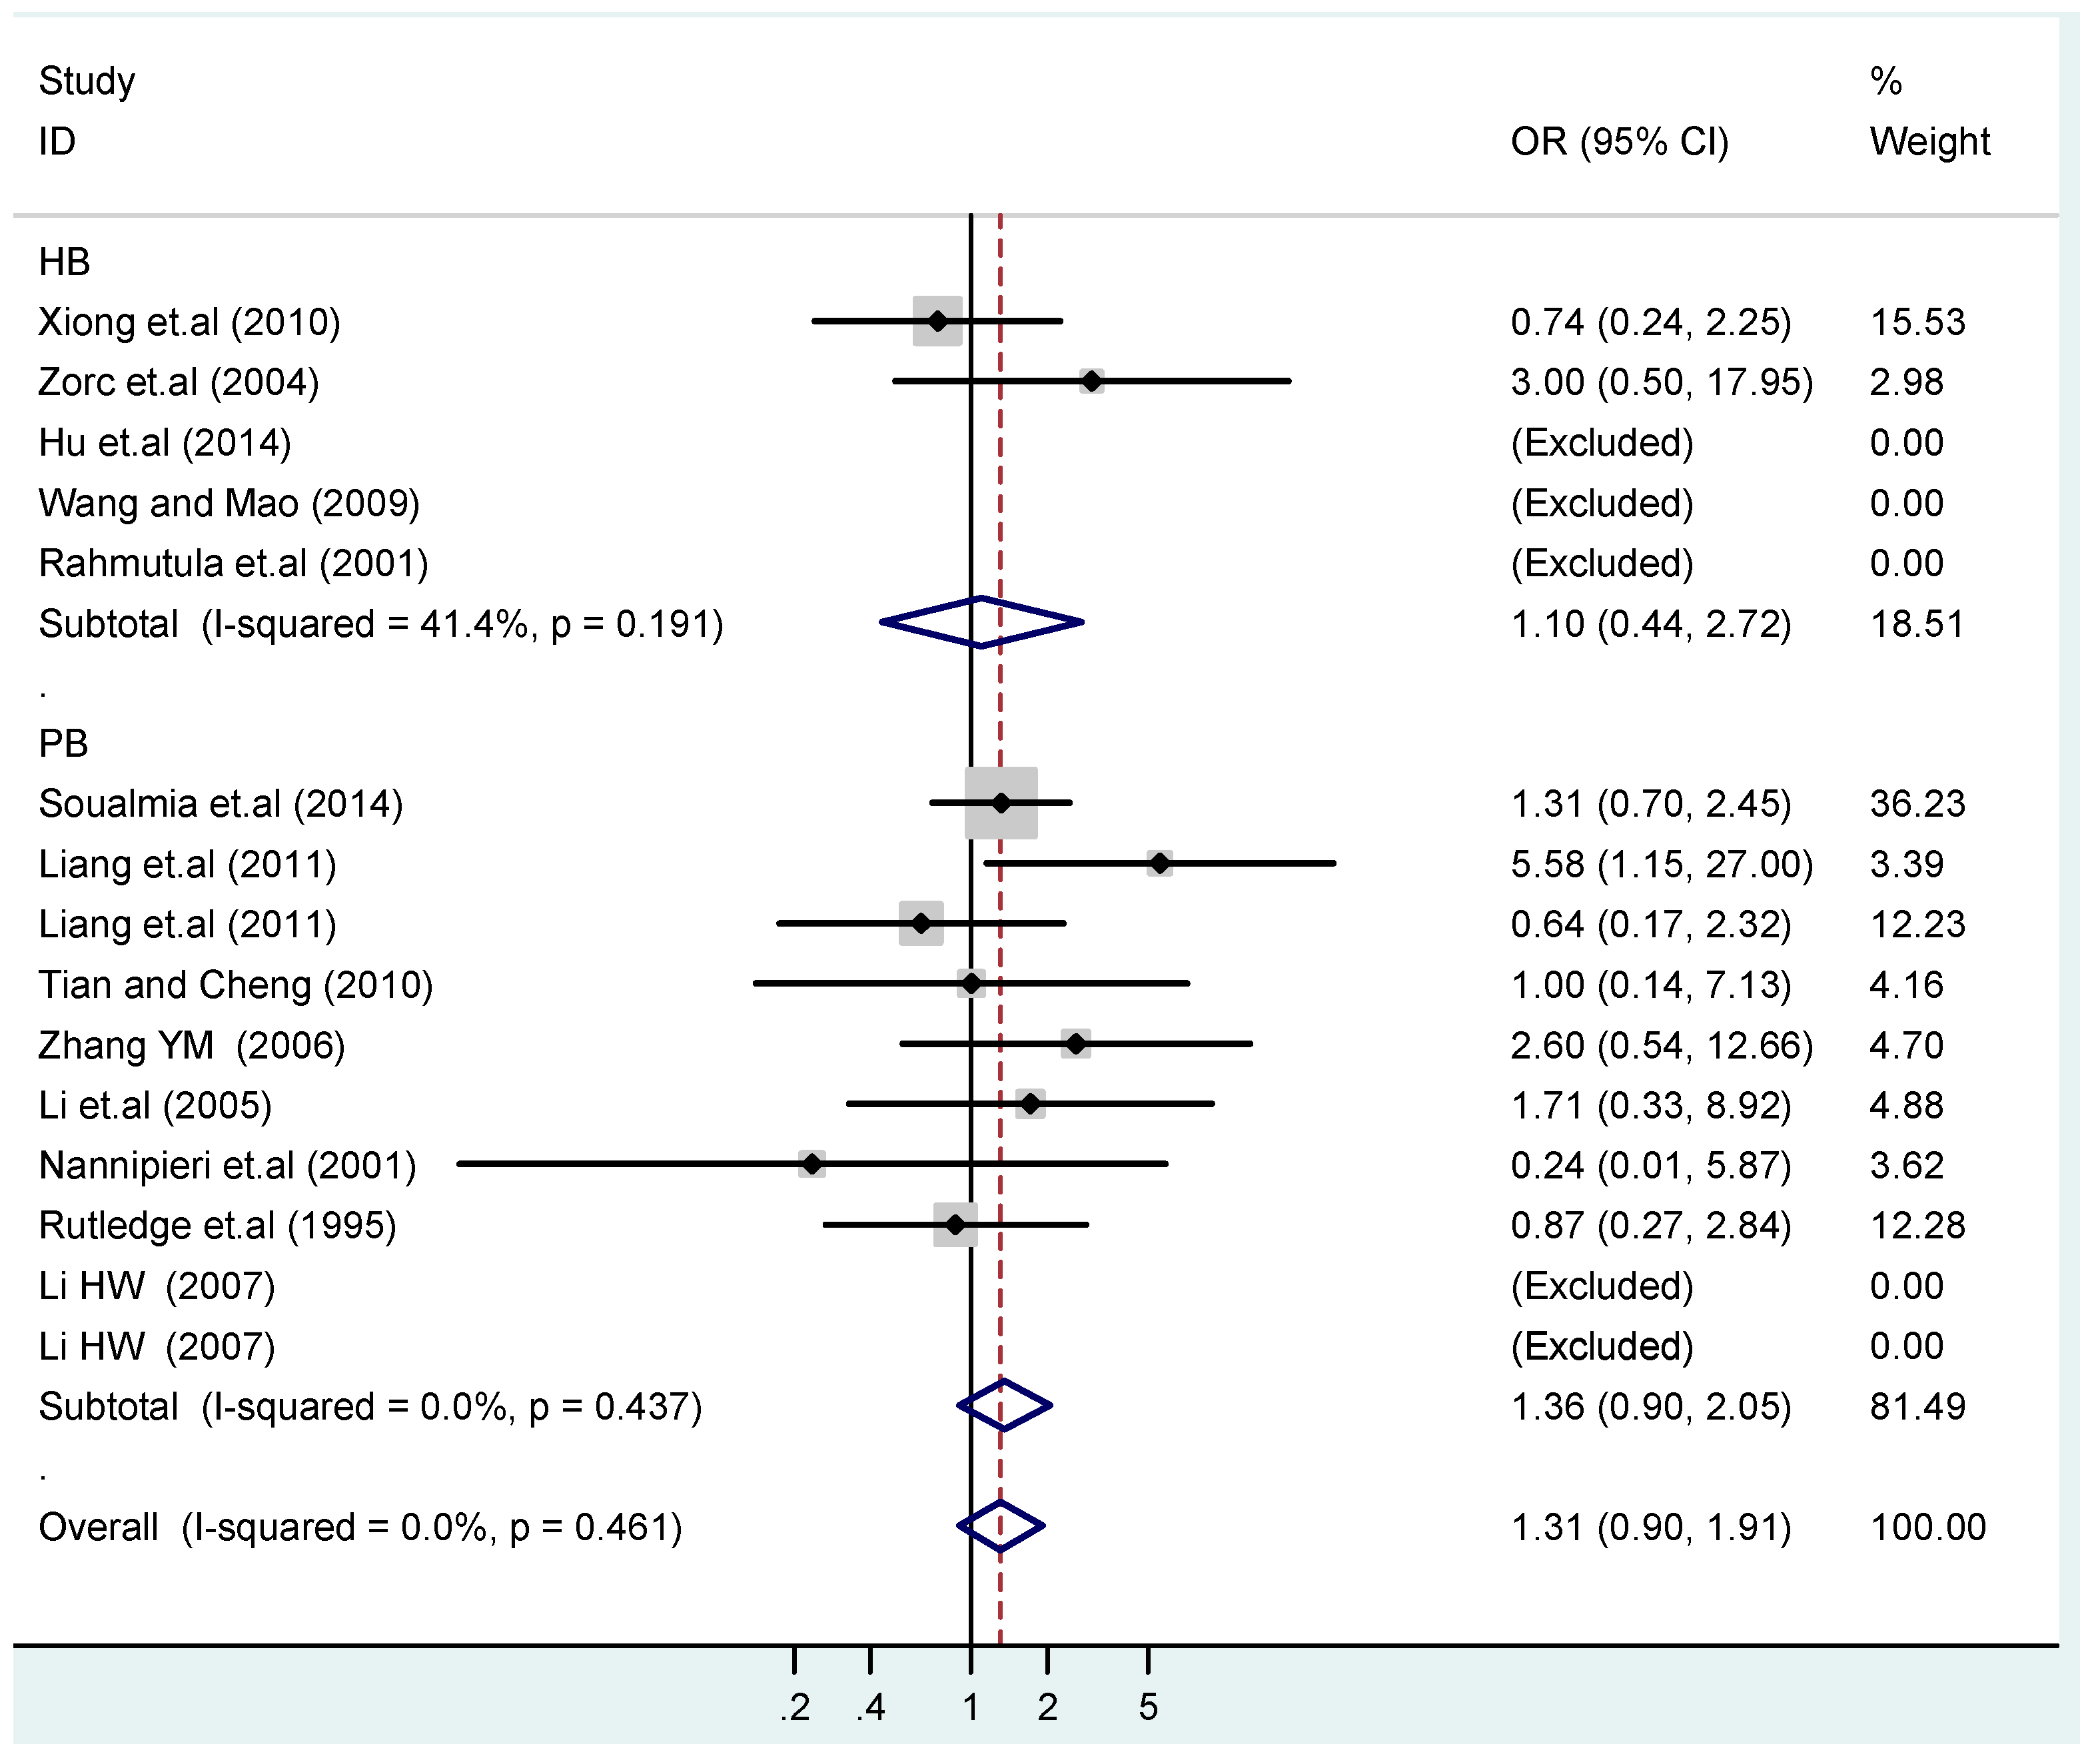
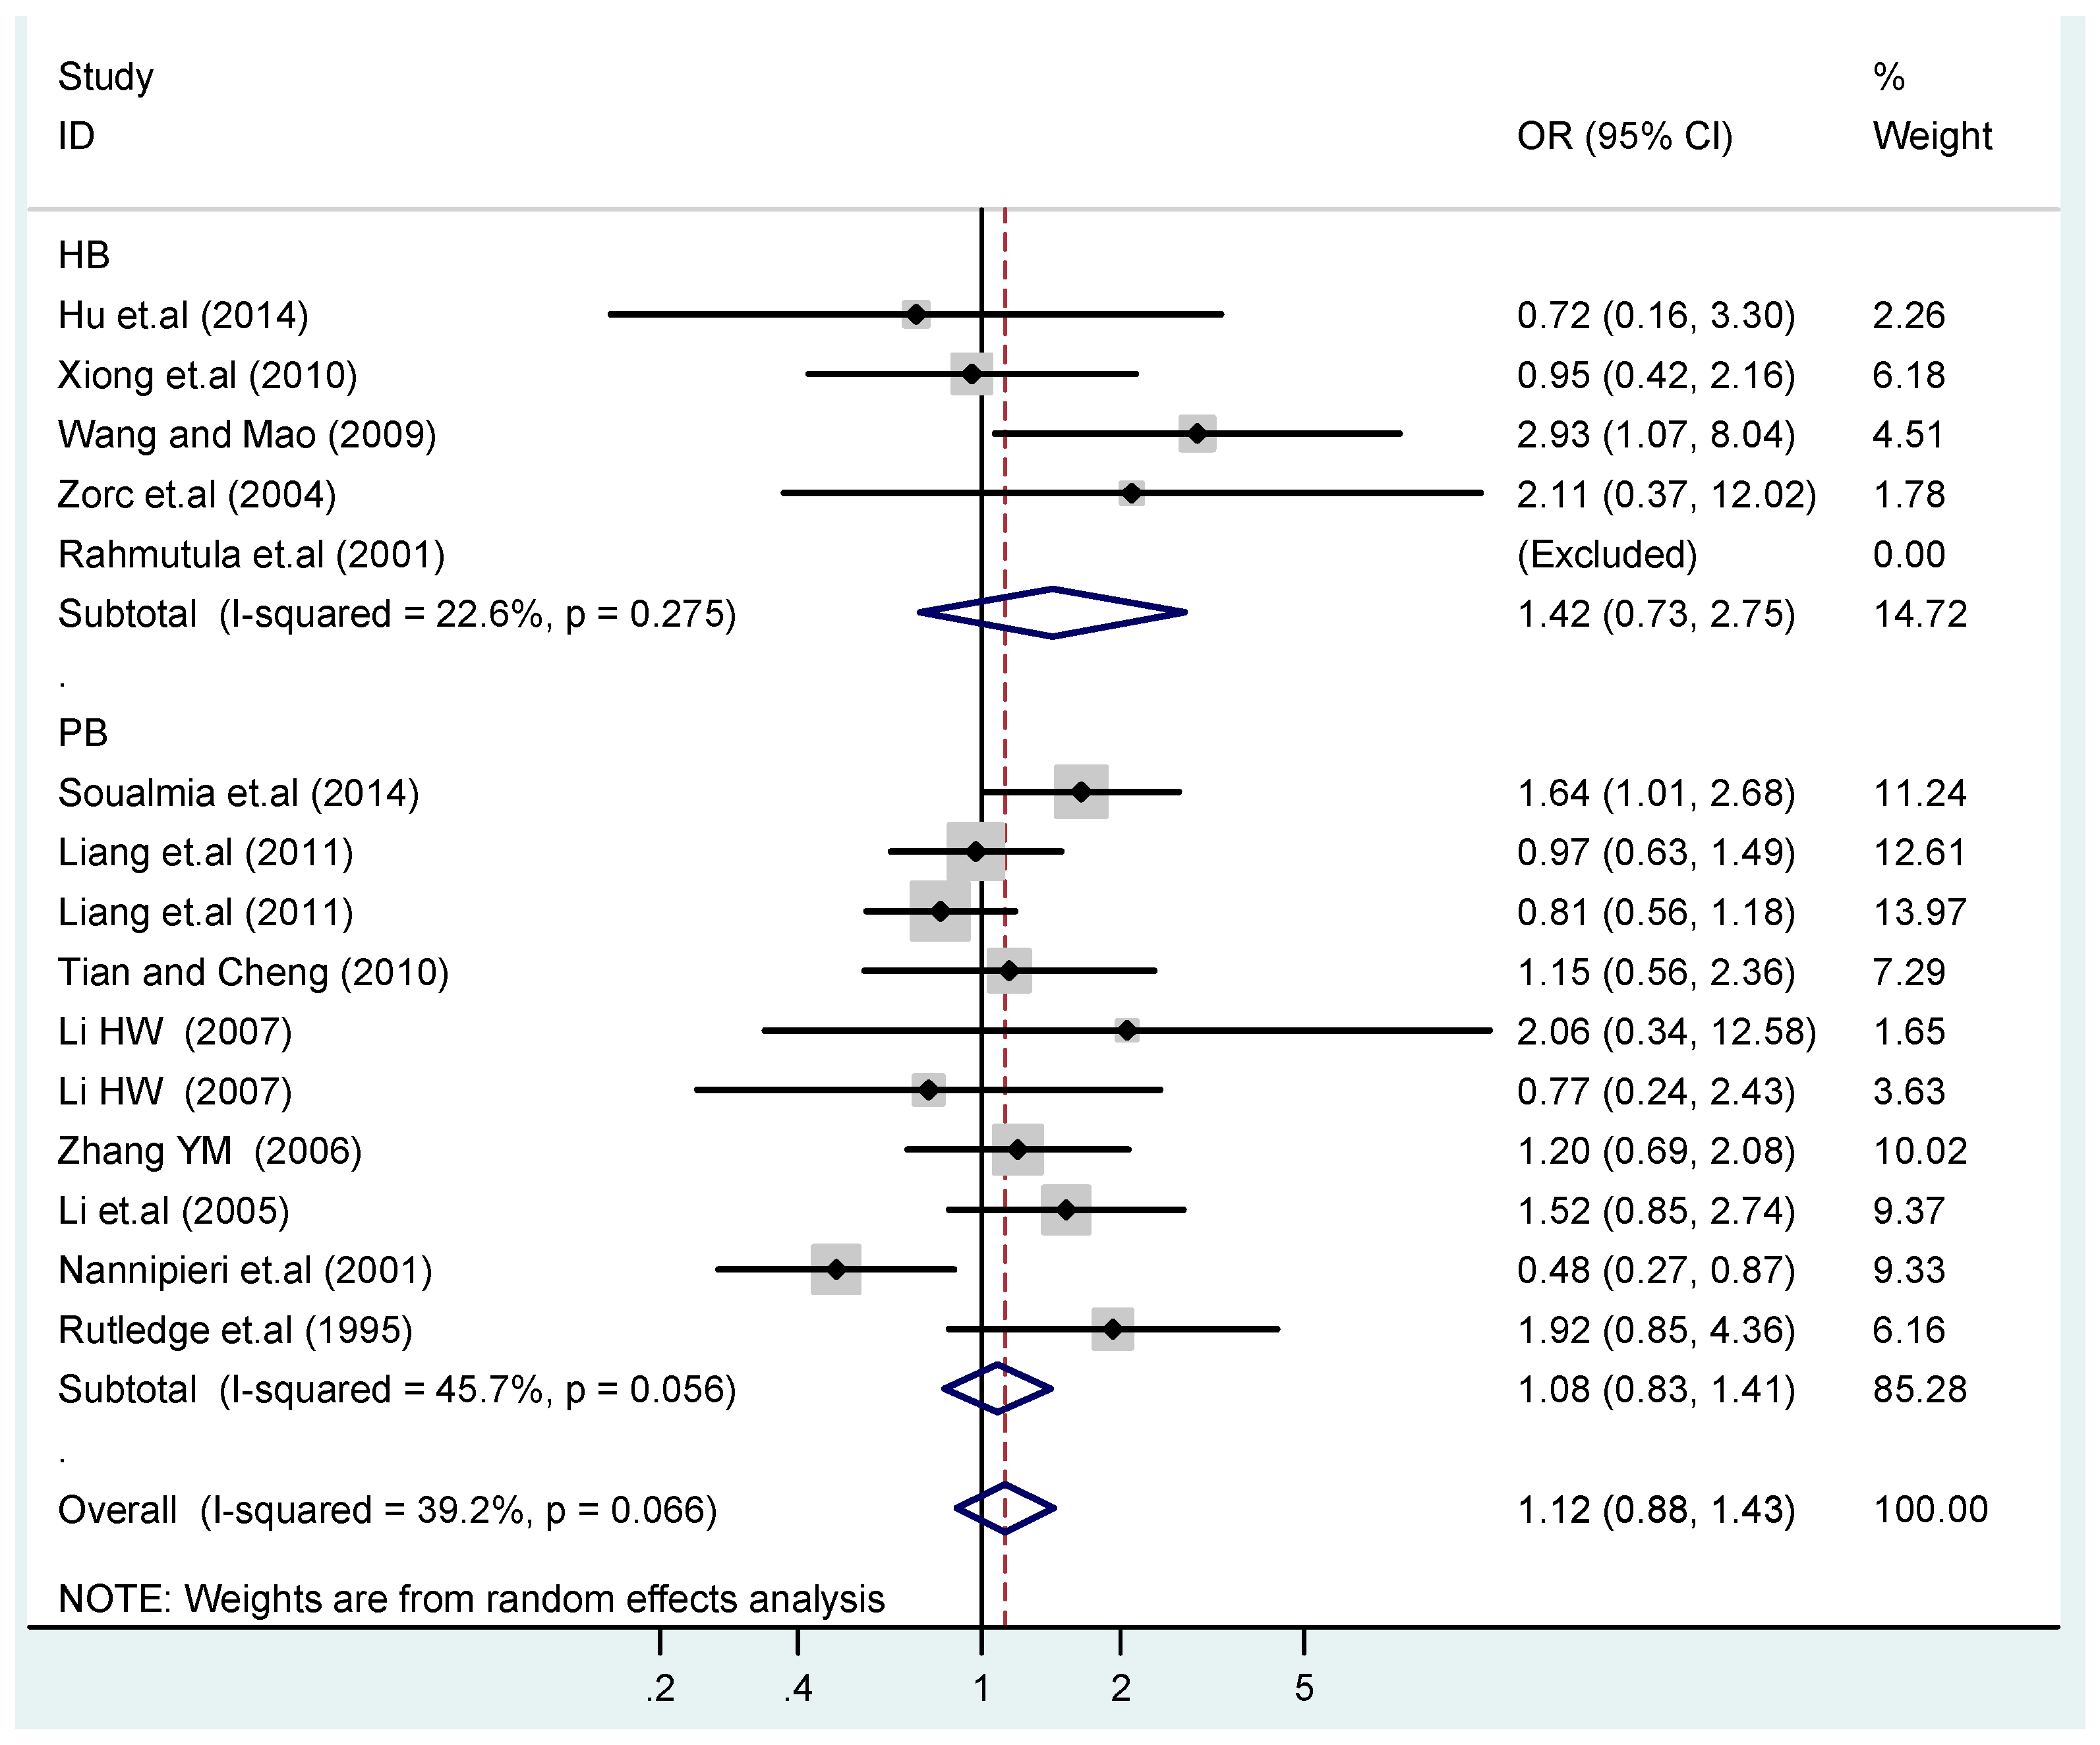
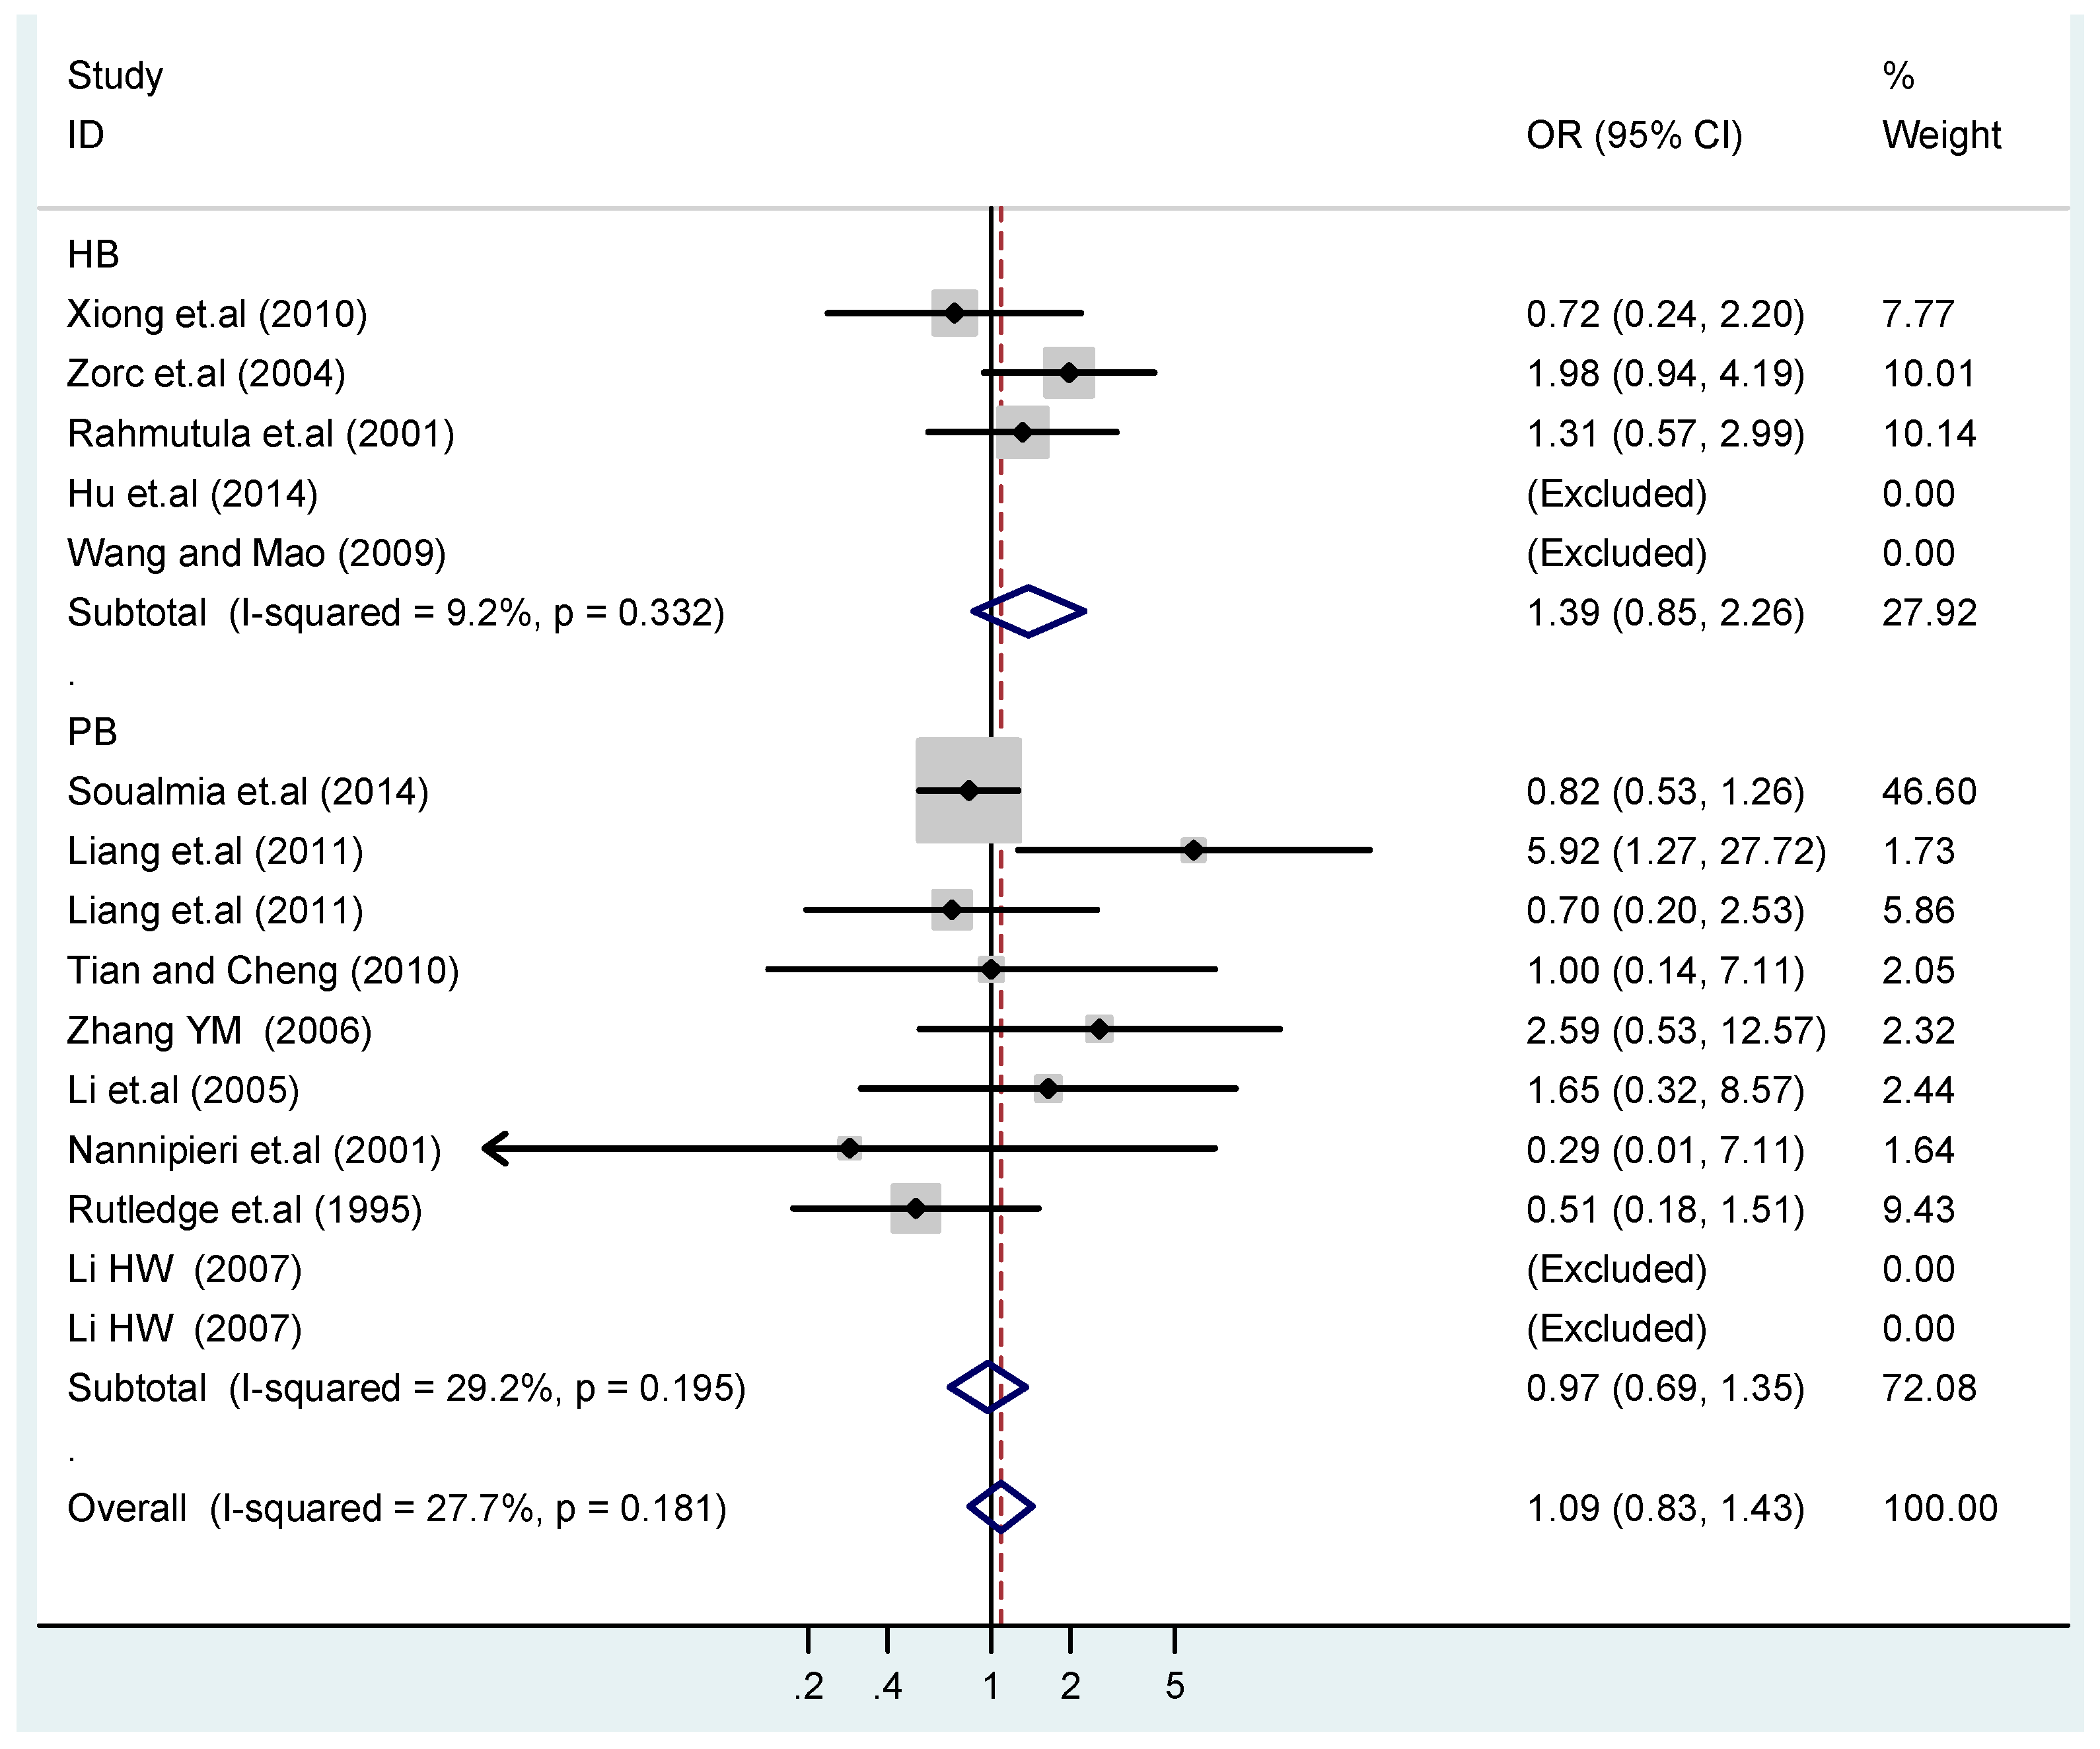
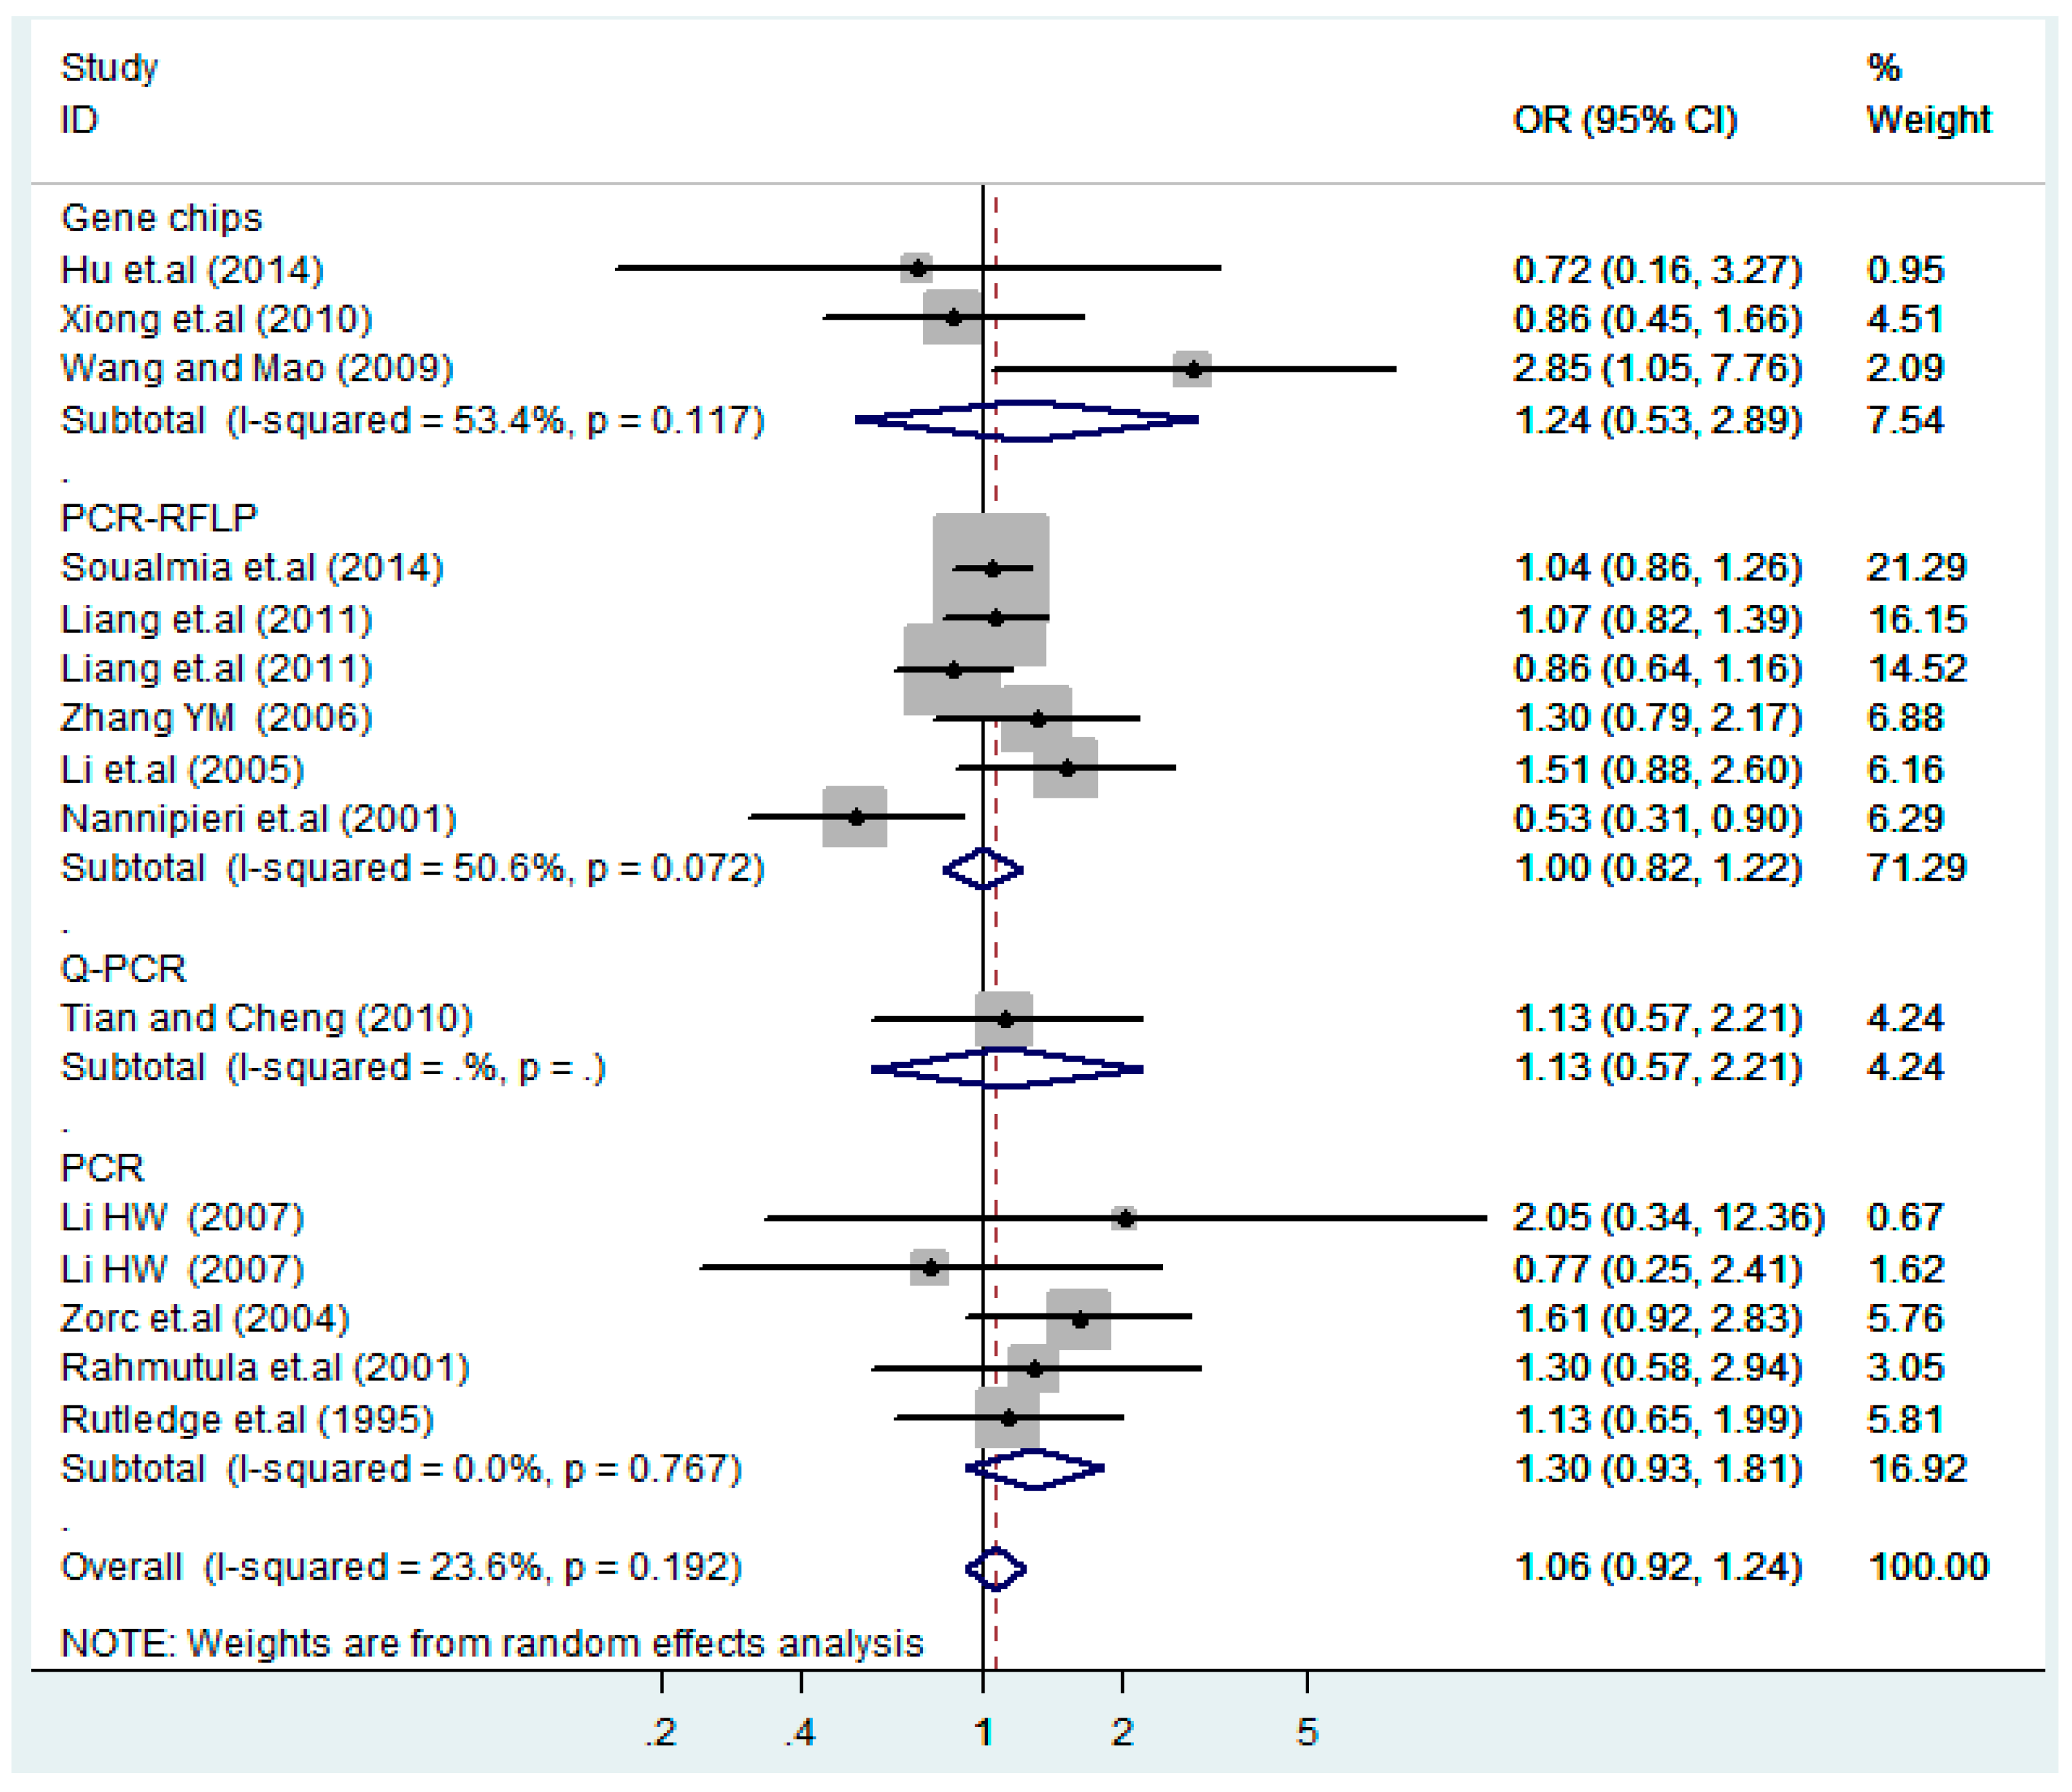
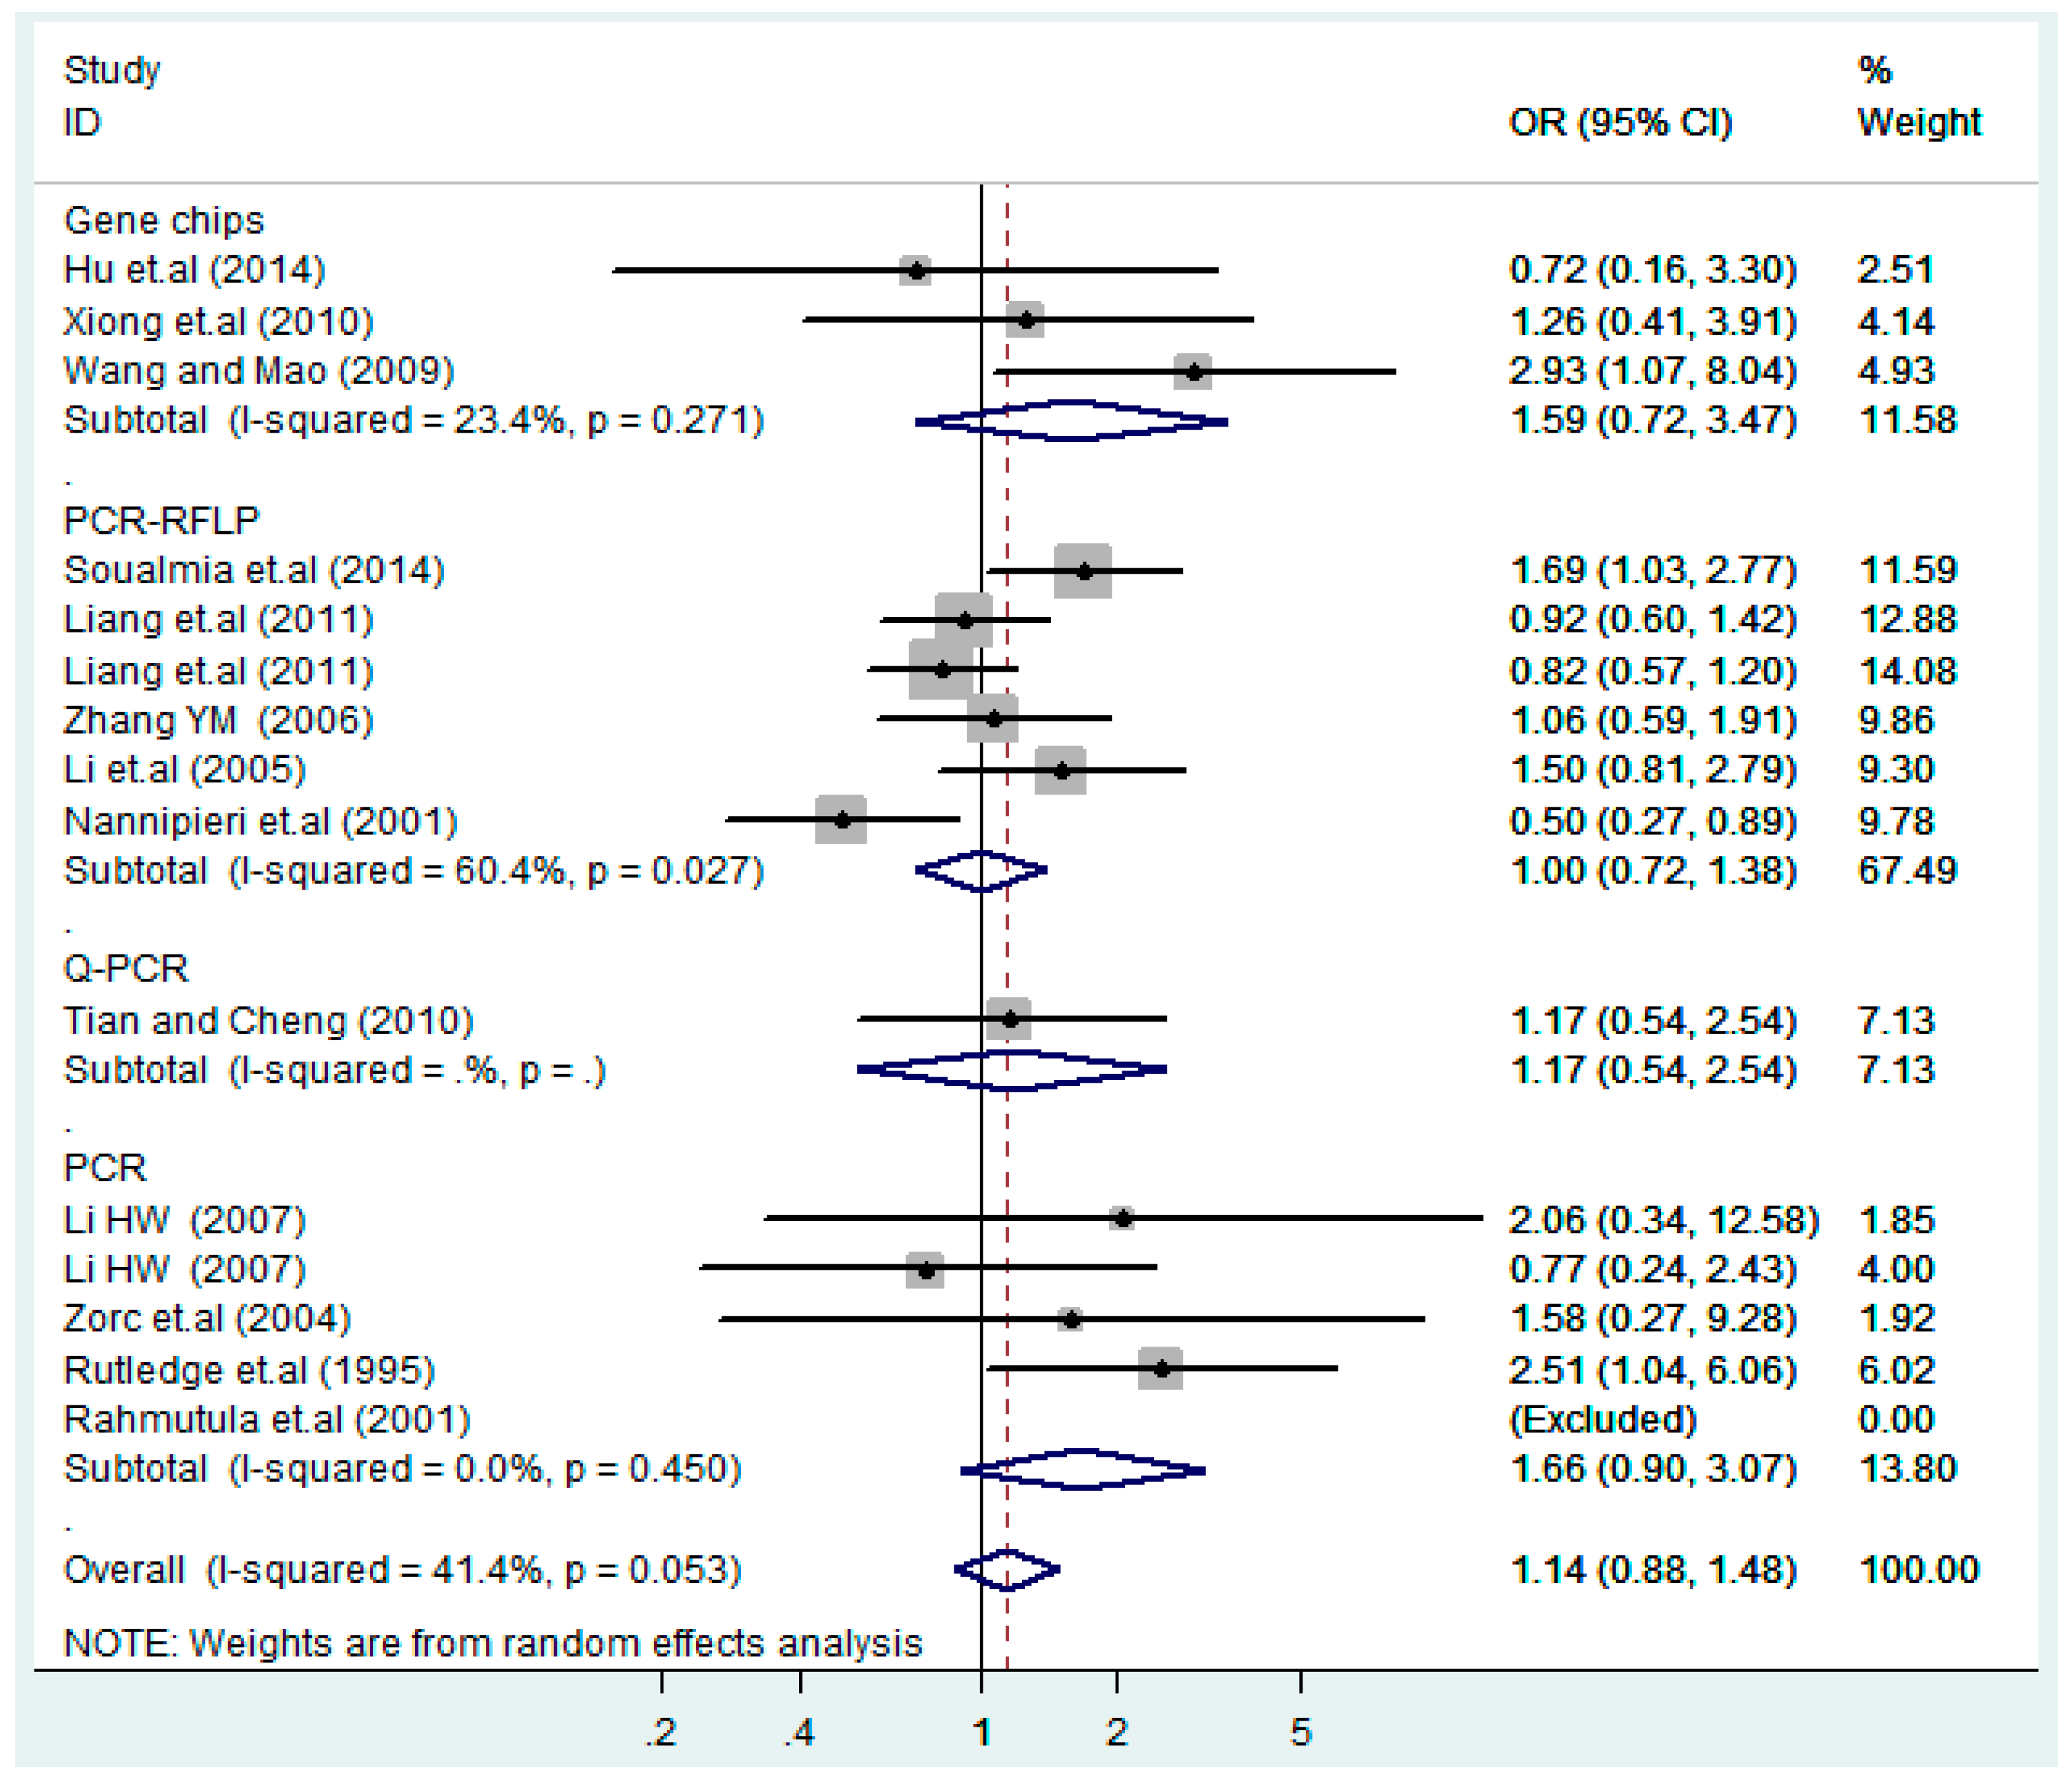
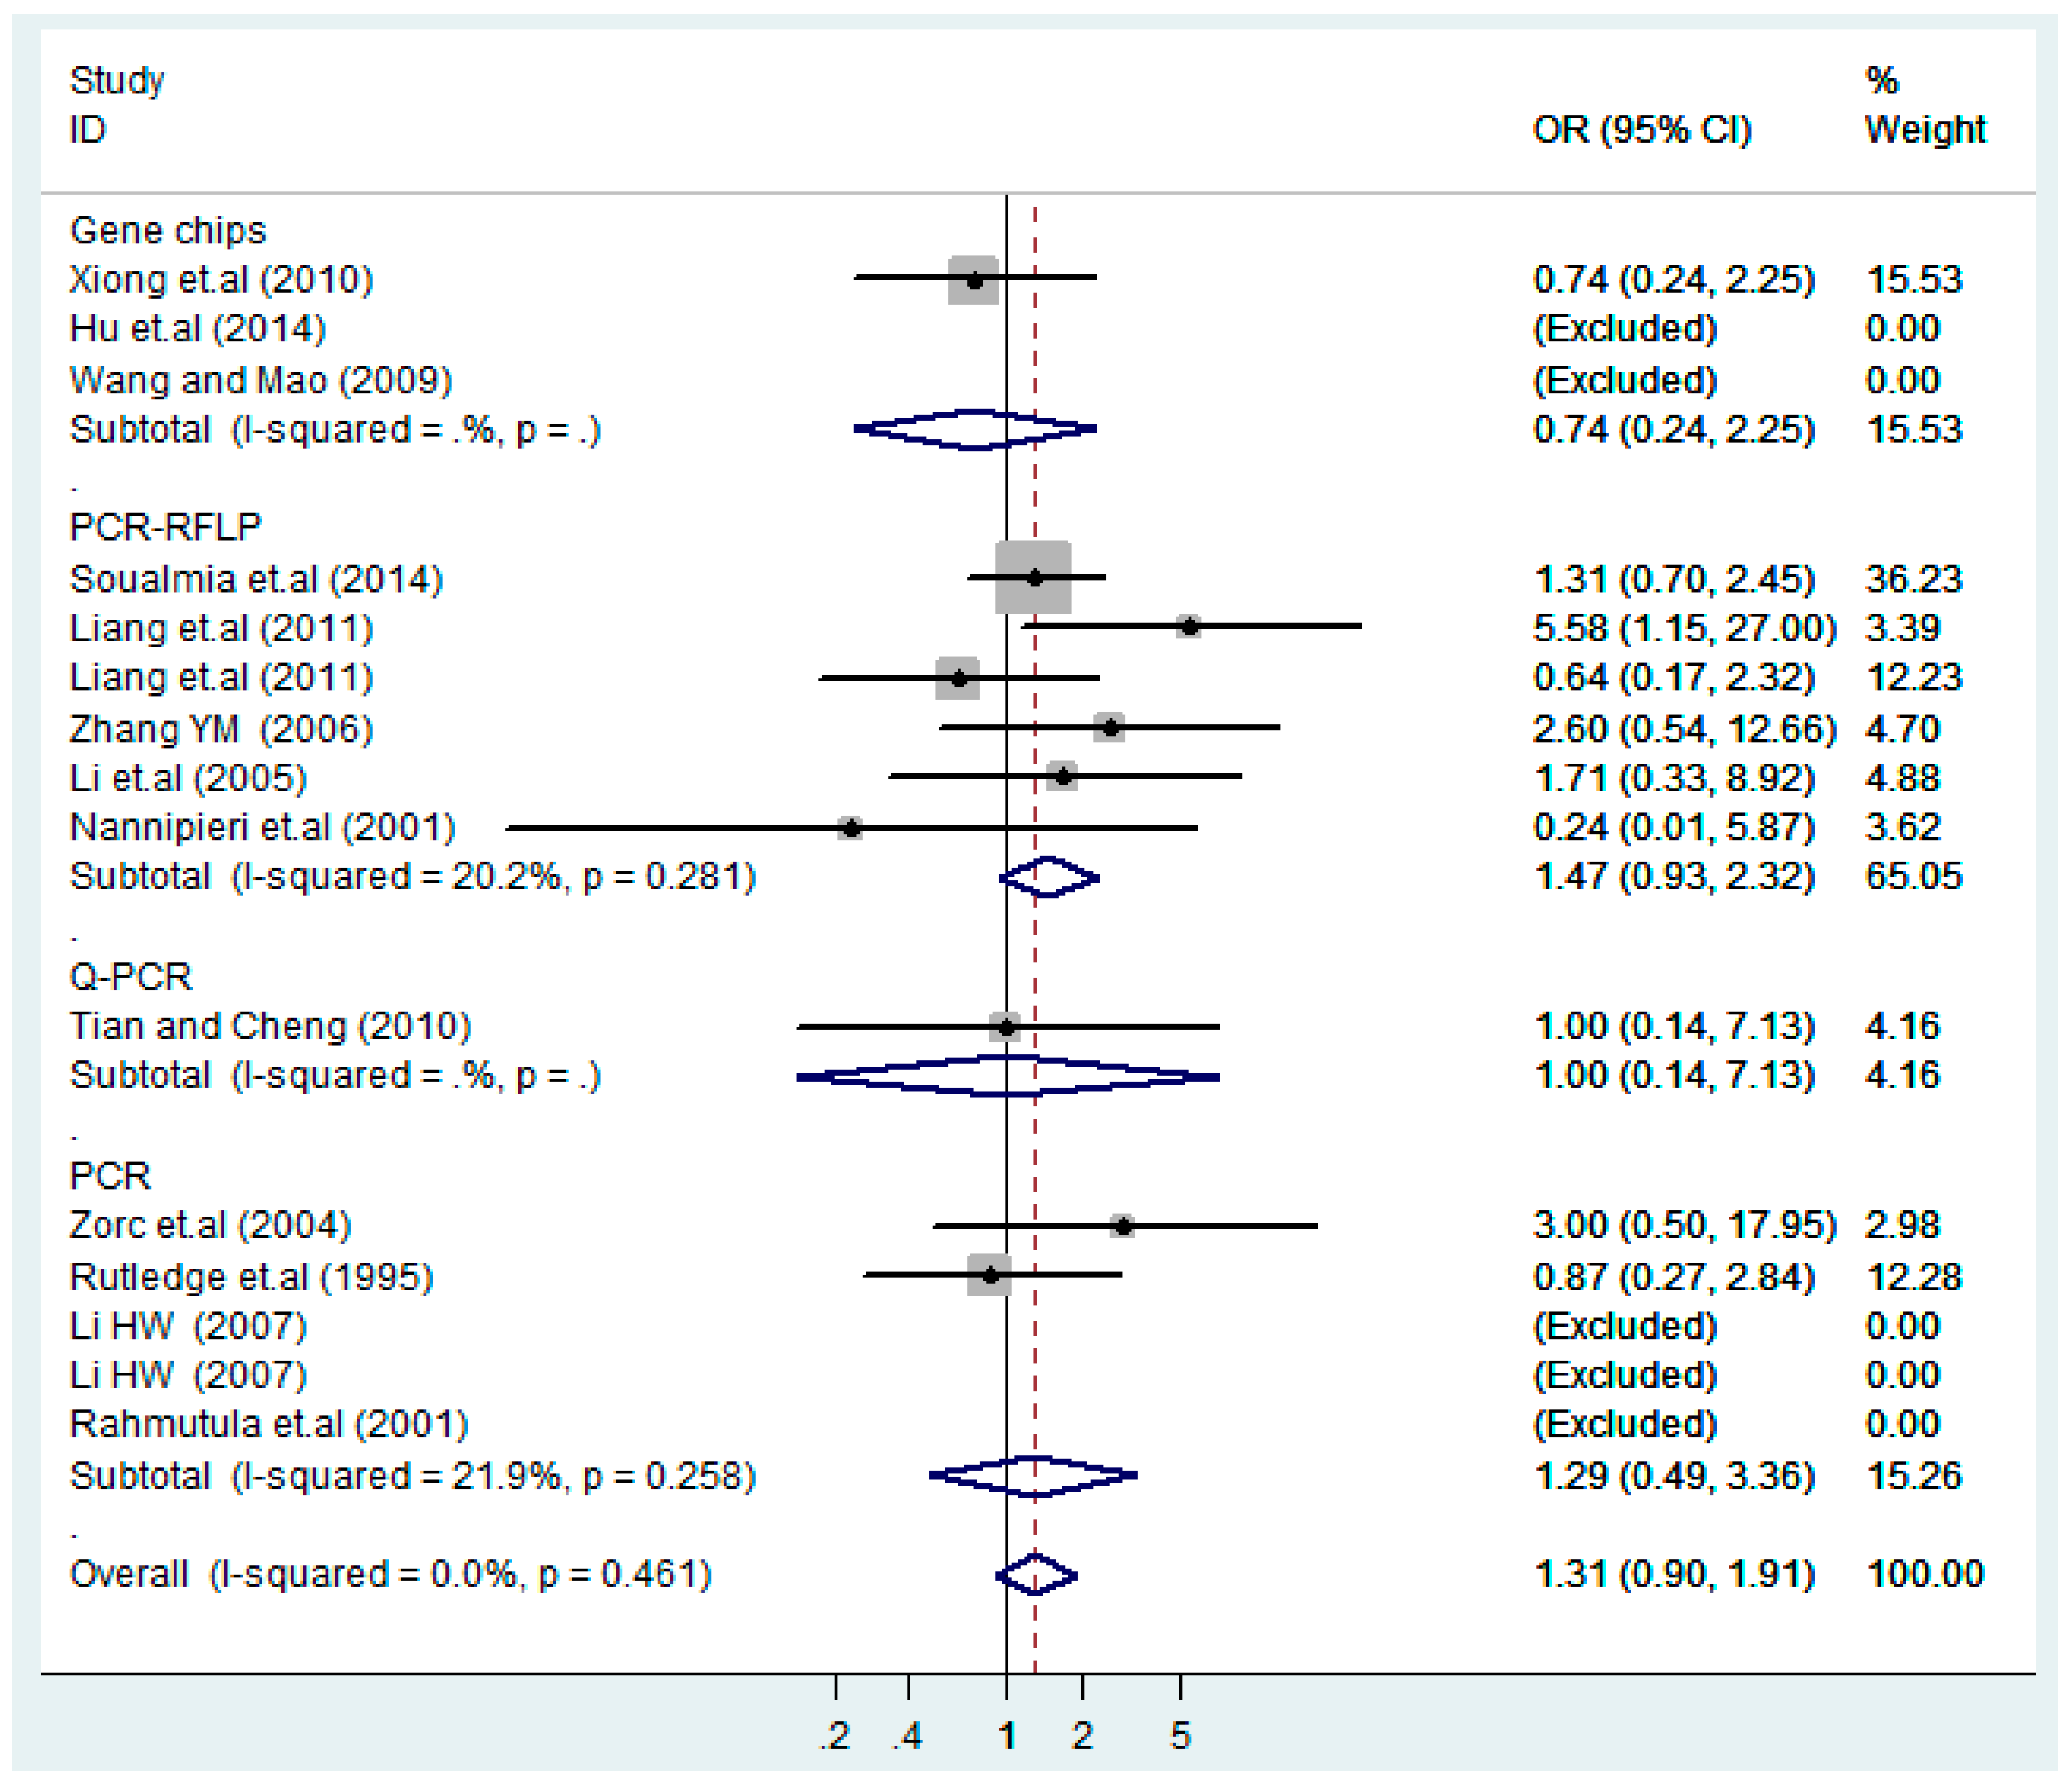
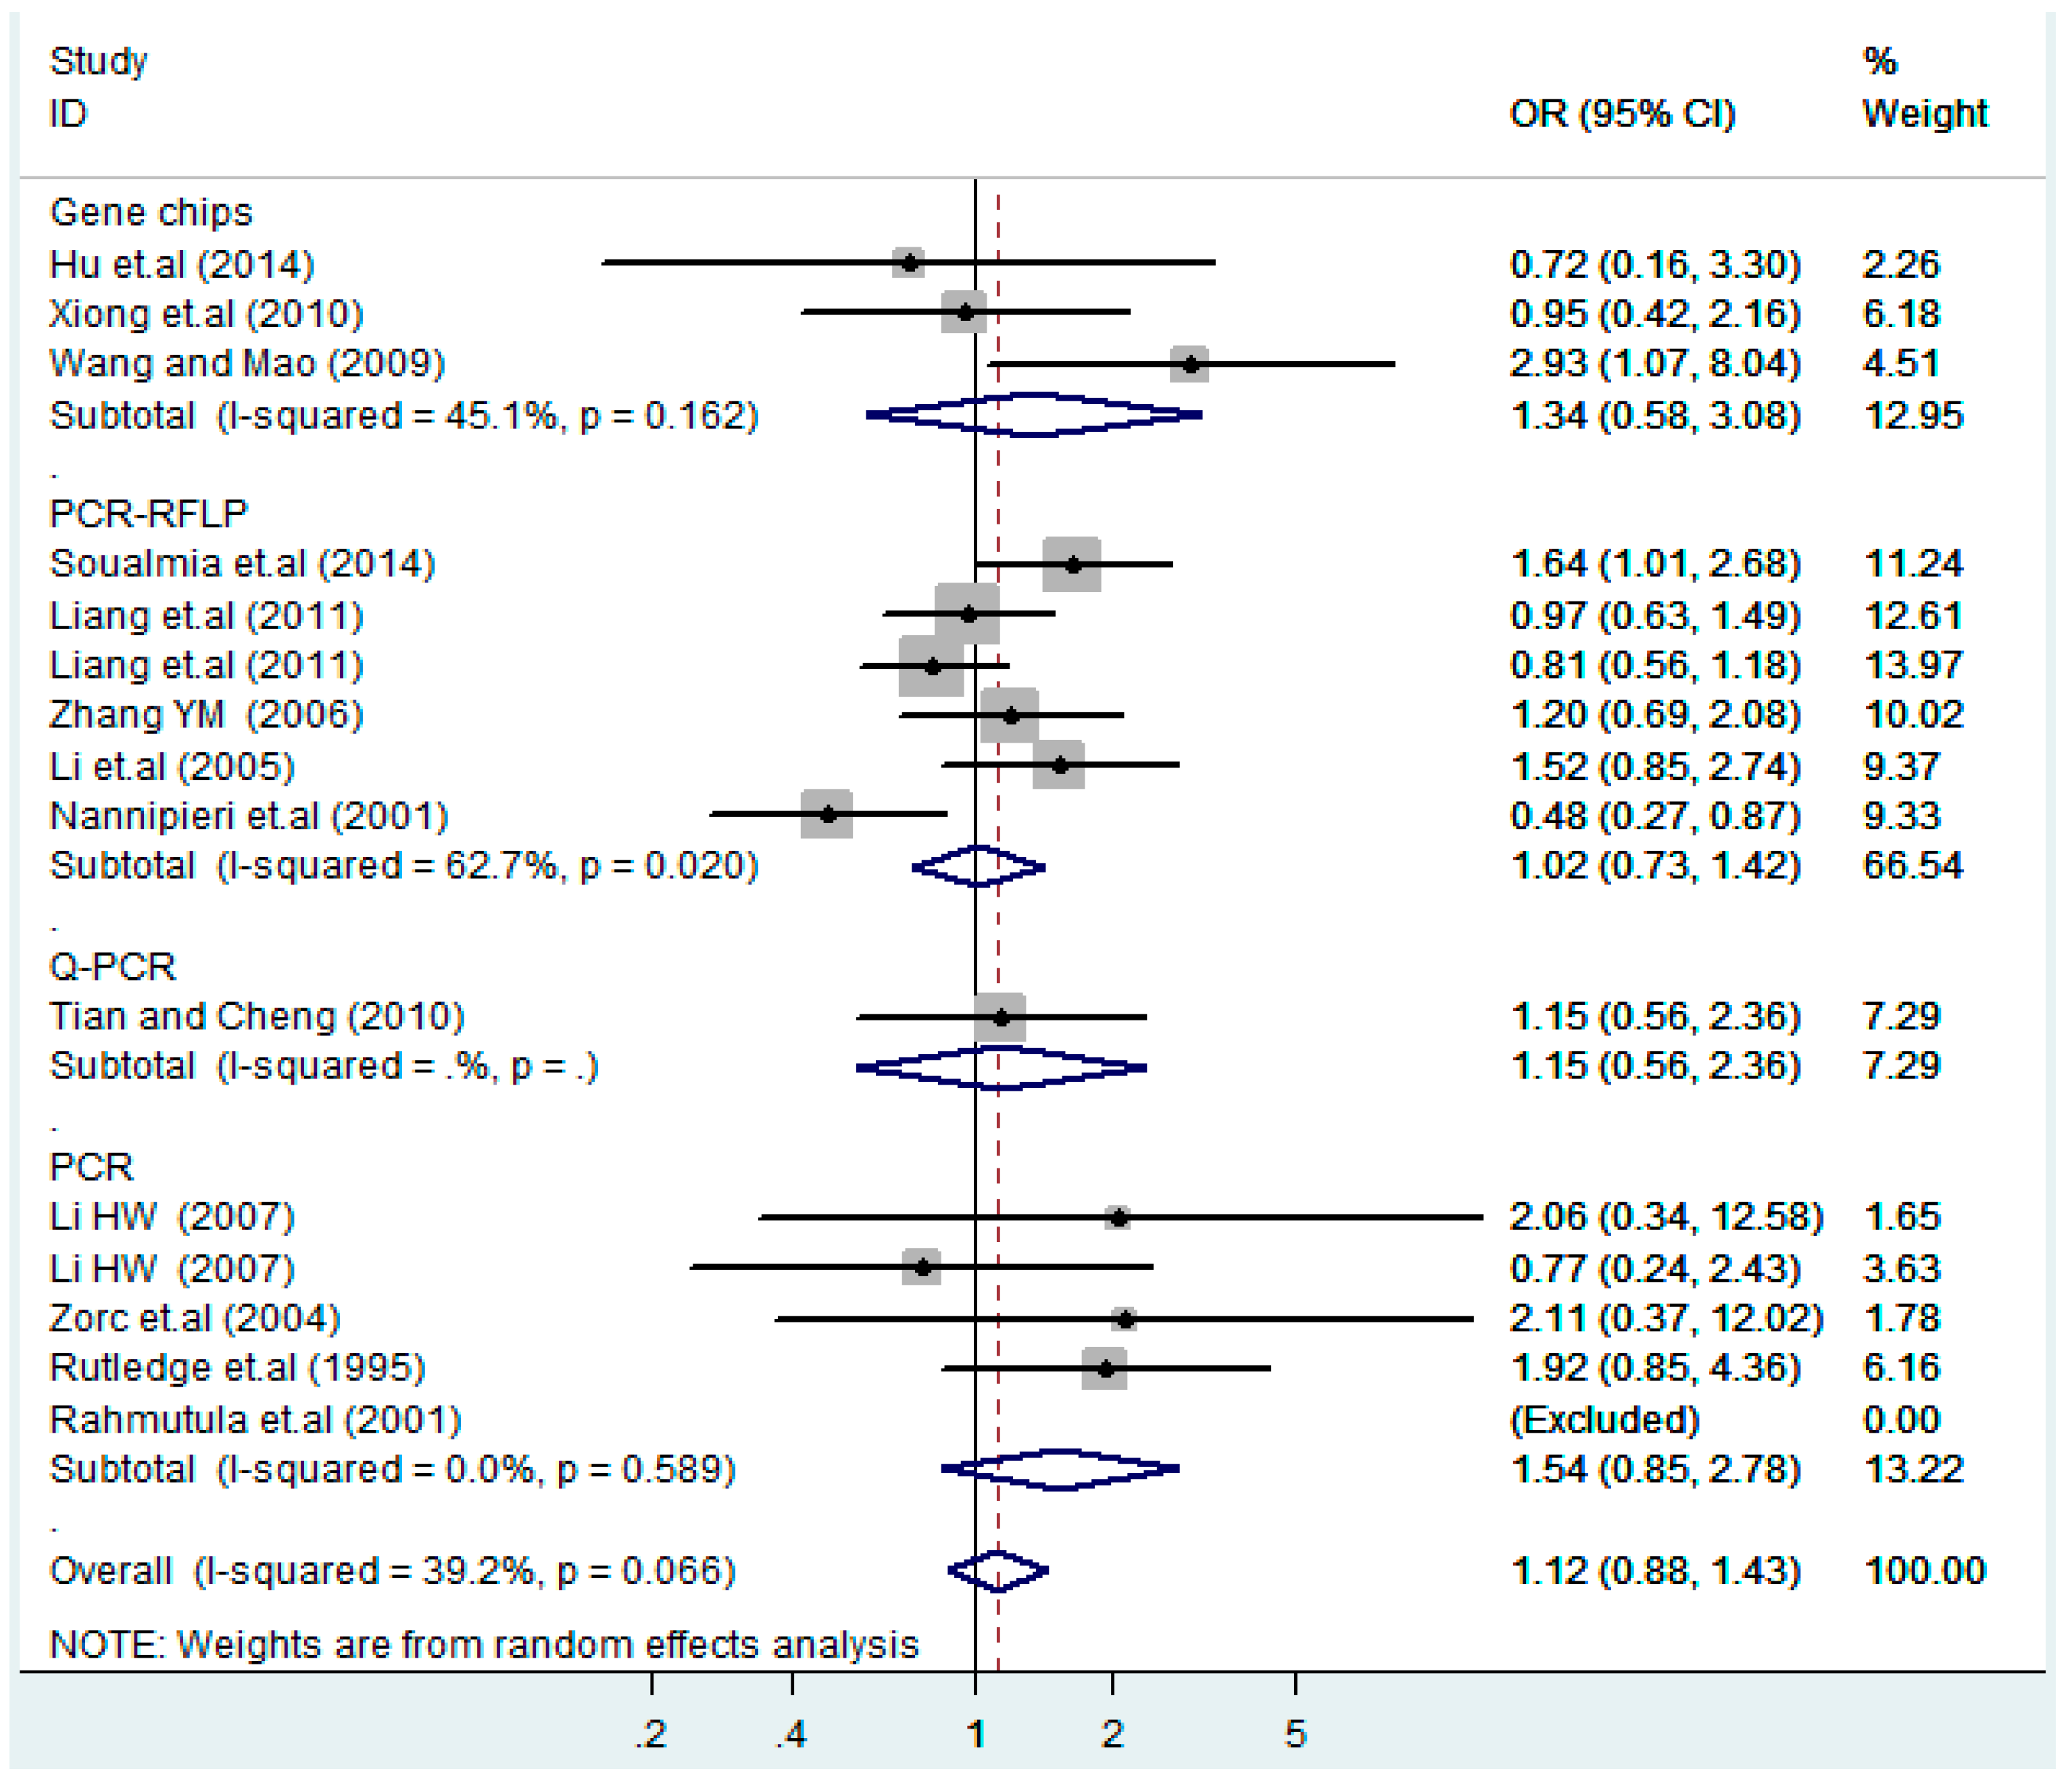
3.2. Meta-Analysis
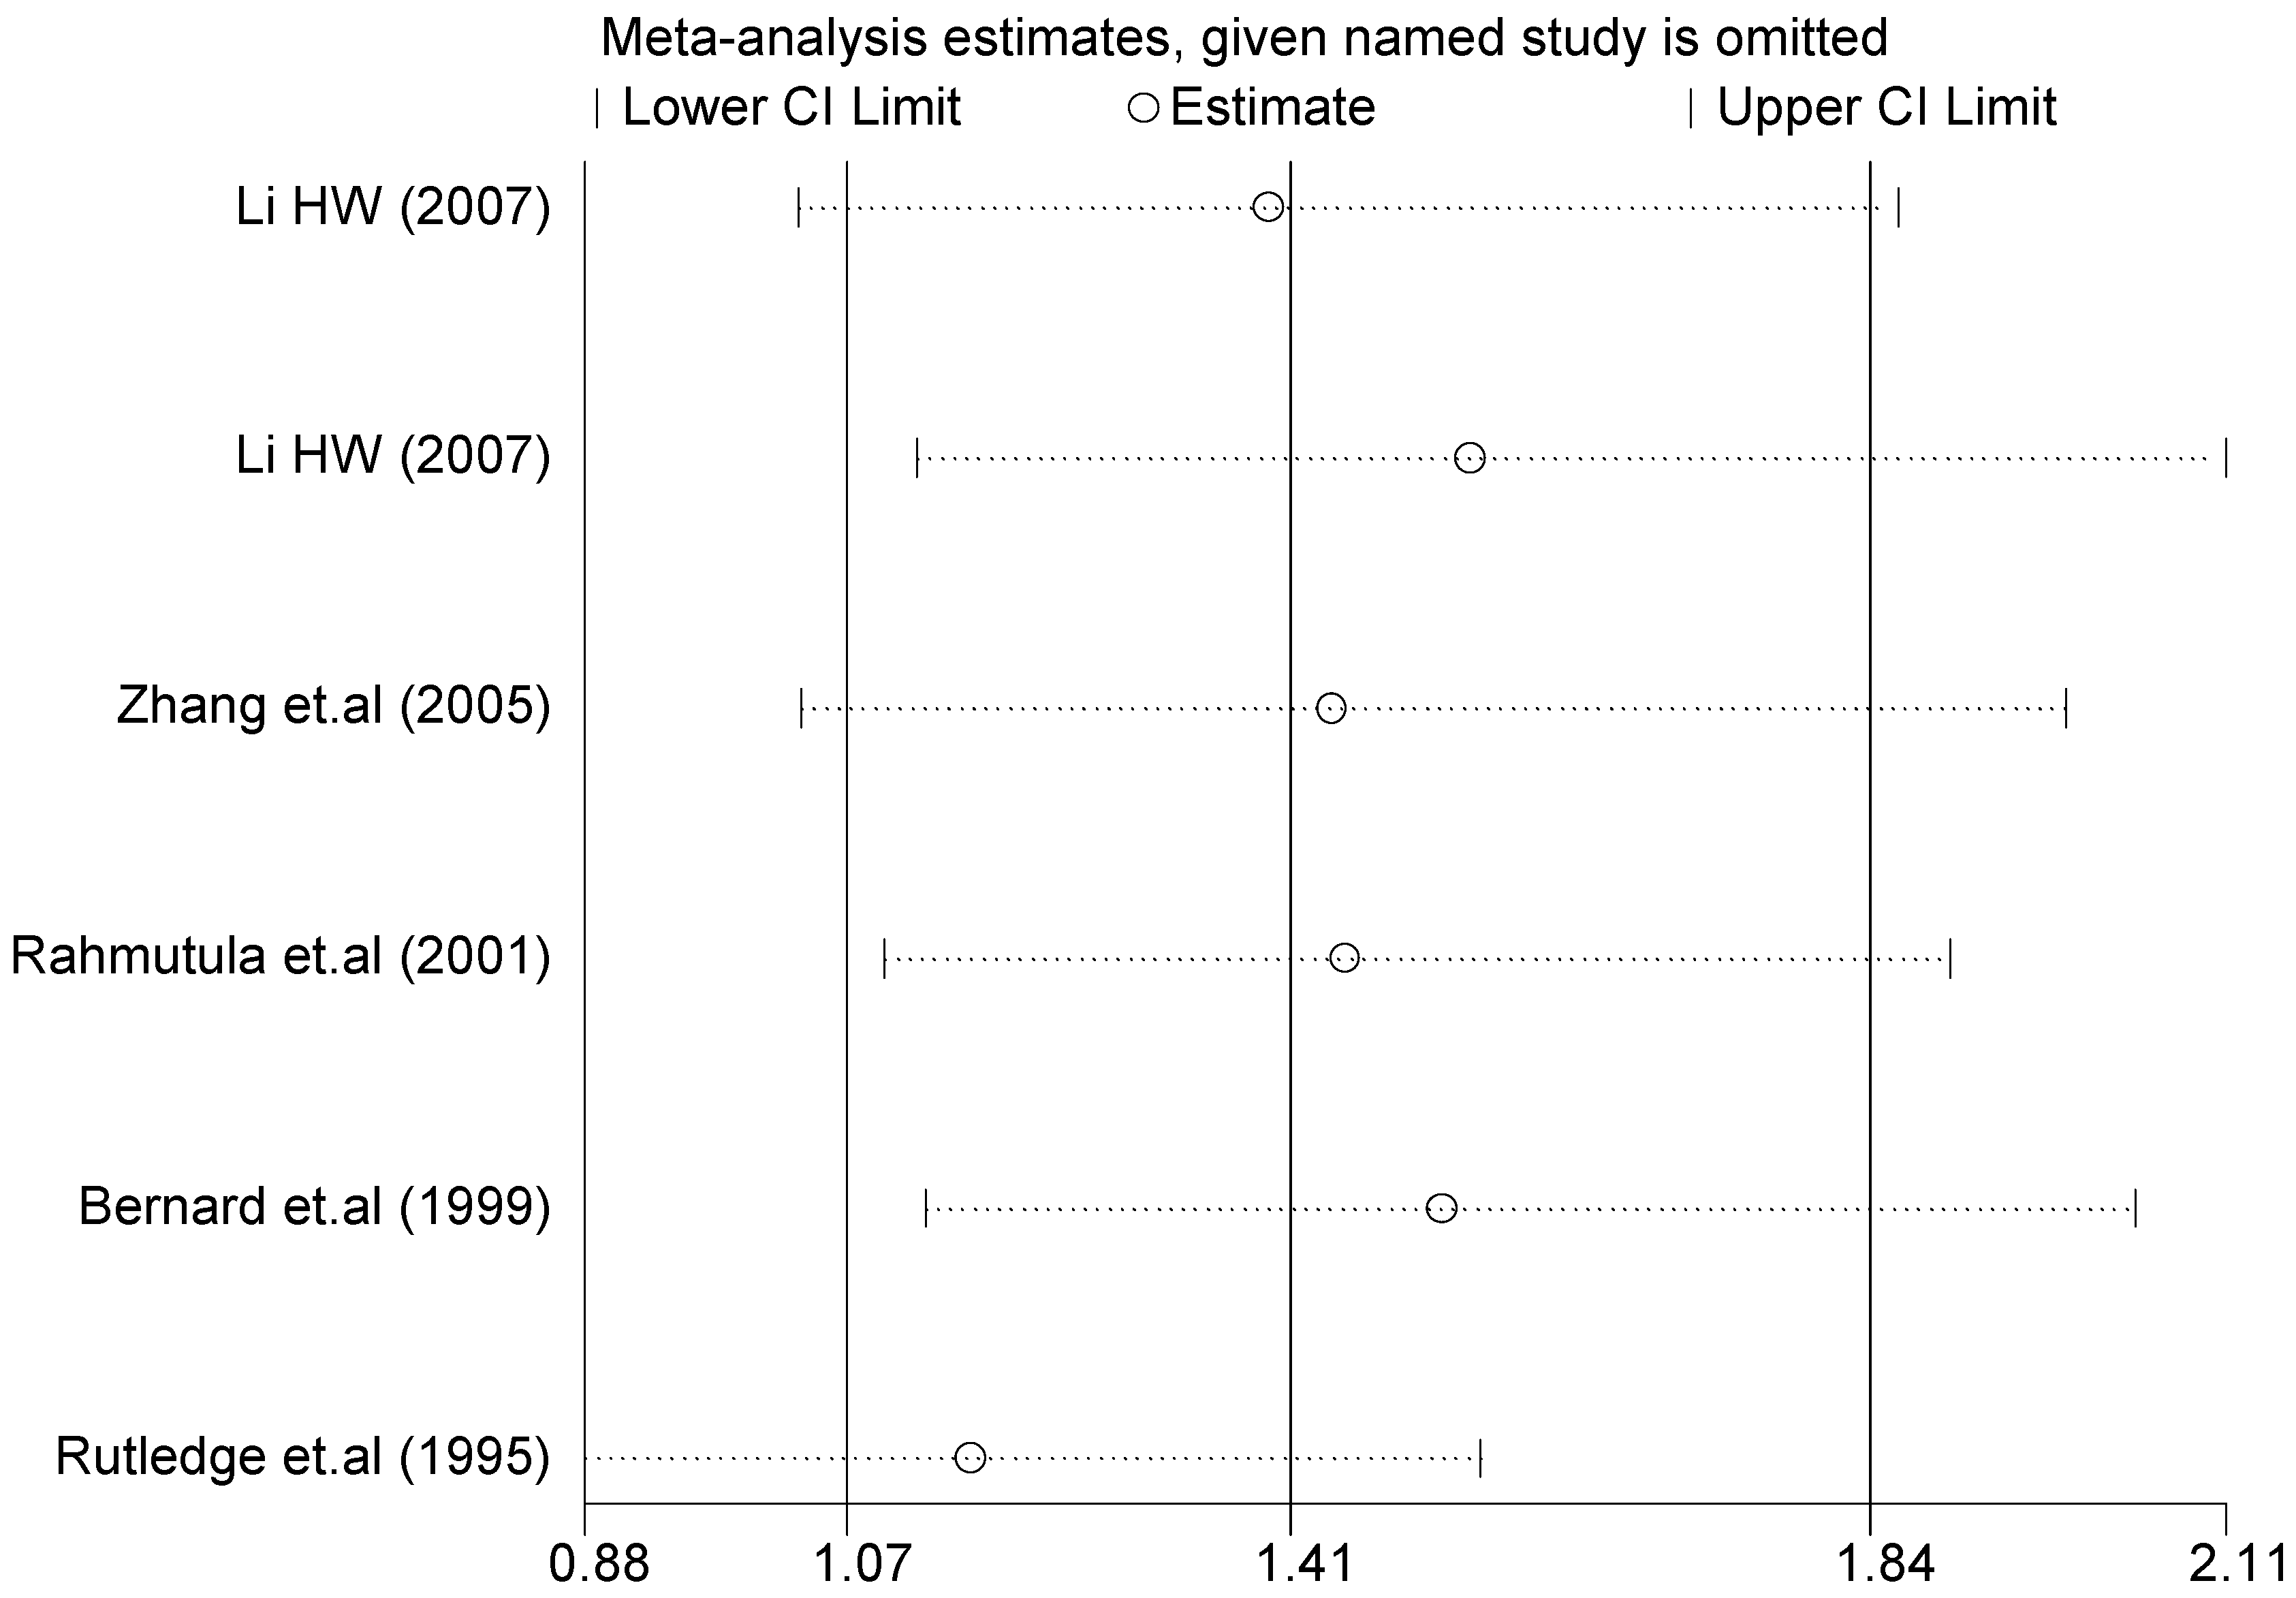
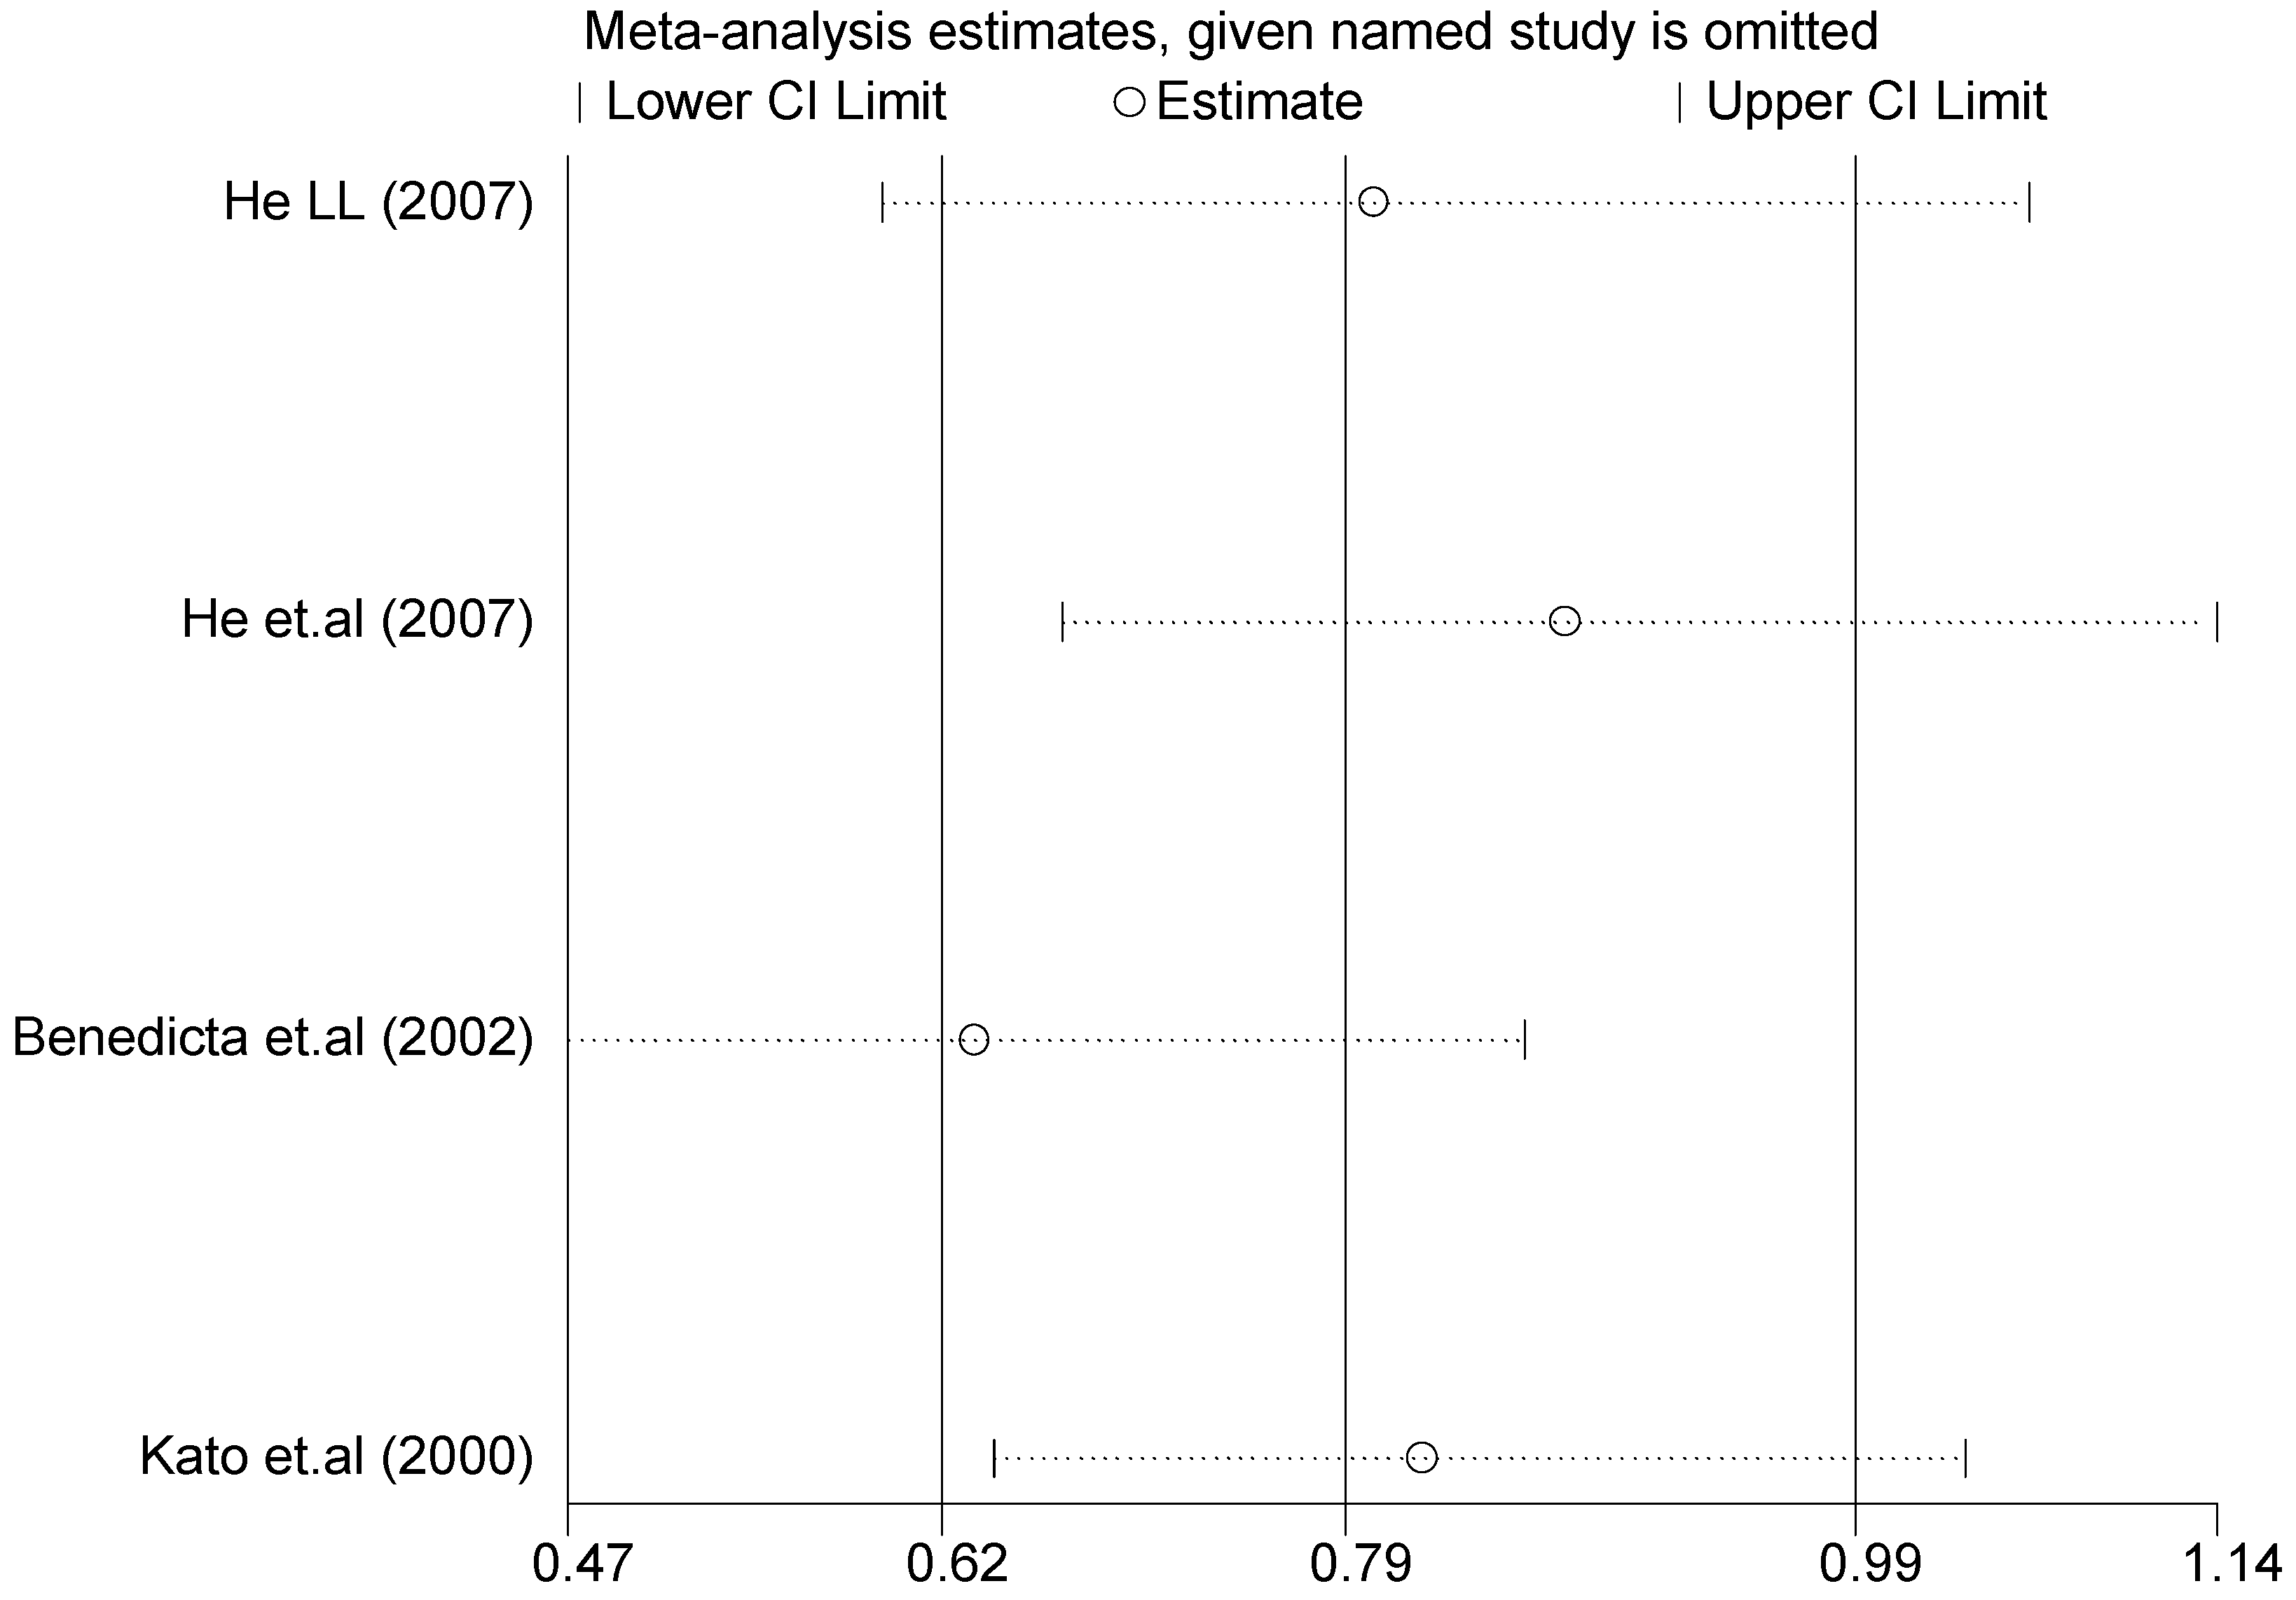
3.3. Sensitivity Analysis
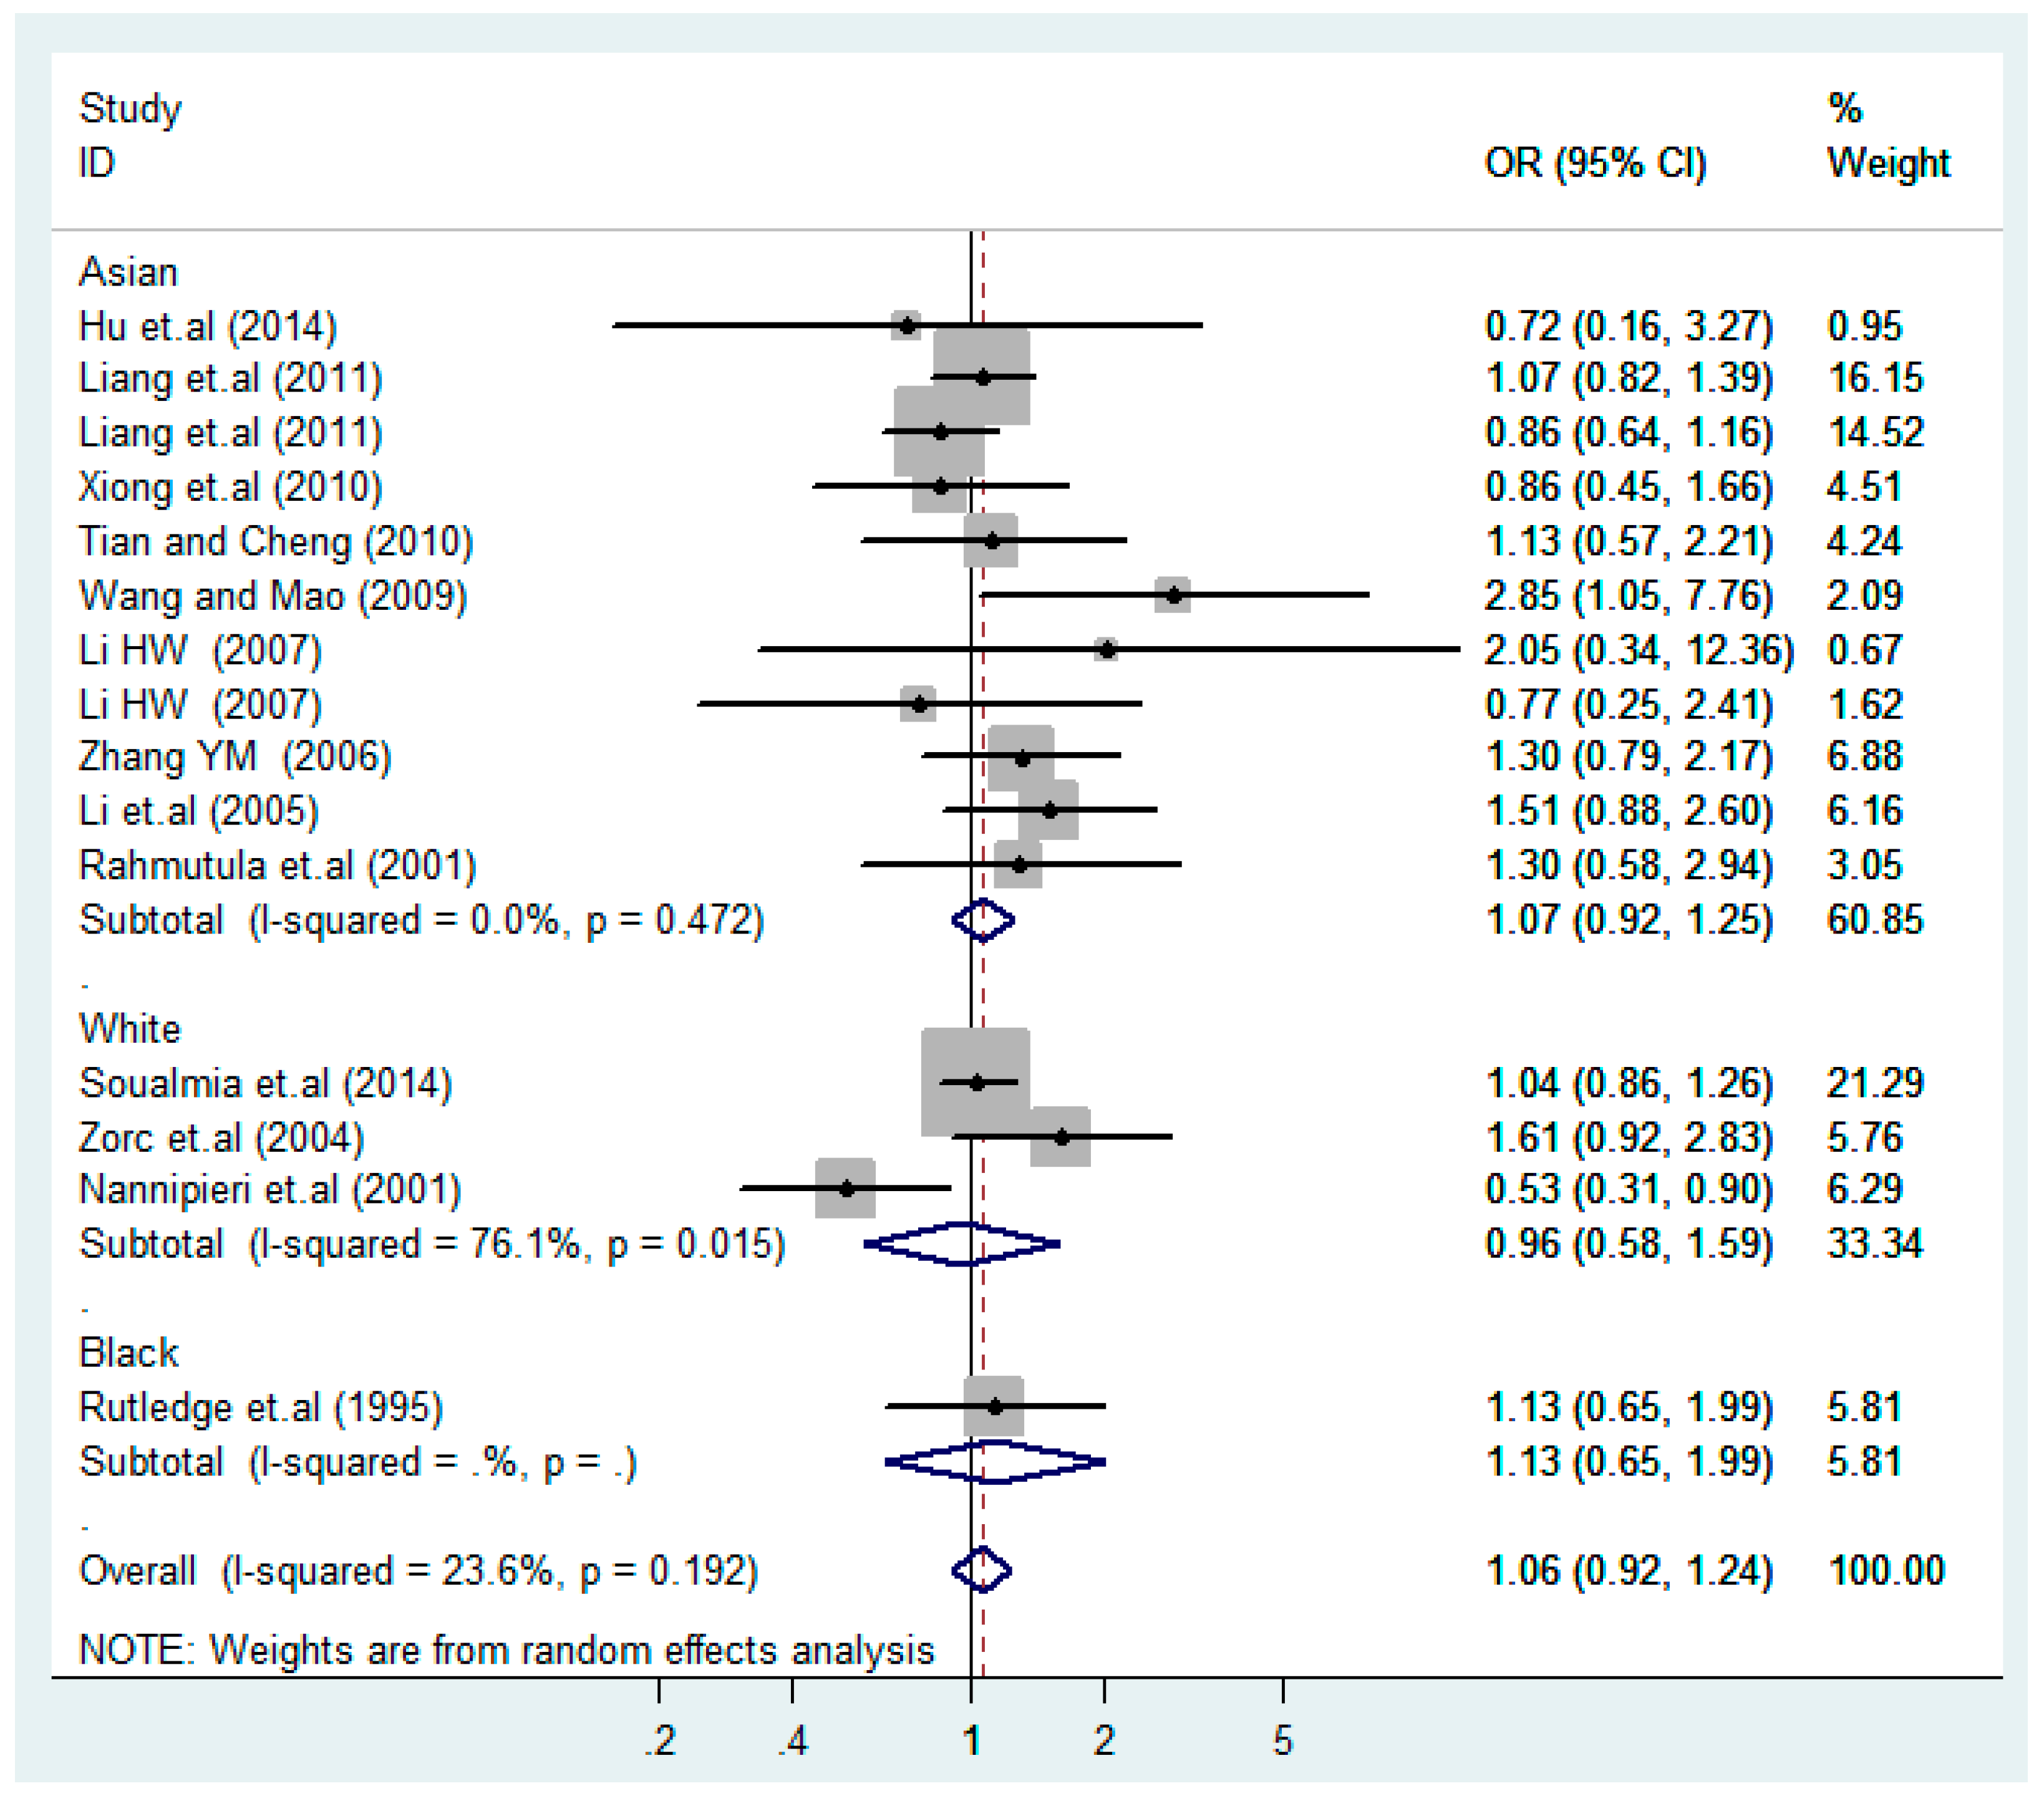
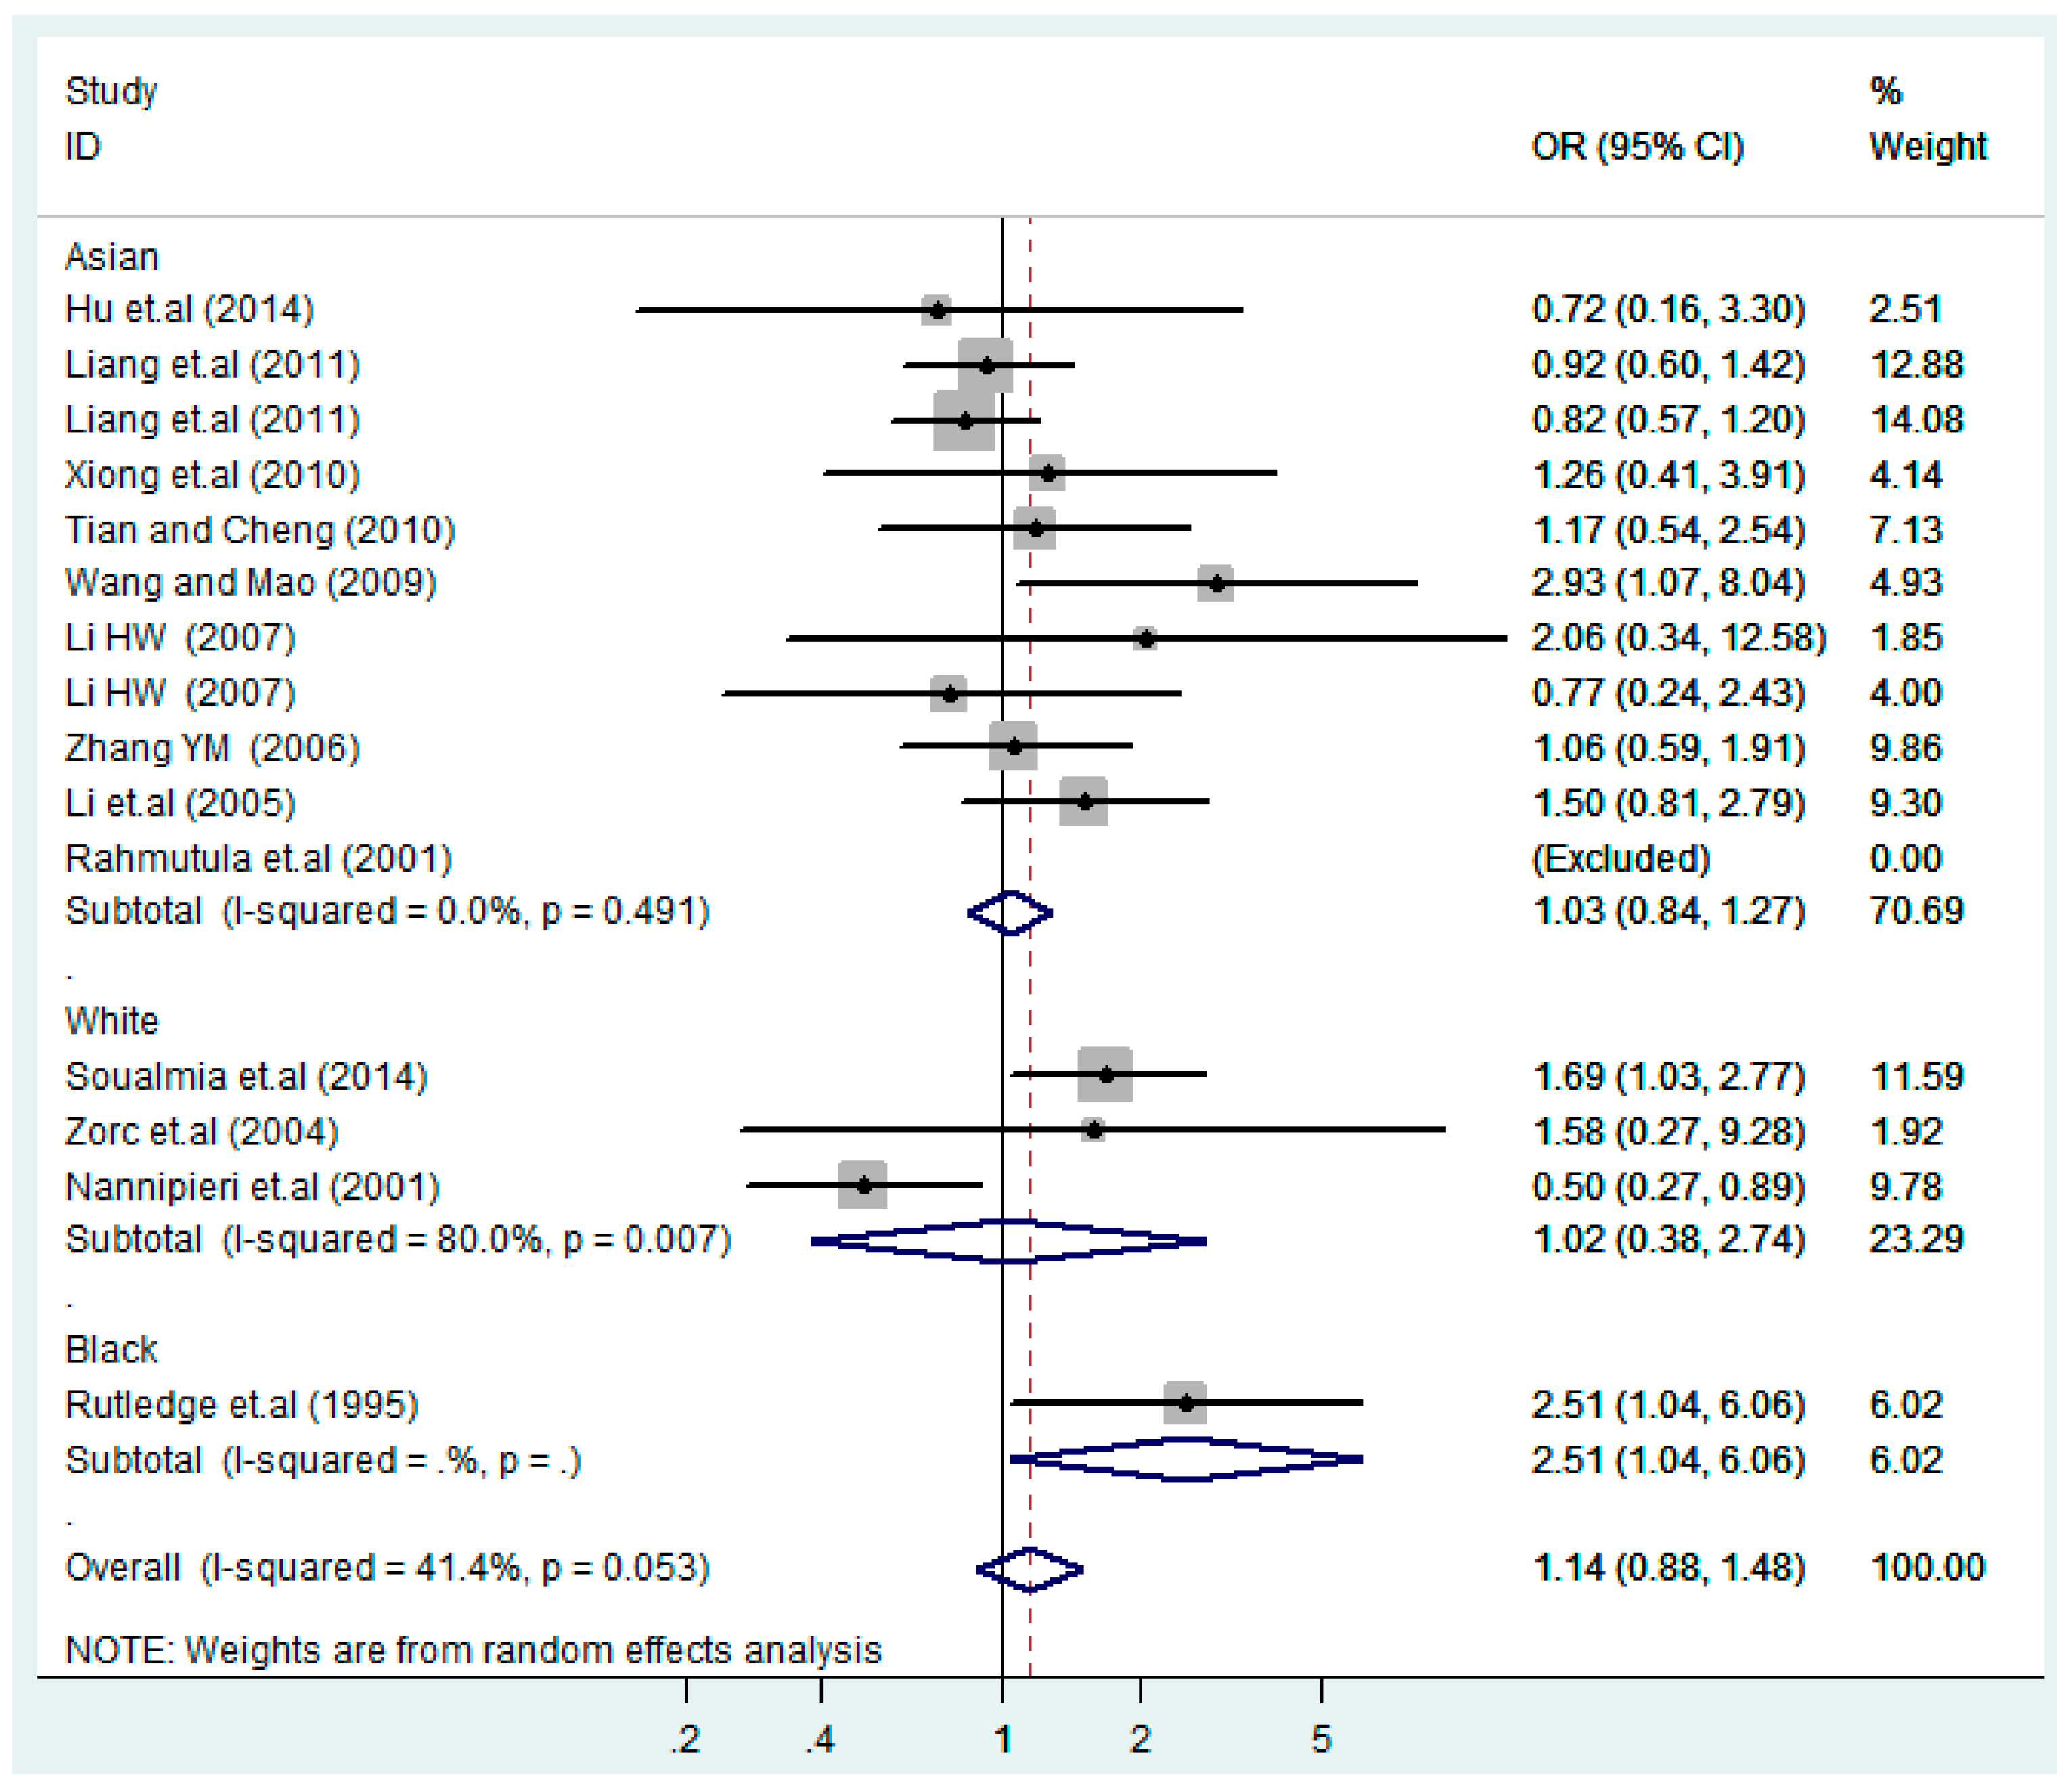
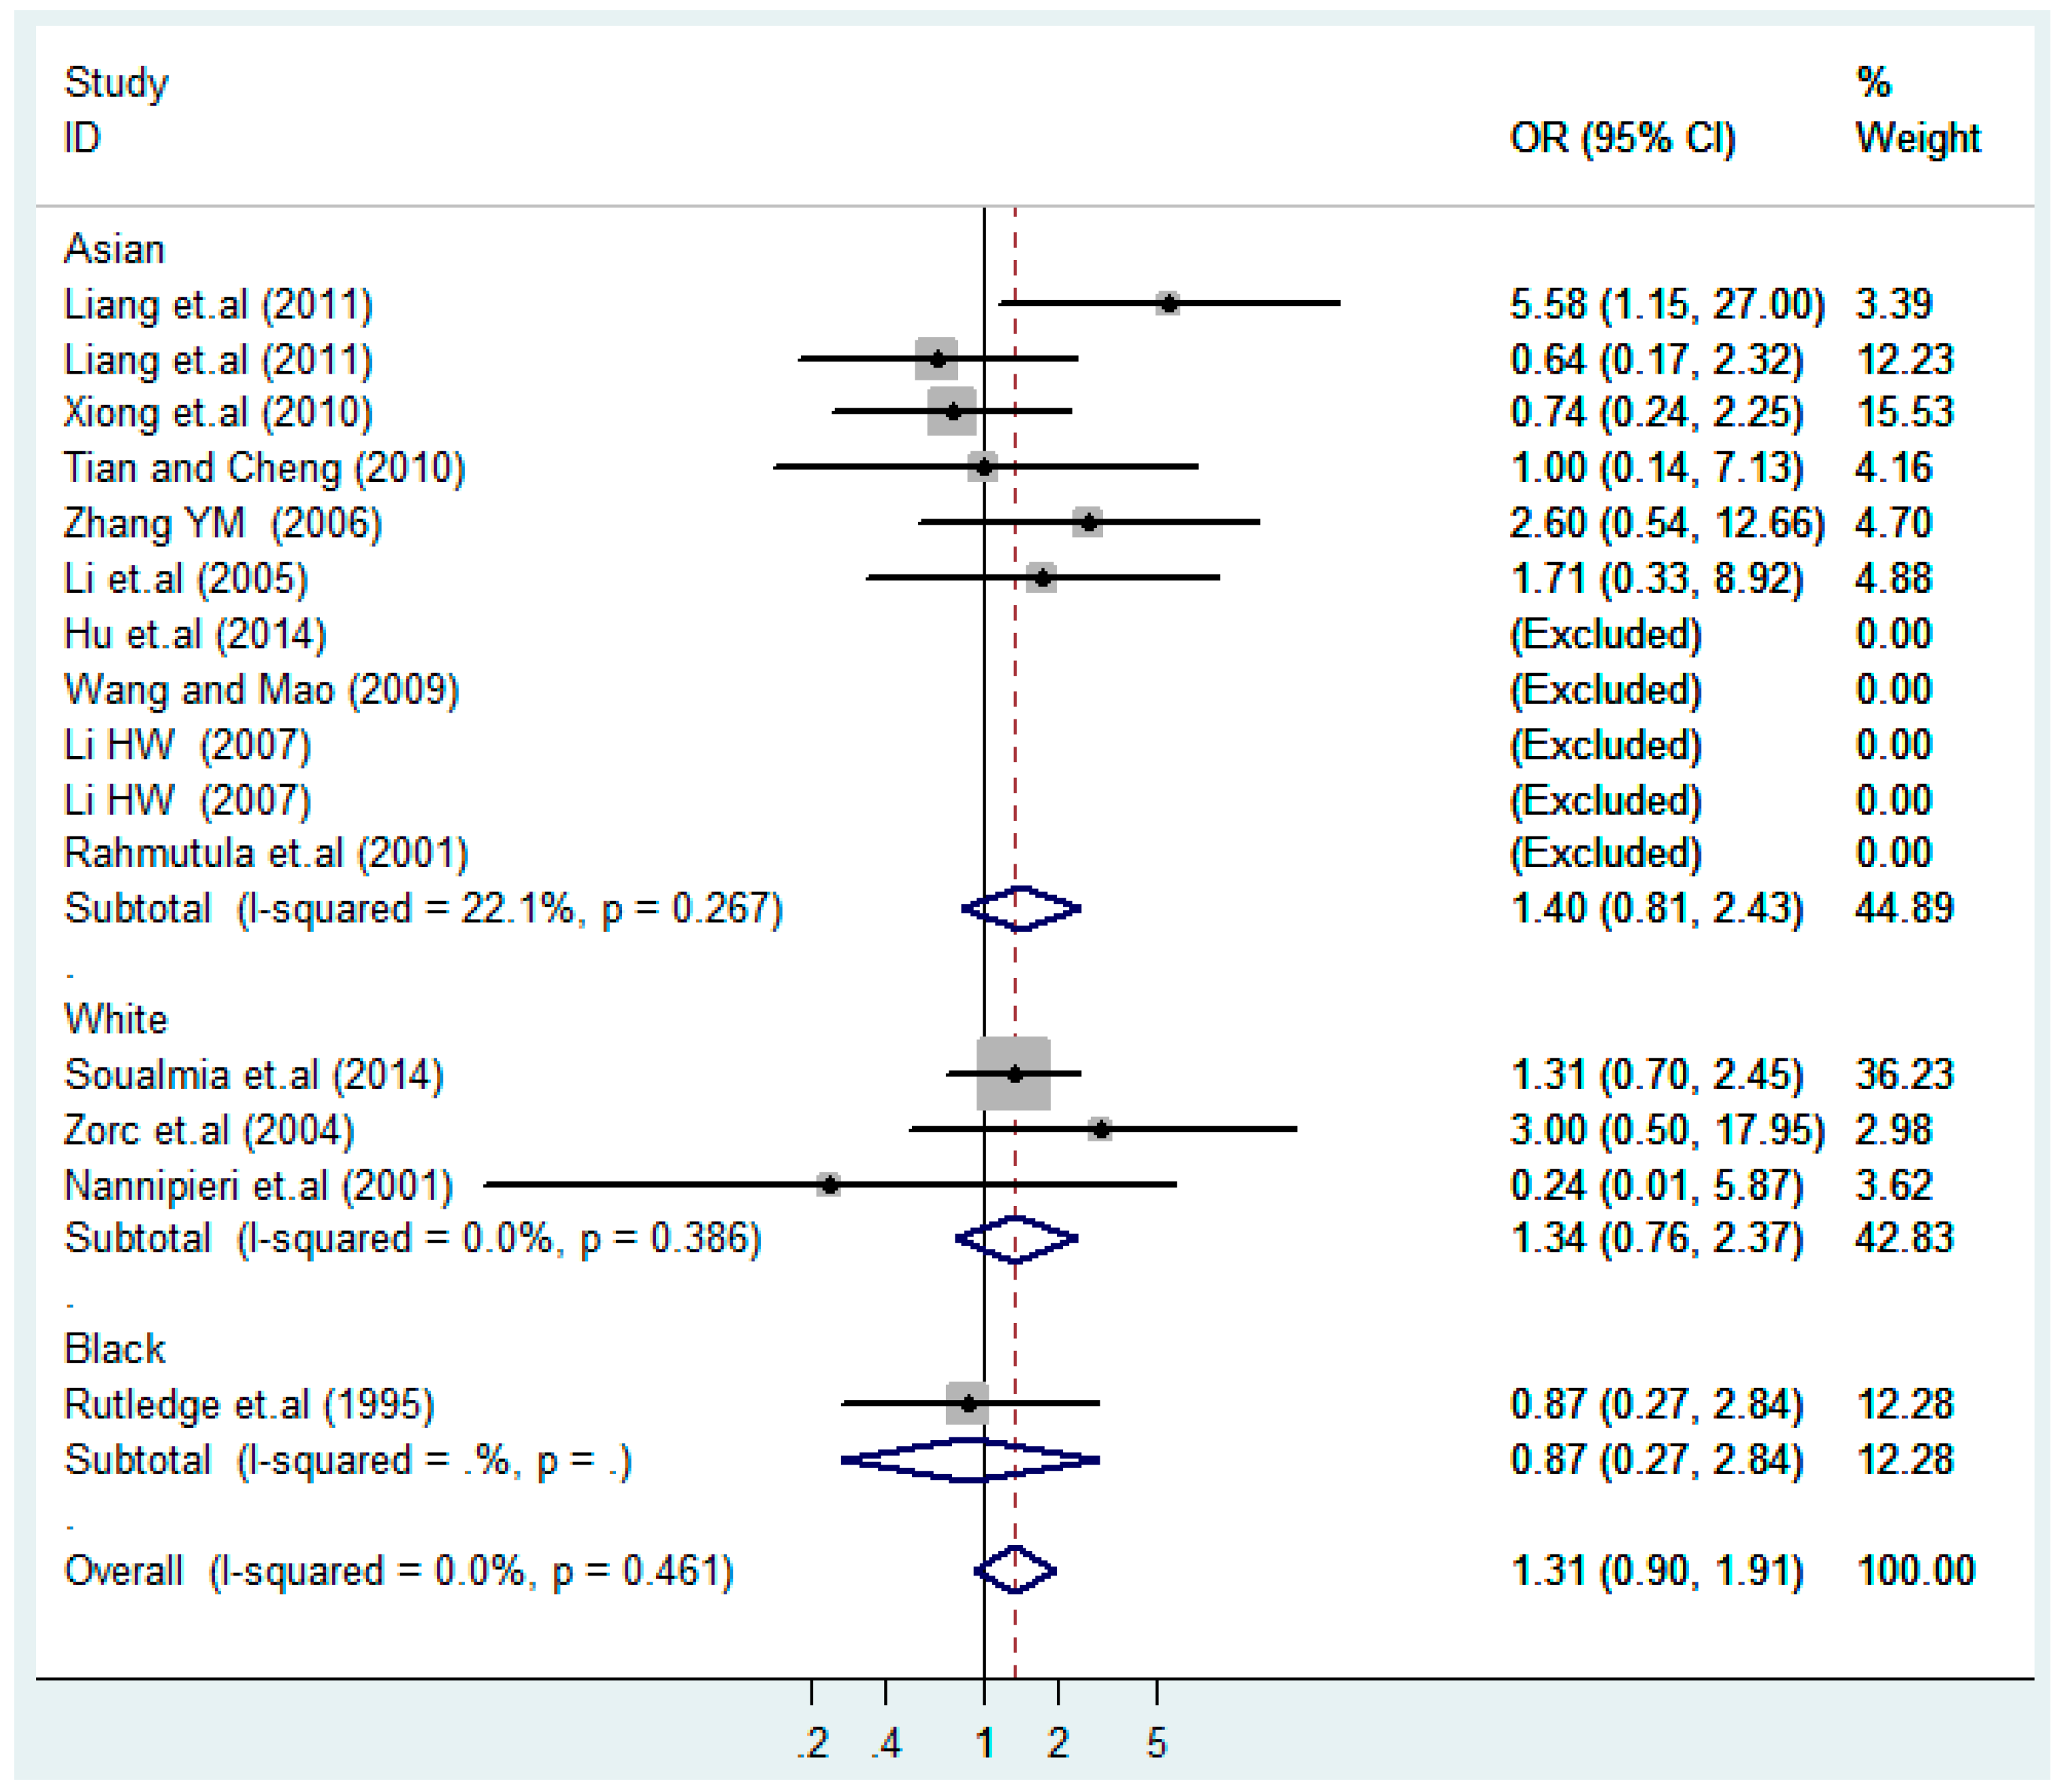
3.4. Subgroup Analysis
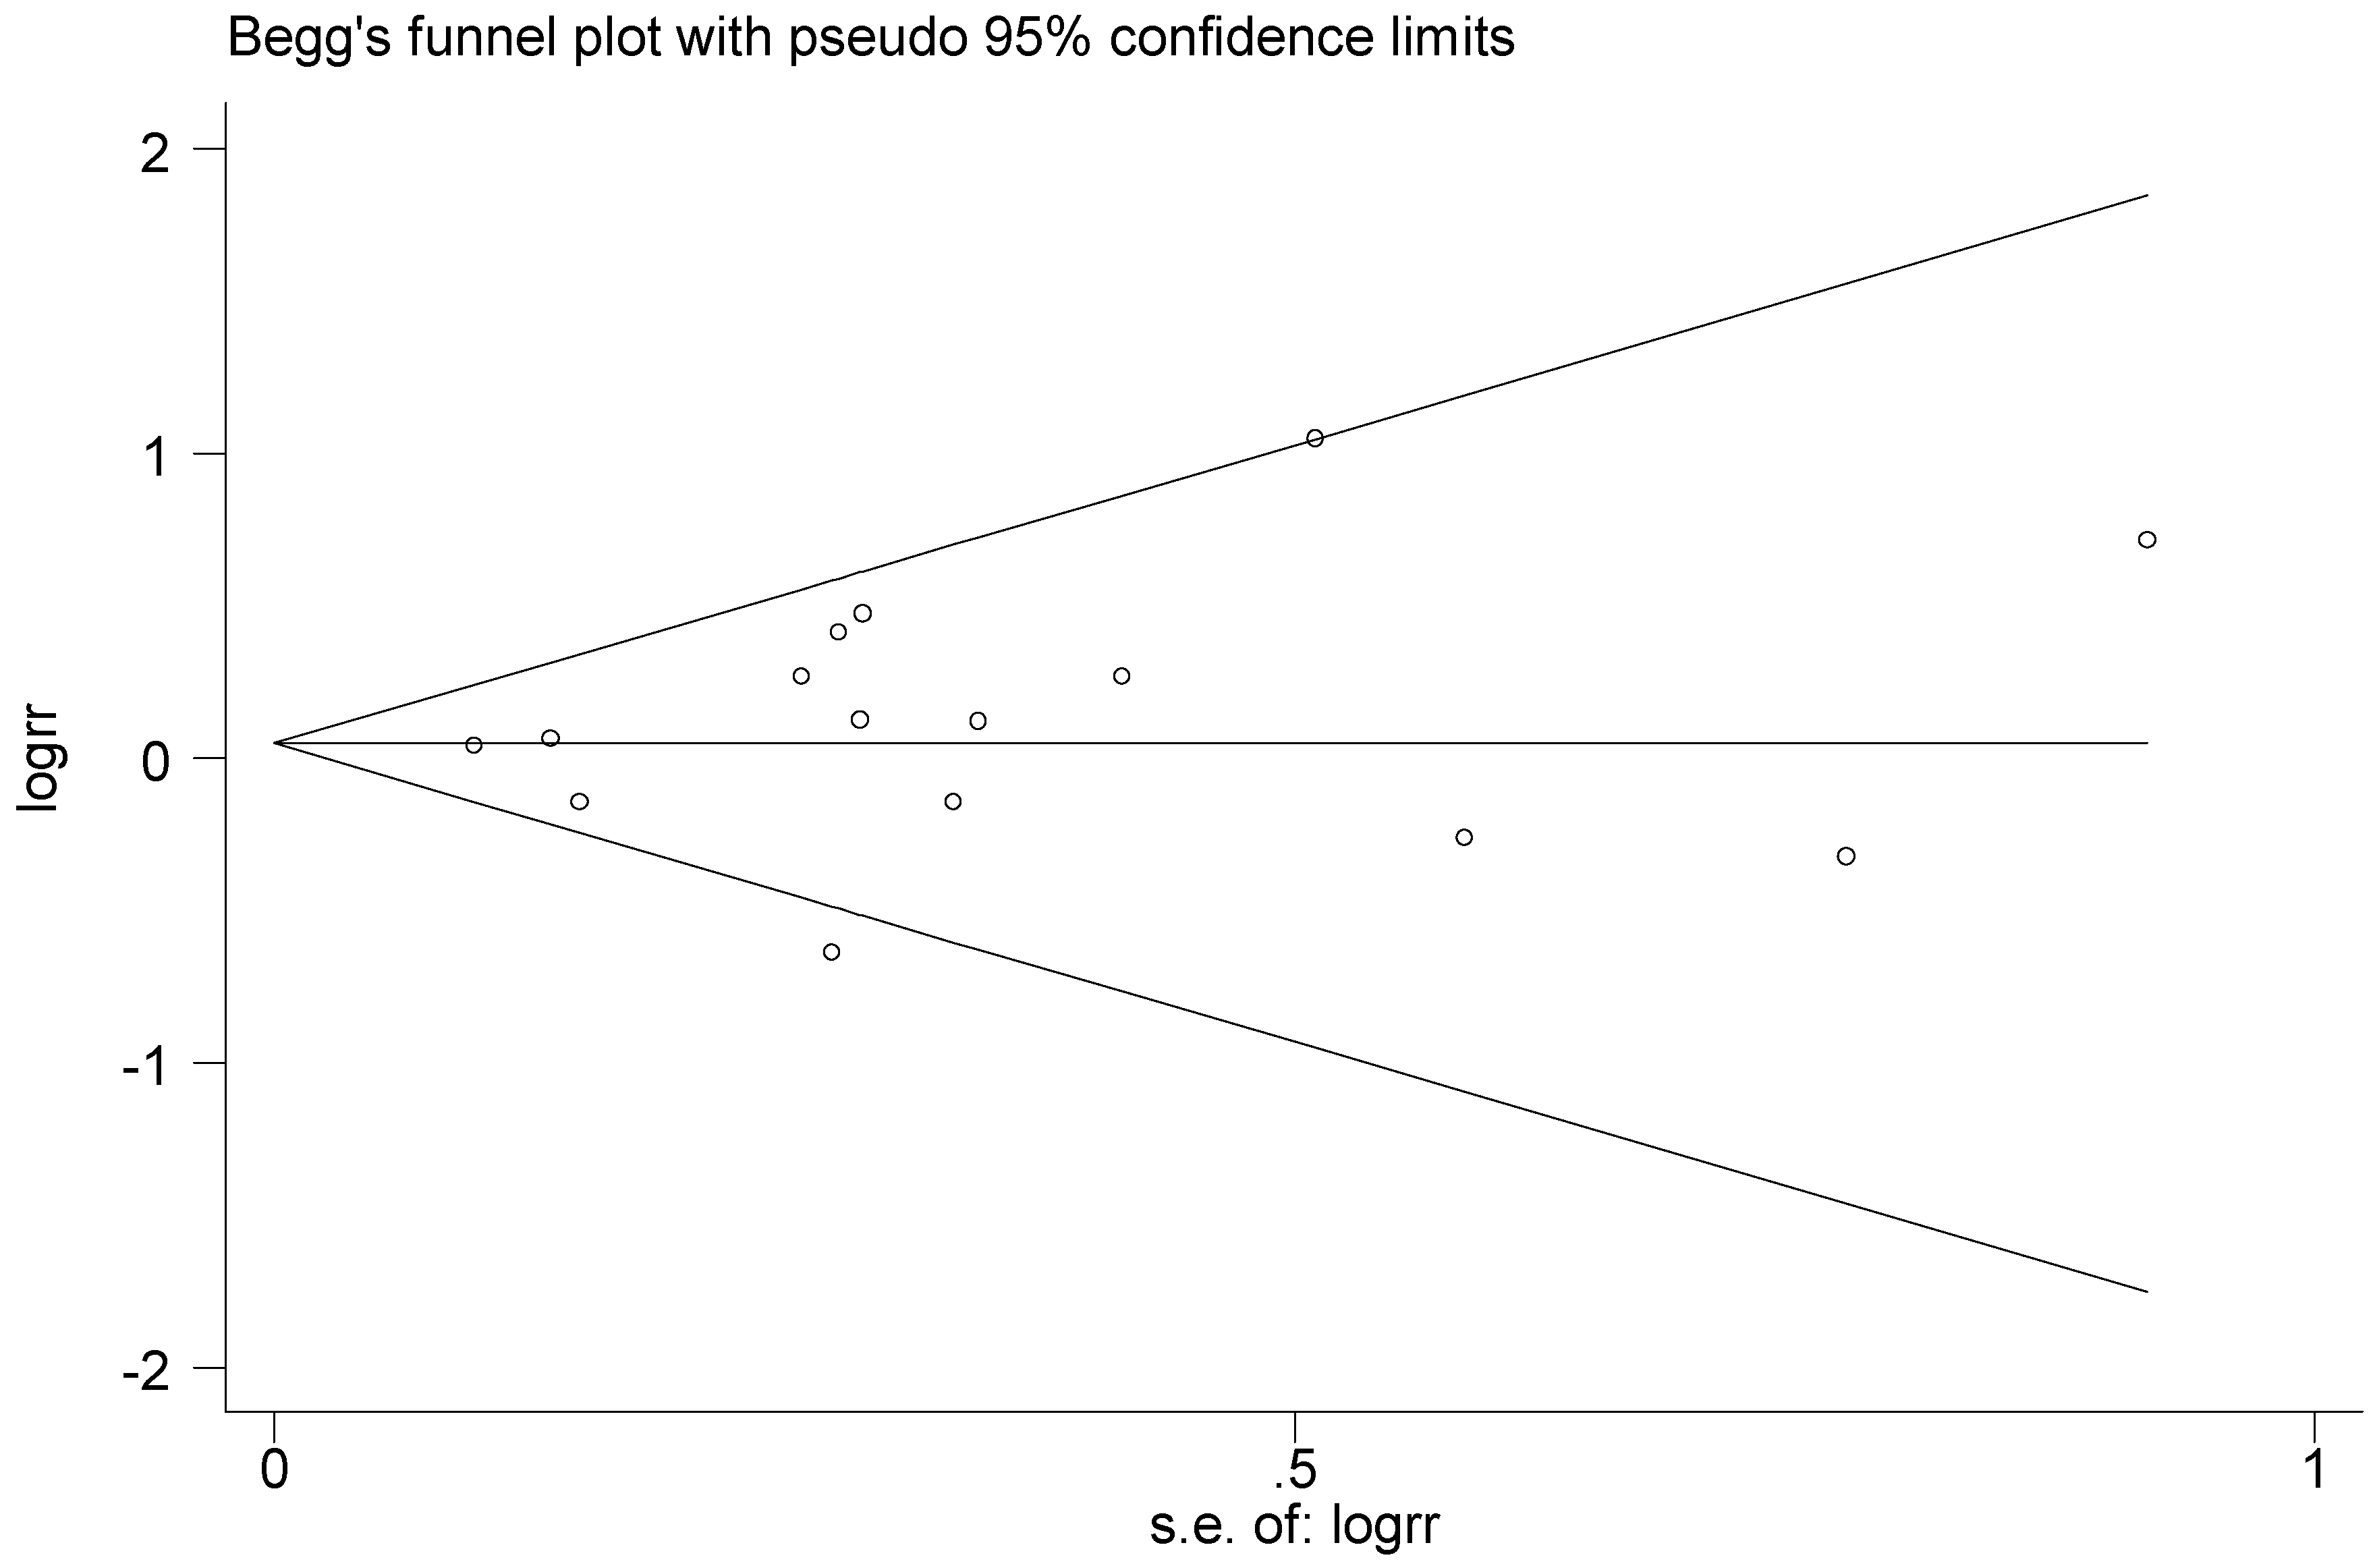
3.5. Publication Bias
4. Discussion
5. Conclusions
Acknowledgments
Author Contributions
Conflicts of Interest
References
- Franceschini, N.; Reiner, A.P.; Heiss, G. Recent findings in the genetics of blood pressure and hypertension traits. Am. J. Hypertens 2011, 24, 392–400. [Google Scholar] [CrossRef] [PubMed]
- Kearney, P.M.; Whelton, M.; Reynolds, K.; Muntner, P.; Whelton, P.K.; He, J. Global burden of hypertension: Analysis of worldwide data. Lancet 2005, 365, 217–223. [Google Scholar] [CrossRef]
- Hajjar, I.; Kotchen, T.A. Trends in prevalence, awareness, treatment, and control of hypertension in the United States, 1988–2000. JAMA 2003, 290, 199–206. [Google Scholar] [CrossRef] [PubMed]
- Lloyd-Jones, D.; Adams, R.; Carnethon, M.; De Simone, G.; Ferguson, T.B.; Flegal, K.; Ford, E.; Furie, K.; Go, A.; Greenlund, K.; et al. Heart disease and stroke statistics—2009 update: A report from the American Heart Association Statistics Committee and Stroke Statistics Subcommittee. Circulation 2009, 119, e21–e181. [Google Scholar] [PubMed]
- Takahashi, N.; Smithies, O. Gene targeting approaches to analyzing hypertension. J. Am. Soc. Nephrol. 1999, 10, 1598–1605. [Google Scholar] [PubMed]
- Ilhan, N.; Kucuksu, M.; Kaman, D.; Ilhan, N.; Ozbay, Y. The 677 C/T MTHFR polymorphism is associated with essential hypertension, coronary artery disease, and higher homocysteine levels. Arch. Med. Res. 2008, 39, 125–130. [Google Scholar] [CrossRef] [PubMed]
- Bulut, D.; Potthast, R.; Hanefeld, C.; Schulz, T.; Kuhn, M.; Mügge, A. Impaired vasodilator responses to atrial natriuretic peptide in essential hypertension. Eur. J. Clin. Invest. 2003, 33, 567–573. [Google Scholar] [CrossRef] [PubMed]
- Tanira, M.O.; Al, B.K. Genetic variations related to hypertension: A review. J. Hum. Hypertens 2005, 19, 7–19. [Google Scholar] [CrossRef] [PubMed]
- Nakayama, T. The genetic contribution of the natriuretic peptide system to cardiovascular diseases. Endocr J. 2005, 52, 11–21. [Google Scholar] [CrossRef] [PubMed]
- Kishimoto, I.; Rossi, K.; Garbers, D.L. A genetic model provides evidence that the receptor for atrial natriuretic peptide (guanylyl cyclase-A) inhibits cardiac ventricular myocyte hypertrophy. Proc. Natl. Acad. Sci. USA 2001, 98, 2703–2706. [Google Scholar] [CrossRef] [PubMed]
- Rubattu, S.; De Giusti, M.; Farcomeni, A.; Abbolito, S.; Comito, F.; Cangianiello, S.; Greco, E.S.; Dito, E.; Pagliaro, B.; Cotugno, M.; et al. T2238C ANP gene variant and risk of recurrent acute coronary syndromes in an Italian cohort of ischemic heart disease patients. J. Cardiovasc. Med. (Hagerstown) 2014. [Google Scholar] [CrossRef] [PubMed]
- Zhang, L.; Cheng, L.; He, M.; Hu, B.; Wu, T. ANP T2238C, C-664G gene polymorphism and coronary heart disease in Chinese population. J. Huazhong Univ. Sci. Technolog. Med. Sci. 2006, 26, 528–530. [Google Scholar] [CrossRef] [PubMed]
- Qureshi, S.F.; Ali, A.; Venkateshwari, A.; Rao, H.; Jayakrishnan, M.P.; Narasimhan, C.; Shenthar, J.; Thangaraj, K.; Nallari, P. Atrial natriuretic peptide gene—A potential biomarker for long QT syndrome. EXCLI J. 2014, 13, 834–842. [Google Scholar] [PubMed]
- Soualmiaa, H.; Ayadi, I.; Kallel, A. ScaI atrial natriuretic peptide gene polymorphism and hypertension in the Tunisian population. Int. J. Sci. Basic Appl. Res. (IJSBAR) 2014, 16, 232–241. [Google Scholar]
- Conen, D.; Cheng, S.; Steiner, L.L.; Buring, J.E.; Ridker, P.M.; Zee, R.Y. Association of 77 polymorphisms in 52 candidate genes with blood pressure progression and incident hypertension: the Women’s Genome Health Study. J. Hypertens. 2009, 27, 476–483. [Google Scholar] [CrossRef] [PubMed]
- Zhang, S.; Mao, G.; Zhang, Y.; Tang, G.; Wen, Y.; Hong, X.; Jiang, S.; Yu, Y.; Xu, X. Association between human atrial natriuretic peptide Val7Met polymorphism and baseline blood pressure, plasma trough irbesartan concentrations, and the antihypertensive efficacy of irbesartan in rural Chinese patients with essential hypertension. Clin. Ther. 2005, 27, 1774–1784. [Google Scholar] [CrossRef] [PubMed]
- Hu, D.C.; Zhao, X.L.; Shao, J.C.; Wang, W.; Qian, J.; Chen, A.H.; Zhang, H.Q.; Guo, H.; Jiang, J.; Li, H.Y. Interaction of six candidate genes in essential hypertension. Genet Mol. Res. 2014, 13, 8385–8395. [Google Scholar] [CrossRef] [PubMed]
- Rubattu, S.; Sciarretta, S.; Volpe, M. Atrial natriuretic peptide gene variants and circulating levels: Implications in cardiovascular diseases. Clin. Sci. (Lond.) 2014, 127, 1–13. [Google Scholar] [CrossRef] [PubMed]
- Stang, A. Critical evaluation of the Newcastle-Ottawa scale for the assessment of the quality of nonrandomized studies in meta-analyses. Eur. J. Epidemiol. 2010, 25, 603–605. [Google Scholar] [CrossRef] [PubMed]
- Liang, X.; Xu, X.; He, L. Association of gene polymorphism of atrial natriuretic peptide with essential hypertension in Han and Kazakh population in Xingjiang. J. Chin. Pract. Diagn. Ther. 2011, 25, 11–13. [Google Scholar]
- Xiong, W.; Luo, Y.; Yang, C. Clinical analysis of essential hypertension-related gene polymorphism. Chin. J. Gerontol. 2010, 30, 3276–3277. [Google Scholar]
- Tian, C.; Cheng, L. Association of Polymorphisms in Atrial and Brain Natriuretic Peptide Gene with Essential Hypertension. Huazhong Univ. Sci. Technol. (Med. Sci.) 2010, 39, 13–17. [Google Scholar]
- Wang, Z.; Mao, Y. The relationship between endothelial atrial natriuretic peptide T2238C and type-C natriuretic peptide receptor A-55Cgene polymorphisms and essential hypertension in elderly. J. Clin. Med. 2009, 26, 620–622. [Google Scholar]
- Li, H. The Correlation between Atrial Natriuretic Peptide Gene Single Nucleotide Polymorphism and Essential Hypertention of Hani and Yi Minority Group in Yunnan Province. Ph.D. Thesis, Yunnan University Genetics, Kunming, China, 20 May 2007. [Google Scholar]
- Zhang, Y. The Relationship Study bewteen ANP Gene and Essential Hypertension in Xinjiang Kazakhs. Ph.D. Thesis, Xinjiang Medical University, Xinjiaing, China, 29 May 2006. [Google Scholar]
- Li, N.; Zhang, Y.; Li, T.; Zhou, L. The relationship between ANP gene T2238C polymorphism and essential hypertention in xinjiang Kazakans. J. Clin. Cardiol. 2005, 21, 513–515. [Google Scholar]
- Zorc-Pleskovic, R.; Bidovec, M.; Bregar, D.; Milutinović, A.; Terzić, R.; Teran, N. The ScaI gene polymorphism of the atrial natriuretic factor and essential arterial hypertension in childhood. Coll Antropol. 2004, 28, 617–621. [Google Scholar] [PubMed]
- Nannipieri, M.; Manganiello, M.; Pezzatini, A.; De Bellis, A.; Seghieri, G.; Ferrannini, E. Polymorphisms in the hANP (human atrial natriuretic peptide) gene, albuminuria, and hypertension. Hypertension 2001, 37, 1416–1422. [Google Scholar] [CrossRef] [PubMed]
- Rahmutula, D.; Nakayama, T.; Soma, M.; Takahashi, Y.; Kunimoto, M.; Uwabo, J.; Sato, M.; Izumi, Y.; Kanmatsuse, K.; Ozawa, Y. Association study between the variants of the human ANP gene and essential hypertension. Hypertens Res. 2001, 24, 291–294. [Google Scholar] [CrossRef] [PubMed]
- Rutledge, D.R.; Sun, Y.; Ross, E.A. Polymorphisms within the atrial natriuretic peptide gene in essential hypertension. J. Hypertens 1995, 13, 953–955. [Google Scholar] [CrossRef] [PubMed]
- Zhang, Y.; Li, N.; Li, T.; Zhou, L.; Zhang, D.; Li, H.; Zhou, K. The relationship bewteen the ANP gene G1837A polymorphism and essential hypertension in Xinjiang Kazakans. Sci. Technol. Engineer 2005, 5, 1070–1072. [Google Scholar]
- Cheung, B.M.; Leung, R.; Shiu, S.; Tan, K.C.B.; Lau, C.-P.; Kumana, C.R. HpaII polymorphism in the atrial natriuretic peptide gene and hypertension. Am. J. Hypertens 1999, 12, 524–527. [Google Scholar] [CrossRef]
- He, L. Relationship Study bewteen ANP Gene Polymorphism and Essential Hypertension in Xinjiang Kazakhs. Ph.D. Thesis, Xinjiang Medical University, Xinjiang, China, 28 May 2007. [Google Scholar]
- He, L.; Xu, X.; Liang, X. Association of the T1766C polymorphism of atrial natriuretic peptide gene with essential hypertension in Xinjiang Kazakh. J. Xinjiang Med. Univ. 2007, 29, 967–969. [Google Scholar]
- Nkeh, B.; Tiago, A.; Candy, G.P.; Woodiwiss, A.J.; Badenhorst, D.; Luker, F.; Netjhardt, M.; Brooksbank, R.; Libhaber, C.; Sareli, P.; et al. Association between an atrial natriuretic peptide gene polymorphism and normal blood pressure in subjects of African ancestry. Cardiovasc. J. South Afr. 2002, 13, 97–101. [Google Scholar]
- Kato, N.; Sugiyama, T.; Morita, H.; Nabika, T.; Kurihara, H.; Yamori, Y.; Yazaki, Y. Genetic analysis of the atrial natriuretic peptide gene in essential hypertension. Clin. Sci. 2000, 98, 251–258. [Google Scholar] [CrossRef] [PubMed]
- Robert, Y.L.; Lou, Z.Y.; Griffiths, L.R.; Griffiths, L.R.; Morris, B.J. Molecular genetic analyses of RFLPs for PCR-Amplified growth hormone gene, renal kallikrein gene and atrial natriuretic factor gene in essential hypertension. Hypertens Res. 1993, 16, 113–120. [Google Scholar]
- Niu, W. The relationship between natriuretic peptide precursor a gene T2238C polymorphism and hypertension: A Meta-Analysis. Int. J. Hypertens 2011, 2011, 653698. [Google Scholar] [CrossRef] [PubMed]


| Author | Year | Locus | Source | Country | Ethnicity | Number | Genotyping Methods | Quality Score | ||
|---|---|---|---|---|---|---|---|---|---|---|
| T2238C | Case | Control | Case | Control | ||||||
| Hu et al. [17] | 2014 | H-B | H-B | China | Asian (Han) | 100 | 97 | Gene chips | 6 | |
| Soualmia et al. [14] | 2014 | H-B | P-B | Tunisia | White (Tunisian) | 384 | 453 | PCR-RFLP | 7 | |
| Liang et al. [20] | 2011 | P-B | P-B | China | Asian (Han) | 205 | 260 | PCR-RFLP | 6 | |
| Liang et al. [20] | 2011 | P-B | P-B | China | Asian (Kazakh) | 218 | 232 | PCR-RFLP | 6 | |
| Xiong et al. [21] | 2010 | H-B | H-B | China | Asian (Han) | 81 | 120 | Gene chips | 5 | |
| Tian and Cheng [22] | 2010 | H-B | P-B | China | Asian (Han) | 976 | 976 | Q-PCR | 6 | |
| Wang and Mao [23] | 2009 | H-B | H-B | China | Asian (Han) | 238 | 184 | Gene chips | 4 | |
| Li [24] | 2007 | P-B | P-B | China | Asian (Yi) | 99 | 134 | PCR | 5 | |
| Li [24] | 2007 | P-B | P-B | China | Asian (Hani) | 172 | 133 | PCR | 5 | |
| Zhang YM [25] | 2006 | P-B | P-B | China | Asian (Kazakh) | 314 | 229 | PCR-RFLP | 6 | |
| Li et.al. [26] | 2005 | P-B | P-B | China | Asian (Kazakh) | 313 | 205 | PCR-RFLP | 6 | |
| Zorc et.al. [27] | 2004 | H-B | H-B | Slovenia | Caucasian | 58 | 57 | PCR | 6 | |
| Nannipieri et.al. [28] | 2001 | P-B | P-B | Europeans | White | 121 | 105 | PCR-RFLP | 6 | |
| Rahmutula et.al. [29] | 2001 | H-B | H-B | Japan | Asian | 233 | 213 | PCR | 3 | |
| Rutledge et.al. [30] | 1995 | H-B | P-B | American | Black | 60 | 44 | PCR | 6 | |
| G1837A | case | control | case | control | ||||||
| Li [24] | 2007 | P-B | P-B | China | Asian (Yi) | 99 | 134 | PCR | 5 | |
| Li [24] | 2007 | P-B | P-B | China | Asian (Hani) | 172 | 133 | PCR | 5 | |
| Zhang et.al. [31] | 2005 | P-B | P-B | China | Asian (Kazakh) | 287 | 190 | PCR-RFLP | 5 | |
| Rahmutula et.al. [29] | 2001 | H-B | H-B | Japan | Asian | 233 | 213 | PCR | 3 | |
| Bernard et.al. [32] | 1999 | H-B | P-B | China | Asian | 108 | 109 | PCR | 6 | |
| Rutledge et.al. [30] | 1995 | H-B | P-B | American | Black | 60 | 44 | PCR | 6 | |
| T1766C | case | control | case | control | ||||||
| He [33] | 2007 | P-B | P-B | China | Asian (Kazakh) | 199 | 198 | PCR-RFLP | 5 | |
| He et.al. [34] | 2007 | P-B | P-B | China | Asian (Kazakh) | 246 | 244 | PCR-RFLP | 5 | |
| Benedicta et.al. [35] | 2002 | H-B | P-B | African | Black | 289 | 278 | PCR-RFLP | 6 | |
| Kato et.al. [36] | 2000 | H-B | H-B | Japan | Asian | 255 | 225 | PCR | 5 | |
| Author | Year | Locus | Allele Number | Gene Number | HWE | ||||||||
|---|---|---|---|---|---|---|---|---|---|---|---|---|---|
| Case | Control | Case | Control | ||||||||||
| T2238C | T | C | T | C | TT | TC | CC | TT | TC | CC | |||
| Hu et.al. [17] | 2014 | 197 | 3 | 190 | 4 | 97 | 3 | 0 | 93 | 4 | 0 | YES | |
| Soualmia et.al. [14] | 2014 | 372 | 396 | 448 | 458 | 27 | 318 | 39 | 50 | 348 | 55 | NO | |
| Liang et.al. [20] | 2011 | 246 | 164 | 320 | 200 | 50 | 146 | 9 | 62 | 196 | 2 | YES | |
| Liang et.al. [20] | 2011 | 322 | 114 | 329 | 135 | 108 | 106 | 4 | 103 | 123 | 6 | YES | |
| Xiong et.al. [21] | 2010 | 146 | 16 | 213 | 27 | 70 | 6 | 5 | 103 | 7 | 10 | YES | |
| Tian and Cheng [22] | 2010 | 1934 | 18 | 1936 | 16 | 960 | 14 | 2 | 962 | 12 | 2 | YES | |
| Wang and Mao [23] | 2009 | 458 | 18 | 363 | 5 | 220 | 18 | 0 | 179 | 5 | 0 | YES | |
| Li [24] | 2007 | 195 | 3 | 266 | 2 | 96 | 3 | 0 | 132 | 2 | 0 | YES | |
| Li [24] | 2007 | 338 | 6 | 260 | 6 | 166 | 6 | 0 | 127 | 6 | 0 | YES | |
| Zhang YM [25] | 2006 | 584 | 44 | 433 | 25 | 277 | 30 | 7 | 206 | 21 | 2 | YES | |
| Li et.al. [26] | 2005 | 581 | 45 | 390 | 20 | 273 | 35 | 5 | 187 | 16 | 2 | YES | |
| Zorc et.al. [27] | 2004 | 30 | 86 | 41 | 73 | 2 | 26 | 30 | 4 | 33 | 20 | YES | |
| Nannipieri et.al. [28] | 2001 | 216 | 26 | 171 | 39 | 95 | 26 | 0 | 67 | 37 | 1 | YES | |
| Rahmutula et.al. [29] | 2001 | 11 | 455 | 13 | 413 | 0 | 11 | 222 | 0 | 13 | 200 | YES | |
| Rutledge et.al. [30] | 1995 | 70 | 50 | 54 | 34 | 17 | 36 | 7 | 19 | 16 | 9 | YES | |
| G1837A | G | A | G | A | GG | GA | AA | GG | GA | AA | |||
| Li [24] | 2007 | 178 | 20 | 245 | 23 | 79 | 20 | 0 | 113 | 19 | 2 | YES | |
| Li [24] | 2007 | 296 | 48 | 233 | 33 | 127 | 42 | 3 | 101 | 31 | 1 | YES | |
| Zhang et.al. [31] | 2005 | 514 | 60 | 346 | 34 | 228 | 58 | 1 | 158 | 30 | 2 | YES | |
| Rahmutula et.al. [29] | 2001 | 42 | 424 | 47 | 379 | 3 | 36 | 194 | 1 | 45 | 167 | YES | |
| Bernard et.al. [32] | 1999 | 191 | 25 | 195 | 23 | 86 | 19 | 3 | 87 | 21 | 1 | YES | |
| Rutledge et.al. [30] | 1995 | 90 | 30 | 85 | 3 | 30 | 30 | 0 | 41 | 3 | 0 | YES | |
| T1766C | T | C | T | C | TT | TC | CC | TT | TC | CC | |||
| He [33] | 2007 | 304 | 94 | 291 | 105 | 108 | 88 | 3 | 95 | 101 | 2 | YES | |
| He et.al. [34] | 2007 | 290 | 202 | 267 | 221 | 49 | 192 | 5 | 29 | 209 | 6 | YES | |
| Benedicta et.al. [35] | 2002 | 333 | 245 | 311 | 245 | 87 | 159 | 43 | 85 | 141 | 52 | YES | |
| Kato et.al. [36] | 2000 | 506 | 4 | 440 | 10 | 251 | 4 | 0 | 215 | 10 | 0 | YES | |
| Stratification Factors | No. | Additive Model (C vs. T) | p | Co-Dominant Model-1 (TC vs. TT) | p | Co-Dominant Model-2 (CC vs. TT) | p | Dominant Model (CC + TC) vs. TT | p | Recessive Model CC vs. (TT + TC) | p |
|---|---|---|---|---|---|---|---|---|---|---|---|
| OR(95%CI) a | OR(95%CI) a | OR(95%CI) a | OR(95%CI) a | OR(95%CI) a | |||||||
| Overall | 15 | 1.1(0.94–1.2) | 0.38 | 1.1(0.88–1.5) | 0.32 | 1.3(0.90–1.9) | 0.16 | 1.1(0.88–1.4) | 0.35 | 1.1(0.83–1.4) | 0.55 |
| Ethnicity | |||||||||||
| Asian | 11 | 1.1(0.92–1.3) | 0.38 | 1.0(0.84–1.3) | 0.75 | 1.4(0.81–2.4) | 0.23 | 1.1(0.86–1.3) | 0.62 | 1.3(0.81–2.2) | 0.26 |
| White | 3 | 0.96(0.58–1.6) | 0.89 | 1.0(0.38–2.7) | 0.96 | 1.3 (0.76–2.4) | 0.32 | 1.1(0.39–2.9) | 0.91 | 1.1(0.51–2.4) | 0.80 |
| Black | 1 | 1.1(0.65–2.0) | 0.66 | 2.5(1.0–6.1) | 0.040 | 0.87(0.27–2.8) | 0.82 | 1.9(0.85–4.4) | 0.12 | 0.51(0.18–1.5) | 0.23 |
| Source of controls | |||||||||||
| HB | 5 | 1.4(0.97–1.9) | 0.073 | 1.6(0.87–3.1) | 0.13 | 1.1(0.45–2.7) | 0.83 | 1.4(0.73–2.8) | 0.30 | 1.4(0.85–2.3) | 0.19 |
| PB | 10 | 1.0(0.90–1.1) | 0.77 | 1.1(0.82–1.4) | 0.58 | 1.4(0.90–2.1) | 0.15 | 1.1(0.83–1.4) | 0.57 | 0.97(0.70–1.4) | 0.86 |
| Genotyping methods | |||||||||||
| Gene chips | 3 | 1.2(0.53–2.9) | 0.62 | 1.6(0.72–3.5) | 0.25 | 0.74(0.24–2.2) | 0.59 | 1.3(0.58–3.1) | 0.50 | 0.72(0.24–2.2) | 0.57 |
| PCR-RFLP | 6 | 1.0(0.82–1.2) | 1.0 | 1.0(0.72–1.4) | 0.99 | 1.5(0.93–2.3) | 0.096 | 1.0(0.73–1.4) | 0.91 | 1.3(0.64–2.6) | 0.48 |
| Q-PCR | 1 | 1.1(0.57–2.2) | 0.73 | 1.2(0.54–2.5) | 0.69 | 1.0(0.14–7.1) | 1.0 | 1.1(0.56–2.4) | 0.71 | 1.0(0.14–7.1) | 1.0 |
| PCR | 5 | 1.3(0.93–1.8) | 0.13 | 1.7(0.90–3.1) | 0.10 | 1.3(0.49–3.4) | 0.61 | 1.5(0.85–2.8) | 0.15 | 1.2(0.58–2.5) | 0.62 |
| Gene Type | Genetic Model | OR a | 95%CI | p | I2 | p* | Model |
|---|---|---|---|---|---|---|---|
| Overall | |||||||
| A vs. G | additive model | 1.3 | 0.96–1.9 | 0.090 | 54.7% | 0.051 | RE |
| GA vs. GG | co-dominant model-1 | 1.5 | 0.83–2.6 | 0.19 | 70.1% | 0.005 | RE |
| AA vs. GG | co-dominant model-2 | 0.87 | 0.34–2.3 | 0.78 | 0.0% | 0.48 | FE |
| (AA + GA) vs. GG | dominant model | 1.5 | 0.86–2.5 | 0.17 | 67.5% | 0.009 | RE |
| AA vs. (GG + GA) | recessive model | 1.3 | 0.85–2.0 | 0.22 | 0.0% | 0.53 | FE |
| Work of Rutledge removed | |||||||
| A vs. G | additive model | 1.2 | 0.95–1.5 | 0.14 | 0.0% | 1.0 | FE |
| GA vs. GG | co-dominant model-1 | 1.2 | 0.88–1.6 | 0.29 | 0.0% | 0.56 | FE |
| AA vs. GG | co-dominant model-2 | 0.87 | 0.34–2.3 | 0.78 | 0.0% | 0.48 | FE |
| (AA + GA) vs. GG | dominant model | 1.2 | 0.88–1.5 | 0.28 | 0.0% | 0.82 | FE |
| AA vs. (GG + GA) | recessive model | 1.3 | 0.85–2.0 | 0.22 | 0.0% | 0.53 | FE |
| Gene Type | Genetic Model | OR a | 95%CI | p | I2 | p* | Model |
|---|---|---|---|---|---|---|---|
| Overall | |||||||
| C vs. T | additive model | 0.87 | 0.75–1.0 | 0.063 | 0.0% | 0.42 | FE |
| TC vs. TT | co-dominant model-1 | 0.73 | 0.49–1.1 | 0.12 | 58.0% | 0.068 | RE |
| CC vs. TT | co-dominant model-2 | 0.78 | 0.50–1.2 | 0.29 | 0.0% | 0.66 | FE |
| (CC + TC) vs. TT | dominant model | 0.73 | 0.51–1.0 | 0.084 | 51.1% | 0.11 | RE |
| CC vs. (TT + TC) | recessive model | 0.79 | 0.53–1.2 | 0.26 | 0.0% | 0.77 | FE |
| Work of Benedicta removed | |||||||
| C vs. T | additive model | 0.82 | 0.68–1.0 | 0.052 | 8.4% | 0.34 | FE |
| TC vs. TT | co-dominant model-1 | 0.64 | 0.47–0.86 | 0.003 | 12.7% | 0.32 | FE |
| CC vs. TT | co-dominant model-2 | 0.69 | 0.25–1.9 | 0.48 | 0.0% | 0.38 | FE |
| (CC + TC) vs. TT | dominant model | 0.64 | 0.48–0.87 | 0.004 | 18.1% | 0.30 | FE |
| CC vs. (TT + TC) | recessive model | 0.99 | 0.37–2.7 | 0.99 | 0.0% | 0.59 | FE |
| Study Omitted | Estimate | 95%Confidence Interval |
|---|---|---|
| Li (2007) [24] | 1.4 | 1.0–1.9 |
| Li (2007) [24] | 1.5 | 1.1–2.1 |
| Zhang et.al. (2005) [31] | 1.4 | 1.0–2.0 |
| Rahmutula et.al. (2001) [29] | 1.4 | 1.1–1.9 |
| Bernard et.al. (1999) [32] | 1.5 | 1.1–2.0 |
| Rutledge et.al. (1995) [30] | 1.2 | 0.88–1.6 |
| Combined | 1.4 | 1.1–1.8 |
© 2016 by the authors; licensee MDPI, Basel, Switzerland. This article is an open access article distributed under the terms and conditions of the Creative Commons Attribution (CC-BY) license (http://creativecommons.org/licenses/by/4.0/).
Share and Cite
Wang, J.; Wang, Z.; Yu, C. Association of Polymorphisms in the Atrial Natriuretic Factor Gene with the Risk of Essential Hypertension: A Systematic Review and Meta-Analysis. Int. J. Environ. Res. Public Health 2016, 13, 458. https://doi.org/10.3390/ijerph13050458
Wang J, Wang Z, Yu C. Association of Polymorphisms in the Atrial Natriuretic Factor Gene with the Risk of Essential Hypertension: A Systematic Review and Meta-Analysis. International Journal of Environmental Research and Public Health. 2016; 13(5):458. https://doi.org/10.3390/ijerph13050458
Chicago/Turabian StyleWang, Jinyao, Zhenkun Wang, and Chuanhua Yu. 2016. "Association of Polymorphisms in the Atrial Natriuretic Factor Gene with the Risk of Essential Hypertension: A Systematic Review and Meta-Analysis" International Journal of Environmental Research and Public Health 13, no. 5: 458. https://doi.org/10.3390/ijerph13050458
APA StyleWang, J., Wang, Z., & Yu, C. (2016). Association of Polymorphisms in the Atrial Natriuretic Factor Gene with the Risk of Essential Hypertension: A Systematic Review and Meta-Analysis. International Journal of Environmental Research and Public Health, 13(5), 458. https://doi.org/10.3390/ijerph13050458