
Fine Particulate Matter Pollution and Hospital Admissions for Respiratory Diseases in Beijing, China

Abstract
:1. Introduction
2. Data and Method
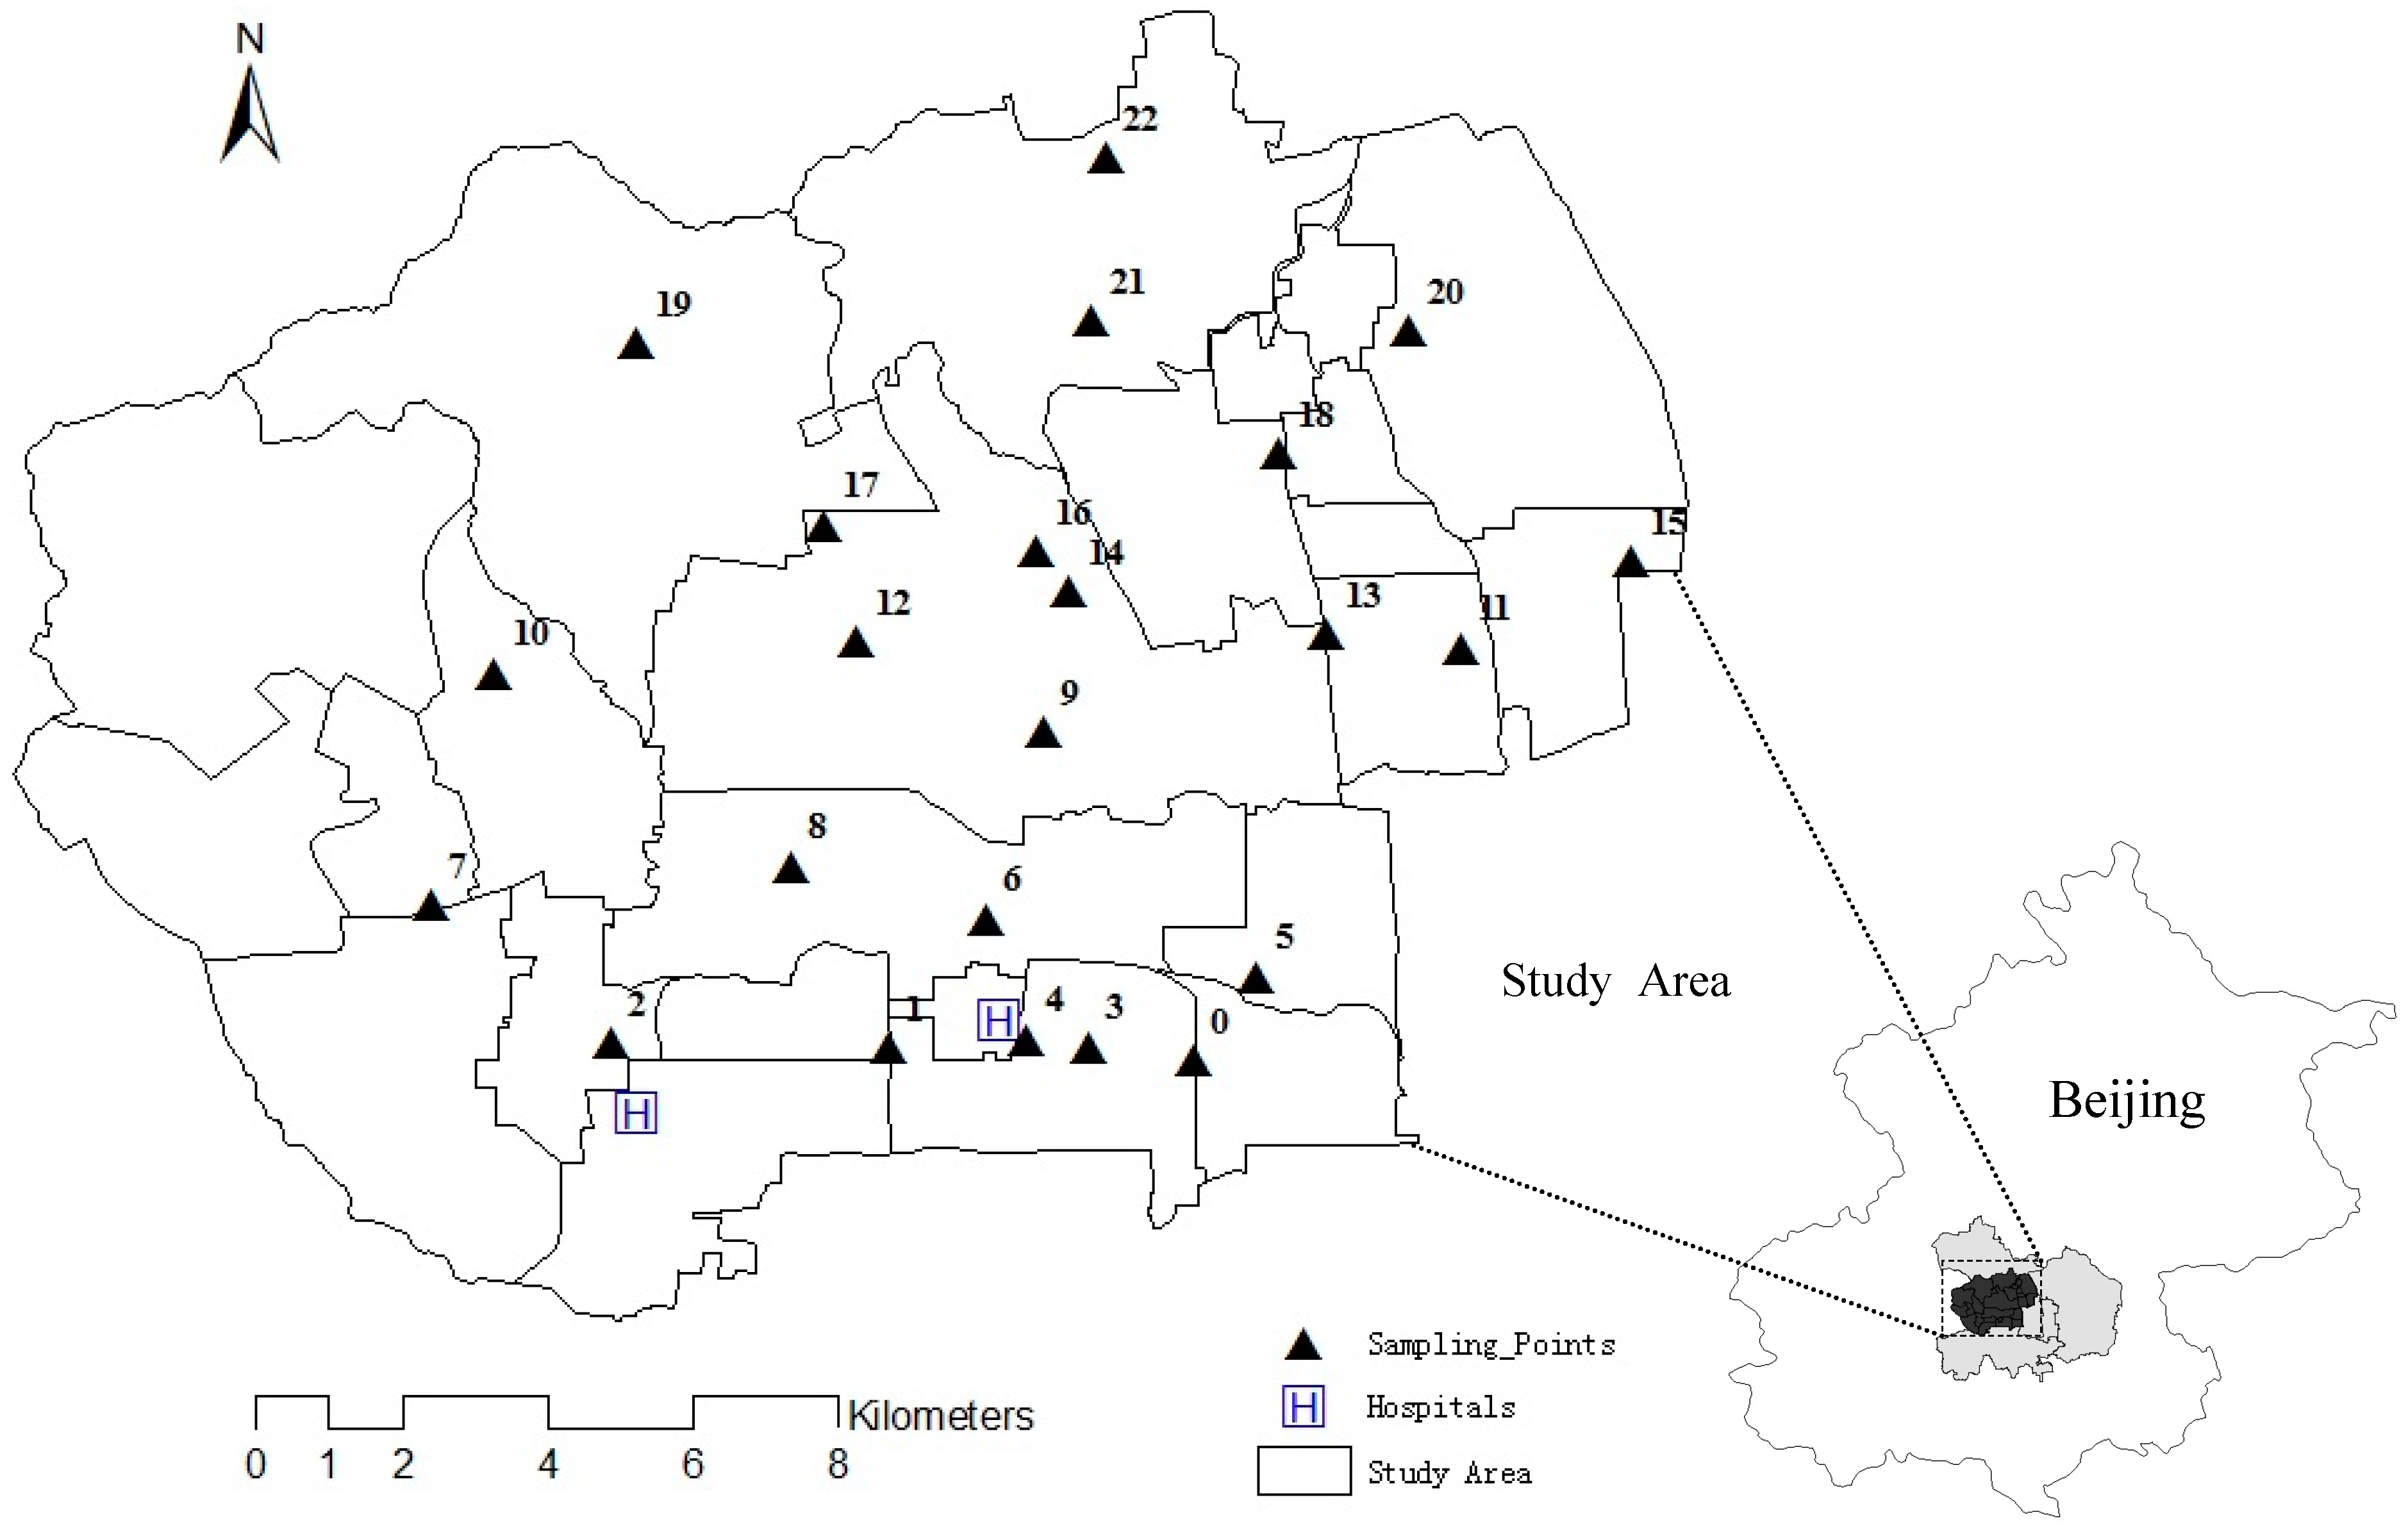
2.1. Study Area


| FID | ID | Name | District | Population | Post Code |
|---|---|---|---|---|---|
| 0 | 87 | Balizhuang | Haidian | 128948 | 100036 |
| 1 | 88 | Ganjiakou | Haidian | 111596 | 100037 |
| 2 | 89 | Wanshoulu | Haidian | 148159 | 100036 |
| 3 | 90 | Yongdinglu | Haidian | 37394 | 100039 |
| 4 | 91 | Yangfangdian | Haidian | 151419 | 100038 |
| 5 | 100 | Qinglongqiao | Haidian | 145286 | 100091 |
| 6 | 101 | Xueyuanlu | Haidian | 287124 | 100083 |
| 7 | 102 | Xiangshan | Haidian | 35690 | 100093 |
| 8 | 103 | Haidian | Haidian | 143513 | 100080 |
| 9 | 104 | Qinghuayuan | Haidian | 49072 | 100083 |
| 10 | 105 | Yanyuan | Haidian | 36706 | 100080 |
| 11 | 106 | Zizhuyuan | Haidian | 222973 | 100044 |
| 12 | 107 | Zhongguancun | Haidian | 92900 | 100080 |
| 13 | 108 | Shuangyushu | Haidian | 50211 | 100089 |
| 14 | 109 | Beitaipingzhuang | Haidian | 136244 | 100088 |
| 15 | 110 | Beixiaguan | Haidian | 131720 | 100081 |
| 16 | 111 | Bajiao | Shijingshan | 70849 | 100049 |
| 17 | 112 | Gucheng | Shijingshan | 62249 | 100043 |
| 18 | 113 | Laoshan | Shijingshan | 37774 | 100049 |
| 19 | 114 | Babaoshan | Shijingshan | 100731 | 100040 |
| 20 | 115 | Wulituo | Shijingshan | 30664 | 100042 |
| 21 | 116 | Pingguoyuan | Shijingshan | 81852 | 100041 |
| 22 | 117 | Guangning | Shijingshan | 14365 | 100041 |
| 23 | 118 | Jinding | Shijingshan | 61963 | 100041 |
2.2. Data Description
2.3. Method
2.3.1. Spatial Analysis
2.3.2. Grey Correlation Analysis
3. Results and Discussion
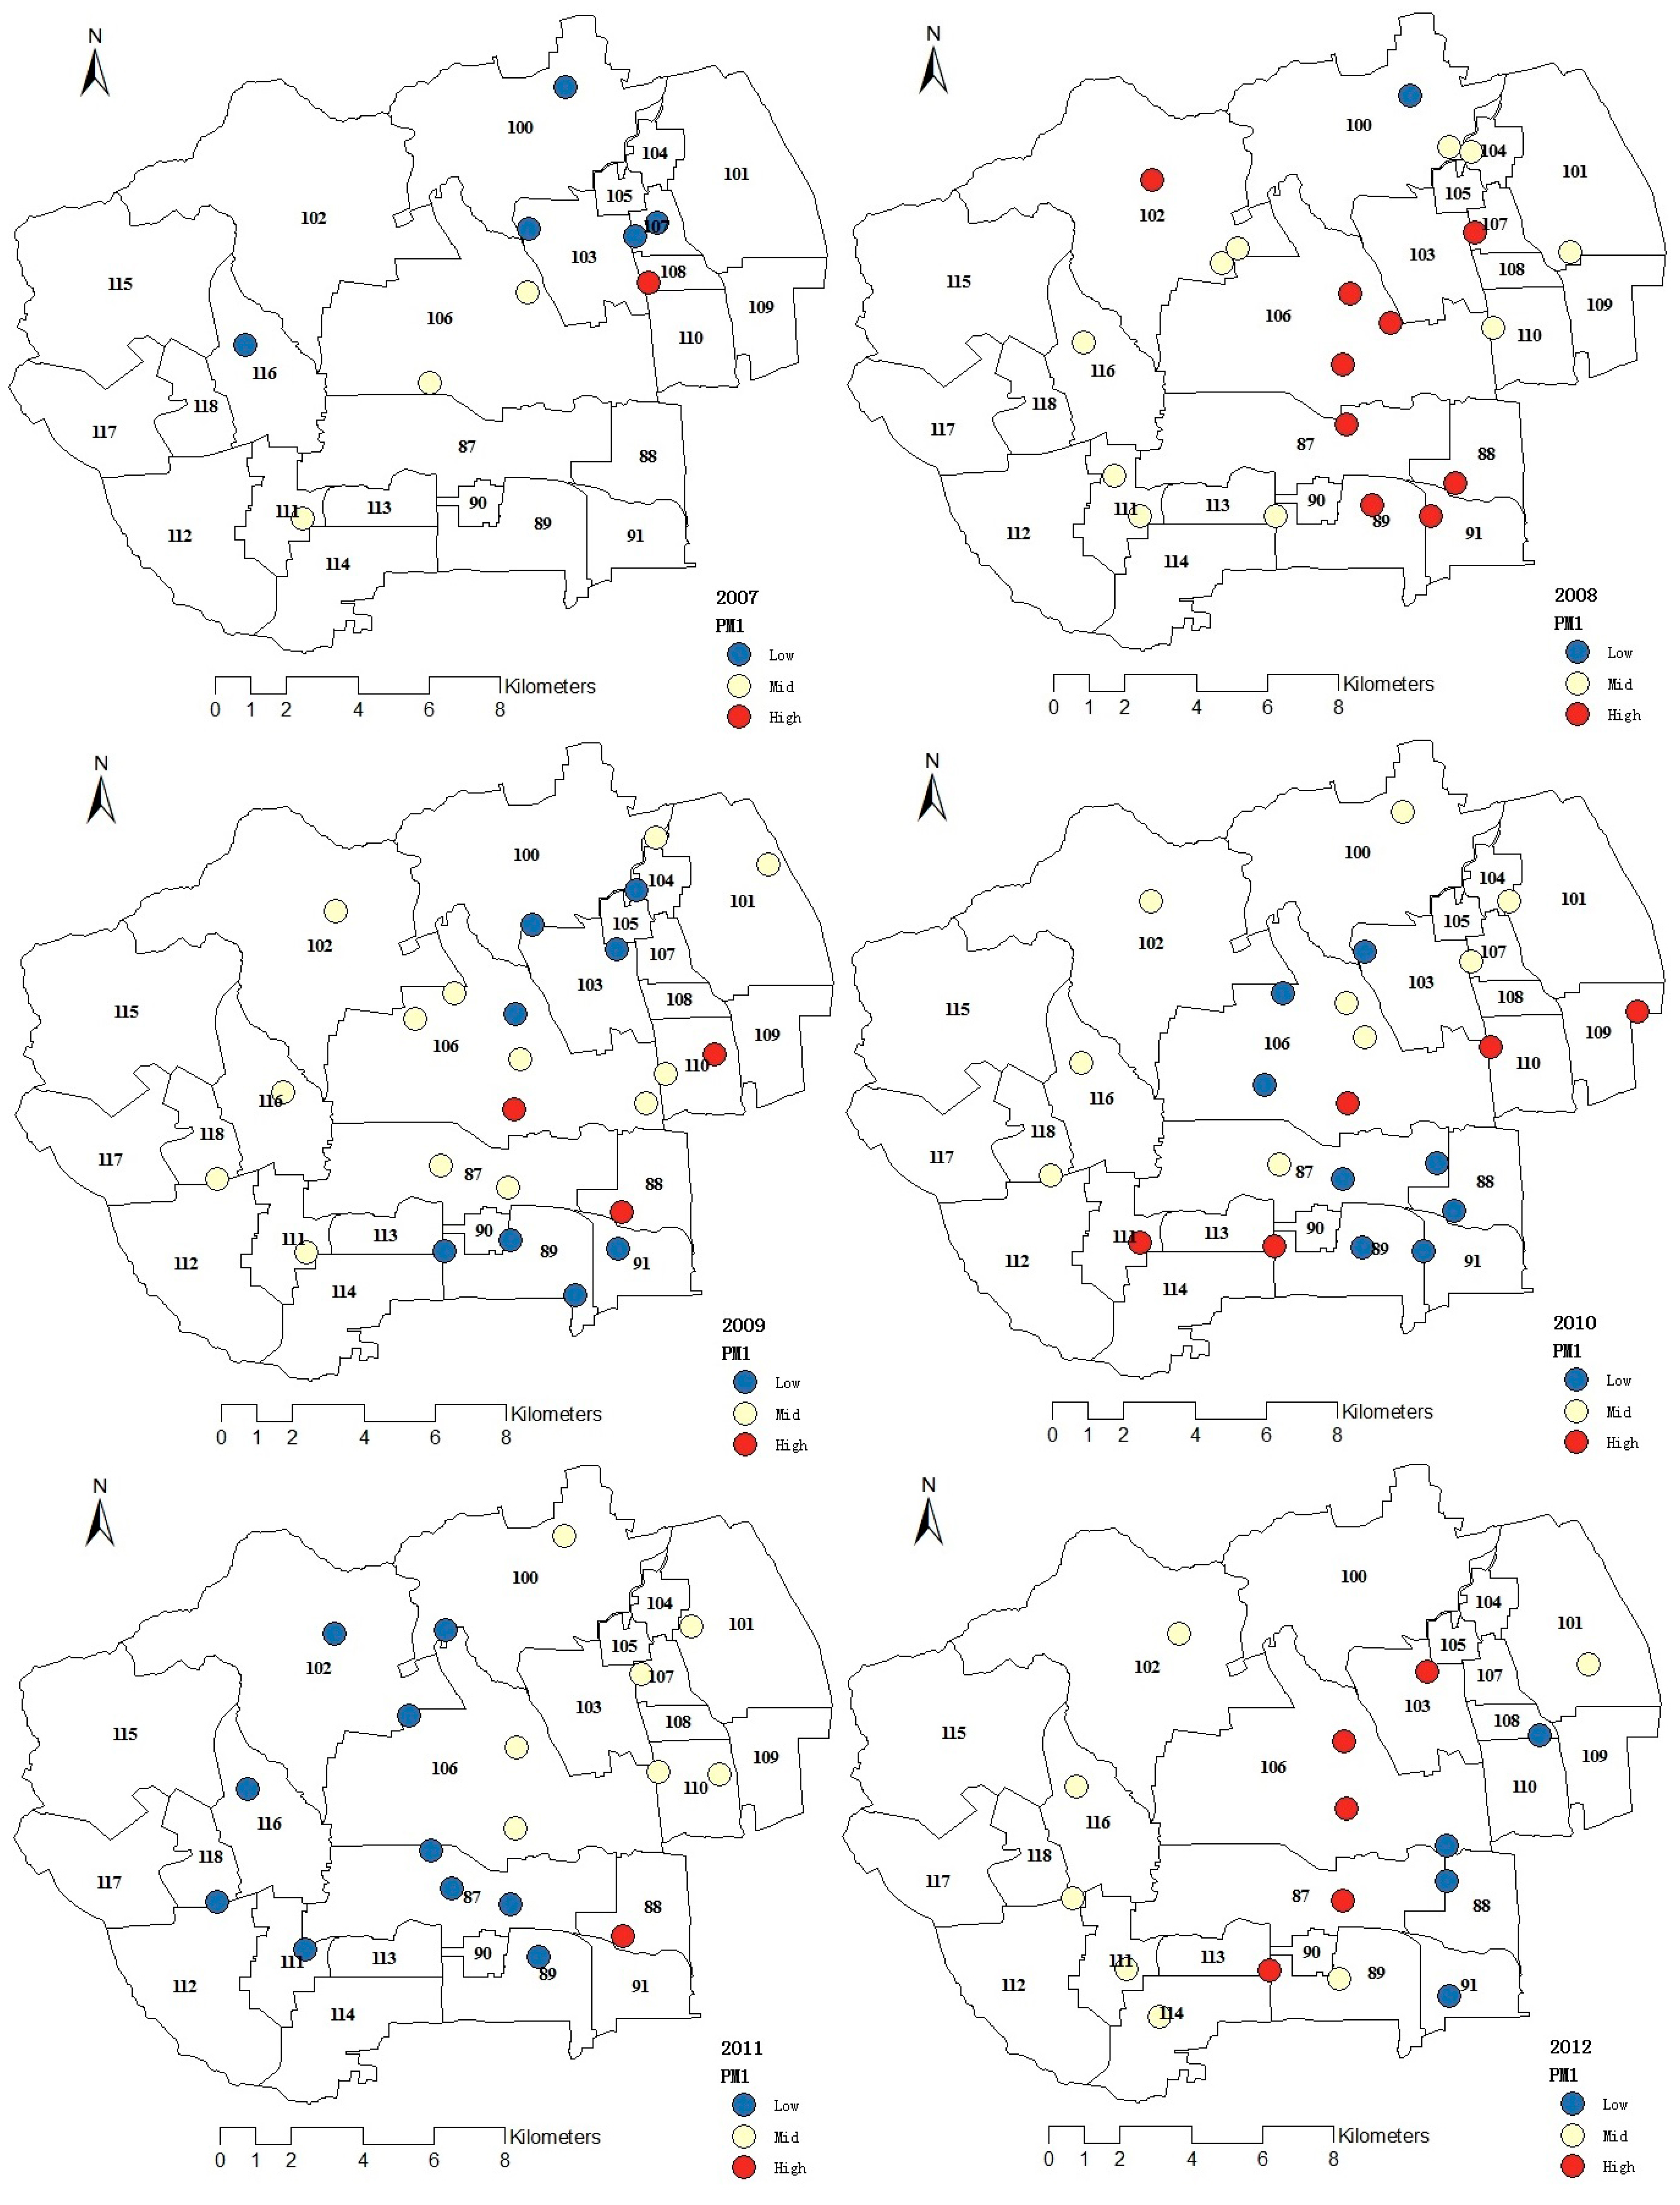
3.1. Spatial Distribution of Fine Particulate Matter

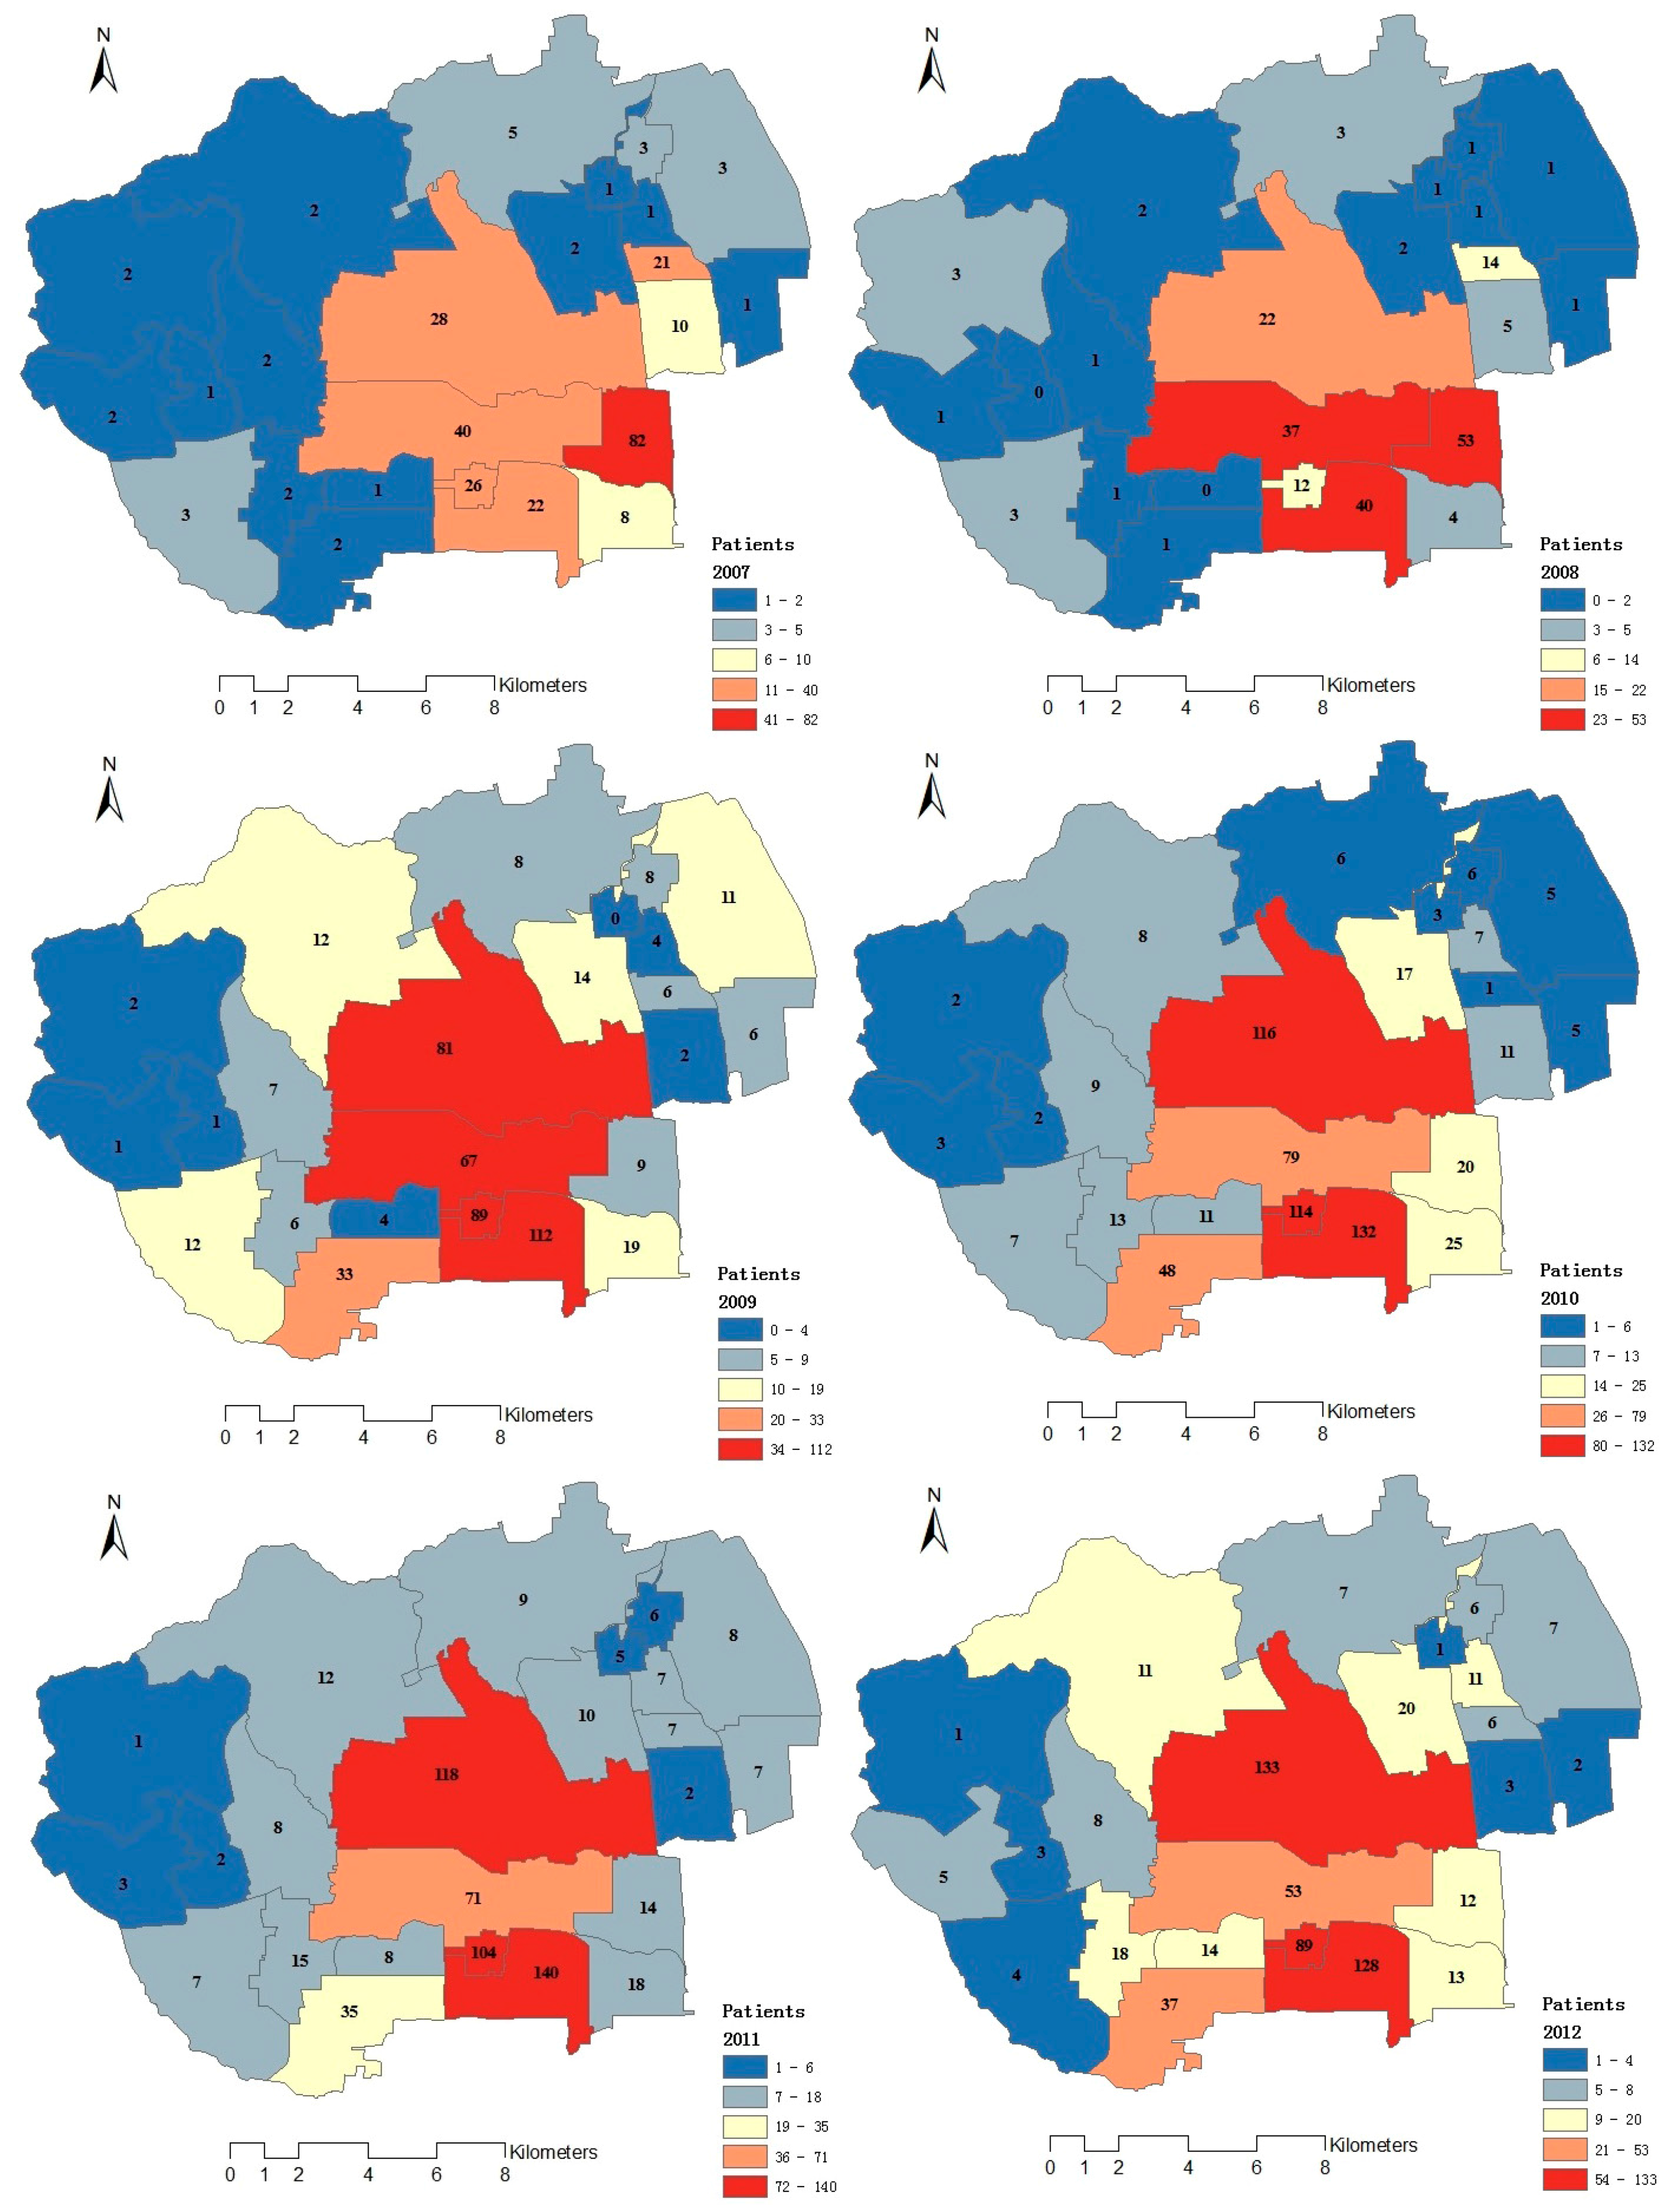
3.2. Respiratory Outpatients Distribution
| Statistics Year | 2007 | 2008 | 2009 | 2010 | 2011 | 2012 |
|---|---|---|---|---|---|---|
| Sum | 270 | 316 | 582 | 649 | 639 | 623 |
| Min | 1 | 0 | 0 | 1 | 1 | 0 |
| Max | 82 | 82 | 131 | 147 | 153 | 127 |
| Mean | 11 | 13 | 24 | 27 | 27 | 25 |
| Median | 3 | 5 | 9 | 9 | 9 | 8 |
| SD | 18.56 | 22.80 | 36.10 | 41.41 | 41.92 | 38.12 |
| RSD | 1.65 | 1.73 | 1.49 | 1.53 | 1.57 | 1.54 |

3.3. Grey Correlation Analysis
| Year | 2007 | 2008 | 2009 | ||||||
|---|---|---|---|---|---|---|---|---|---|
| PM | PM0.3 | PM0.5 | PM1.0 | PM0.3 | PM0.5 | PM1.0 | PM0.3 | PM0.5 | PM1.0 |
| Correlation degree | 0.7771 | 0.772 | 0.7595 | 0.7467 | 0.7402 | 0.7425 | 0.8213 | 0.8211 | 0.8068 |
| Correlation range | 1 | 2 | 3 | 1 | 3 | 2 | 1 | 2 | 3 |
| Year | 2010 | 2011 | 2012 | ||||||
| PM | PM0.3 | PM0.5 | PM1.0 | PM0.3 | PM0.5 | PM1.0 | PM0.3 | PM0.5 | PM1.0 |
| Correlation degree | 0.8213 | 0.8099 | 0.7909 | 0.7944 | 0.7825 | 0.7624 | 0.702 | 0.7064 | 0.6949 |
| Correlation range | 1 | 2 | 3 | 1 | 2 | 3 | 2 | 1 | 3 |
4. Conclusions
Acknowledgments
Author Contributions
Conflicts of Interest
References
- Peters, A. Particulate matter and heart disease: Evidence from epidemiological studies. Toxicol. Appl. Pharm. 2005, 207, 477–482. [Google Scholar] [CrossRef] [PubMed]
- Englert, N. Fine particles and human health—A review of epidemiological studies. Toxicol. Lett. 2004, 149, 235–242. [Google Scholar] [CrossRef] [PubMed]
- Zhang, M.; Song, Y.; Cai, X. A health-based assessment of particulate air pollution in urban areas of Beijing in 2000~2004. Sci. Total Environ. 2007, 376, 100–108. [Google Scholar] [CrossRef] [PubMed]
- Mu, Z.; Zhao, J.; Xu, N.; Yao, L.; Li, Y.; Meng, J. Vertical and temporal variation of PM10 in Yanta District, Xi’an during winter. Acta Sci. Circumstantiae 2011, 31, 1509–1516. [Google Scholar]
- Zhao, Q.; He, K.B.; Ma, Y.L.; Jia, Y.T.; Cheng, Y.; Liu, H.; Wang, S.W. Regional PM pollution in Beijing and surrounding area during summertime. Environ. Sci. 2009, 30, 1873–1880. [Google Scholar]
- Watson, J.G. Visibility: Science and regulation. J. Air Waste Manage. 2005, 52, 628–713. [Google Scholar] [CrossRef]
- Chen, R.J.; Chen, B.H.; Kan, H.D. A health-based economic assessment of particulate air pollution in 113 Chinese cities. China Environ. Sci. 2010, 30, 410–415. [Google Scholar]
- Wang, S.X.; Hao, J.M. Air quality management in China: Issues, challenges, and options. J. Environ. Sci. 2012, 24, 2–13. [Google Scholar] [CrossRef]
- Pouliou, T.; Kanaroglou, P.S.; Elliott, S.J.; Pengelly, L.D. Assessing the health impacts of air pollution: A re-analysis of the Hamilton children’s cohort data using a spatial analytic approach. Int. J. Environ. Health Res. 2008, 18, 17–35. [Google Scholar] [CrossRef] [PubMed]
- Orru, H.; Teinemaa, E.; Lai, T.; Tamm, T.; Kaasik, M.; Kimmel, V.; Kangur, K.; Merisalu, E.; Forsberg, B. Health impact assessment of particulate pollution in Tallinn using fine spatial resolution and modeling techniques. Environ. Health 2009, 8, 1–9. [Google Scholar] [CrossRef] [PubMed]
- Yin, Y.W.; Cheng, J.P.; Duan, Y.S.; Wei, H.P.; Ji, R.X.; Yu, J.L.; Yu, H.R. Correlation analysis between the PM2.5, PM10 which were taken in the hazy day and the number of outpatient about breathing sections, breathing sections of pediatrics in Shanghai. Environ. Sci. 2011, 32, 1894–1998. [Google Scholar]
- Ha, H.P.; Yang, L. Analysis of the influence of inhalable particle (PM10) to respiratory system disease in Xining. J. Qinghai Environ. 2009, 19, 147–148. [Google Scholar]
- Tang, T.; Zhao, W.; Gong, H.; Li, X.; Zang, K.; Bernosky, J.D.; Zhao, W.; Li, S. GIS spatial analysis of population exposure to fine particulate air pollution in Beijing, China. Environ. Geosci. 2010, 17, 1–16. [Google Scholar] [CrossRef]
- Liang, Y.; Fang, L.; Pan, H.; Zhang, K.; Kan, H.; Brook, J.R.; Sun, Q. PM2.5 in Beijing—Temporal pattern and its association with influenza. Environ. Health 2014, 13, 102. [Google Scholar] [CrossRef] [PubMed]
- Zhao, S.P.; Yu, Y.; Chen, J.B.; Liu, N.; He, J.J. Size distribution properties of atmospheric aerosol particles during summer and autumn in Lanzhou. Environ. Sci. 2012, 33, 687–693. [Google Scholar]
- Wang, W.W.; Chen, C. A quantitative analysis on spatial distribution of the pollutants in the urban air and their impact factors based on geostatistics and GIS: A case study of Hangzhou city. Geogr. Res. 2008, 27, 241–249. [Google Scholar]
- Orru, H.; Maasikmets, M.; Lai, T.; Tamm, T.; Kaasik, M.; Kimmel, V.; Orru, K.; Merisalu, E.; Forsberg, B. Health impacts of particulate matter in five major Estonian towns: Main sources of exposure and local differences. Air Qual. Atmos. Hlth 2011, 4, 247–258. [Google Scholar] [CrossRef]
- Kuang, C.; Neumann, T.; Norra, S.; Stüben, D. Land use-related chemical composition of street sediments in Beijing. Environ. Sci. Pollut. Res. 2004, 11, 73–83. [Google Scholar] [CrossRef]
- Han, Y.J.; Kim, T.S.; Kim, H. Ionic constituents and source analysis of PM2.5 in three Korean cities. Atmos. Enviro. 2008, 42, 4735–4746. [Google Scholar] [CrossRef]
- Ren, Y.J. The case-crossover studies of air particulate matter pollution and cardiovascular disease death. China Environ. Sci. 2007, 27, 657–660. [Google Scholar]
- Peacock, J.L.; Symonds, P.; Jackson, P.; Bremner, S.A.; Scarlett, J.F.; Strachan, D.P.; Anderson, H.R. Acute effects of winter air pollution on respiratory function in schoolchildren in southern England. Occup. Environ. Med. 2003, 60, 82–89. [Google Scholar] [CrossRef] [PubMed]
- Zhang, J.Y.; Meng, H.Y.; Zhang, G.B.; Zhao, W.; Pan, X.C. Relationship between air pollution and daily respiratory system disease mortality in Chaoyang District, Beijing: A time-series analysis. J. Environ. Health 2011, 28, 788–791. [Google Scholar]
- Wang, H.R.; Zhai, Q.M.; Shen, J. Impacts of air pollutants on the respiratory system diseases in a city. Environ. Sci. Manag. 2011, 36, 54–57. [Google Scholar]
- Han, L.H; Zhuang, G.S.; Cheng, S.Y.; Wang, H.Y. Characteristics of re-suspended road dust and its significant effect on the airborne particulate pollution in Beijing. Environ. Sci. 2009, 30, 1–8. [Google Scholar]
- 2015 ICD-10-CM Codes for Diseases of the respiratory system. http://www.icd10data.com/ICD10CM/Codes/J00-J99.
- Zhao, Y.; Kong, Y.F. Geography curriculum: Introduction to spatial analysis. Sci. Geogr. Sin. 2011, 31, 1090–1096. [Google Scholar]
- Sun, Y.; Zhang, X.; Cheng, X.; Hui, W.; Tan, M.; Chen, J. Gray correlative analysis of the impact from growing urbanization process on pedodiversity in Nanjing area. Acta Geogr. Sin. 2006, 61, 311–318. [Google Scholar]
- Liu, Y.S. The changes of fiscal agriculture-supporting expenditure and farmers’ income based on grey correlation theory. Asian Agric. Res. 2011, 3, 92–95. [Google Scholar]
- Hou, P.Q.; Ren, Y.F.; Wang, X.K.; Ouyang, Z.Y.; Zhou, X.P. Research on evaluation of water quality of Beijing urban storm water runoff. Environ. Sci. 2012, 33, 71–75. [Google Scholar]
- Fuji, T.; Hayashi, S.; Hogg, J.C.; Vincent, R.; Van Eeden, S.F. Particulate matter induces cytokine expression in human bronchial epithelial cells. Am. J. Respir. Cell Mol. Biol. 2001, 25, 265–271. [Google Scholar] [CrossRef]
- Ketzel, M.; Berkowicz, R.; Hvidberg, M.; Jensen, S.S.; Raaschou-Nielsen, O. Evaluation of AirGIS: A GIS–based air pollution and human exposure modelling system. Int. J. Environ. Pollut. 2011, 47, 226–231. [Google Scholar] [CrossRef]
© 2015 by the authors; licensee MDPI, Basel, Switzerland. This article is an open access article distributed under the terms and conditions of the Creative Commons Attribution license (http://creativecommons.org/licenses/by/4.0/).
Share and Cite
Xiong, Q.; Zhao, W.; Gong, Z.; Zhao, W.; Tang, T. Fine Particulate Matter Pollution and Hospital Admissions for Respiratory Diseases in Beijing, China. Int. J. Environ. Res. Public Health 2015, 12, 11880-11892. https://doi.org/10.3390/ijerph120911880
Xiong Q, Zhao W, Gong Z, Zhao W, Tang T. Fine Particulate Matter Pollution and Hospital Admissions for Respiratory Diseases in Beijing, China. International Journal of Environmental Research and Public Health. 2015; 12(9):11880-11892. https://doi.org/10.3390/ijerph120911880
Chicago/Turabian StyleXiong, Qiulin, Wenji Zhao, Zhaoning Gong, Wenhui Zhao, and Tao Tang. 2015. "Fine Particulate Matter Pollution and Hospital Admissions for Respiratory Diseases in Beijing, China" International Journal of Environmental Research and Public Health 12, no. 9: 11880-11892. https://doi.org/10.3390/ijerph120911880