
Measuring Disability: Comparing the Impact of Two Data Collection Approaches on Disability Rates

 ,
,  ,
,
Abstract
:1. Introduction
- (1)
- to analytically demonstrate the impact of disability screeners on disability rates,
- (2)
- to challenge the usual a priori exclusion of persons experiencing mild and moderate levels of disability from disability surveys and
- (3)
- to analytically demonstrate the advantage of using an a posteriori cut-off in a general population sample to identify persons experiencing disabilities.
2. Methods
2.1. Survey
2.2. Capacity and Performance Metric Scales

| Section 4000, Functioning: Performance Questions | |
| I4002 | How much of a problem is standing for long periods such as 30 minutes for you? |
| I4003 | How much of a problem is getting out of your home for you? |
| I4004 | How much of a problem is walking a short distance such as a 100m for you? |
| I4005 | How much of a problem is walking a kilometer for you? |
| I4006 | How much of a problem is engaging in vigorous activities for you, such as [add country specific examples]? |
| I4007 | How much of a problem is getting where you want to go for you? |
| I4009 | How much of a problem is raising a 2 liter bottle of water from waist to eye level? |
| I4012 | How much of a problem is toileting? |
| I4014 | How much of a problem is looking after your health, eating well, exercising or taking your medicines? |
| I4015 | How much of a problem do you have with seeing things at a distance? |
| I4017 | How much of a problem do you have with hearing what is said in a conversation with another person in a quiet room? |
| I4019 | How much of a problem is having pain for you? |
| I4020 | How much of a problem do you have with sleep? |
| I4021 | How much of a problem is feeling tired and not having enough energy? |
| I4023 | How much of a problem do you have with coughing or wheezing? |
| I4025 | How much of a problem do you have with felling worried, nervous or anxious? |
| I4026 | How much of a problem is getting along with people who are close to you, including your family and friends? |
| I4030 | How much of a problem is handling stress, such as controlling the important things in your life? |
| I4032 | How much of a problem do you have with being understood, using your usual language? |
| I4035 | How much of a problem is remembering to do the important things in your day to day life? |
| I4037 | How much of a problem do you have with getting your household tasks done? |
| I4040 | How much of a problem do you have with joining community activities, such as festivities, religious or other activities? |
| I4042 | How much of a problem did you have with voting in the last elections? |
| I4043 | How much of a problem do you have providing care or support for others? |
| I4045 | INTERVIEWER: If the respondent is currently not working, select the response option 98, not applicable. How much of a problem is getting things done as required at work? |
| I4048 | How much of a problem is using public or private transportation? |
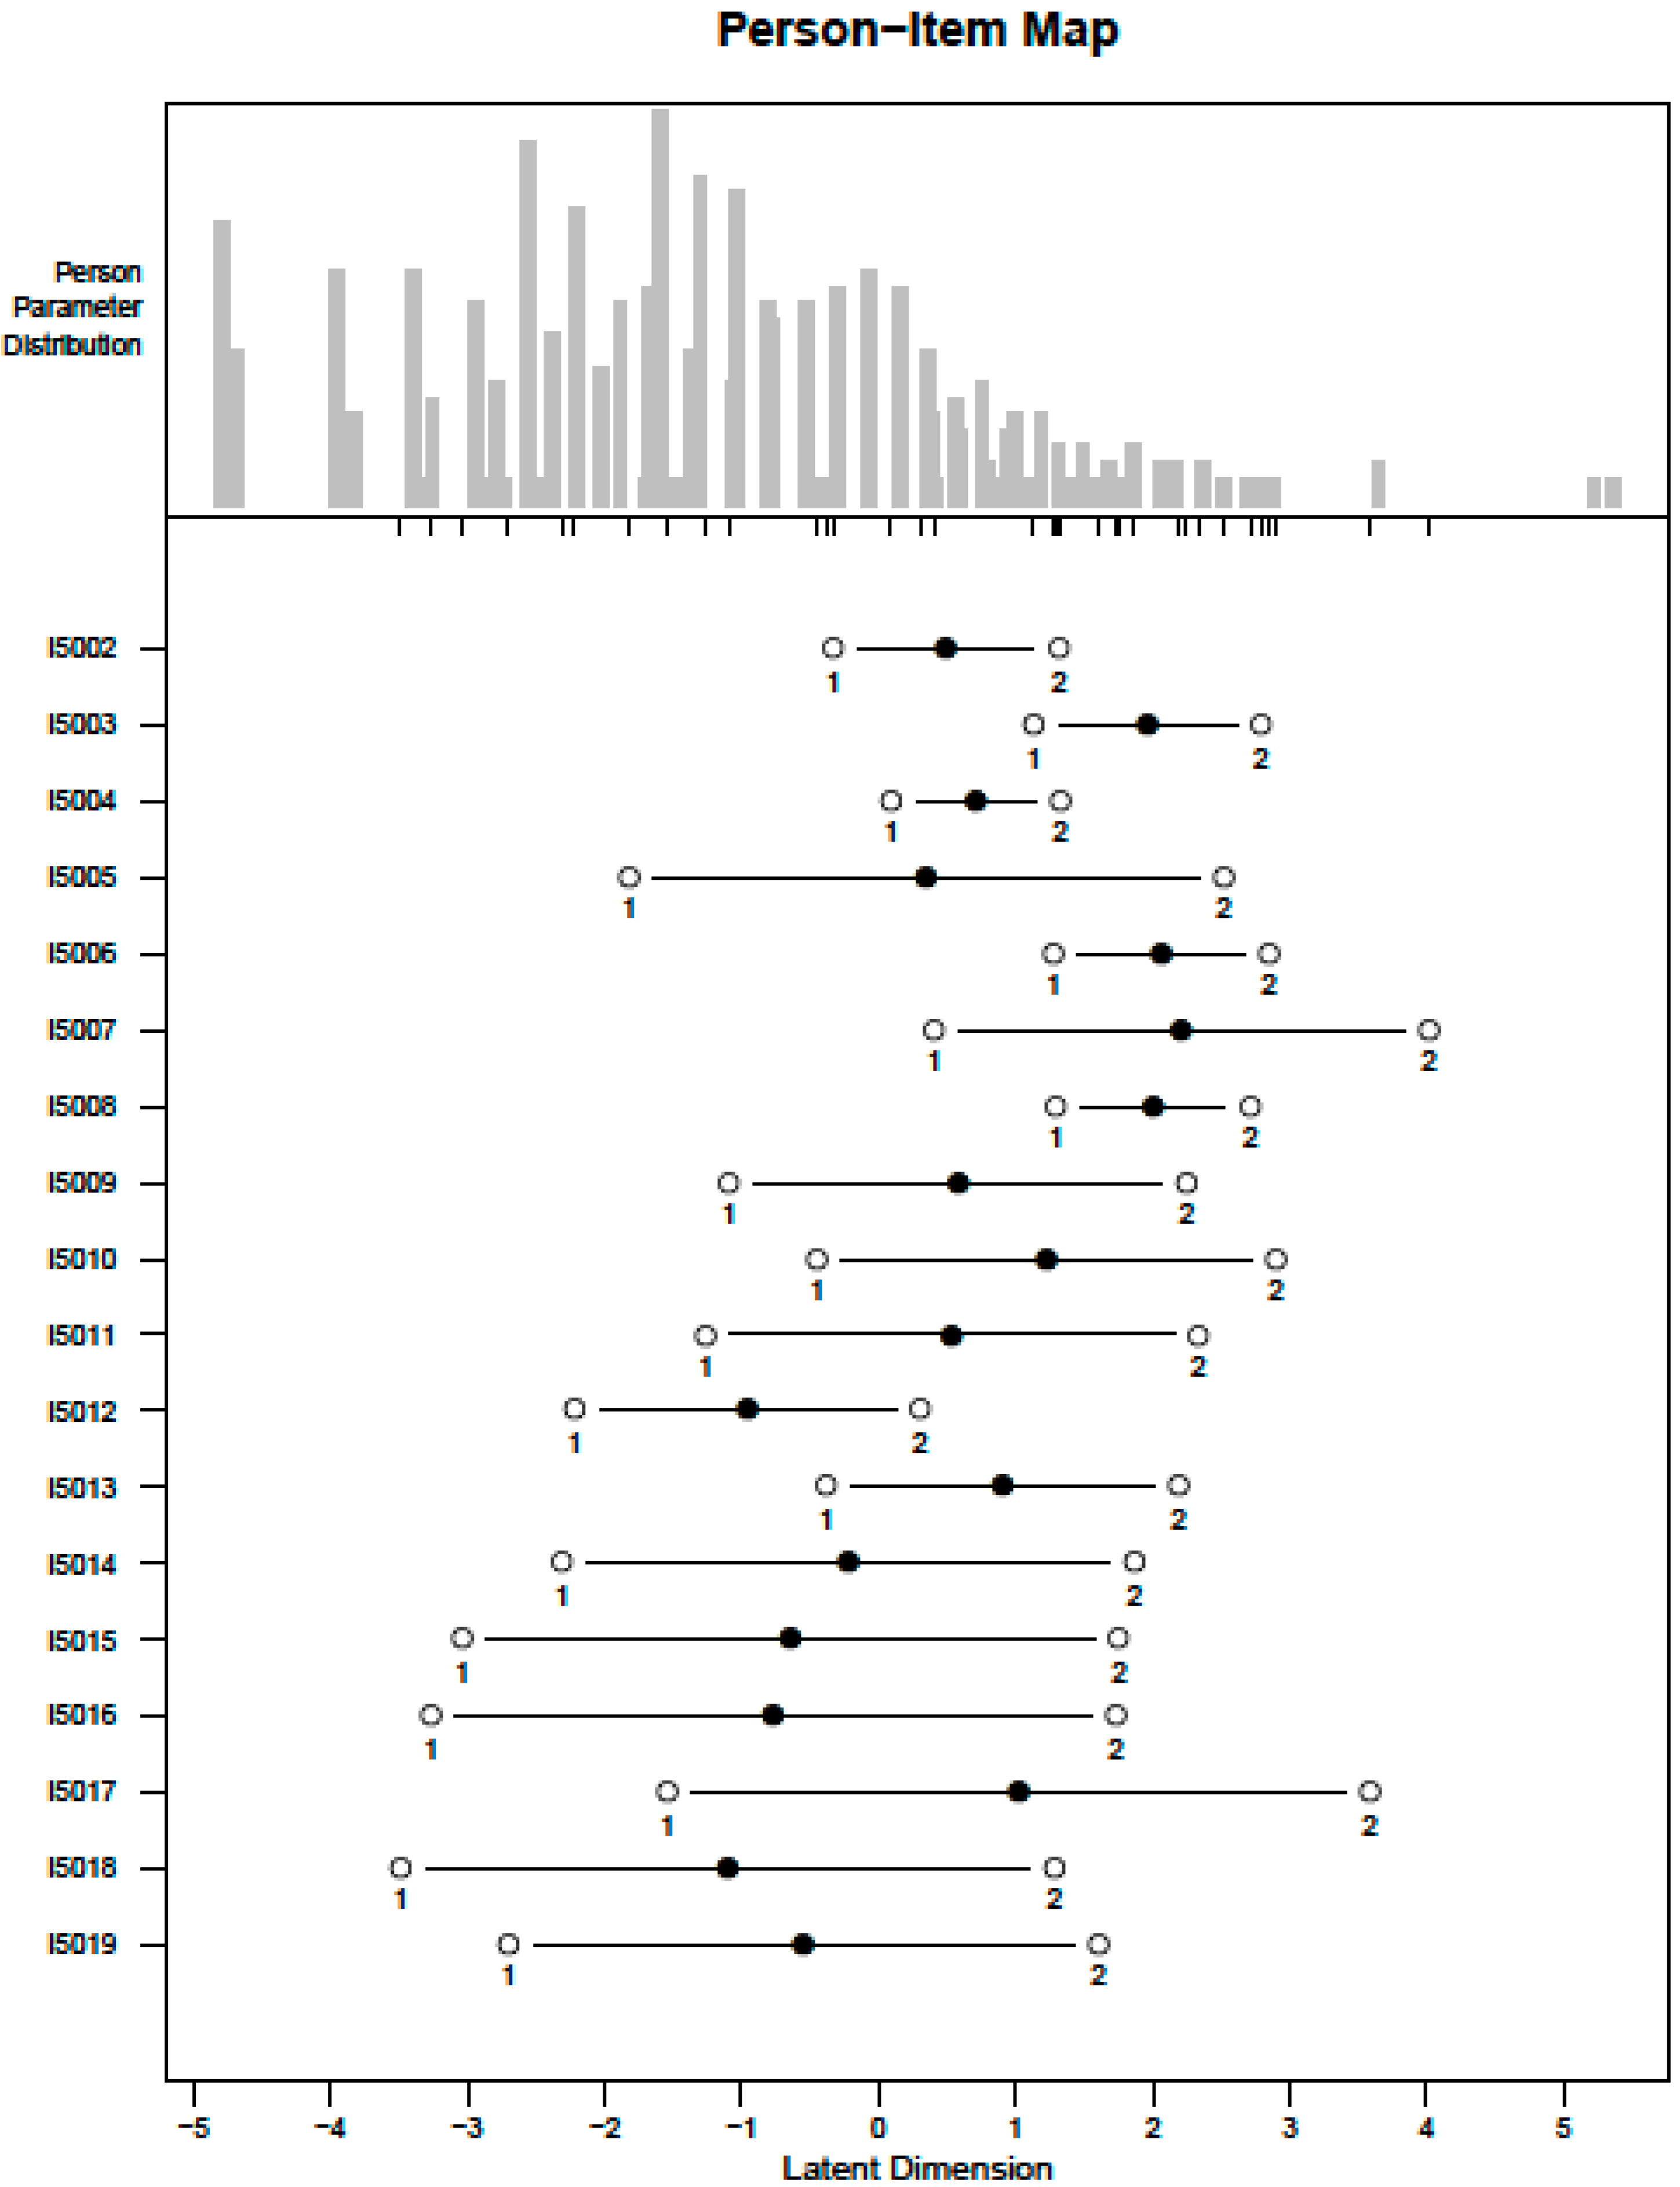
| Section 5000: Capacity questions | |
| I5002 | INTERVIEWER: If I3019 = 1, then include [without glasses] in the question. How much difficulty do you have seeing [without glasses]? |
| I5003 | INTERVIEWER: If I3023 = 1, then include [without hearing aids] in the question. How much difficulty do you have hearing [without hearing aids]? |
| I5004 | How much difficulty do you have walking or climbing steps because of your health? |
| I5005 | How much difficulty do you have remembering or concentrating because of your health? |
| I5006 | How much difficulty do you have washing all over or dressing because of your health? |
| I5007 | Because of your health, how much difficulty do you have communicating, for example understanding or being understood using your usual (customary) language? |
| I5008 | Because of your health, how much difficulty do you have doing things that require the use of your hands and fingers, such as picking up small objects or opening a container? |
| I5009 | How much difficulty do you have sleeping because of your health? |
| I5010 | How much difficulty do you have with shortness of breath because of your health? |
| I5011 | How much difficulty do you have doing household tasks because of your health? |
| I5012 | How much difficulty do you have providing care or support for others because of your health? |
| I5013 | Because of your health, how much difficulty do you have with joining community activities, such as festivities, religious or other activities? |
| I5014 | INTERVIEWER: If the respondent is not working or receiving education, select the response option 98, not applicable. How much difficulty do you have with your day to day work or school because of your health? |
| I5015 | How much difficulty do you have with feeling sad, low or depressed because of your health? |
| I5016 | How much difficulty do you have with feeling worried, nervous or anxious because of your health? |
| I5017 | Because of your health, how much difficulty do you have getting along with people who are close to you, including your family and friends? |
| I5018 | Because of your health, how much difficulty do you have coping with all the things you have to do? |
| I5019 | How much bodily aches or pain do you have? |
2.3. Disability Rates
- -
- How much difficulty do you have seeing [without glasses]?
- -
- How much difficulty do you have hearing [without hearing aids]?
- -
- How much difficulty do you have walking or climbing steps because of your health?
- -
- How much difficulty do you have remembering or concentrating because of your health?
- -
- How much difficulty do you have washing all over or dressing because of your health?
- -
- Because of your health, how much difficulty do you have communicating, for example understanding or being understood using your usual (customary) language?
- (1)
- Persons reporting at least extreme difficulties in at least one of eight functioning domains, namely:
- -
- Mobility (moving around and vigorous activity)
- -
- Self-care (self-care, appearance, grooming)
- -
- Pain (bodily aches and pains, bodily discomfort)
- -
- Cognition (concentrating, remembering, learning)
- -
- Interpersonal relationships (participation in the community, dealing with conflicts)
- -
- Vision (distance vision, near vision)
- -
- Sleep and energy (falling asleep, feeling rested)
- -
- Affect (feeling depressed, worry, anxiety)
- (2)
- Persons reporting (at least) one of four chronic conditions likely to lead to disability, namely:
- -
- Asthma or breathing problems
- -
- Diabetes
- -
- Arthritis
- -
- Depression
2.4. Comparison of Disabled versus Non-Disabled Individuals
- (I)
- “disabled” versus “non-disabled” using the a priori screener,
- (II)
- samples with high, moderate, mild and no levels of disability defined using the cut-off.
| Block 1 | Work and Education |
| I1014 | What is the highest level of education that you have completed? |
| I2005 | What is your current working situation? |
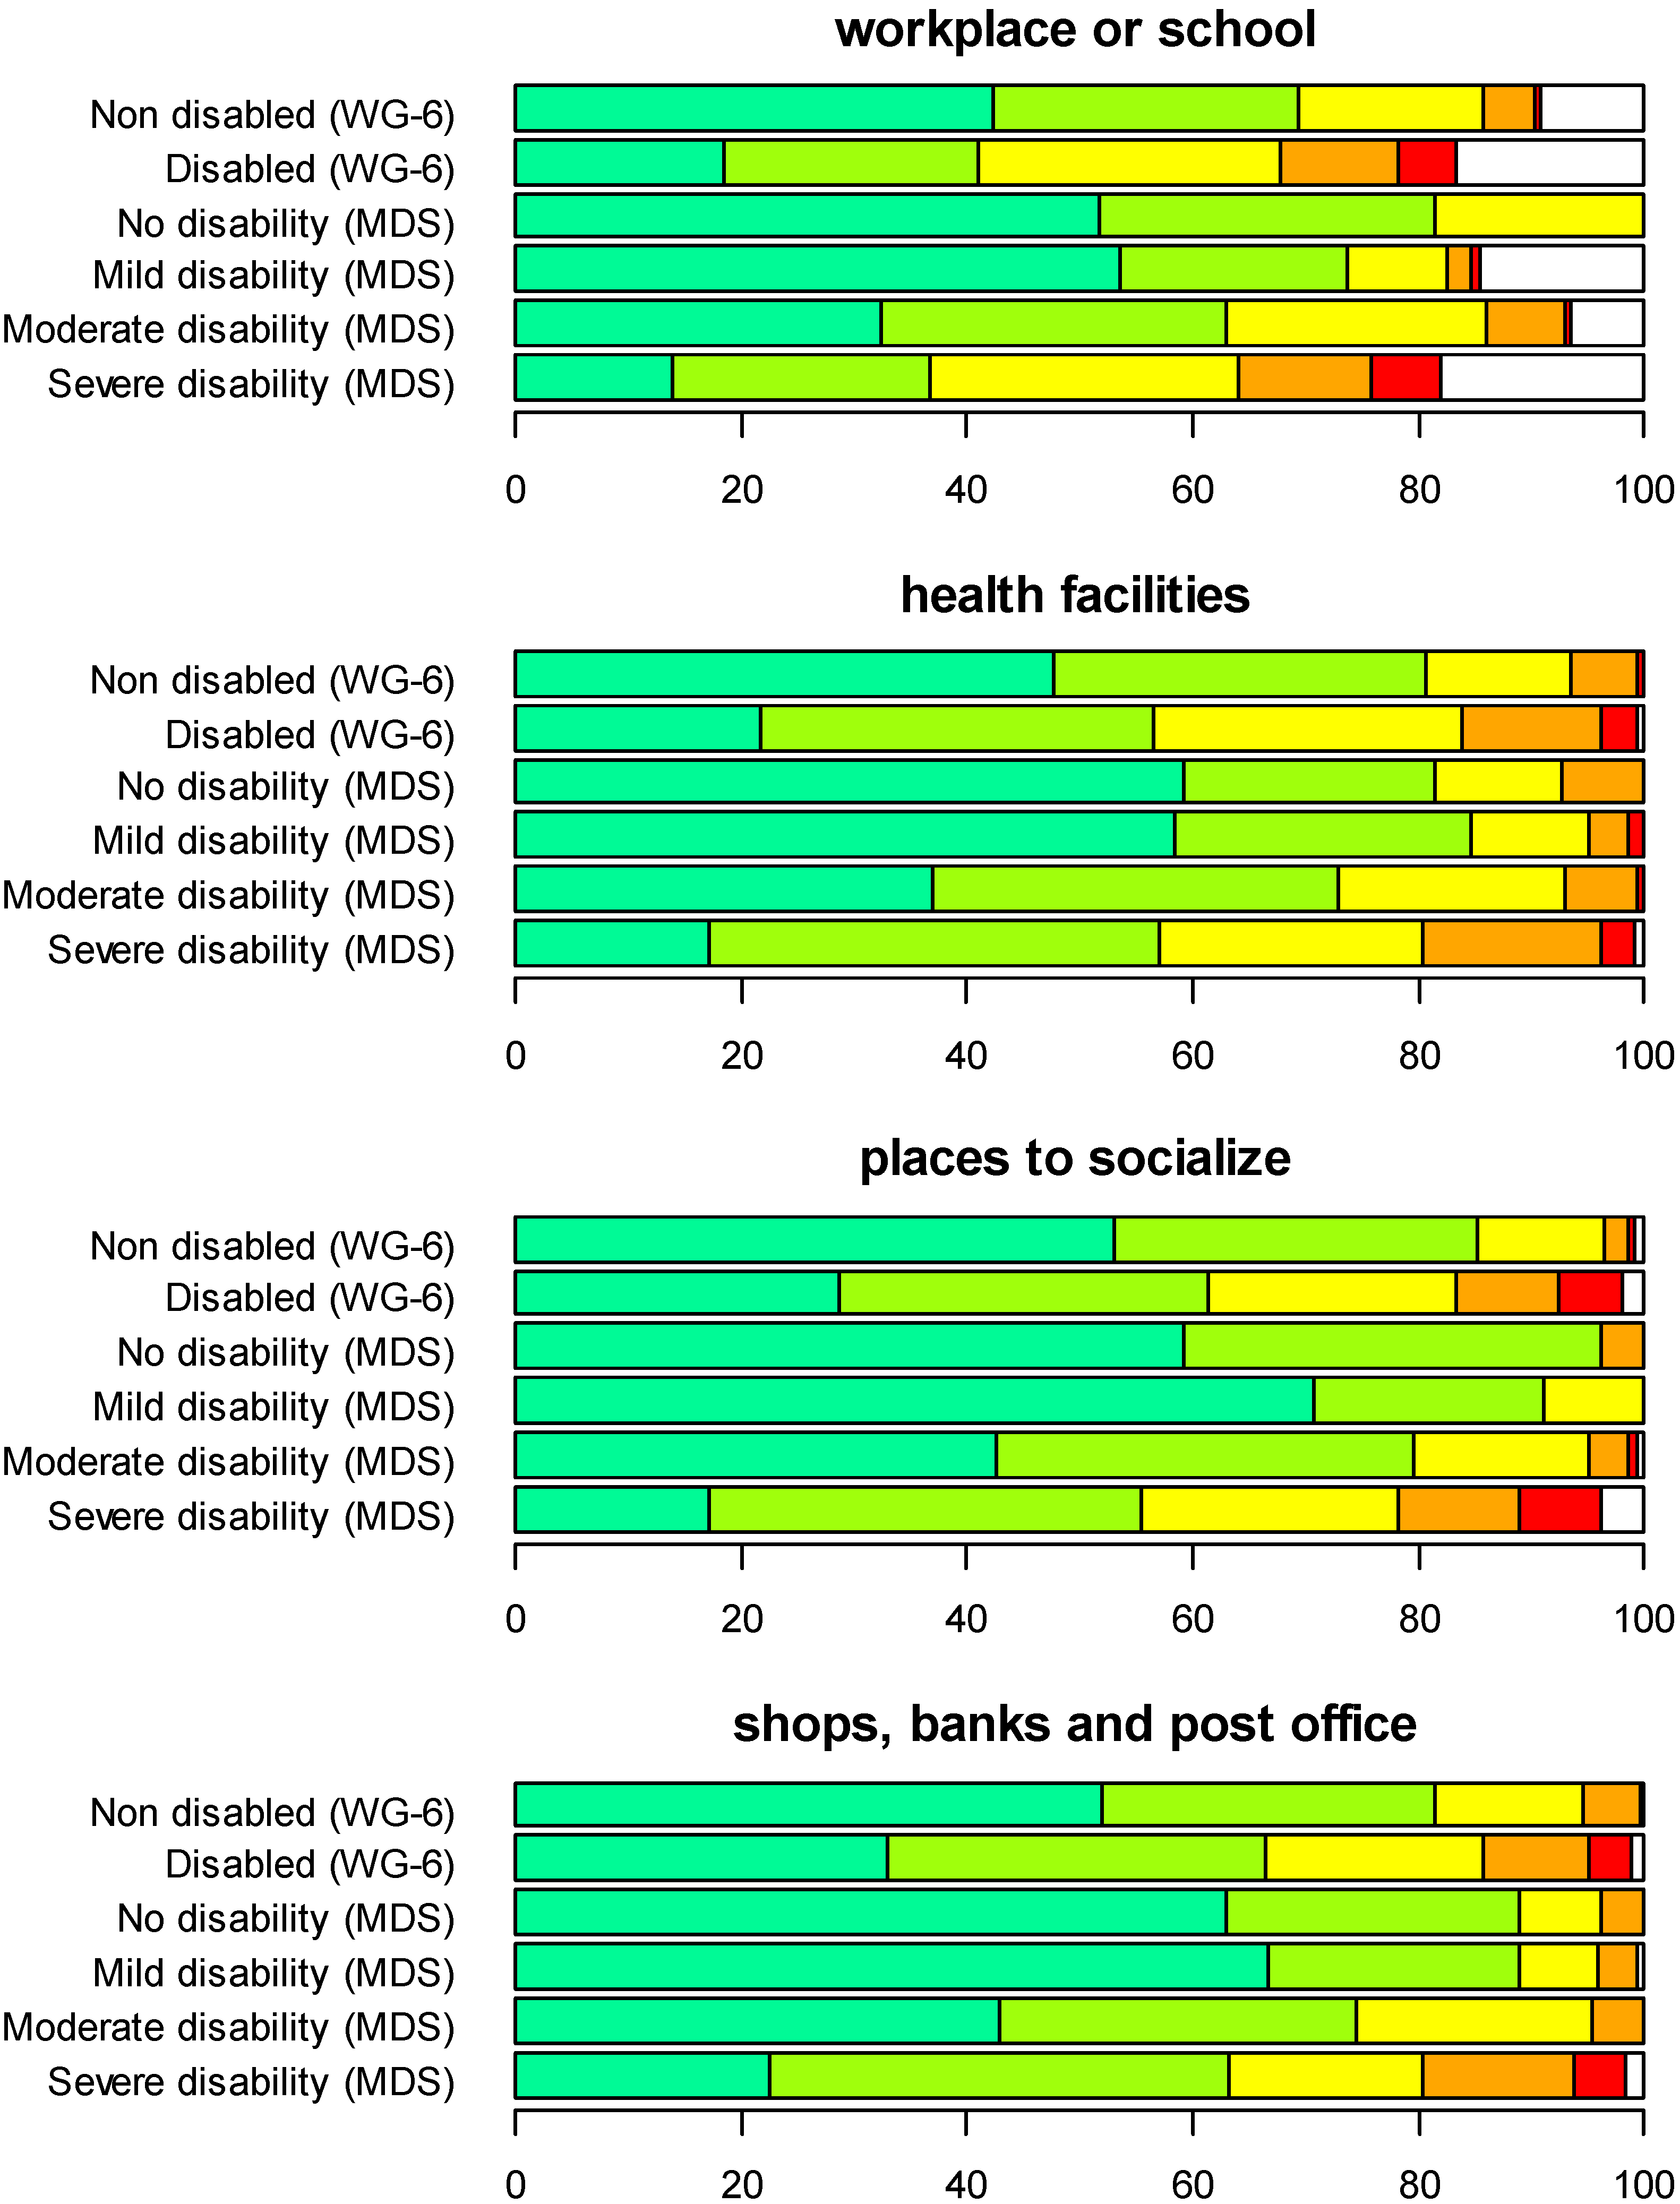
| Block 2 | Hindering and Facilitating Aspects of the Environment |
| I am going to ask you some general questions about your environment. I would like to know if the environment makes it easy or hard for you to do the things you need or want to do. I want you to answer the following questions on a scale from 1 to 5, where 1 means very easy and 5 means very hard, shown on show card 002. | |
| I3001 | To what extent does your workplace or school make it easy or hard for you to do the things you need or want to do at work or school? |
| I3002 | To what extent do the health facilities you need to use regularly make it easy or hard for you to use them? |
| I3003 | To what extent do the places where you want to or need to socialize and engage in community activities make it easy or hard for you to do this? |
| I3004 | How easy or hard do the shops, banks and post office in your neighborhood make it for you to do things you need or want to do? |
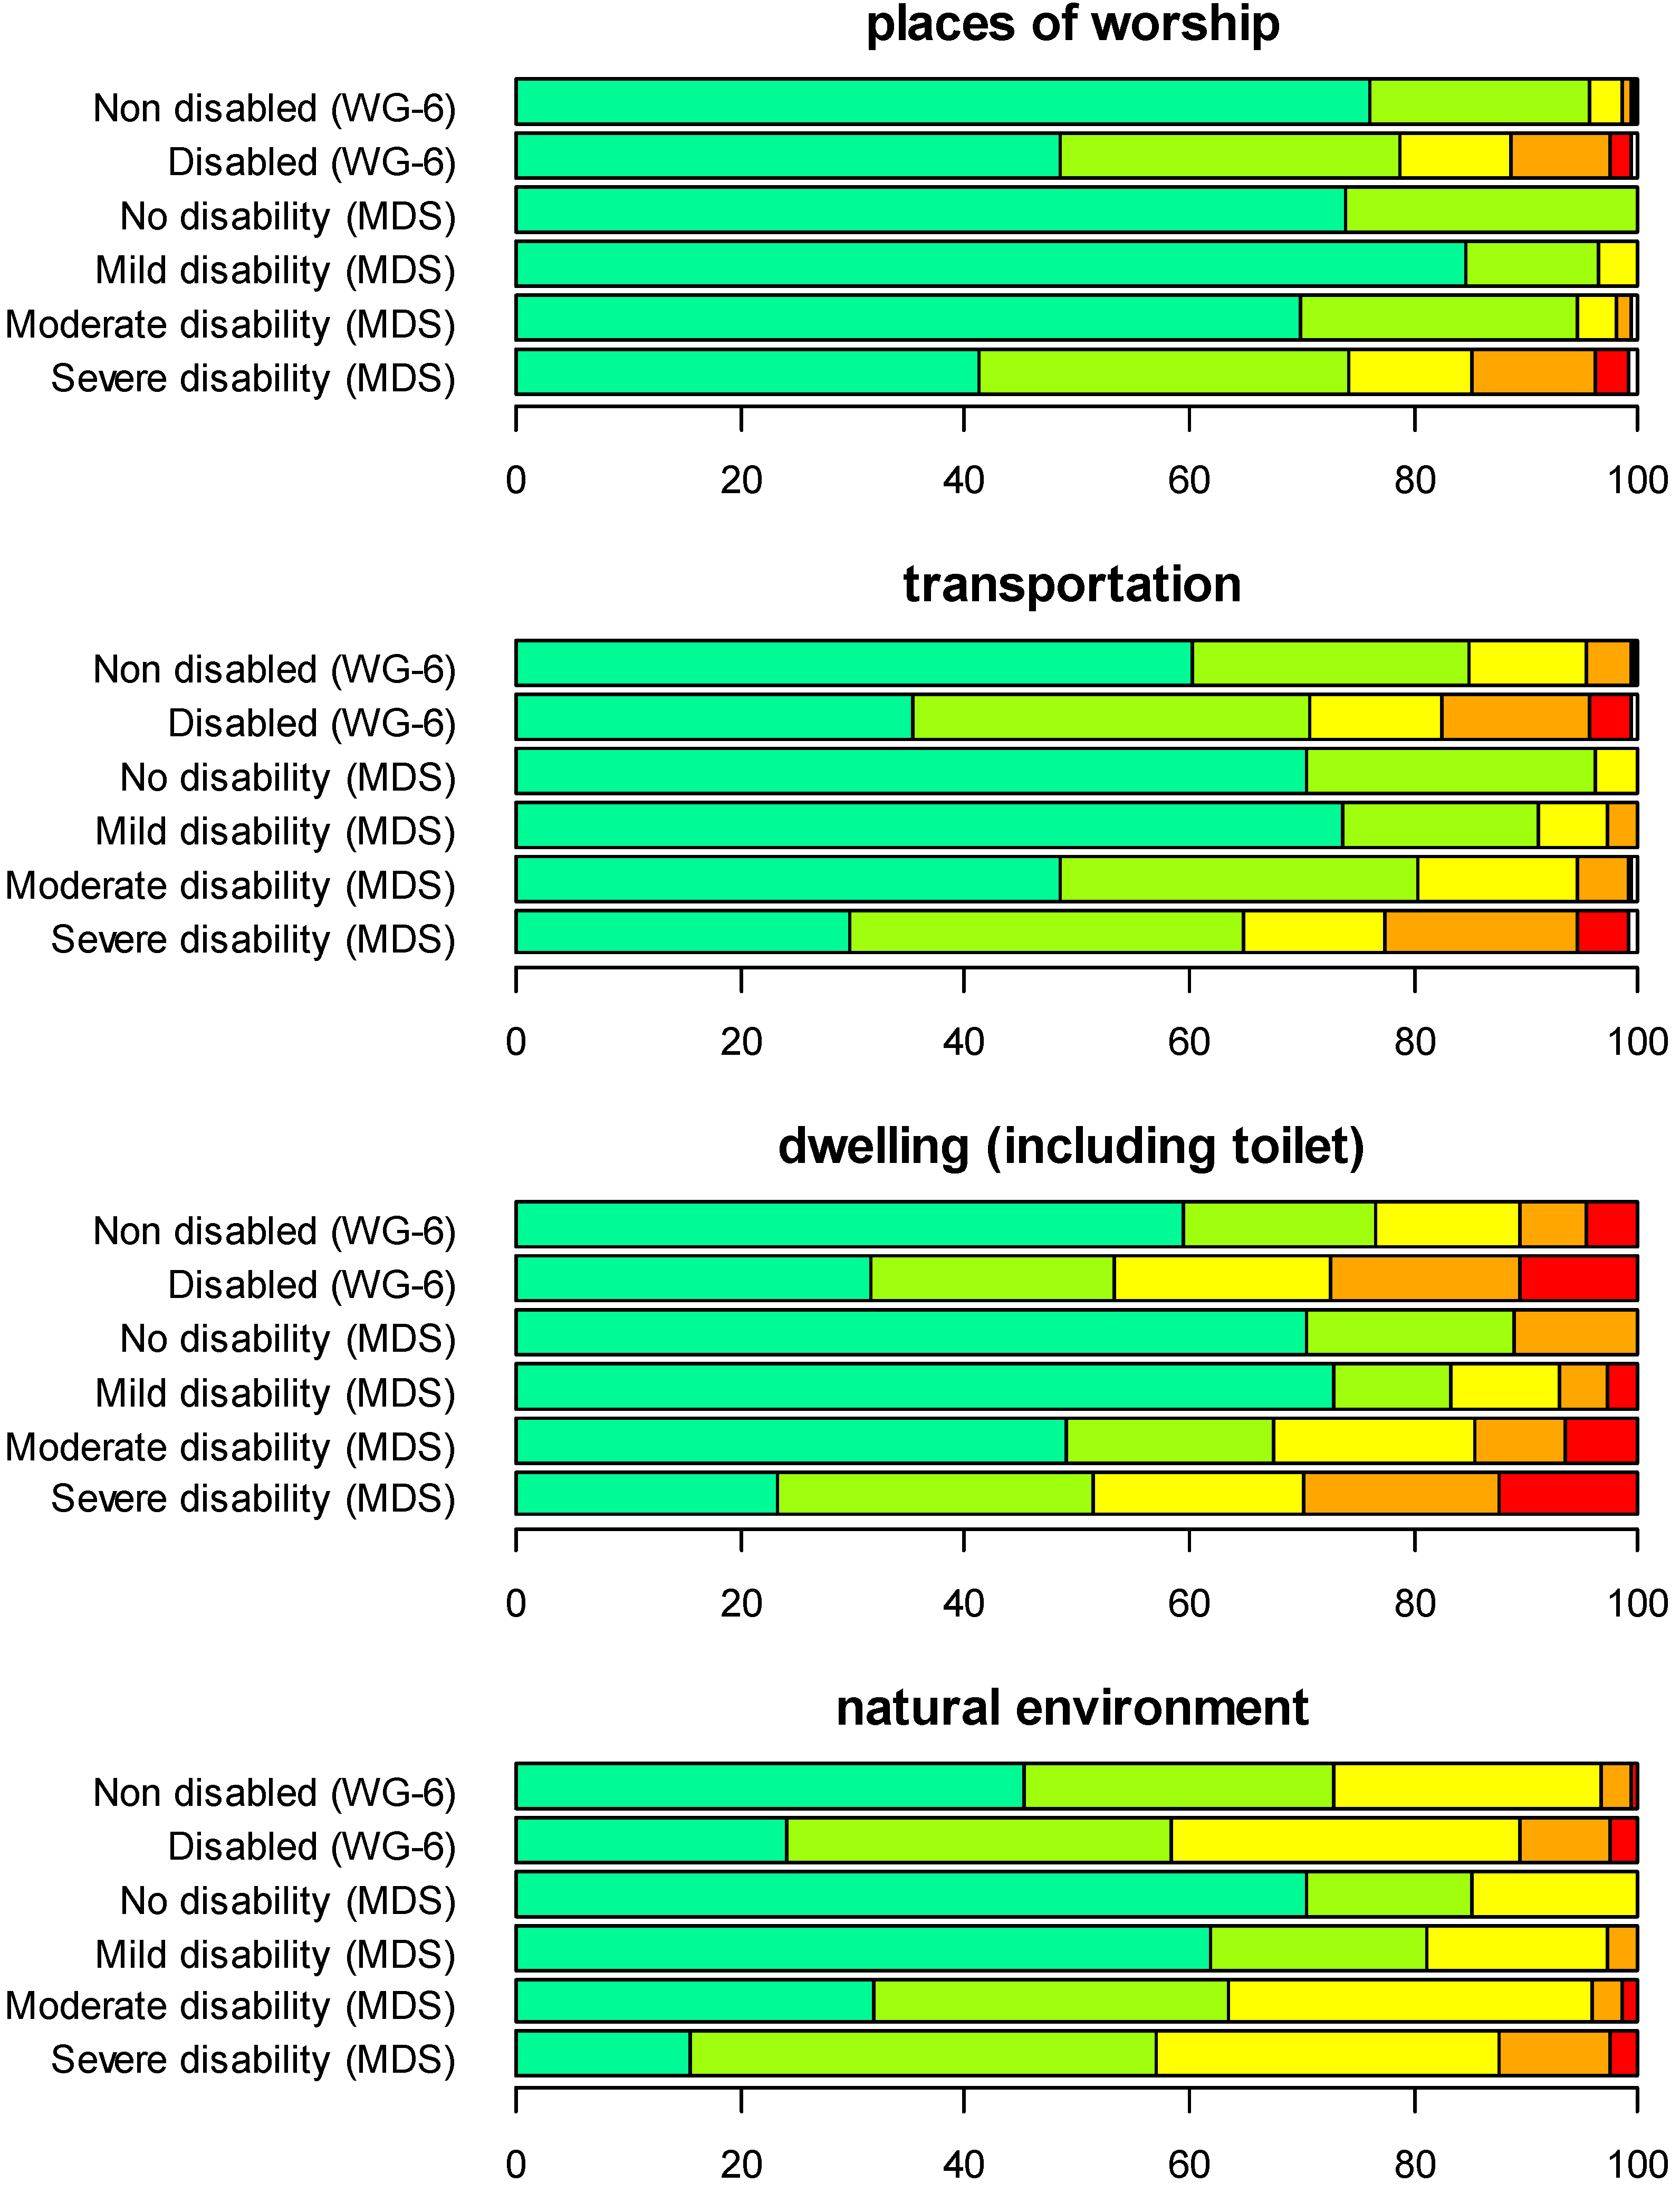
| I3005 | To what extent do your regular places of worship make it easy or hard for you to worship? |
| I3006 | To what extent does the transportation you need or want to use make it easy or hard for you to use it? |
| I3007 | How easy or hard does your dwelling (including toilet and all rooms) make it for you to do things you need or want to do? |
| I3008 | How easy or hard does your natural environment of the place you usually live—its temperature, terrain, and climate—make it for you to do things you need or want to do? |
| I3009 | How easy or hard does the lighting, noise, and crowds, in your surroundings make it for you to do things you need or want to do? |
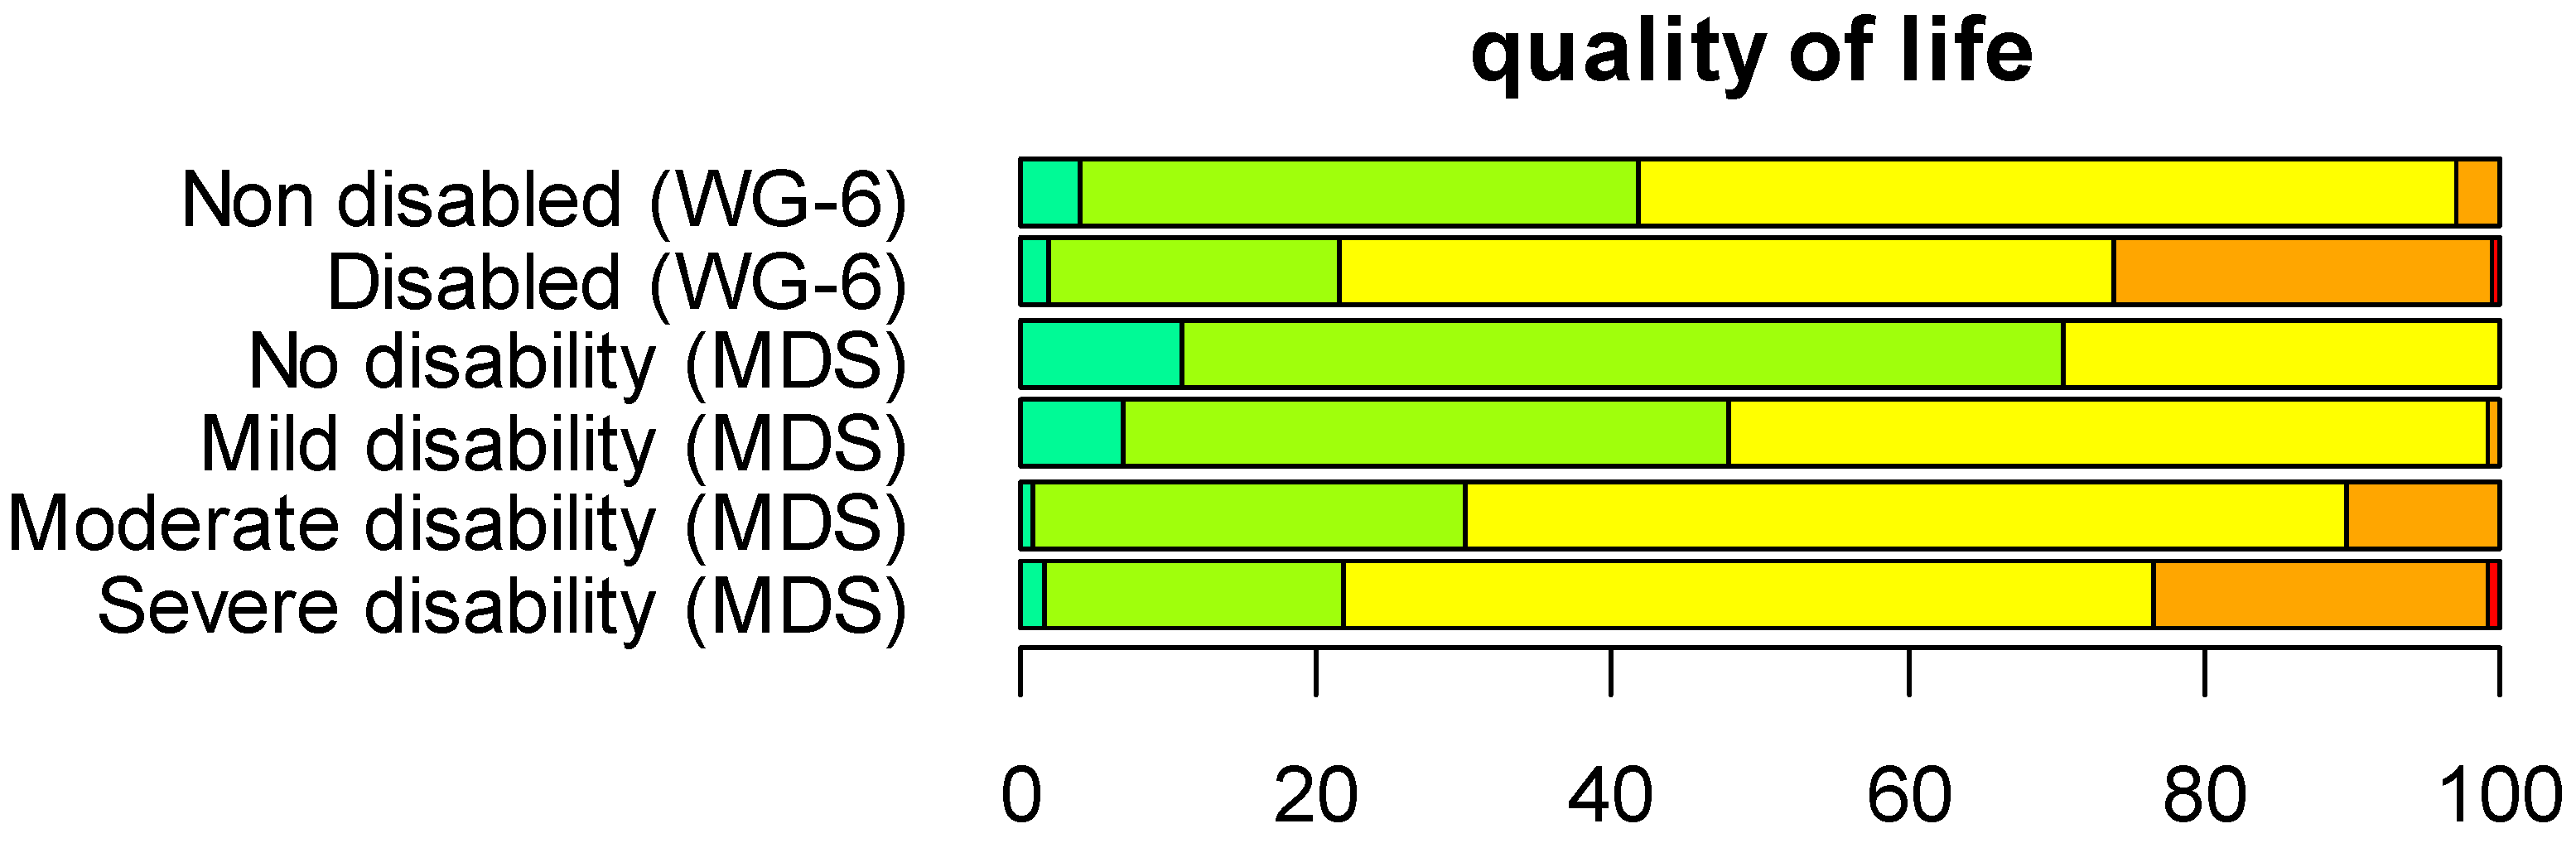
| Block 3 | Quality of Life |
| I7001 | In the past 30 days, how would you rate your quality of life? |
3. Results
3.1. Sample
| No. of Persons | % | ||
|---|---|---|---|
| Gender | Male | 193 | 38.6 |
| Female | 307 | 61.4 | |
| Marital Status | Never married | 44 | 8.8 |
| Married | 368 | 73.6 | |
| Cohabiting | 24 | 4.8 | |
| Separated/divorced | 8 | 1.6 | |
| Widowed | 56 | 11.2 | |
| Education Level | No schooling or no grade completed | 95 | 19.0 |
| Elementary education | 214 | 42.8 | |
| Vocational education | 5 | 1.0 | |
| Secondary school | 170 | 34.0 | |
| University | 13 | 2.6 | |
| Post-graduate studies | 3 | 0.01 | |
| Work Situation | Not working | 29 | 5.8 |
| Working for wages or salary with an employer (full- or part-time) | 79 | 15.8 | |
| Working for wages, currently on sick leave >3 months | 6 | 1.2 | |
| Self-employed or own-account worker | 270 | 54.0 | |
| Working as unpaid family member | 50 | 10.0 | |
| Retired due to age | 5 | 1.0 |
3.2. Capacity Metric

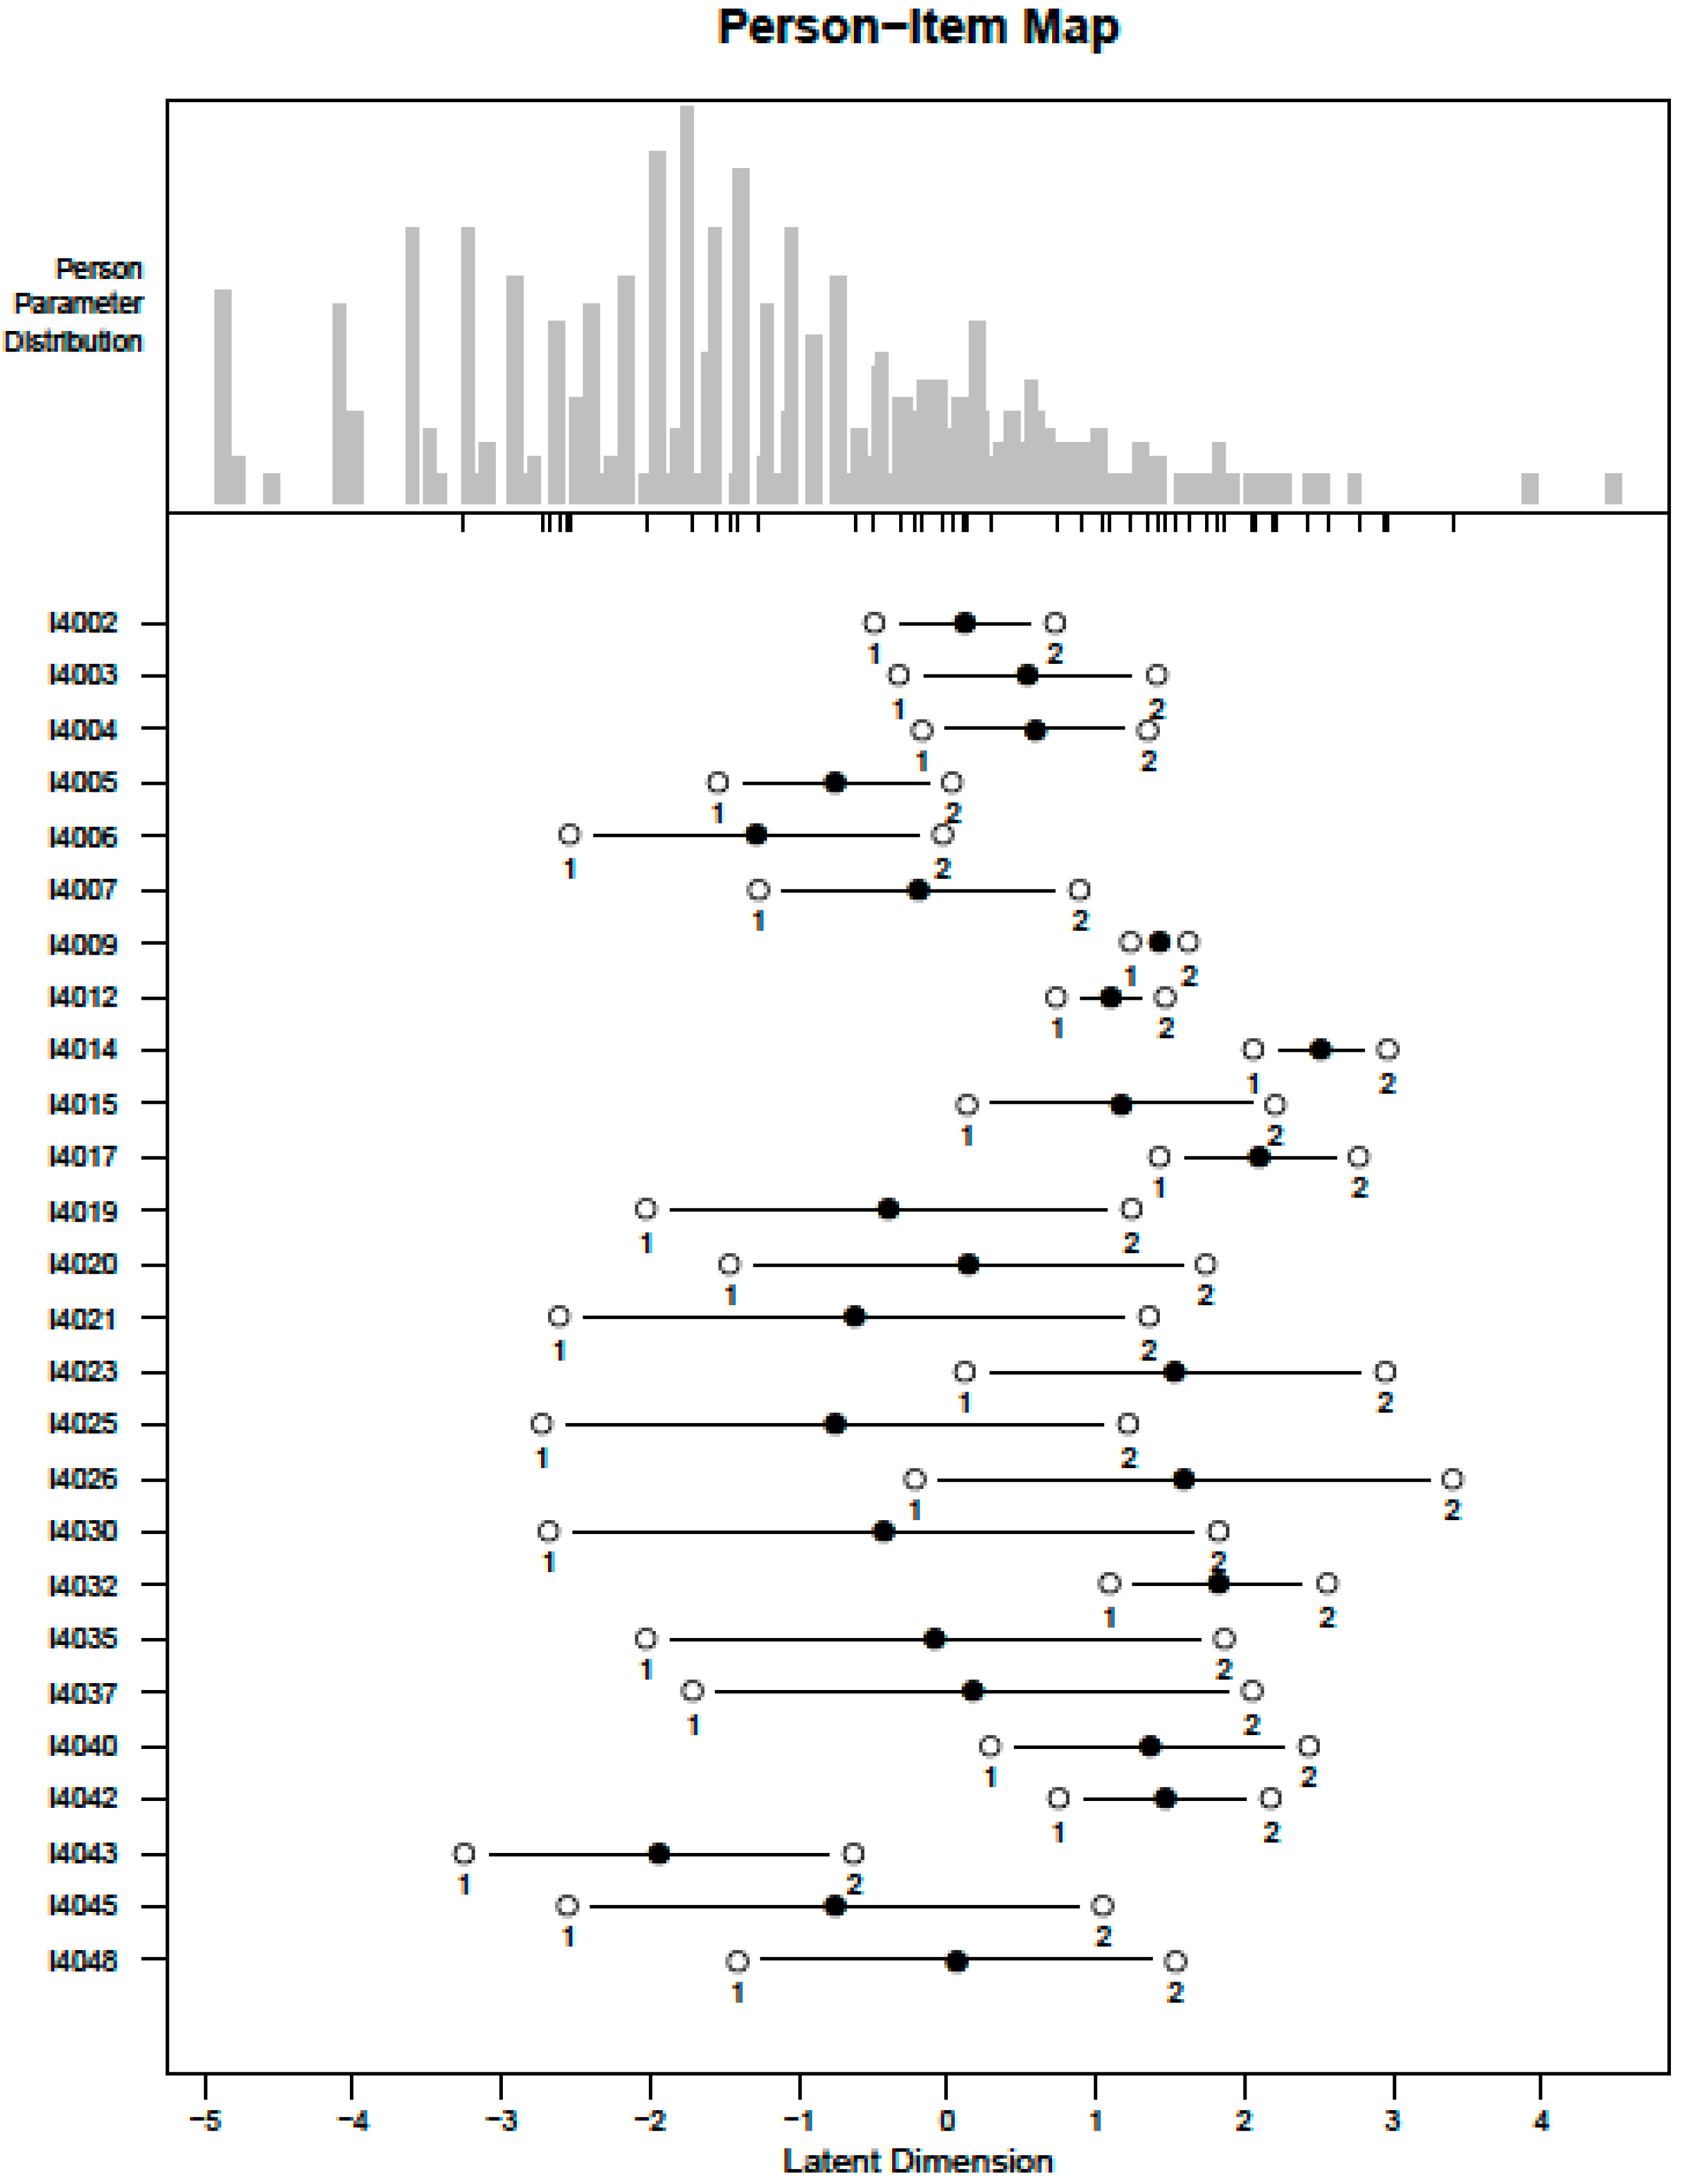
3.3. Performance Metric
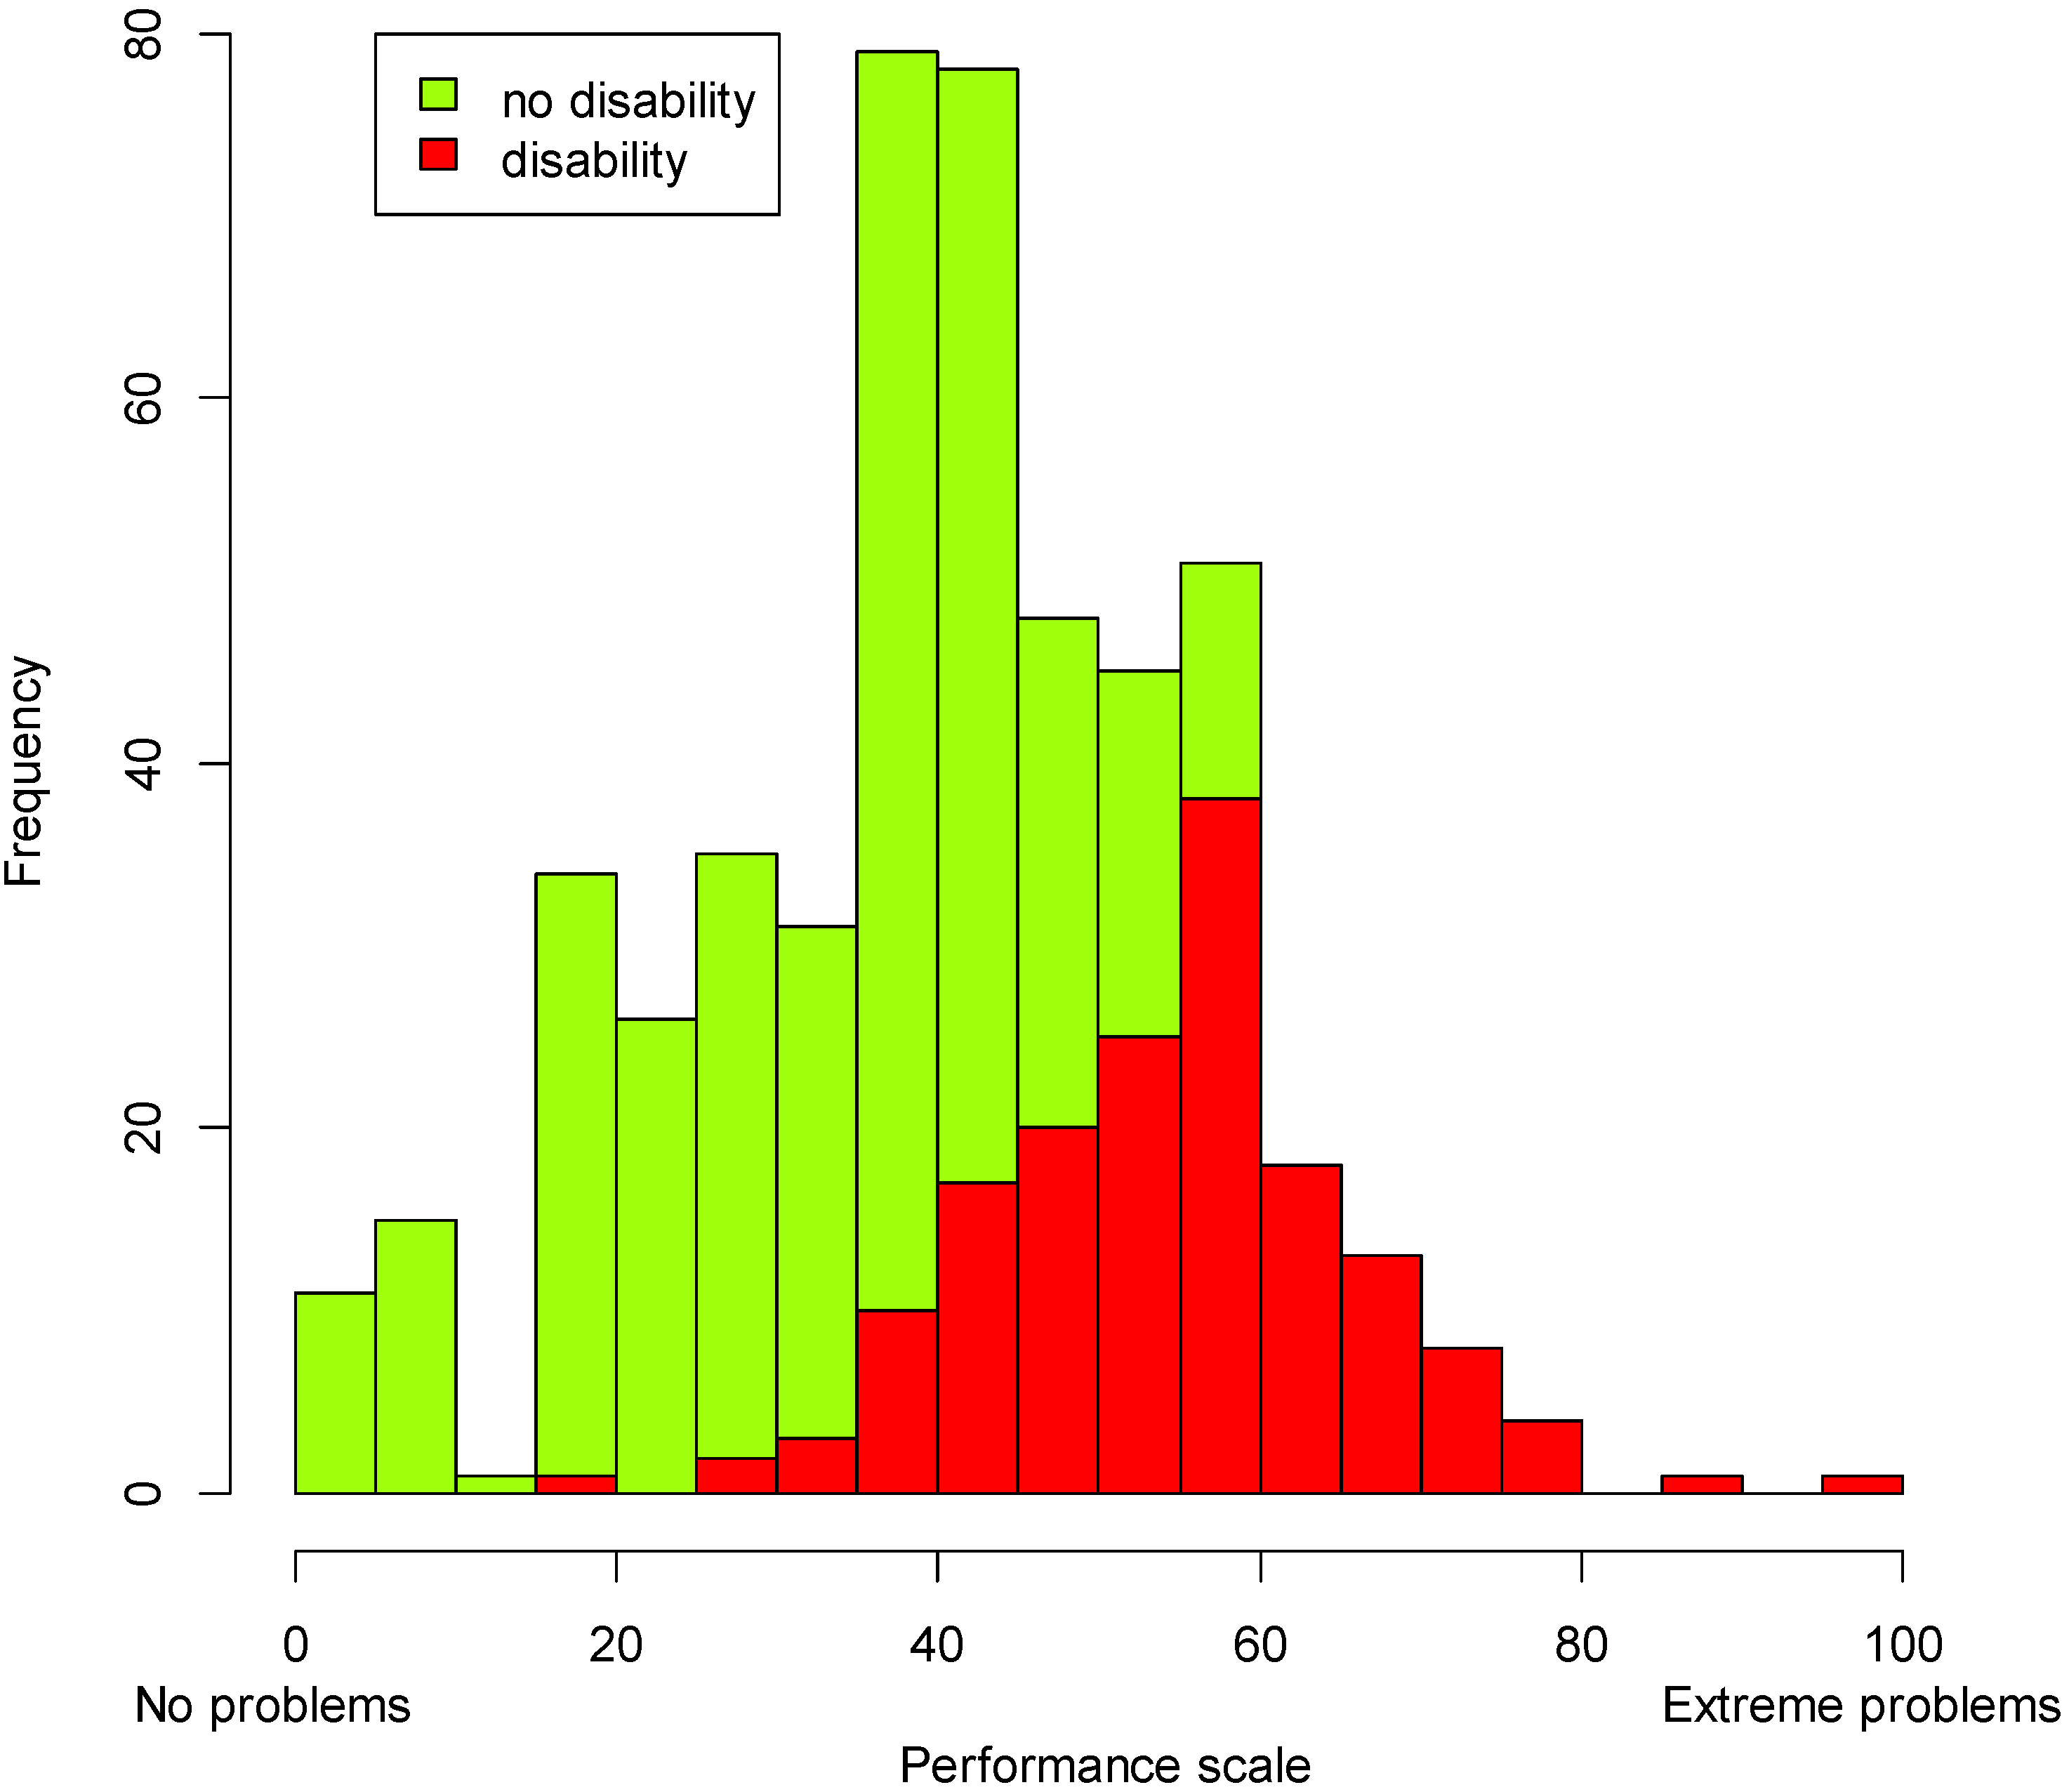
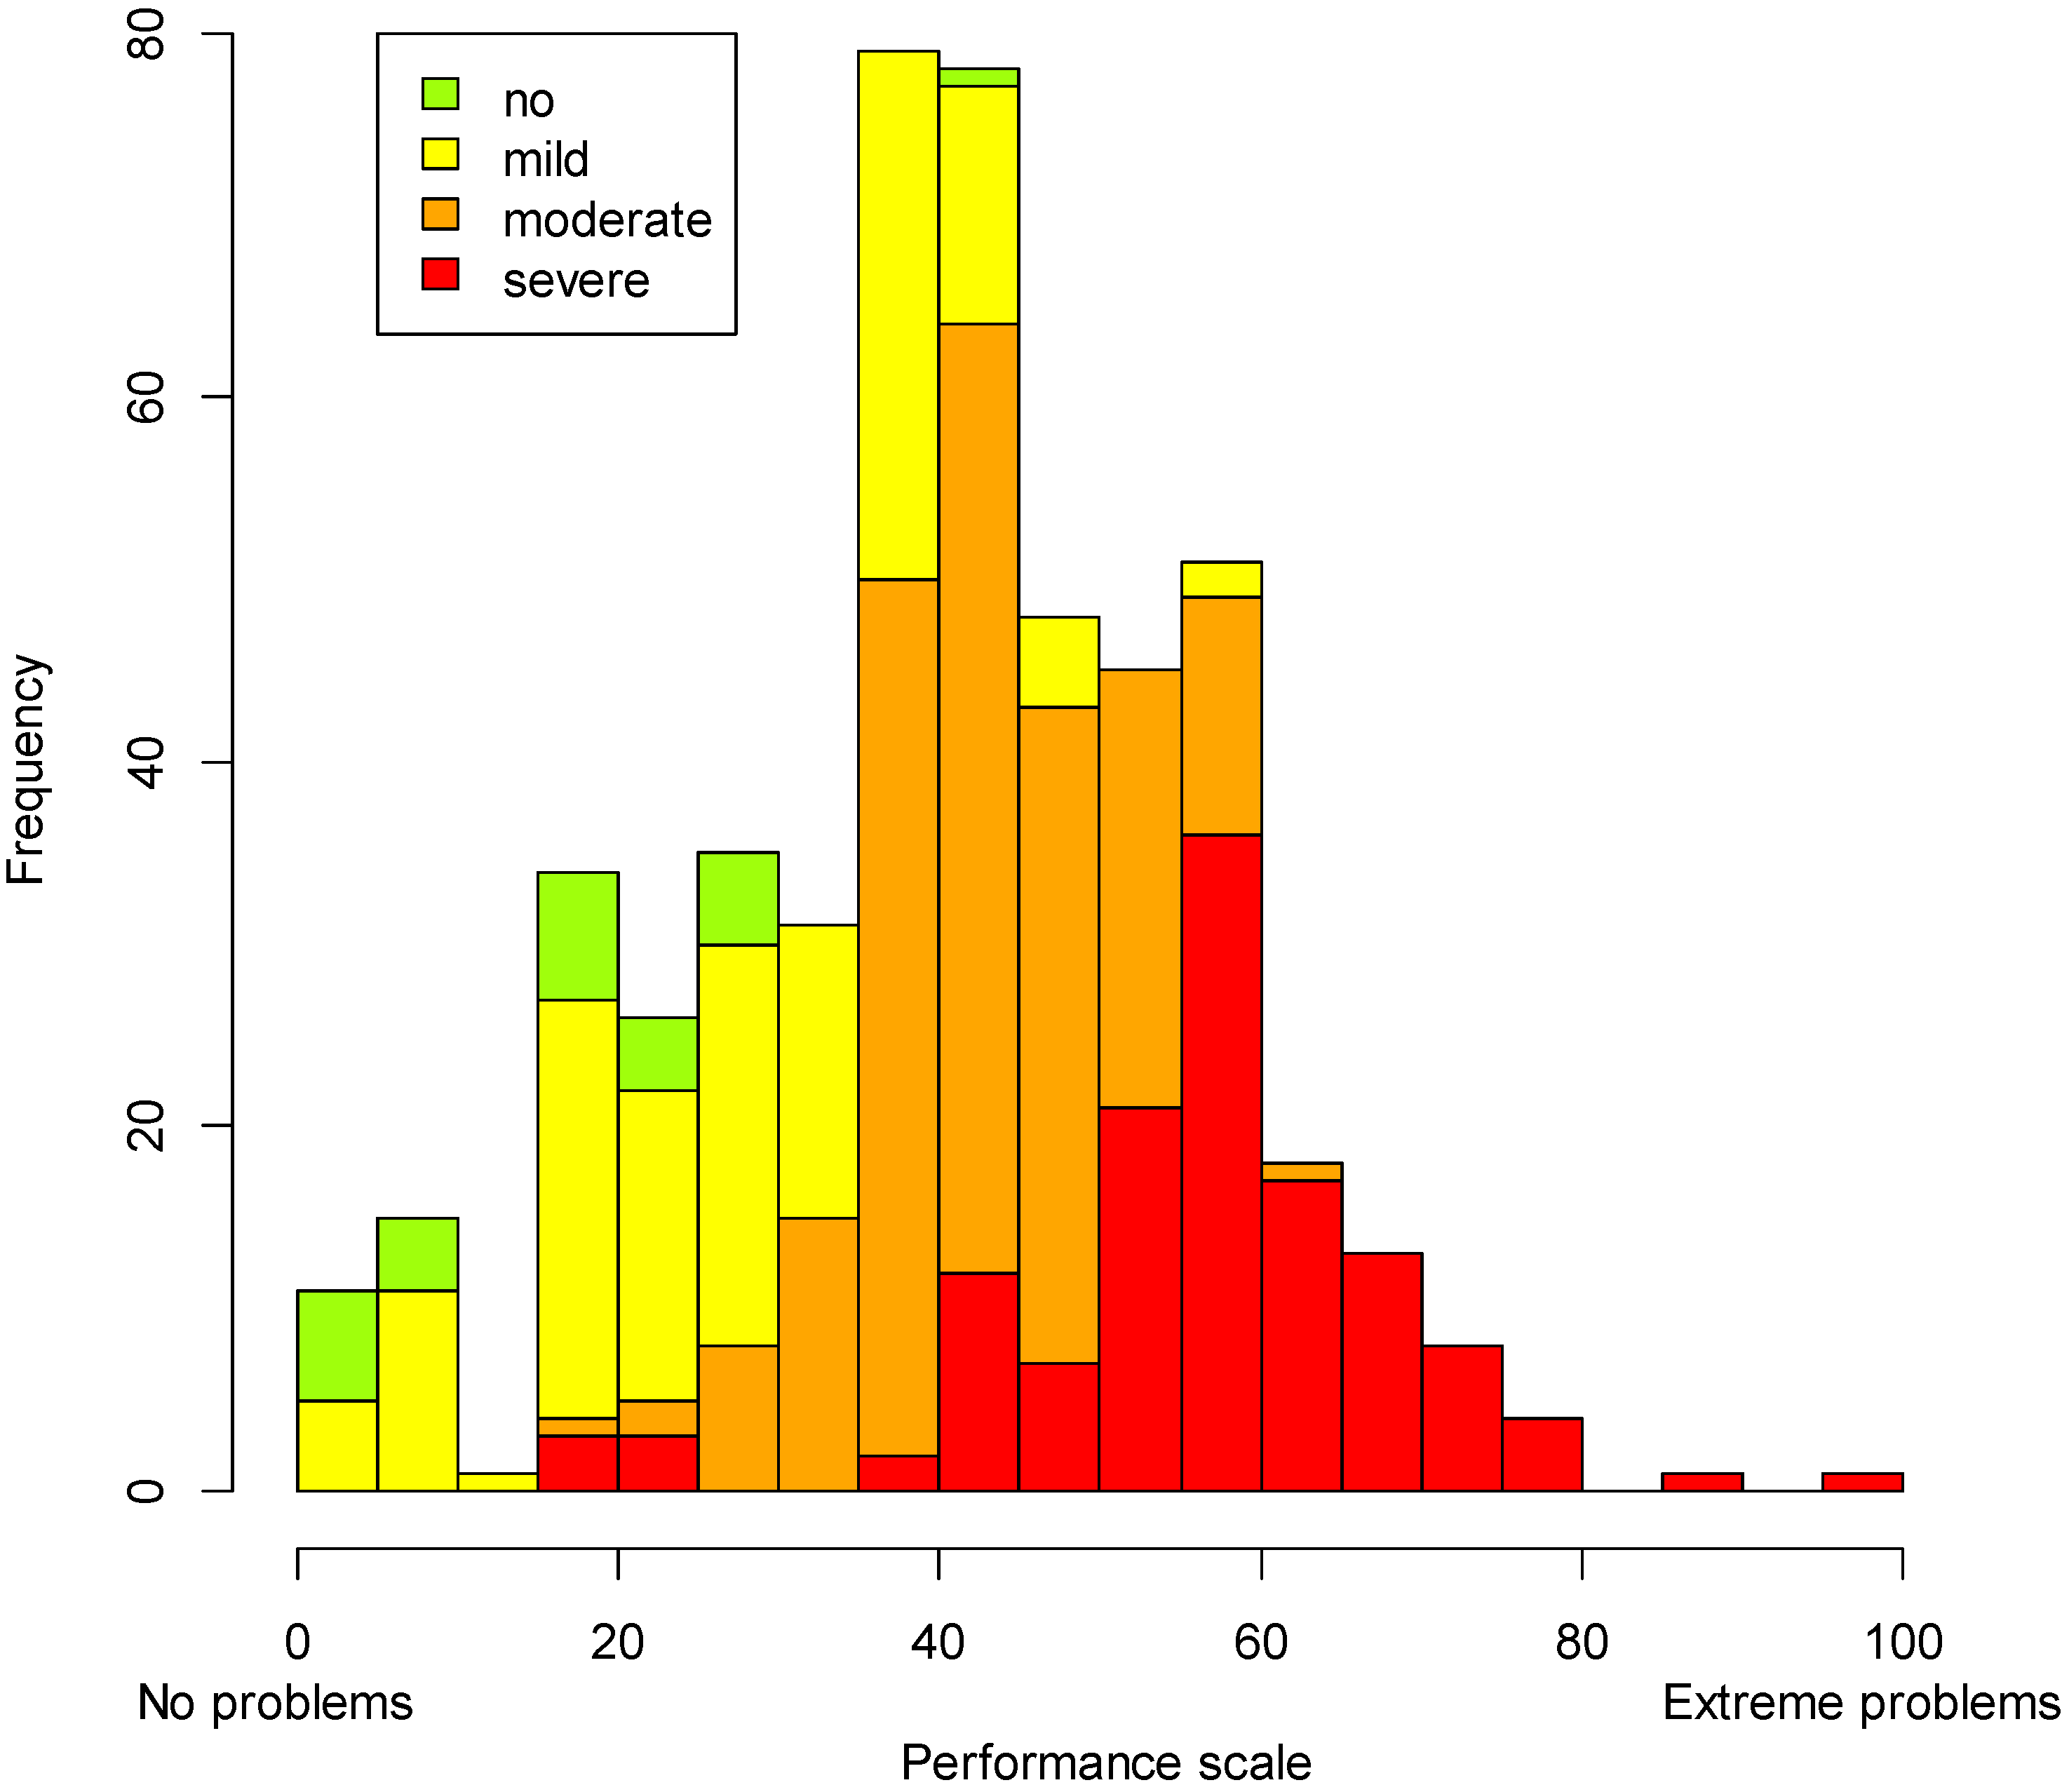
3.4. Disability Rates
| Functioning Screener WG-6 | |||
|---|---|---|---|
| Cut-off WRD Approach | Not disabled | Disabled | Total |
| Severe | 28 (22%) | 100 (78%) | 128 (100%) |
| Moderate | 141 (71%) | 59 (29%) | 200 (100%) |
| Mild | 142 (99%) | 2 (1%) | 144 (100%) |
| No disability | 27 (100%) | 0 | 27 (100%) |
| Total | 338 (68%) | 161 (32%) | 499 (100%) |
3.5. Comparison of Disabled versus Non-Disabled Individuals
3.5.1. Performance Levels (Performance Metric)
3.5.2. Sociodemographic Aspects
| Functioning Screener WG-6 | Cut-off WRD Approach | ||||||
|---|---|---|---|---|---|---|---|
| N | Not Disabled N = 338 | Disabled N = 161 | No Disability N = 27 | Mild Disability N = 144 | Moderate Disability N = 200 | Severe Disability N = 128 | |
| Gender | |||||||
| Male (%) | 193 | 36.87 | 42,24 | 51.85 | 40.28 | 34.5 | 40.62 |
| Female (%) | 307 | 63.13 | 57.76 | 48.15 | 59.72 | 65.5 | 59.38 |
| Age (Ranges) | |||||||
| 17.5 to 39.5 years old (%) | 226 | 56.42 | 23.27 | 77.78 | 58.04 | 44.67 | 26.98 |
| 39.5 to 59.5 years old (%) | 200 | 37.01 | 47.8 | 18.52 | 36.36 | 47.21 | 39.68 |
| 59.5 to 100 years old (%) | 68 | 6.57 | 28.93 | 3.7 | 5.59 | 8.12 | 33.33 |
| Education | |||||||
| No schooling (or never completed any grade) (%) | 95 | 13.57 | 30.43 | 3.7 | 13.19 | 17 | 32.03 |
| Elementary education (%) | 214 | 42.18 | 44.1 | 25.93 | 38.89 | 48 | 42.19 |
| Secondary school (%) | 170 | 39.23 | 22.98 | 62.96 | 42.36 | 31 | 23.44 |
| Other school level completed * (%) | 21 | 5.01 | 2.48 | 7.41 | 5.56 | 4 | 2.34 |
| Work | |||||||
| Currently not working (%) | 29 | 4.7 | 11.67 | 3.7 | 4.51 | 4.4 | 14.43 |
| Working for wages or salary with an employer (%) | 79 | 18.5 | 16.67 | 29.63 | 15.79 | 19.23 | 15.46 |
| Self-employed or own-account worker (%) | 270 | 63.64 | 55.83 | 66.67 | 65.41 | 62.09 | 53.61 |
| Working as unpaid family member (%) | 50 | 11.91 | 10 | 0 | 13.53 | 12.09 | 10.31 |
| Other working situation** (%) | 11 | 1.25 | 5.83 | 0 | 0.75 | 2.2 | 6.19 |
3.5.3. Hindering and Facilitating Aspects of the Environment

3.5.4. Quality of Life

4. Discussion
5. Conclusions
Acknowledgments
Author Contributions
Conflicts of Interest
References and Notes
- Convention of the Rights of Persons with Disabilities. Available online: http://www.un.org/disabilities/convention/conventionfull.shtml (accessed on 30 October 2014).
- Palmer, M.; Harley, D. Models and measurement in disability: An international review. Health Policy Plan. 2012, 27, 357–364. [Google Scholar] [CrossRef] [PubMed]
- Molden, T.H.; Tøssebro, J. Disability measurements: Impact on research results. Scand. J. Disabil. Res. 2012, 14, 340–357. [Google Scholar] [CrossRef]
- Leonardi, M.; Bickenbach, J.; Ustun, T.B.; Kostanjsek, N.; Chatterji, S.; MHADIE Consortium. The definition of disability: What is in a name? Lancet 2006, 368, 1219–1221. [Google Scholar] [CrossRef]
- Coenen, M.; Cieza, A.; Officer, A.; Posarac, A.; Bickenbach, J.; Chatterji, S.; Kostanjsek, N.; Sabariego, C. How is disability being assessed worldwide? A content examination of selected disability and health surveys using the International Classification of Functioning, Disability and Health (ICF) as a framework. Int. J. Environ. Res. Public Health 2015. submitted. [Google Scholar]
- Madans, J.H.; Loeb, M.E.; Altman, B.M. Measuring disability and monitoring the UN Convention on the Rights of Persons with Disabilities: The work of the Washington Group on Disability Statistics. BMC Public Health 2011, 11 (Suppl 4). [Google Scholar] [CrossRef] [PubMed]
- Mair, P.; Hatzinger, R. Extended Rasch modeling: The ERM package for the application of IRT models in R. J. Stat. Softw. 2007, 20, 1–20. [Google Scholar]
- Bond, T.G.; Fox, C.M. Applying the Rasch Model: Fundamental Measurement in the Human Sciences, 2nd ed.; Lawrence Erlbaum Associates, Inc.: Mahwah, NJ, USA, 2007. [Google Scholar]
- Masters, G.N. A Rasch model for partial credit scoring. Psychometrika 1982, 47, 149–174. [Google Scholar] [CrossRef]
- Reeve, B.B.; Hays, R.D.; Bjorner, J.B.; Cook, K.F.; Crane, P.K.; Teresi, J.A.; Thissen, D.; Revicki, D.A.; Weiss, D.J.; Hambleton, R.K.; et al. Psychometric evaluation and calibration of health-related quality of life item banks: Plans for the patient-reported outcomes measurement information system (PROMIS). Med. Care 2007, 45, S22–S31. [Google Scholar] [CrossRef] [PubMed]
- Reise, S.P. The rediscovery of bifactor measurement models. Multivar. Behav. Res. 2012, 47, 667–696. [Google Scholar] [CrossRef] [PubMed]
- Jennrich, R.I.; Bentler, P.M. Exploratory bi-factor analysis. Psychometrika 2011, 76, 537–549. [Google Scholar] [CrossRef] [PubMed]
- Reise, S.P.; Morizot, J.; Hays, R.D. The role of the bifactor model in resolving dimensionality issues in health outcomes measures. Qual. Life Res. 2007, 16 (Suppl 1), 19–31. [Google Scholar] [CrossRef] [PubMed]
- Buja, A.; Eyuboglu, N. Remarks on parallel analysis. Multivar. Behav. Res. 1992, 27, 509–540. [Google Scholar] [CrossRef]
- Roscino, A.; Pollice, A. A generalization of the polychoric correlation coefficient. In Data Analysis, Classification and the Forward Search; Zani, S., Cerioli, A., Riani, M., Vichi, M., Eds.; Springer: Berlin, Germany, 2006; pp. 135–142. [Google Scholar]
- Ekström, J. A Generalized Definition of the Polychoric Correlation Coefficient; UC Los Angeles: Los Angeles, CA, USA, 2011. [Google Scholar]
- Reeve, B.B.; Fayers, P. Applying item response theory modeling for evaluating questionnaire item and scale properties. In Assessing Quality of Life in Clinical Trials: Methods of Practice, 2nd ed.; Fayers, P., Hays, R.D., Eds.; Oxford University Press: Oxford, UK, 2005; pp. 55–73. [Google Scholar]
- Pallant, J.F.; Tennant, A. An introduction to the Rasch measurement model: An example using the Hospital Anxiety and Depression Scale (HADS). Brit. J. Clin. Psychol. 2007, 46, 1–18. [Google Scholar] [CrossRef]
- Crane, P.K.; Gibbons, L.E.; Jolley, L.; van Belle, G. Differential item functioning analysis with ordinal logistic regression techniques: DIFdetect and DIFwithpar. Med. Care 2006, 44, S115–S123. [Google Scholar] [CrossRef] [PubMed]
- Choi, S.W.; Gibbons, L.E.; Crane, P.K. Lordif: An R package for detecting differential item functioning using iterative hybrid ordinal logistic regression/item response theory and monte carlo simulations. J. Stat. Softw. 2011, 39, 1–30. [Google Scholar] [PubMed]
- Smith, A.B.; Rush, R.; Fallowfield, L.J.; Velikova, G.; Sharpe, M. Rasch fit statistics and sample size considerations for polytomous data. BMC Med. Res. Methodol. 2008, 8, 33. [Google Scholar] [CrossRef] [PubMed]
- Eide, A.H.; Jele, B. Living Conditions among People with Disabilities in Swaziland—A National Representative Study; SINTEF: Oslo, Norway, 2011. [Google Scholar]
- R Development Core Team R. A Language and Environment for Statistical Computing; R Foundation for Statistical Computing: Vienna, Austria, 2013. [Google Scholar]
- National Secretariat of the Rights of Persons with Disabilities. Summary of the 2010 census—People with disabilities; National Secretariat of the Rights of Persons with Disabilities: Brasília, Brazil, 2012. (In Portuguese) [Google Scholar]
© 2015 by the authors; licensee MDPI, Basel, Switzerland. This article is an open access article distributed under the terms and conditions of the Creative Commons Attribution license (http://creativecommons.org/licenses/by/4.0/).
Share and Cite
Sabariego, C.; Oberhauser, C.; Posarac, A.; Bickenbach, J.; Kostanjsek, N.; Chatterji, S.; Officer, A.; Coenen, M.; Chhan, L.; Cieza, A. Measuring Disability: Comparing the Impact of Two Data Collection Approaches on Disability Rates. Int. J. Environ. Res. Public Health 2015, 12, 10329-10351. https://doi.org/10.3390/ijerph120910329
Sabariego C, Oberhauser C, Posarac A, Bickenbach J, Kostanjsek N, Chatterji S, Officer A, Coenen M, Chhan L, Cieza A. Measuring Disability: Comparing the Impact of Two Data Collection Approaches on Disability Rates. International Journal of Environmental Research and Public Health. 2015; 12(9):10329-10351. https://doi.org/10.3390/ijerph120910329
Chicago/Turabian StyleSabariego, Carla, Cornelia Oberhauser, Aleksandra Posarac, Jerome Bickenbach, Nenad Kostanjsek, Somnath Chatterji, Alana Officer, Michaela Coenen, Lay Chhan, and Alarcos Cieza. 2015. "Measuring Disability: Comparing the Impact of Two Data Collection Approaches on Disability Rates" International Journal of Environmental Research and Public Health 12, no. 9: 10329-10351. https://doi.org/10.3390/ijerph120910329
APA StyleSabariego, C., Oberhauser, C., Posarac, A., Bickenbach, J., Kostanjsek, N., Chatterji, S., Officer, A., Coenen, M., Chhan, L., & Cieza, A. (2015). Measuring Disability: Comparing the Impact of Two Data Collection Approaches on Disability Rates. International Journal of Environmental Research and Public Health, 12(9), 10329-10351. https://doi.org/10.3390/ijerph120910329