
Oxidative Stress Mechanisms Caused by Ag Nanoparticles (NM300K) are Different from Those of AgNO3: Effects in the Soil Invertebrate Enchytraeus Crypticus


Abstract
:1. Introduction
2. Experimental Section
2.1. Test Organism
2.2. Test Materials
2.3. Test Soil and Spiking

| Test material | EC20 | EC50 | EC80 |
|---|---|---|---|
| AgNO3 | 45 | 60 | 96 |
| AgNP (NM 300K) | 60 | 170 | 225 |
2.4. Test Procedures
2.5. Biochemical Analysis
2.6. Data Analysis
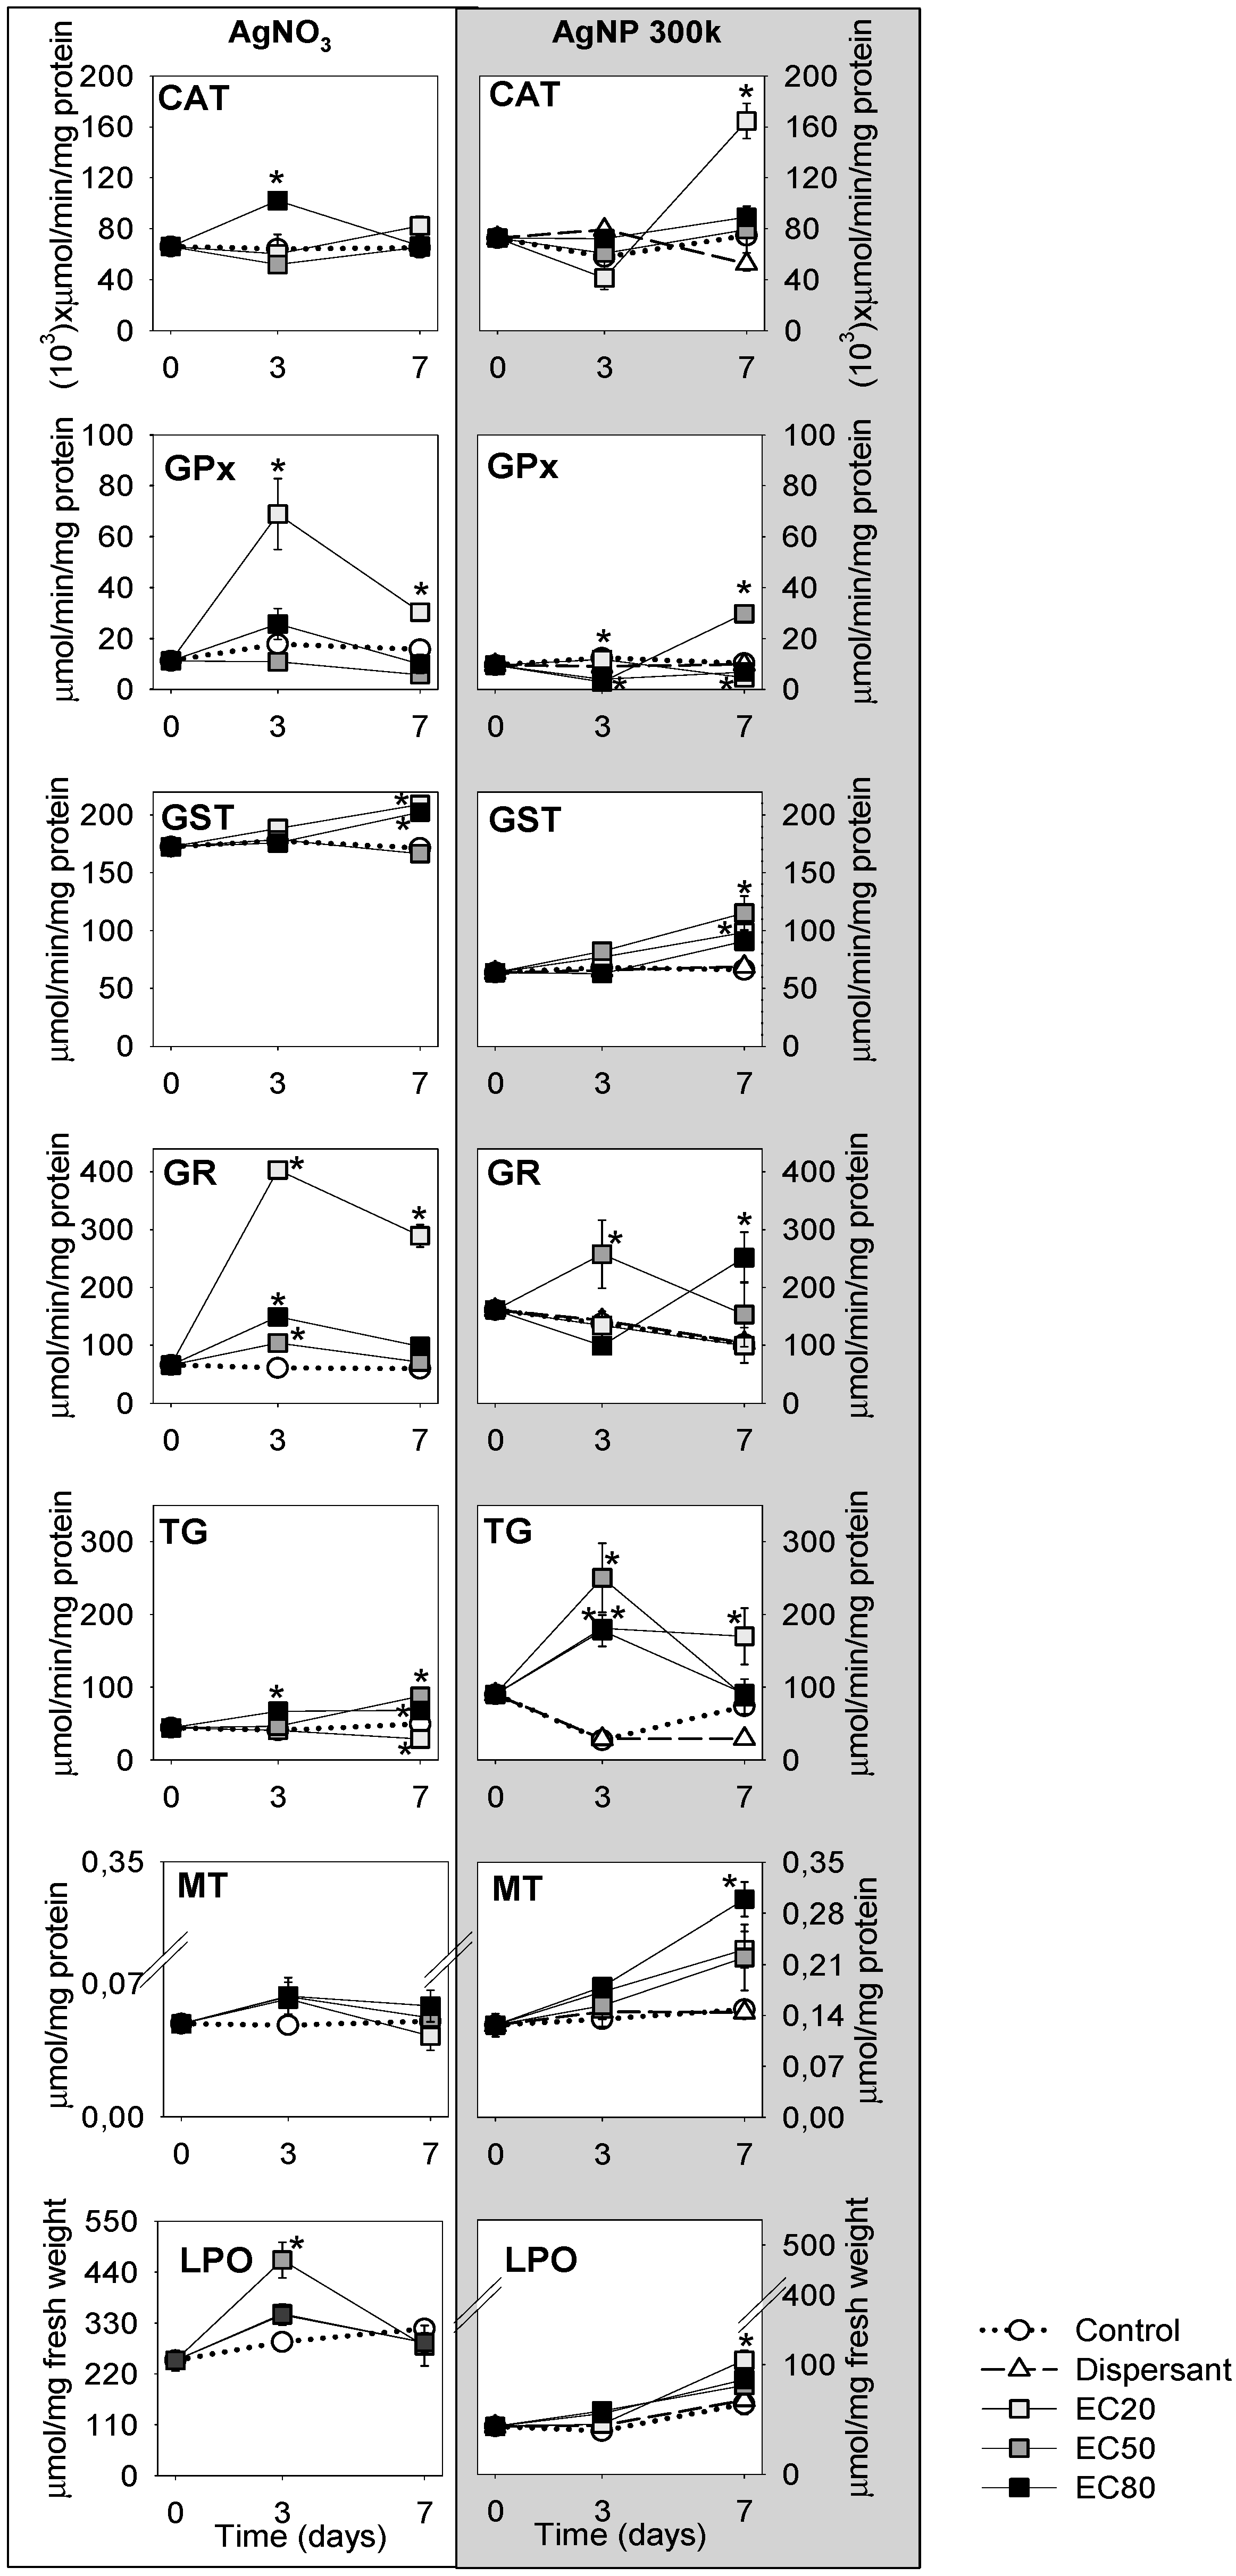
3. Results
3.1. Materials Characterisation
3.2. Biological Characterisation

4. Discussion
4.1. AgNO3 Mechanisms
4.2. AgNPs Mechanisms
4.3. Comparison of Ag Nano and Ag Salt Mechanisms

5. Conclusions
Acknowledgements
Author Contributions
Conflicts of Interest
References
- Massarsky, A.; Dupuis, L.; Taylor, J.; Eisa-Beygi, S.; Strek, L.; Trudeau, V.L.; Moon, T.W. Assessment of nanosilver toxicity during zebrafish (Danio rerio) development. Chemosphere 2013, 92, 59–66. [Google Scholar] [CrossRef] [PubMed]
- Ghosh, M.; Manivannan, J.; Sinha, S.; Chakraborty, A.; Mallick, S.K.; Bandyopadhyay, M.; Mukherjee, A. In vitro and in vivo genotoxicity of silver nanoparticles. Mutat. Res. 2012, 749, 60–69. [Google Scholar] [CrossRef] [PubMed]
- Ahamed, M.; Posgai, R.; Gorey, T.J.; Nielsen, M.; Hussain, S.M.; Rowe, J.J. Silver nanoparticles induced heat shock protein 70, oxidative stress and apoptosis in Drosophila melanogaster. Toxicol. Appl. Pharmacol. 2010, 242, 263–269. [Google Scholar] [CrossRef] [PubMed]
- Ahn, J.-M.; Eom, H.-J.; Yang, X.; Meyer, J.N.; Choi, J. Comparative toxicity of silver nanoparticles on oxidative stress and DNA damage in the nematode, Caenorhabditis elegans. Chemosphere 2014, 108, 343–352. [Google Scholar] [CrossRef] [PubMed]
- Hayashi, Y.; Heckmann, L.-H.; Simonsen, V.; Scott-Fordsmand, J.J. Time-course profiling of molecular stress responses to silver nanoparticles in the earthworm Eisenia fetida. Ecotoxicol. Environ. Saf. 2013, 98, 219–226. [Google Scholar] [CrossRef] [PubMed]
- Arora, S.; Jain, J.; Rajwade, J.M.; Paknikar, K.M. Cellular responses induced by silver nanoparticles: In vitro studies. Toxicol. Lett. 2008, 179, 93–100. [Google Scholar] [CrossRef] [PubMed]
- Choi, J.E.; Kim, S.; Ahn, J.H.; Youn, P.; Kang, J.S.; Park, K.; Yi, J.; Ryu, D.-Y. Induction of oxidative stress and apoptosis by silver nanoparticles in the liver of adult zebrafish. Aquat. Toxicol. 2010, 100, 151–159. [Google Scholar] [CrossRef] [PubMed]
- Park, E.-J.; Yi, J.; Kim, Y.; Choi, K.; Park, K. Silver nanoparticles induce cytotoxicity by a Trojan-horse type mechanism. Toxicol. In Vitro 2010, 24, 872–878. [Google Scholar] [CrossRef] [PubMed]
- Yang, X.; Gondikas, A.P.; Marinakos, S.M.; Auffan, M.; Liu, J.; Hsu-Kim, H.; Meyer, J.N. Mechanism of silver nanoparticle toxicity is dependent on dissolved silver and surface coating in Caenorhabditis elegans. Environ. Sci. Technol. 2012, 46, 1119–1127. [Google Scholar] [CrossRef] [PubMed]
- Hayashi, Y.; Engelmann, P.; Foldbjerg, R.; Szabó, M.; Somogyi, I.; Pollák, E.; Molnár, L.; Autrup, H.; Sutherland, D.S.; Scott-Fordsmand, J.; Heckmann, L.-H. Earthworms and humans in vitro: Characterizing evolutionarily conserved stress and immune responses to silver nanoparticles. Environ. Sci. Technol. 2012, 46, 4166–4173. [Google Scholar] [CrossRef] [PubMed]
- Gomes, S.I.L.; Soares, A.M.V.M.; Scott-Fordsmand, J.J.; Amorim, M.J.B. Mechanisms of response to silver nanoparticles on Enchytraeus albidus (Oligochaeta): Survival, reproduction and gene expression profile. J. Hazard. Mater. 2013, 254–255, 336–344. [Google Scholar] [CrossRef] [PubMed]
- Kwak, J.I.; Lee, W.-M.; Kim, S.W.; An, Y.-J. Interaction of citrate-coated silver nanoparticles with earthworm coelomic fluid and related cytotoxicity in Eisenia andrei. J. Appl. Toxicol. 2014, 34, 1145–1154. [Google Scholar] [CrossRef] [PubMed]
- Van der Ploeg, M.J.C.; Handy, R.D.; Waalewijn-Kool, P.L.; van den Berg, J.H.J.; Herrera Rivera, Z.E.; Bovenschen, J.; Molleman, B.; Baveco, J.M.; Tromp, P.; Peters, R.J.B.; et al. Effects of silver nanoparticles (NM-300K) on Lumbricus rubellus earthworms and particle characterization in relevant test matrices including soil. Environ. Toxicol. Chem. 2014, 33, 743–752. [Google Scholar] [CrossRef] [PubMed]
- Gomes, S.I.L.; Hansen, D.; Scott-Fordsmand, J.J.; Amorim, M.J.B. Effects of silver nanoparticles to soil invertebrates: Oxidative stress biomarkers in Eisenia fetida. Environ. Pollut. 2015, 199, 49–55. [Google Scholar] [CrossRef] [PubMed]
- Effects of Pollutants on Enchytraeidae (Enchytraeus sp.). In Determination of Effects on Reproduction and Survival; Guideline 16387; ISO: Geneva, Switzerland, 2005.
- Enchytraeid Reproduction Test. In Guidelines for the Teting of Chemicals No. 220; OECD: Paris, Franch, 2004.
- Castro-Ferreira, M.P.; Roelofs, D.; van Gestel, C.A.M.; Verweij, R.A.; Soares, A.M.V.M.; Amorim, M.J.B. Enchytraeus crypticus as model species in soil ecotoxicology. Chemosphere 2012, 87, 1222–1227. [Google Scholar] [CrossRef] [PubMed]
- Klein, C.L.; Comero, S.; Locoro, G.; Gawlik, B.M.; Linsinger, T.; Stahlmecke, B.; Romazanov, J.; Kuhlbusch, T.A.J.; Van Doren, E.; De Temmerman, P.J.; et al. NM-Series of Representative Manufactured Nanomaterials. NM-300 Silver. Characterisation, Stability, Homogeneity; Dictus Publishing: Luxembourg, Luxembourg, 2011. [Google Scholar]
- Gomes, S.I.L.; Novais, S.C.; Scott-Fordsmand, J.J.; De Coen, W.; Soares, A.M.V.M.; Amorim, M.J.B. Effect of Cu-nanoparticles versus Cu-salt in Enchytraeus albidus (Oligochaeta): Differential gene expression through microarray analysis. Comp. Biochem. Physiol. C Toxicol. Pharmacol. 2012, 155, 219–227. [Google Scholar] [CrossRef] [PubMed]
- Bradford, M.M. A rapid and sensitive method for the quantitation of microgram quantities of protein utilizing the principle of protein-dye binding. Anal. Biochem. 1976, 72, 248–254. [Google Scholar] [CrossRef]
- Clairborne, A. Catalase activity. In Handbook of Methods in Oxygen Radical Research; Greenwald, R., Ed.; CRC Press: Boca Raton, FL, USA, 1985. [Google Scholar]
- Giri, U.; Iqbal, M.; Athar, M. Porphyrin-mediated photosensitization has a weak tumor promoting activity in mouse skin: Possible role of in situ-generated reactive oxygen species. Carcinogenesis 1996, 17, 2023–2028. [Google Scholar] [CrossRef] [PubMed]
- Carlberg, I.; Mannervik, B. Purification and characterization of the flavoenzyme glutathione reductase from rat liver. J. Biol. Chem. 1975, 250, 5475–5480. [Google Scholar] [PubMed]
- Habig, W.H.; Pabst, M.J.; Jakoby, W.B. Glutathione S-transferases the first enzymatic step in mercapturic acid formation. J. Biol. Chem. 1974, 249, 7130–7139. [Google Scholar] [PubMed]
- Baker, M.A.; Cerniglia, G.J.; Zaman, A. Microtiter plate assay for the measurement of glutathione and glutathione disulfide in large numbers of biological samples. Anal. Biochem. 1990, 190, 360–365. [Google Scholar] [CrossRef]
- Tietze, F. Enzymic method for quantitative determination of nanogram amounts of total and oxidized glutathione: Applications to mammalian blood and other tissues. Anal. Biochem. 1969, 27, 502–522. [Google Scholar] [CrossRef]
- Ohkawa, H.; Ohishi, N.; Yagi, K. Assay for Lipid Peroxides in Animal Tissues Thiobarbituric Acid Reaction. Anal. Biochem. 1979, 358, 351–358. [Google Scholar] [CrossRef]
- Bird, R.P.; Draper, H.H. Comparative studies on different methods of malonaldehyde determination. Methods Enzymol. 1984, 105, 299. [Google Scholar] [PubMed]
- Wilhelm Filho, D.; Tribess, T.; Gaspari, C.; Claudio, F.D.; Torres, M.A.; Magalhaes, A.R.M. Seasonal changes in antioxidant defenses of the digestive gland of the brown mussel (Perna perna). Aquaculture 2001, 203, 149–158. [Google Scholar] [CrossRef]
- Viarengo, A.; Ponzano, E.; Donderob, F.; Fabbrih, R. A Simple Spectrophotometric Method for Metallothionein Evaluation in Marine Organisms: An application to mediterranean and antarctic molluscs. Mar. Environ. Res. 1997, 44, 69–84. [Google Scholar] [CrossRef]
- SigmaPlot Statistical Package for the Social Sciences, 11.0; Systat Software, Inc.: Chicago, IL, USA, 1997.
- SAS Enterprise Guide 5.1; SAS Institute Inc.: Cary, NC, USA, 2012.
- Baud, O.; Greene, A.E.; Li, J.; Wang, H.; Volpe, J.J.; Rosenberg, P. A Glutathione peroxidase-catalase cooperativity is required for resistance to hydrogen peroxide by mature rat oligodendrocytes. J. Neurosci. 2004, 24, 1531–1540. [Google Scholar] [CrossRef] [PubMed]
- Calabrese, E.J. Hormesis: Principles and applications for pharmacology and toxicology. Am. J. Pharmacol. Toxicol. 2008, 3, 59. [Google Scholar] [CrossRef]
- Xiu, Z.; Zhang, Q.; Puppala, H.L.; Colvin, V.L.; Alvarez, P.J.J. Negligible Particle-Specific Antibacterial Activity of Silver Nanoparticles. Nano Lett. 2012, 12, 4271–4275. [Google Scholar] [CrossRef] [PubMed]
- Braydich-Stolle, L.; Hussain, S.; Schlager, J.J.; Hofmann, M.-C. In vitro cytotoxicity of nanoparticles in mammalian germline stem cells. Toxicol. Sci. 2005, 88, 412–419. [Google Scholar] [CrossRef] [PubMed]
- Kawata, K.; Osawa, M.; Okabe, S. In vitro toxicity of silver nanoparticles at noncytotoxic doses to HepG2 human hepatoma cells. Environ. Sci. Technol. 2009, 43, 6046–6051. [Google Scholar] [CrossRef] [PubMed]
- Tsyusko, O.V.; Hardas, S.S.; Shoults-Wilson, W.A.; Starnes, C.P.; Joice, G.; Butterfield, D.A.; Unrine, J.M. Short-term molecular-level effects of silver nanoparticle exposure on the earthworm, Eisenia fetida. Environ. Pollut. 2012, 171, 249–255. [Google Scholar] [CrossRef] [PubMed]
- Hu, C.; Li, M.; Wang, W.; Cui, Y.; Chen, J.; Yang, L. Ecotoxicity of silver nanoparticles on earthworm Eisenia fetida : Responses of the antioxidant system, acid phosphatase and ATPase. Toxicol. Environ. Chem. 2012, 94, 732–741. [Google Scholar] [CrossRef]
- Wang, W.; Ballatori, N. Endogenous glutathione conjugates: Occurrence and biological functions. Pharmacol. Rev. 1998, 50, 335–356. [Google Scholar] [PubMed]
- Maria, V.L.; Ribeiro, M.J.; Amorim, M.J.B. Oxidative stress biomarkers and metallothionein in Folsomia candida - responses to Cu and Cd. Environ. Res. 2014, 133C, 164–169. [Google Scholar] [CrossRef] [PubMed]
- Nair, P.M.G.; Park, S.Y.; Choi, J. Evaluation of the effect of silver nanoparticles and silver ions using stress responsive gene expression in Chironomus riparius. Chemosphere 2013, 92, 592–599. [Google Scholar] [CrossRef] [PubMed]
- Schlich, K.; Klawonn, T.; Terytze, K.; Hund-Rinke, K. Effects of silver nanoparticles and silver nitrate in the earthworm reproduction test. Environ. Toxicol. Chem. 2013, 32, 181–188. [Google Scholar] [CrossRef] [PubMed]
- Van Leeuwen, H.P. Steady-state DGT fluxes of nanoparticulate metal complexes A. Environ. Chem. 2011, 8, 525–528. [Google Scholar] [CrossRef]
- He, W.; Zhou, Y.-T.; Wamer, W.G.; Boudreau, M.D.; Yin, J.-J. Mechanisms of the pH dependent generation of hydroxyl radicals and oxygen induced by Ag nanoparticles. Biomaterials 2012, 33, 7547–7555. [Google Scholar] [CrossRef] [PubMed]
- Baalousha, M.; Lead, J.R.; von der Kammer, F.; Hofmann, T. Natural Colloids and Nanoparticles in Aquatic and Terrestrial Environments. In Environmental and Human Health Impacts of Nanotechnology; John Wiley & Sons, Ltd: Chichester, UK, 2009; pp. 109–161. [Google Scholar]
- Yang, E.-J.; Kim, S.; Kim, J.S.; Choi, I.-H. Inflammasome formation and IL-1β release by human blood monocytes in response to silver nanoparticles. Biomaterials 2012, 33, 6858–6867. [Google Scholar] [CrossRef] [PubMed]
© 2015 by the authors; licensee MDPI, Basel, Switzerland. This article is an open access article distributed under the terms and conditions of the Creative Commons Attribution license (http://creativecommons.org/licenses/by/4.0/).
Share and Cite
Ribeiro, M.J.; Maria, V.L.; Scott-Fordsmand, J.J.; Amorim, M.J.B. Oxidative Stress Mechanisms Caused by Ag Nanoparticles (NM300K) are Different from Those of AgNO3: Effects in the Soil Invertebrate Enchytraeus Crypticus. Int. J. Environ. Res. Public Health 2015, 12, 9589-9602. https://doi.org/10.3390/ijerph120809589
Ribeiro MJ, Maria VL, Scott-Fordsmand JJ, Amorim MJB. Oxidative Stress Mechanisms Caused by Ag Nanoparticles (NM300K) are Different from Those of AgNO3: Effects in the Soil Invertebrate Enchytraeus Crypticus. International Journal of Environmental Research and Public Health. 2015; 12(8):9589-9602. https://doi.org/10.3390/ijerph120809589
Chicago/Turabian StyleRibeiro, Maria J., Vera L. Maria, Janeck J. Scott-Fordsmand, and Mónica J. B. Amorim. 2015. "Oxidative Stress Mechanisms Caused by Ag Nanoparticles (NM300K) are Different from Those of AgNO3: Effects in the Soil Invertebrate Enchytraeus Crypticus" International Journal of Environmental Research and Public Health 12, no. 8: 9589-9602. https://doi.org/10.3390/ijerph120809589
APA StyleRibeiro, M. J., Maria, V. L., Scott-Fordsmand, J. J., & Amorim, M. J. B. (2015). Oxidative Stress Mechanisms Caused by Ag Nanoparticles (NM300K) are Different from Those of AgNO3: Effects in the Soil Invertebrate Enchytraeus Crypticus. International Journal of Environmental Research and Public Health, 12(8), 9589-9602. https://doi.org/10.3390/ijerph120809589