
Sex and Age Differences in Mortality in Southern China, 2004–2010

Abstract
:1. Introduction
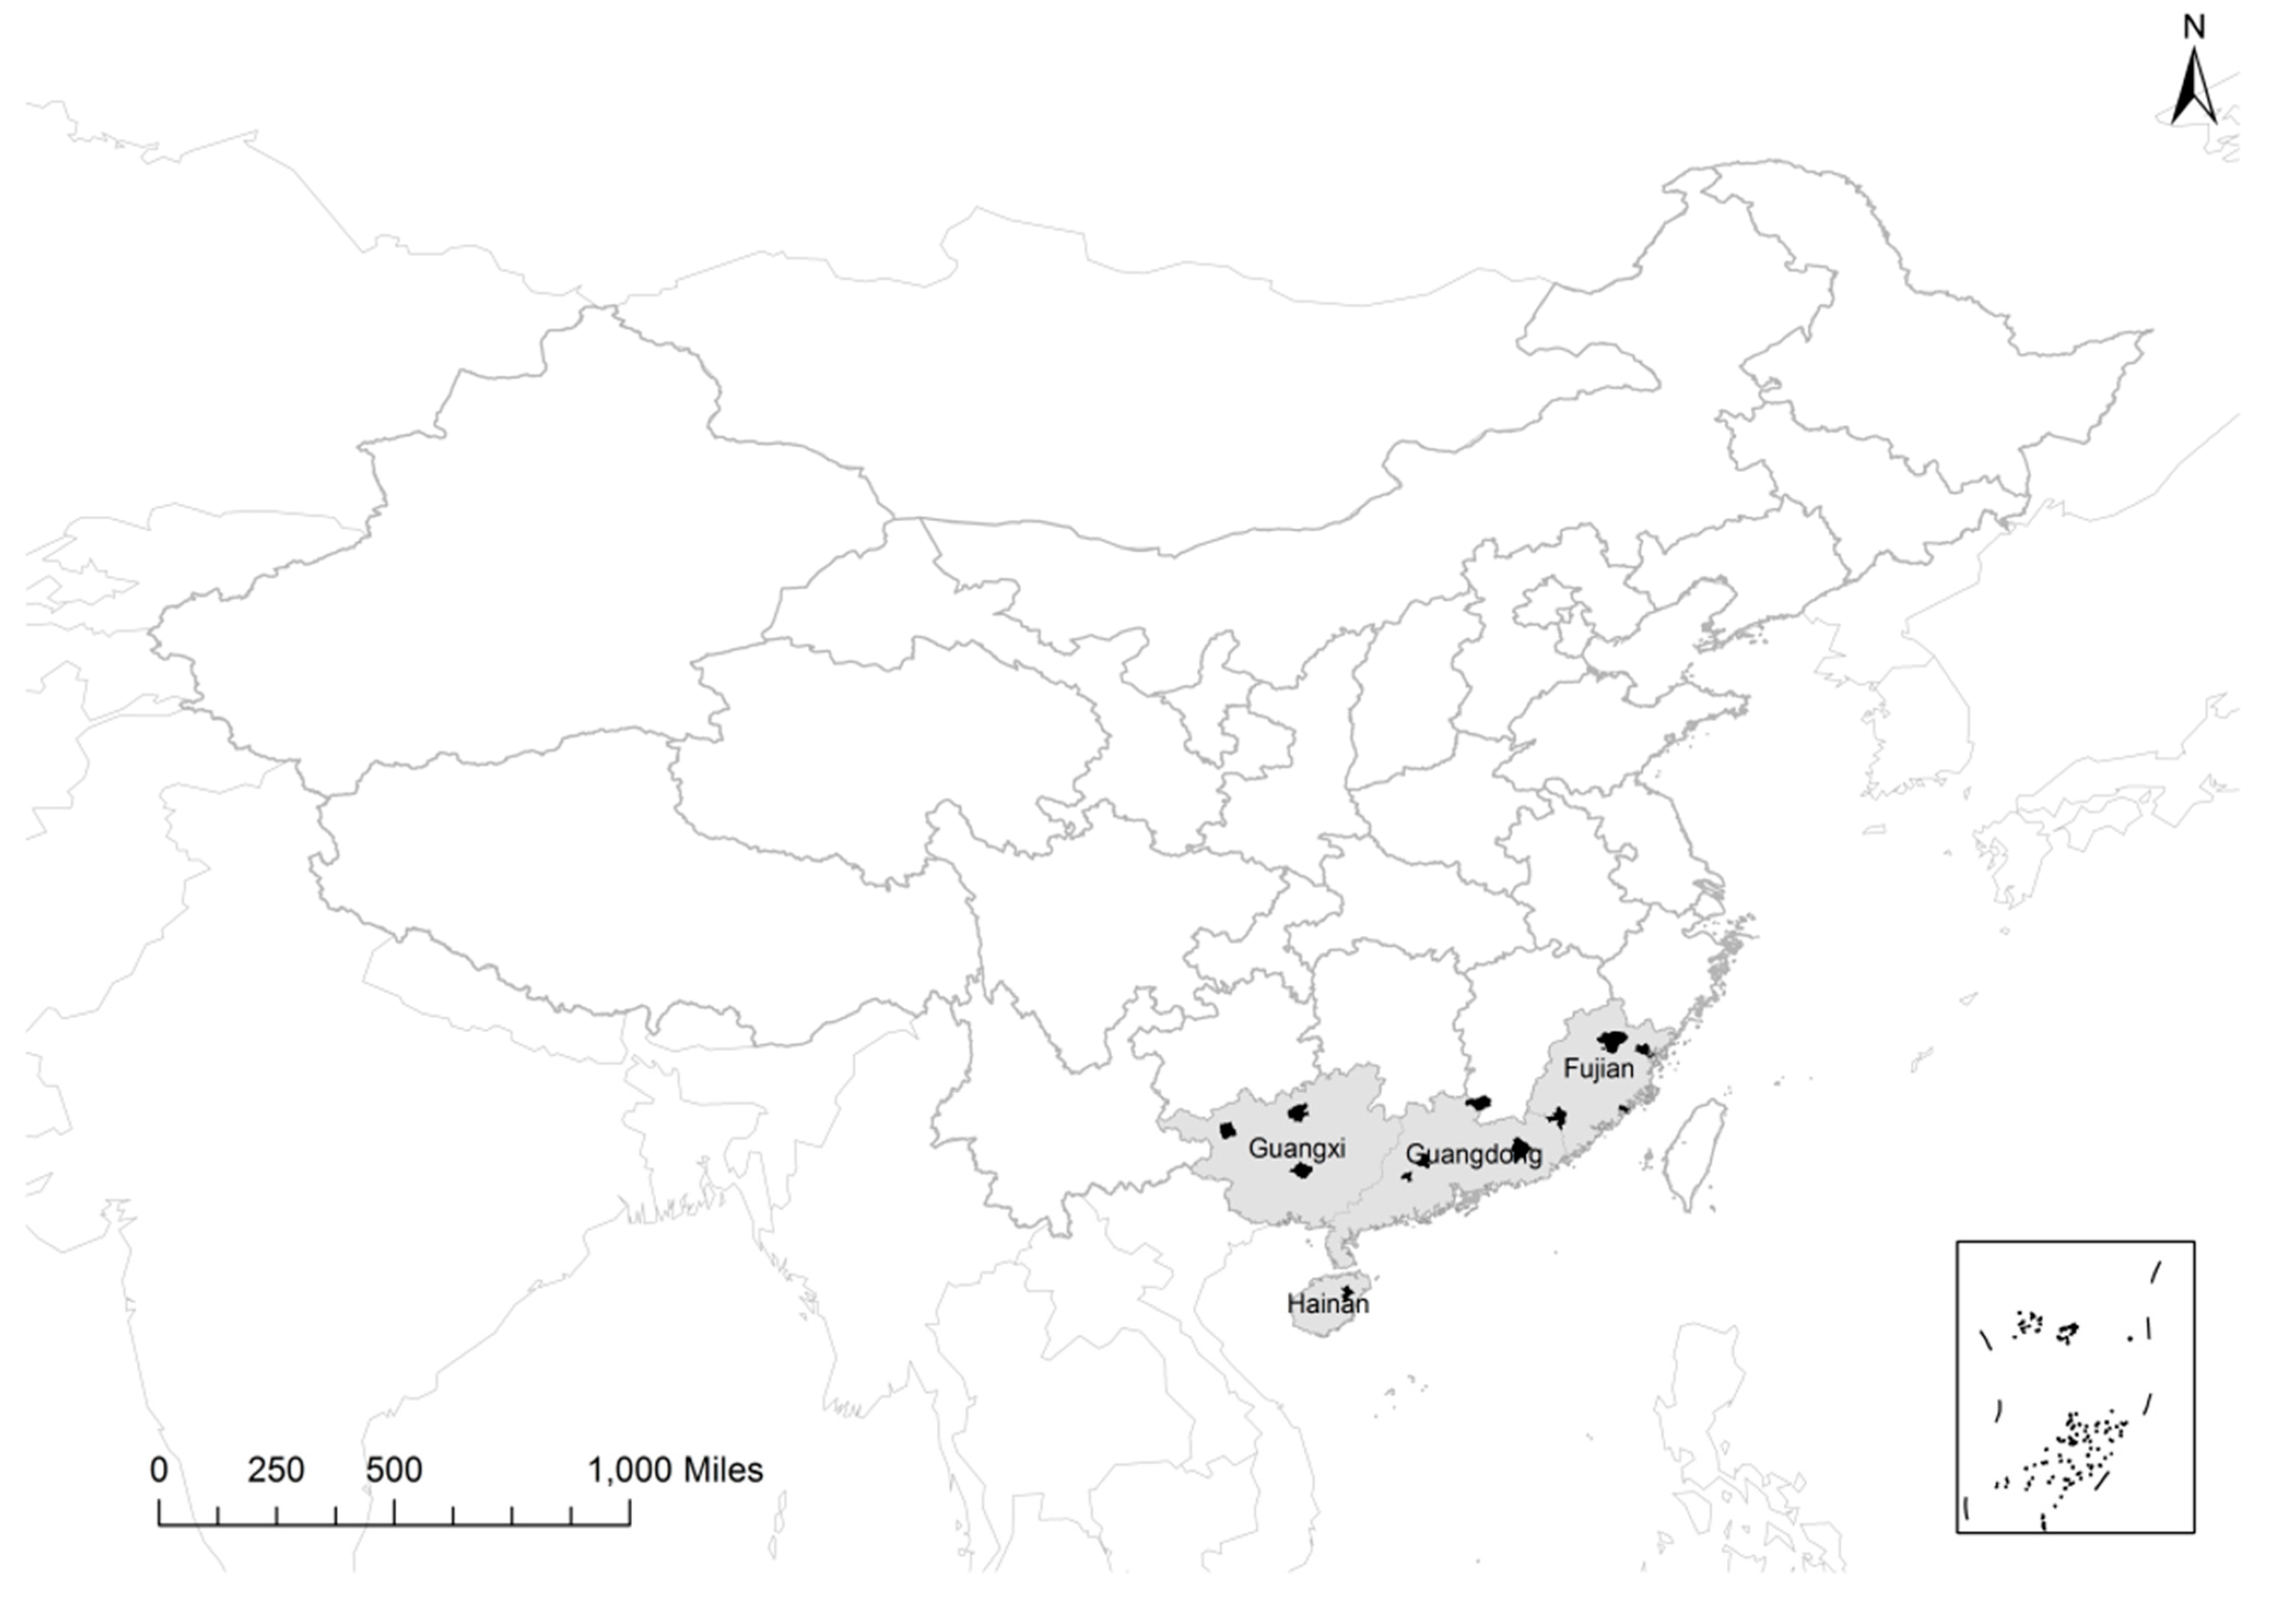
2. Materials and Methods
2.1. Source of Mortality and Population Data
2.2. Statistical Analysis
3. Results
3.1. Annual Mortality Rates

| Year | Population (Thousand) | Number of Deaths/100,000 People (% of All Cause Deaths) | |||||
|---|---|---|---|---|---|---|---|
| All Causes | Respiratory Diseases | COPD | Pneumonia and Influenza | Circulatory Diseases | Ischemic Heart Disease | ||
| 2004 | 6449 | 578.2 | 107.6 (18.6) | 88.4 (15.3) | 14.3 (2.5) | 188.1 (32.5) | 48.6 (8.4) |
| 2005 | 6503 | 580.5 | 112.0 (19.3) | 91.2 (15.7) | 15.5 (2.7) | 186.9 (32.2) | 47.3 (8.1) |
| 2006 | 6529 | 423.9 | 74.6 (17.6) | 58.2 (13.7) | 12.3 (2.9) | 136.3 (32.2) | 28.5 (6.7) |
| 2007 | 6571 | 506.2 | 88.4 (17.5) | 69.2 (13.7) | 15.2 (3.0) | 169.2 (33.4) | 39.9 (7.9) |
| 2008 | 6601 | 548.6 | 96.0 (17.5) | 75.7 (13.8) | 16.9 (3.1) | 192.5 (35.1) | 47.5 (8.7) |
| 2009 | 6294 | 593.6 | 102.1 (17.2) | 82.3 (13.9) | 16.0 (2.7) | 215.6 (36.3) | 55.4 (9.3) |
| 2010 | 6357 | 580.0 | 96.1 (16.6) | 75.6 (13.0) | 16.5 (2.8) | 212.0 (36.5) | 57.4 (9.9) |
| Mean | 6472 | 543.9 | 96.6 (17.8) | 77.2 (14.2) | 15.2 (2.8) | 185.5 (34.1) | 46.3 (8.5) |
| Year | Population (Thousand) | Age-Standardized Deaths Rates/100,000 People (% of All Cause Deaths) | |||||
| All Causes | Respiratory Diseases | COPD | Pneumonia and Influenza | Circulatory Diseases | Ischemic Heart Disease | ||
| 2004 | — | 578.1 | 106.1 (18.4) | 86.8 (15.0) | 14.4 (2.5) | 186.1 (32.2) | 48.1 (8.3) |
| 2005 | — | 577.7 | 109.7 (19.0) | 89.0 (15.4) | 15.6 (2.7) | 184.0 (31.9) | 46.6 (8.1) |
| 2006 | — | 429.4 | 75.0 (17.5) | 58.4 (13.6) | 12.5 (2.9) | 137.3 (32.0) | 28.7 (6.7) |
| 2007 | — | 507.2 | 87.9 (17.3) | 68.7 (13.5) | 15.3 (3.0) | 168.6 (33.2) | 39.8 (7.8) |
| 2008 | — | 568.9 | 101.6 (17.9) | 80.2 (14.1) | 17.8 (3.1) | 201.6 (35.4) | 49.8 (8.8) |
| 2009 | — | 586.2 | 102.4 (17.5) | 82.7 (14.1) | 16.0 (2.7) | 214.8 (36.7) | 55.1 (9.4) |
| 2010 | — | 571.9 | 95.9 (16.8) | 75.8 (13.3) | 16.1 (2.8) | 211.1 (36.9) | 57.1 (10.0) |
| Mean | — | 543.9 | 96.6 (17.8) | 77.2 (14.2) | 15.2 (2.8) | 185.5 (34.1) | 46.3 (8.5) |
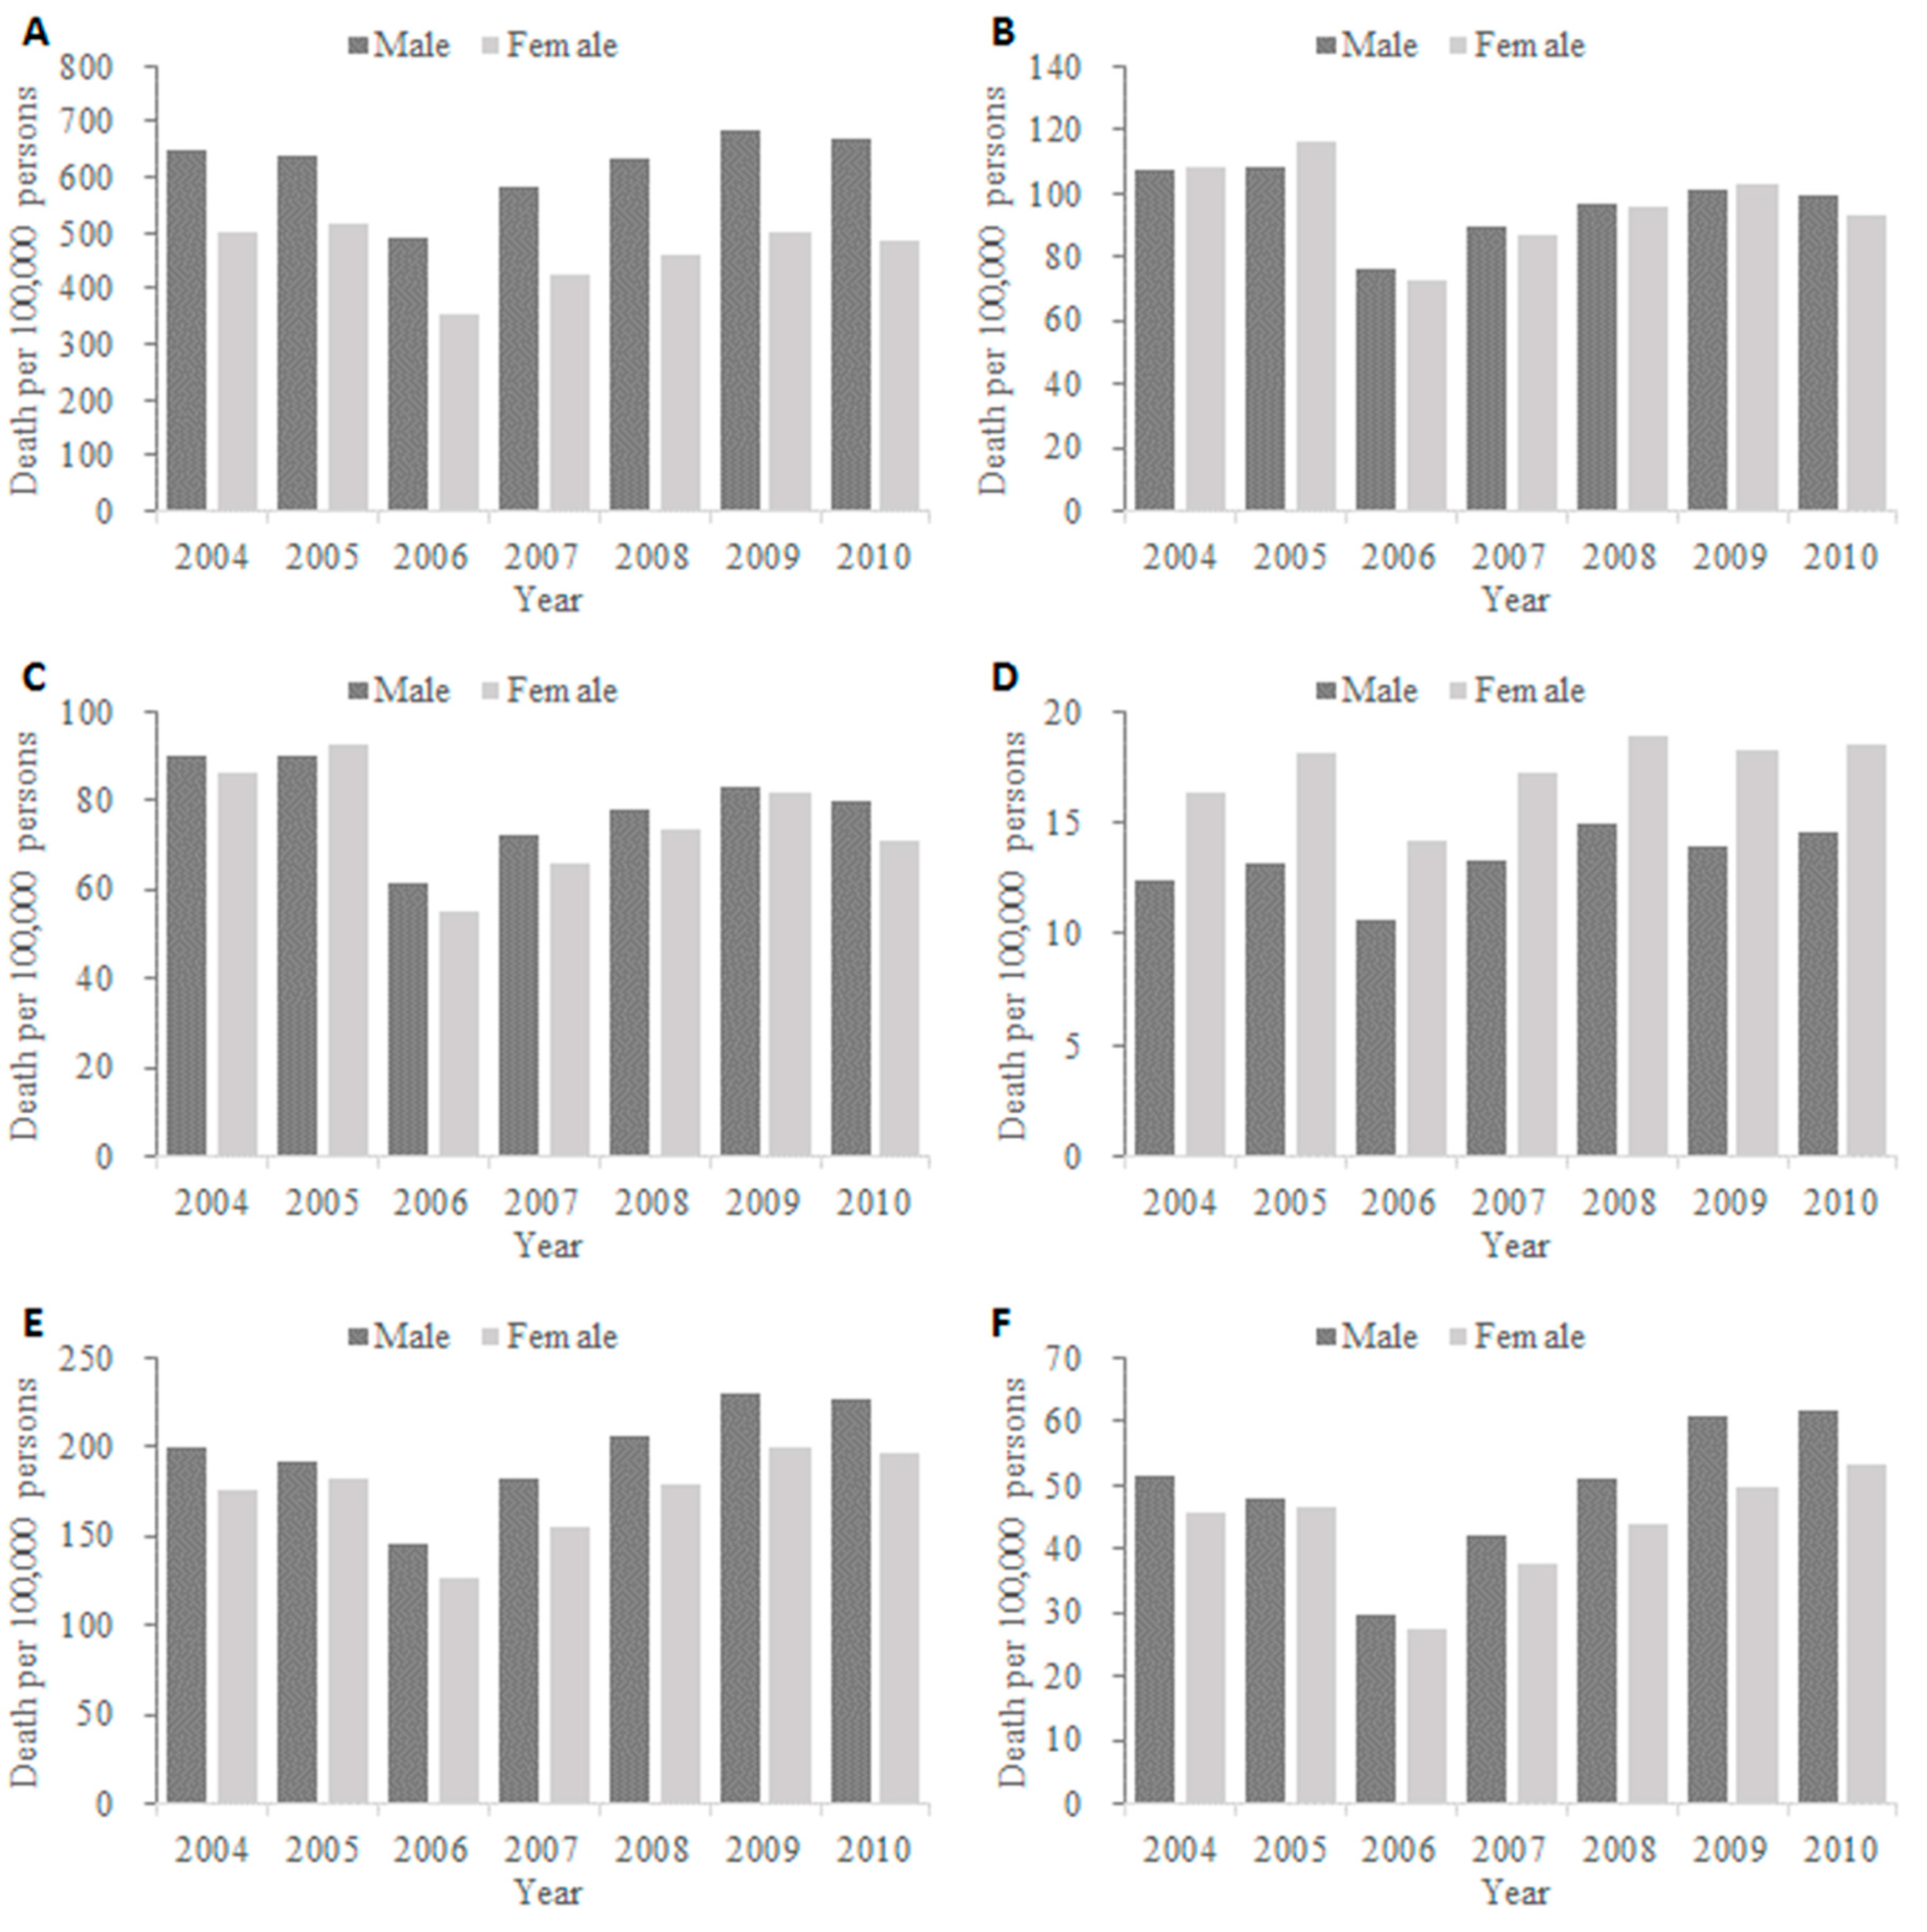
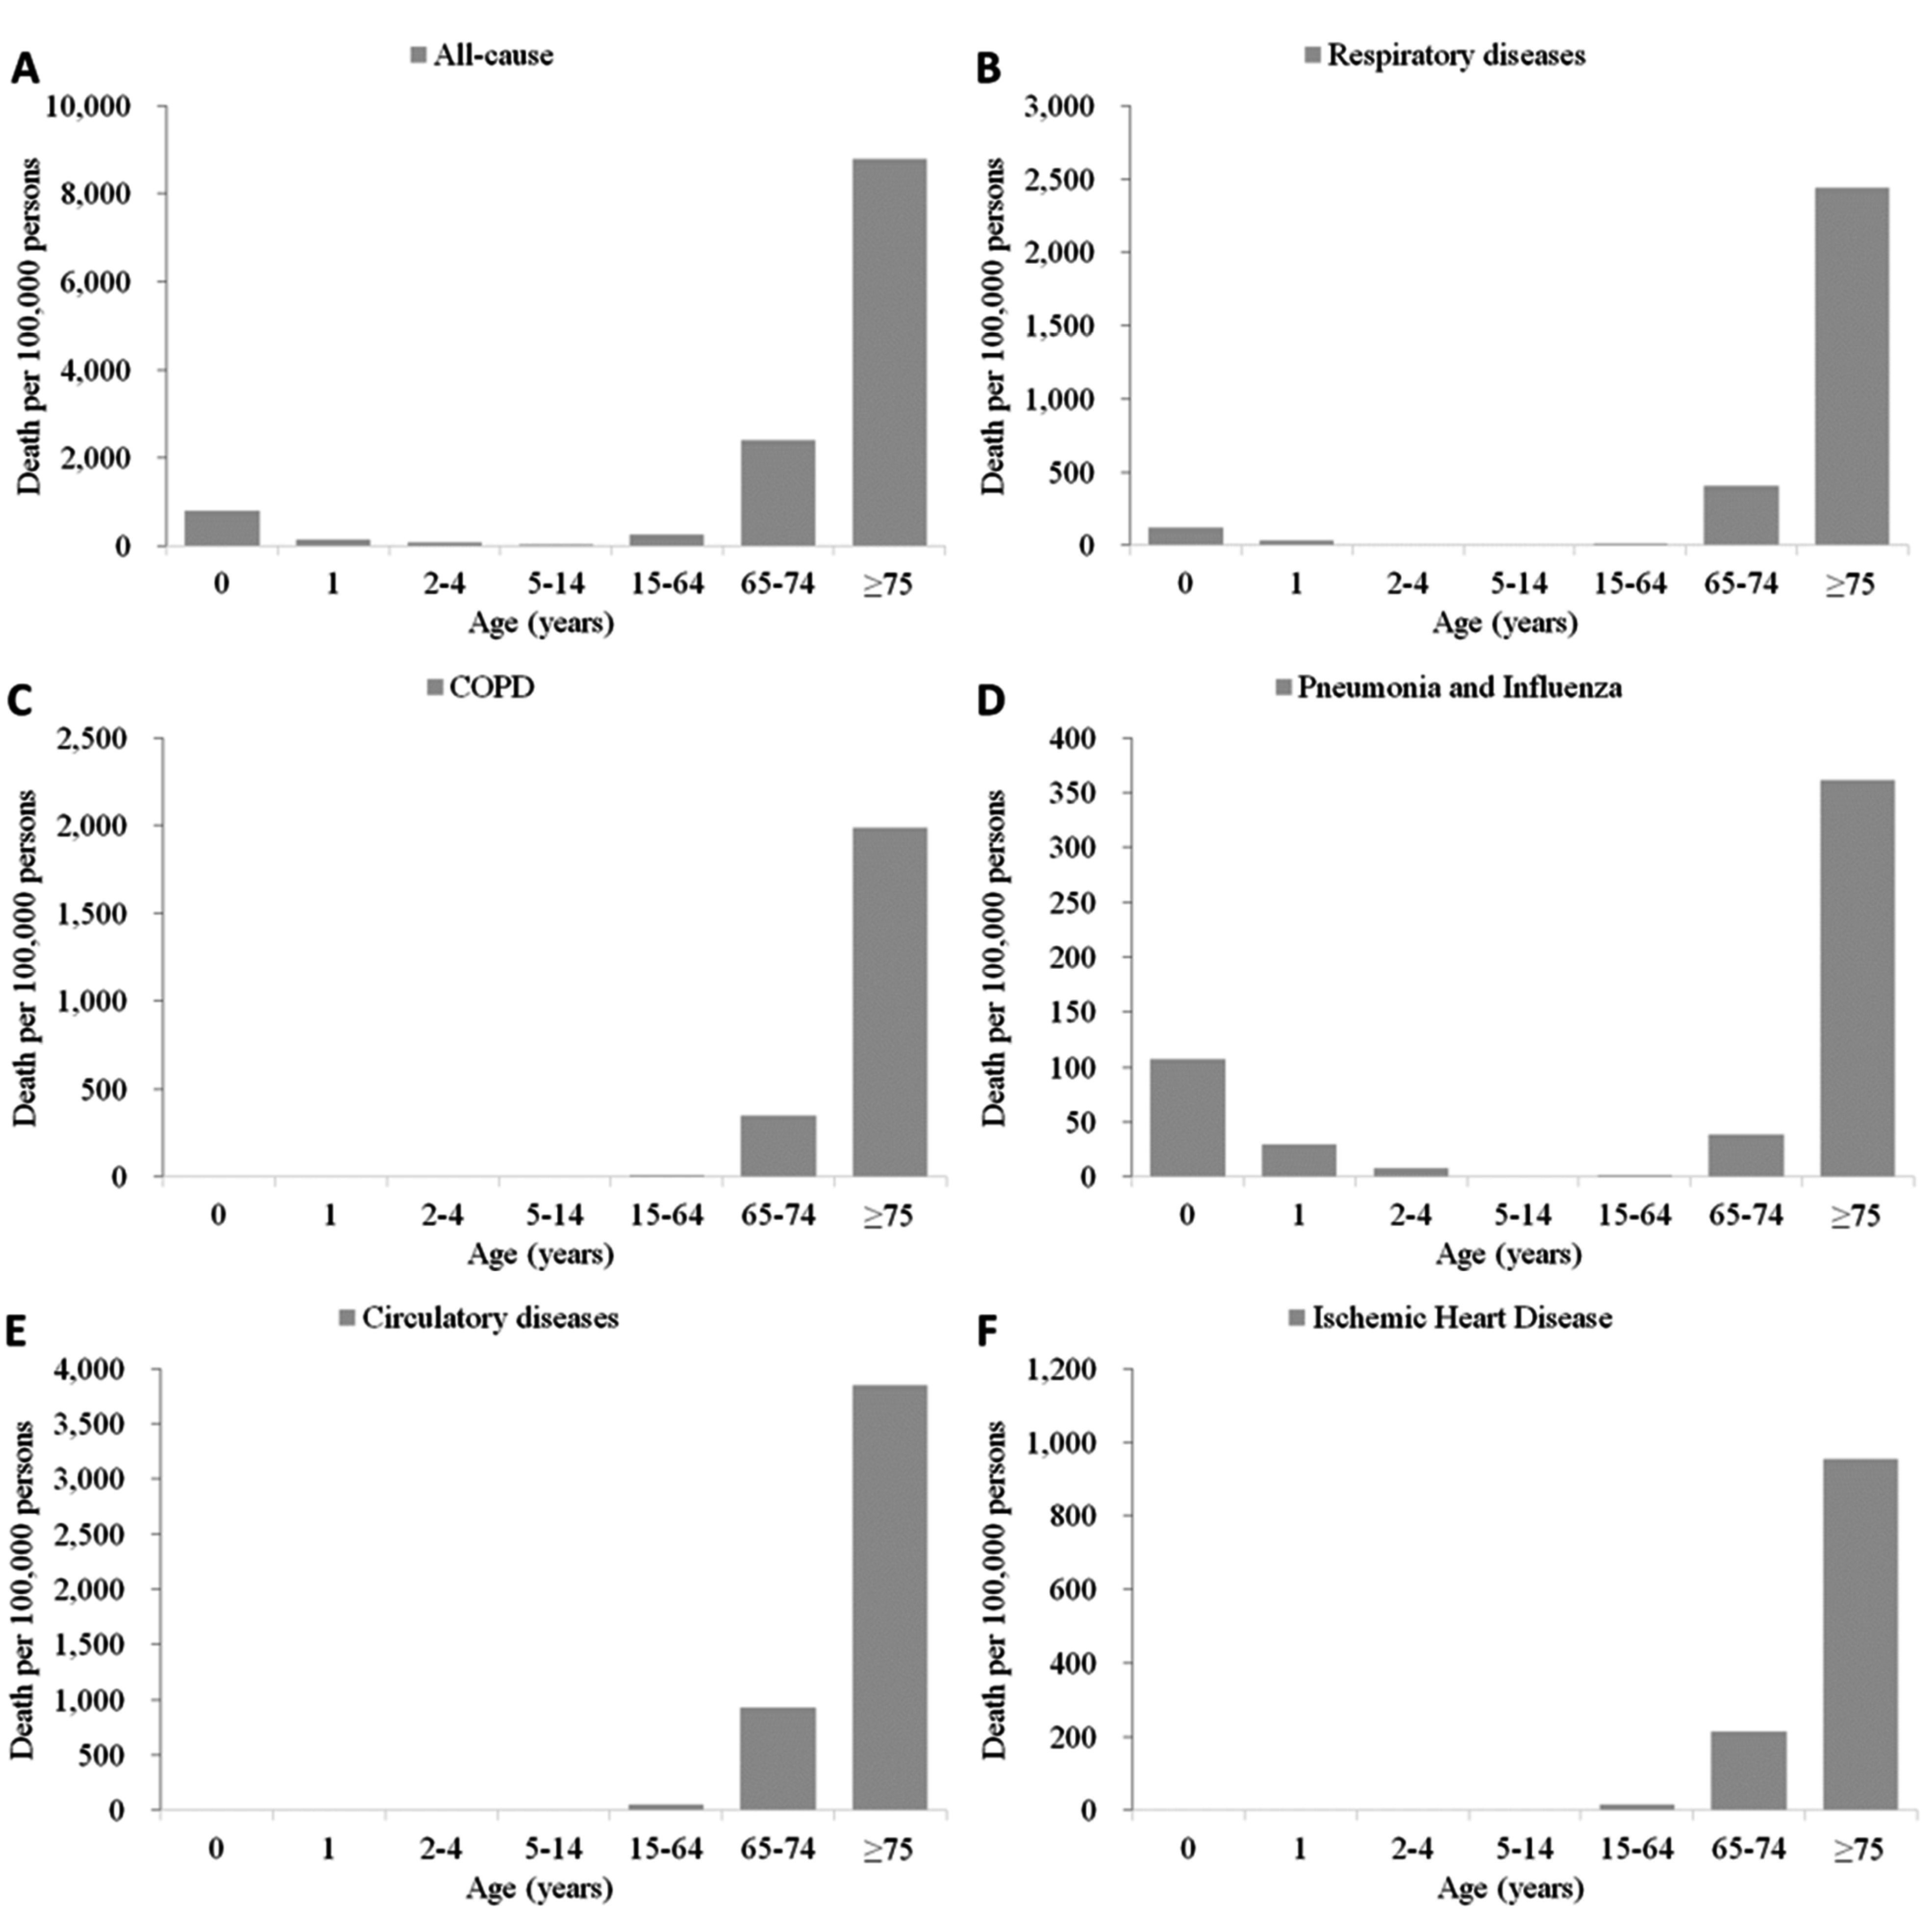
3.2. Mortality by Sex and Age Group

| Age Group | Death Rates per 100,000 People (95% CI) | |||||
|---|---|---|---|---|---|---|
| All Causes | Respiratory Diseases | COPD | ||||
| Male | Female | Male | Female | Male | Female | |
| 0–11 months | 825.8 (625.3, 1026.4) | 770.8 (469.3, 1072.2) | 119.2 (87.7, 150.6) | 120.1 (64.8, 175.3) | 1.3 (−1.1, 3.7) | 1.1 (−0.9, 3.1) |
| 1 year | 148.1 (117.3, 178.9) | 125.8 (98.2, 153.4) | 33.1 (18.8, 47.5) | 31.2 (10.6, 51.9) | 0.3 (−0.5, 1.2) | 0 (0, 0) |
| 2–4 years | 75.4 (65.4, 85.4) | 62.0 (50.4, 73.5) | 8.7 (6.2, 11.2) | 9.1 (3.5, 14.6) | 0 (0, 0) | 0 (0, 0) |
| 5–14 years | 34.8 (30.0, 39.6) | 20.5 (17.6, 23.4) | 1.2 (0.8, 1.6) | 1.1 (0.7, 1.5) | 0 (−0.1, 0.2) | 0.1 (−0.1, 0.3) |
| 15–64 years | 341.0 (315.1, 367.0) | 147.4 (128.4, 166.3) | 15.8 (12.8, 18.9) | 8.2 (5.8, 10.7) | 11.8 (9, 14.6) | 6.1 (3.7, 8.4) |
| 65–74 years | 3252.0 (2894.0, 3610.0) | 1632.8 (1389.2, 1876.4) | 546.2 (443.8, 648.6) | 277.5 (212.7, 342.3) | 476.3 (380, 572.5) | 238.7 (179.5, 298.0) |
| ≥75 years | 10,759.8 (9290.6, 12,229.1) | 7572.0 (6418.4, 8725.6) | 2912.0 (2592.2, 3231.8) | 2149.2 (1822.5, 2476.0) | 2459.9 (2198.1, 2721.6) | 1696.3 (1427.5, 1965.1) |
| All-age | 620.5 (369.6, 871.4) | 462.9 (199.0, 726.8) | 96.8 (31.7, 162.0) | 96.4 (22.9, 169.8) | 79.2 (24.4, 134.1) | 75.0 (17.0, 132.9) |
| Age Group | Pneumonia and Influenza | Circulatory Diseases | Ischemic Heart Disease | |||
| Male | Female | Male | Female | Male | Female | |
| 0–11 months | 107.3 (78.3, 136.2) | 107.8 (58.4, 157.2) | 13.5 (3.5, 23.6) | 8.9 (4.3, 13.5) | 0.3 (−0.5, 1.1) | 0.7 (−1.1, 2.6) |
| 1 year | 30.4 (17.2, 43.7) | 28.8 (9.1, 48.6) | 4.1 (0.9, 7.2) | 2.4 (0.2, 4.6) | 0 (0, 0) | 0 (0, 0) |
| 2–4 years | 7.7 (4.9, 10.4) | 7.9 (2.7, 13.1) | 0.6 (0, 1.1) | 0.5 (0.1, 1) | 0 (0, 0) | 0 (0, 0) |
| 5–14 years | 1.0 (0.7, 1.3) | 0.8 (0.6, 1) | 1 (0.6, 1.3) | 0.5 (0.3, 0.7) | 0 (−0.1, 0.2) | 0 (0, 0.1) |
| 15–64 years | 2.6 (2.0, 3.1) | 1.5 (1.1, 1.9) | 68.3 (62.2, 74.3) | 34.6 (30.1, 39) | 20.3 (17, 23.7) | 8.7 (6.8, 10.7) |
| 65–74 years | 48.3 (40.7, 55.9) | 29.9 (24.6, 35.1) | 1226.5 (1102.3, 1350.6) | 666.7 (567.6, 765.8) | 278.8 (231.9, 325.8) | 153.5 (125.5, 181.5) |
| ≥75 years | 347.2 (276.1, 418.2) | 369.8 (298.9, 440.8) | 4682.4 (3821.4, 5543.3) | 3334.9 (2674.8, 3995.1) | 1117.9 (850.5, 1385.3) | 850.9 (643.8, 1058) |
| All-age | 13.3 (5.1, 21.4) | 17.4 (4.5, 30.2) | 197.1 (88.4, 305.7) | 173.3 (57.1, 289.5) | 49.1 (23.7, 74.5) | 43.3 (13.8, 72.7) |
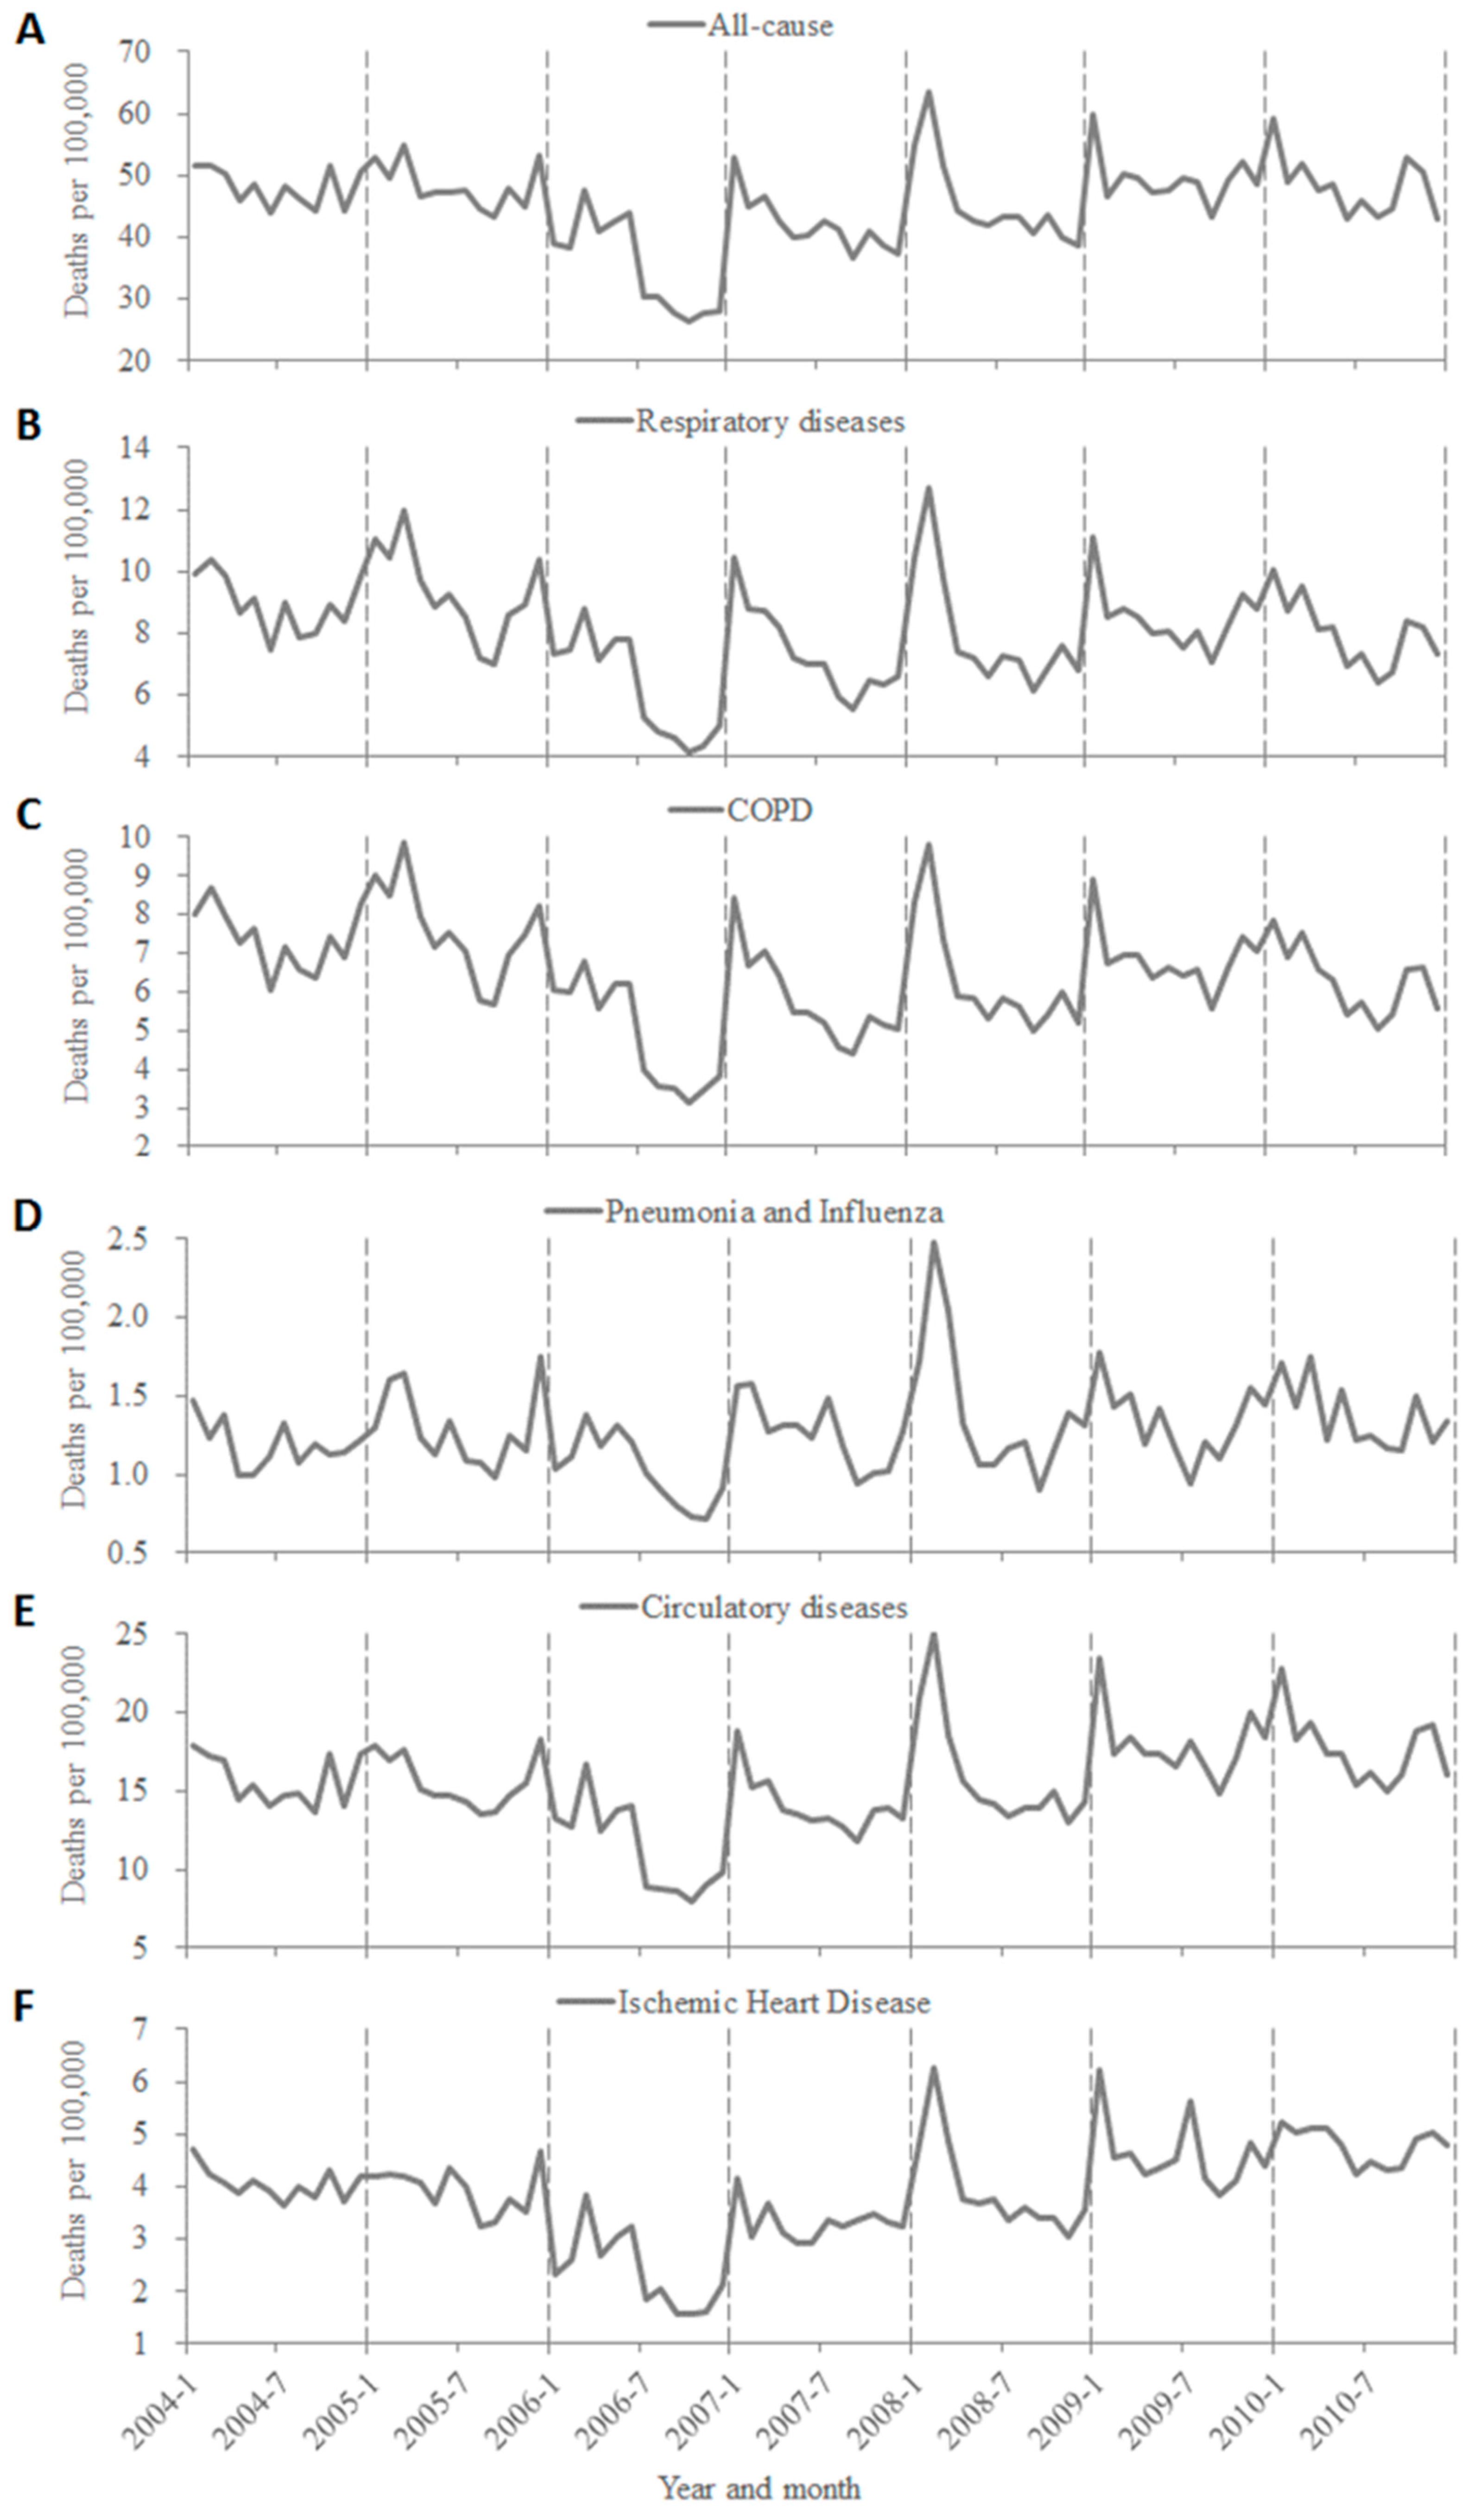
3.3. Temporal Trend of Mortality


4. Discussion and Conclusions
Author Contributions
Conflicts of Interest
References
- Thompson, W.W.; Shay, D.K.; Weintraub, E.; Brammer, L.; Cox, N.; Anderson, L.J.; Fukuda, K. Mortality associated with influenza and respiratory syncytial virus in the United States. Jama 2003, 289, 179–186. [Google Scholar] [CrossRef] [PubMed]
- Yang, G.; Hu, J.; Rao, K.Q.; Ma, J.; Rao, C.; Lopez, A.D. Mortality registration and surveillance in China: History, current situation and challenges. Popul. Health Metr. 2005, 3. [Google Scholar] [CrossRef] [PubMed] [Green Version]
- Feng, L.; Shay, D.K.; Jiang, Y.; Zhou, H.; Chen, X.; Zheng, Y.; Jiang, L.; Zhang, Q.; Lin, H.; Wang, S.; et al. Influenza-associated mortality in temperate and subtropical Chinese cities, 2003–2008. Bull. World Health Organ. 2012, 90, 279–288B. [Google Scholar] [CrossRef] [PubMed]
- Yu, H.; Feng, L.; Viboud, C.G.; Shay, D.K.; Jiang, Y.; Shay, D.K.; Jiang, Y.; Zhou, H.; Zhou, M.; Xu, Z.; et al. Regional variation in mortality impact of the 2009 A(H1N1) influenza pandemic in China. Influenza Other Respir. Viruses 2013, 7, 1350–1360. [Google Scholar] [CrossRef] [PubMed]
- Yu, H.; Alonso, W.J.; Feng, L.; Tan, Y.; Shu, Y.; Yang, W.; Viboud, C. Characterization of regional influenza seasonality patterns in China and implications for vaccination strategies: Spatio-temporal modeling of surveillance data. PLoS Med. 2013, 10, e1001552. [Google Scholar] [CrossRef] [PubMed]
- Gabriel, G.; Arck, P.C. Sex, immunity and influenza. J. Infect. Dis. 2014, 209 (Suppl. S3), S93–S99. [Google Scholar] [CrossRef] [PubMed]
- Muenchhoff, M.; Goulder, P.J. Sex differences in pediatric infectious diseases. J. Infect. Dis. 2014, 209 (Suppl. S3), S120–S126. [Google Scholar] [CrossRef] [PubMed]
- Zhou, M.G.; Jiang, Y.; Huang, Z.J.; Wu, F. Adjustment and representativeness evaluation of national disease surveillance points system. Ji Bing Jian Ce 2010, 25, 239–244. (In Chinese) [Google Scholar]
- Chen, Z. Report on the Third National Retrospective Sampling Survey of Death Causes; Peking Union Medical College Press: Beijing, China, 2008. [Google Scholar]
- Dai, Z.C.; Zheng, X.W.; Qi, X.Q.; Yang, G.H. Guidebook on Disease Surveillance; Hua Xia Press: Beijing, China, 1993. [Google Scholar]
- Chinese Center for Disease Control and Prevention. Database of Mortality Surveillance for National Disease Surveillance Points System, 2008; People’s Medical Publishing House: Beijing, China, 2010. (In Chinese) [Google Scholar]
- Word Health Organization (WHO). International Statistical Classification of Diseases and Health Related Problems; 10th Revision; World Health Organization: Geneva, Switzerland, 1993; pp. 30–65. [Google Scholar]
- Yang, G.; Rao, C.; Ma, J.; Wang, L.; Wan, X.; Dubrovsky, G.; Lopez, A.D. Validation of verbal autopsy procedures for adult deaths in China. Int. J. Epidemiol. 2006, 35, 741–748. [Google Scholar] [CrossRef] [PubMed]
- Yang, G.; Wang, Y.; Zeng, Y.; Gao, G.F.; Liang, X.; Zhou, M.; Wan, X.; Yu, S.; Jiang, Y.; Naghavi, M.; et al. Rapid health transition in China, 1990–2010: Findings from the Global Burden of Disease Study 2010. Lancet 2013, 381, 1987–2015. [Google Scholar] [CrossRef]
- Shryock, H.S.; Seigel, J.S. The Methods and Materials of Demography (Studies in Population); Academic Press: San Diego, CA, USA, 1976. [Google Scholar]
- Chinese Academy of Preventive Medicine. Annual Report on Chinese Disease Surveillance 1992; Chinese Academy of Preventive Medicine: Beijing, China, 1994. [Google Scholar]
- Chinese Academy of Preventive Medicine. Annual Report on Chinese Disease Surveillance 1995; Chinese Academy of Preventive Medicine: Beijing, China, 1996. [Google Scholar]
- Wang, L.; Wang, L.J.; Cai, Y.; Ma, L.M.; Zhou, M.G. Analysis of underreporting of mortality surveillance from 2006 to 2008 in China. Zhonghua Yu Fang Yi Xue Za Zhi 2011, 45, 1061–1064. (In Chinese) [Google Scholar] [PubMed]
- Zhong, N.; Wang, C.; Yao, W.; Chen, P.; Kang, J.; Huang, S.; Chen, B.; Wang, C.; Ni, D.; Zhou, Y.; et al. Prevalence of chronic obstructive pulmonary disease in China: A large, population-based survey. Am. J. Respir. Crit. Care Med. 2007, 176, 753–760. [Google Scholar] [CrossRef] [PubMed]
- Mikkola, T.S.; Gissler, M.; Merikukka, M.; Tuomikoski, P.; Ylikorkala, O. Sex differences in age-related cardiovascular mortality. PLoS ONE 2013, 8, e63347. [Google Scholar] [CrossRef] [PubMed]
- Heron, M. Deaths: Leading Causes for 2009. National Vital Stat. Rep. National Center Health Stat. 2012, 61, 1–94. [Google Scholar]
- Census and Statistics Department. Population by Age Group and Sex. The Government of Hong Kong SAR. Available online: http://www.censtatd.gov.hk/hkstat/sub/bbs.jsp (accessed on 12 June 2014).
© 2015 by the authors; licensee MDPI, Basel, Switzerland. This article is an open access article distributed under the terms and conditions of the Creative Commons Attribution license (http://creativecommons.org/licenses/by/4.0/).
Share and Cite
Yu, L.; Lin, X.; Liu, H.; Shi, J.; Nong, Q.; Tang, H.; Mao, Z. Sex and Age Differences in Mortality in Southern China, 2004–2010. Int. J. Environ. Res. Public Health 2015, 12, 7886-7898. https://doi.org/10.3390/ijerph120707886
Yu L, Lin X, Liu H, Shi J, Nong Q, Tang H, Mao Z. Sex and Age Differences in Mortality in Southern China, 2004–2010. International Journal of Environmental Research and Public Health. 2015; 12(7):7886-7898. https://doi.org/10.3390/ijerph120707886
Chicago/Turabian StyleYu, Leibin, Xinqin Lin, Haiyan Liu, Jian Shi, Quanxing Nong, Hongyang Tang, and Zongfu Mao. 2015. "Sex and Age Differences in Mortality in Southern China, 2004–2010" International Journal of Environmental Research and Public Health 12, no. 7: 7886-7898. https://doi.org/10.3390/ijerph120707886