Article

Building-Related Symptoms among Office Employees Associated with Indoor Carbon Dioxide and Total Volatile Organic Compounds

1
School of Post-Baccalaureate Chinese Medicine, China Medical University, Taichung 404, Taiwan
2
Research Center for Traditional Chinese Medicine, Department of Medical Research, China Medical University Hospital, Taichung 404, Taiwan
3
Institute of Environmental Health, National Taiwan University, Taipei 100, Taiwan
4
Institute of Environmental and Occupational Health Sciences, National Yang-Ming University, Taipei 100, Taiwan
5
Department of Health Management, I-Shou University, Kaohsiung 824, Taiwan
*
Author to whom correspondence should be addressed.
Int. J. Environ. Res. Public Health 2015, 12(6), 5833-5845; https://doi.org/10.3390/ijerph120605833
Submission received: 20 February 2015 / Revised: 10 April 2015 / Accepted: 18 May 2015 / Published: 27 May 2015
(This article belongs to the Special Issue Indoor Environmental Quality: Exposures and Occupant Health)

Abstract

:
This study investigated whether sick building syndrome (SBS) complaints among office workers were associated with the indoor air quality. With informed consent, 417 employees in 87 office rooms of eight high-rise buildings completed a self-reported questionnaire for symptoms experienced at work during the past month. Carbon dioxide (CO2), temperature, humidity and total volatile organic compounds (TVOCs) in each office were simultaneously measured for eight office hours using portable monitors. Time-averaged workday difference between the indoor and the outdoor CO2 concentrations (dCO2) was calculated as a surrogate measure of ventilation efficiency for each office unit. The prevalence rates of SBS were 22.5% for eye syndrome, 15.3% for upper respiratory and 25.4% for non-specific syndromes. Tiredness (20.9%), difficulty in concentrating (14.6%), eye dryness (18.7%) were also common complaints. The generalized estimating equations multivariate logistic regression analyses showed that adjusted odds ratios (aORs) and 95% confidence interval (CI) per 100 ppm increase in dCO2 were significantly associated with dry throat (1.10, 95% CI = (1.00–1.22)), tiredness (1.16, 95% CI = (1.04–1.29)) and dizziness (1.22, 95% CI = (1.08–1.37)). The ORs for per 100 ppb increases in TVOCs were also associated with upper respiratory symptoms (1.06, 95% CI = (1.04–1.07)), dry throat (1.06, 95% CI = (1.03–1.09)) and irritability (1.02, 95% CI = (1.01–1.04)). In conclusion, the association between some SBS symptoms and the exposure to CO2 and total VOCs are moderate but may be independently significant.

1. Introduction

The general population spends an average 80%–90% of their time in indoor environments [1,2]. The indoor air quality has been of great concern for the relationship with sick building syndrome (SBS) symptoms among employees in the offices [3]. Individuals have SBS when they spend time indoors and their symptoms ease when away from the buildings [2,4,5,6,7]. Among the evidence, building characteristics, indoor environmental quality [8,9] and indoor air quality have been associated with SBS. Carbon dioxide (CO2) levels have been considered the major factor associated with SBS symptoms [10,11,12,13,14,15]. After reviewing 21 studies involving 30,000 subjects in more than 400 buildings in cities of North America, Europe and Asia, Seppänen et al. concluded that SBS symptoms are associated with low ventilation rates or elevated CO2 levels [12]. Apte et al., measuring the difference between the indoor CO2 concentration and the outside concentration, reported that the odds ratio (OR) of respiratory symptoms may increase from 1.1 to 1.5 for per 100 ppm increase of the indoor CO2 concentration [13]. A recent study in Taiwan found more complaints of eye irritation and respiratory symptoms when employees were exposed to an indoor CO2 concentration higher than 800 ppm [15]. The CO2 concentration reflects the accumulation level of indoor air pollutants associated with ventilation efficiency.
Volatile organic compounds (VOCs) are common indoor air pollutants in response to both indoor and outdoor emissions and also have been the focus of SBS in etiologic studies [14,16,17,18]. VOCs may cause irritation of the eyes, skin, respiratory tract, central nervous system and viscera. Kim et al. found a significant association between respiratory symptoms and indoor total microbial volatile organic compound concentration [19]. A Japanese study found aldehydes and aliphatic hydrocarbons in new single-family houses were positively associated with SBS [20]. Mølhave suggested that a level of VOCs higher than 3.0 mg/m3 in a non-industrial indoor environment might be associated with harm to human health or comfort [21]. Smoking and other human activities increase total indoor volatile organic compound (TVOC) concentrations [22].
Although several studies have suggested CO2 and VOCs levels are the main SBS contributors, public concerns need more information about the association. In this study, we investigated the prevalence of non-specific complaints about SBS, upper and lower respiratory symptoms and examined the relationships between these symptoms and indoor concentrations of CO2 and TVOCs.

2. Materials and Methods

2.1. Questionnaire Survey

Employees working in 16 institutions located in high-rise buildings in Taipei city were randomly selected and invited to participate in this SBS study. We measured indoor air quality at their working places. The details of this study have been reported in previous studies [23,24]. Invitation letters explaining this study were delivered to potential participants and a total of 417 persons responded to our self-reported questionnaire survey with the required informed consent. Information obtained from the questionnaire included age, gender, education, smoking and alcohol history, medical history, and the typical SBS symptoms, specifically for nose, eyes, skin, upper and lower respiratory and general complaints. An institutional review committee approved this study.

2.2. Environmental Measurement

We measured the levels of CO2 and VOCs using portable monitors at each office for eight office hours. Both indoor and outdoor levels of CO2 (Q-TRAK IAQ Model 8551, TSI Incorporated, Shoreview, MN, USA) were standardized for a wide range (0–5000 ppm) with a fine resolution of 1.0 ppm. The VOC measurements (PGM-7240, RAE SYSTEMS, Sunnyvale, CA, USA) were standardized for 102 categories of VOC with an acceptable deviation of 20 ppb. The indoor air was monitored at 1.2 m height at the center of the office without mechanical ventilation inlets or outlets. We used standard gas to calibrate the instrument including the zero point check.

2.3. Statistical Analysis

The SBS symptoms were defined as participants reporting one or more selected symptoms specified in the questionnaire for at least 1–3 days per week while at work in the office in the previous month, but which improved or disappeared after work or on days without work. The SBS symptoms were identified individually and as a group. Prevalence rates of SBS symptoms for eyes (eye dryness and eye irritation), upper respiratory tract (nose itching, runny nose, stuffy nose, sneezing and dry throat), lower respiratory tract (difficulty in breathing), skin (skin dryness), and non-specific symptoms (headache, tiredness, difficulty in concentrating, irritability and dizziness) were evaluated.
In statistical analyses, associations between SBS symptoms and selected covariates, including participants’ socio-demographic status, medical history, and indoor air pollutants were first measured and tested using Pearson’s χ2 test and Fisher’s exact test. The SBS symptoms were analyzed both individually and in combined categories. Generalized estimating equations (GEE) were used to accommodate multiple contralateral pairs within participants. Building parameters were considered for inclusion in GEE logistic regression models for adjustment. Table 1 lists potential covariates to be used in the initial GEE logistic regression models, including demographic and environmental variables, allergies, chemical and environmental tobacco smoking sensitivity, indoor relative humidity and temperature, speck of molds, exposure to environmental tobacco smoke, presence of carpet in the office, and new carpet, furniture and decoration, and recent painting at work.
Table 1. Covariates included in all generalized estimating equations logistic regression models.
VariableDescription
Gender0: male; 1: female
Age0: age < 40 years; 1: age ≥ 40 years
Carpet0: no carpet on workstation; 1: carpet on most or all workspace
Smoker0: never or former smoker; 1: current smoker
Asthma0: previously never diagnosed; 1: previously ever diagnosed
Nasosinusitis0: previously never diagnosed; 1: previously ever diagnosed
Atopic rhinitis0: previously never diagnosed; 1: previously ever diagnosed
Migraine0: previously never diagnosed; 1: previously ever diagnosed
Dust allergies0: previously never diagnosed; 1: previously ever diagnosed
Animals allergies0: previously never diagnosed; 1: previously ever diagnosed
Chemical sensitivity0: previously never diagnosed; 1: previously ever diagnosed
ETS sensitivity0: self-reported “No”; 1: self-reported “Yes”
Exposure to ETS0: self-reported “No”; 1: self-reported “Yes”
Using Sanitizing chemical0: self-reported “No”; 1: self-reported “Yes”
New furniture0: self-reported “No”; 1: self-reported “Yes”
New decoration0: self-reported “No”; 1: self-reported “Yes”
Painting recently0: self-reported “No”; 1: self-reported “Yes”
Working stress0: self-reported “No”; 1: self-reported “Yes”
No social support0: self-reported “No”; 1: self-reported “Yes”
Working time>9 h/day0: self-reported “No”; 1: self-reported “Yes”
Speck of molds0: “No” recorded by sampler; 1: “Yes” recorded by sampler
Leaking0: “No” recorded by sampler; 1: “Yes” recorded by sampler
Season0: spring; 1: winter
dCO2Hourly mean degree per 100 (ppm/100)
TVOCsindoorHourly mean degree per 100 (ppb/100)
RHHourly mean degree (%)
TemperatureHourly mean degree (°C)
RH, relative humidity; ETS, environmental tobacco smoking; dCO2, difference between indoor and outdoor carbon dioxide concentrations; TVOCsindoor, indoor total volatile organic compounds concentrations.
The exposure of carbon dioxide and indoor TVOCs were considered as the major factors associated with SBS symptoms. Eight-hour averaged workday differences between indoor and outdoor CO2 concentrations (dCO2= CO2 indoors − CO2 outdoors) [13] was used to represent the ventilation efficiency for the office. Finally, simple and step down GEE multivariate logistic regression (MLR) models were performed using each of the SBS symptoms as the dependent variables, and CO2 metric (dCO2) and TVOCs as independent variables, controlling for covariates. The odds ratio (OR) of the symptom and corresponding 95% confidence interval (CI) were calculated. The final GEE MLR analysis was performed controlling for potential confounding factors. Data analyses and plotting were conducted using the statistical package software of SAS 8.1 (SAS Institute Inc., Cary, NC, USA) and Excel, and α was taken as 0.05.

3. Results and Discussion

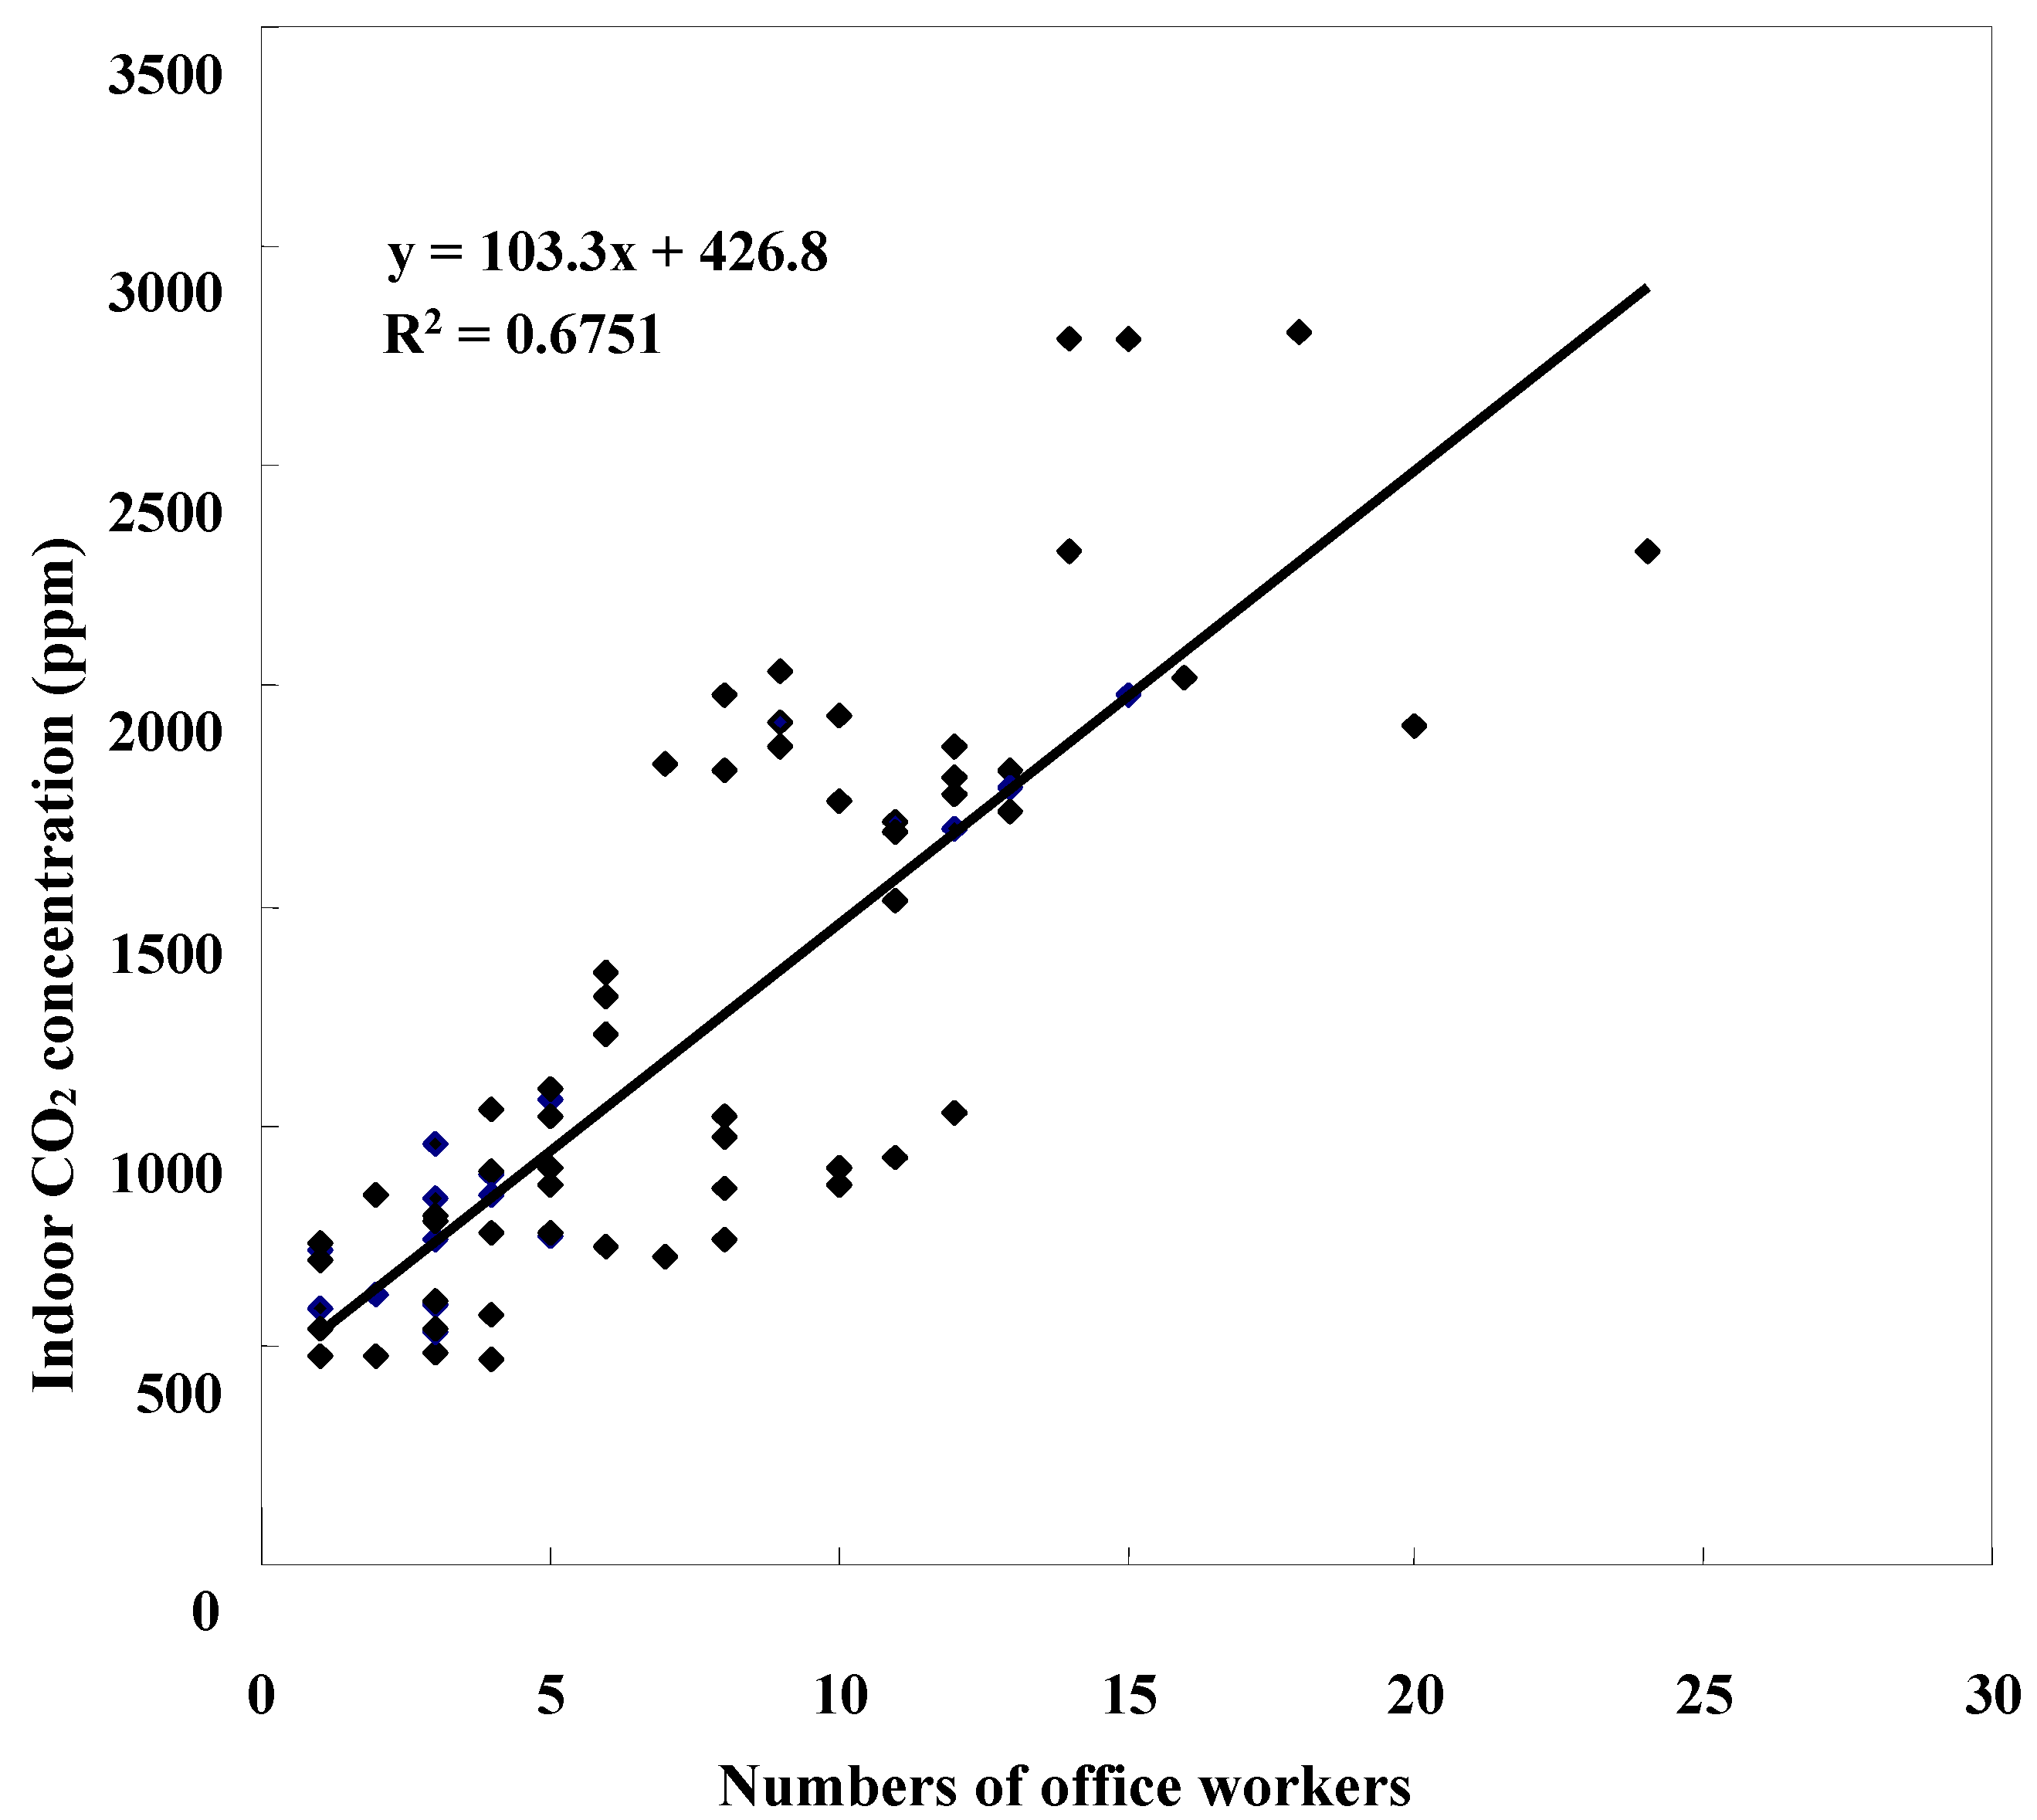
3.1. Indoor CO2 and TVOCs Measurement

Figure 1 shows that the mean 8-hour CO2 levels at the surveyed offices in high-rise buildings, increased as the number of persons at work increased, to near 2800 ppm in an office with 25 persons at work. The average indoor temperature and relative humidity among offices were 23.6 °C and 57.3%, respectively, (Table 2). The hourly mean CO2 concentration of indoor (1160 ppm, SD = 604 ppm) was 2.6 times higher than that outdoors (mean = 434 ppm, SD= 60 ppm). The hourly mean TVOCs concentrations was 6.5 times greater indoors than outdoors (1190 ppb vs. 180 ppb).
Figure 1. Association between numbers of office workers and indoor carbon dioxide (CO2) concentrations in high-rise building offices.
Ijerph 12 05833 g001

3.2. Self-Reported Sick Building Syndrome Risk

Study participants were predominantly women (Table 3). High proportions of office employees reported sensitivity to tobacco (68.3%) and chemicals in the air (64.5%). SBS symptoms were prevalent: 22.5% of participants had eye symptoms, 15.3% had upper respiratory, 6.5% had lower respiratory symptoms and 25.4% had non-specific symptoms. Tiredness (20.9%), eye dryness (18.7%) and difficulty in concentrating (14.6%) were also common complaints.
Table 2. Measured environmental variables compared between indoor and outdoor among 87 survey offices in high-rise buildings.
Environmental VariablesMeanSDRange
Temperature indoor (°C)23.61.7118.6–28.4
Temperature outdoor (°C)25.74.9616.3–37.8
Difference a−2.134.48−14.2–5.00
Relative humidityindoor (%)57.36.9245.5–79.7
Relative humidityoutdoor (%)60.513.634.0–81.3
Difference a−3.1811.6−21.1–24.2
CO2 indoor (100 ppm)11.66.044.67–28.0
CO2 outdoor (100 ppm)4.340.603.37–5.63
Difference a7.296.25−1.03–23.9
TVOCs indoor (100 ppb)11.960.60.06–557
TVOCs outdoor (100 ppb)1.801.600.05–4.25
Difference a10.160.2−1.46–553
CO2, carbon dioxide; TVOCs, indoor total volatile organic compounds; a between indoor and outdoor.
Table 3. Summary in prevalence of participants characteristics and sick building syndrome symptoms among office employees (n =417).
Individual Characteristics%Symptoms%
Female77.9Eye, any22.5
Age (≥40 years)30.0Eye dryness18.7
Current smoker11.3Eye irritation5.5
Working time >5 days/week11.8
Working time >9 h/day20.9Upper respiratory, any15.3
Working stress14.6Nose itching2.4
Lacking of family support40.3Runny nose2.4
Asthma3.4Stuffy nose6.2
Nasosinusitis7.0Sneezing2.4
Atopic rhinitis29.0Dry throat6.7
Migraine17.0
Dust allergy24.5Lower respiratory, any6.5
Animal allergy8.6Difficulties in breathing6.5
Sensitivity to tobacco smoke68.3
Sensitivity to chemicals in air64.5Skin, any1.9
Exposure to ETS15.6Skin dryness1.9
Using Sanitizing chemical29.7
Carpet in workspace61.4Non-specific, any25.4
New furniture4.6Tiredness20.9
New decoration9.4Difficulties in concentrating14.6
Painting recently5.5Irritability12.7
Leaking10.1Dizziness7.2
Speck of molds7.7
After controlling for personal and environmental variables, per 100 ppm increase in dCO2 had significant associations with dry throat (OR = 1.10; 95% CI = 1.00–1.22), tiredness (OR = 1.16; 95% CI = 1.07–1.26), dizziness (OR = 1.22; 95% CI = 1.08–1.37) and non-specific syndrome (OR = 1.16; 95% CI = 1.04–1.29), but had a protective association with eye irritation (OR = 0.81; 95% CI = 0.67–0.98) (Table 4). Eye irritation, tiredness, dizziness and non-specific syndrome remained significant after the addition of TVOCs to the GEE MLR model.
Table 4. Crude and adjusted odds ratio and 95% confidence intervals (in parentheses) for sick building syndrome symptom associated with per 100 ppm increase in difference between indoor and outdoor carbon dioxide concentrations (dCO2) obtained from generalized estimating equations logistic regression models (n = 417).
Sick-Building Syndrome SymptomdCO2 (per 100 ppm)
CrudeAdjusted aAdjusted b
Eye, any0.99 (0.97–1.01)1.00 (0.96–1.04)1.00 (0.96–1.04)
Eye dryness1.01 (0.99–1.04)1.02 (0.99–1.06)1.02 (0.98–1.06)
Eye irritation0.85 (0.73–0.99)0.81 (0.67–0.98)0.74 (0.59–0.93)
Upper respiratory, any1.02 (0.91–1.14)1.04 (0.93–1.17)0.97 (0.89–1.06)
Nose itching1.02 (0.86–1.21)1.03 (0.80–1.32)1.03 (0.80–1.32)
Runny nose0.97 (0.79–1.20)0.92 (0.71–1.18)0.92 (0.72–1.19)
Stuffy nose1.03 (0.94–1.13)1.11 (0.96–1.28)1.07 (0.92–1.25)
Sneezing1.04 (0.94–1.15)0.93 (0.69–1.25)0.52 (0.12–2.31)
Dry throat1.03 (0.89–1.18)1.10 (1.00–1.22)1.03 (0.91–1.15)
Lower respiratory, any0.99 (0.94–1.18)1.07 (0.96–1.20)1.05 (0.94–1.18)
Difficulties in breathing0.99 (0.94–1.18)1.07 (0.96–1.20)1.05 (0.94–1.18)
Skin, any1.03 (0.87–1.22)1.04 (0.85–1.28)1.05 (0.82–1.34)
Dryness1.03 (0.87–1.22)1.04 (0.85–1.28)1.05 (0.82–1.34)
Non-specific, any1.04 (0.97–1.11)1.16 (1.04–1.29)1.13 (1.02–1.26)
Tiredness1.03 (0.97–1.10)1.16 (1.07–1.26)1.14 (1.06–1.23)
Difficulties in concentrating1.01 (0.93–1.09)1.09 (0.99–1.20)1.08 (0.98–1.19)
Irritability0.97 (0.89–1.05)1.13 (0.95–1.35)1.09 (0.92–1.29)
Dizziness1.10 (0.97–1.26)1.22 (1.08–1.37)1.20 (1.07–1.34)
a Adjusted for gender, age, smoking status, presence of carpet in workspace, new furniture, new decoration, painting recently in workspace, leaking, speck of molds, allergies, chemical and environmental tobacco smoking sensitivity, asthma, nasosinusitis, atopic rhinitis, migraine, working stress, lacking of family support, sanitizing by using chemical, exposure to environmental tobacco smoking, working time per week, working time per day, relative humidity and room temperature. b Indoor total volatile organic compounds concentrations (TVOCs) were included in the model.
Table 5 shows the associations between SBS symptoms and the per 100 ppb increase of indoor TVOCs in measured air among offices. Adjusted odds ratios per 100 ppb increase in indoor TVOCs were slightly significant for upper respiratory syndrome (OR = 1.06; 95% CI = 1.04–1.07), stuffy nose (OR = 1.01; 95% CI = 1.01–1.02), dry throat (OR = 1.06; 95% CI = 1.03–1.09) and lower respiratory syndrome (OR = 1.01; 95% CI = 1.00–1.01), non-specific syndrome (OR = 1.03; 95% CI = 1.02–1.05), tiredness (OR = 1.02; 95% CI = 1.01–1.04), angry easily (OR = 1.02; 95% CI = 1.01–1.04) and dizziness (OR = 1.01; 95% CI = 1.00–1.02). The ORs for upper respiratory syndrome, dry throat, angry easily and dizziness did not change even after adding the variable of dCO2 to the model for analysis.
Table 5. Crude, adjusted prevalence odds ratios and 95% confidence intervals (in parentheses) for sick building syndrome symptom association with per 100 ppb increase in total volatile organic compounds in indoor air (TVOCs) obtained from generalized estimating equations logistic regression models (n = 417).
Sick-Building Syndrome SymptomTVOCs (per 100 ppm)
CrudeAdjusted aAdjusted b
Eye, any1.00 (0.99–1.00)1.00 (1.00–1.00)1.00 (0.99–1.00)
Eye dryness1.00 (1.00–1.01)1.00 (1.00–1.01)1.00 (0.99–1.00)
Eye irritation1.00 (1.00–1.01)1.01 (1.00–1.01)1.01 (1.00–1.02)
Upper respiratory, any1.04 (1.02–1.06)1.06 (1.04–1.07)1.06 (1.05–1.07)
Nose itching0.98 (0.92–1.04)1.00 (0.97–1.03)1.00 (0.97–1.03)
Runny nose0.97 (0.90–1.06)1.00 (0.95–1.05)1.00 (0.96–1.04)
Stuffy nose1.01 (1.00–1.01)1.01 (1.01–1.02)1.01 (1.01–1.02)
Sneezing1.01 (1.00–1.01)1.07 (0.86–1.33)2.63 (0.18–38.7)
Dry throat1.02 (1.00–1.05)1.06 (1.03–1.09)1.06 (1.02–1.09)
Lower respiratory, any1.00 (1.00–1.01)1.01 (1.00–1.01)1.01 (1.00–1.01)
Difficulties in breathing1.00 (1.00–1.01)1.01 (1.00–1.01)1.01 (1.00–1.01)
Skin, any1.01 (1.01–1.01)1.01 (1.00–1.02)1.01 (1.00–1.02)
Dryness1.01 (1.01–1.01)1.01 (1.00–1.02)1.01 (1.00–1.02)
Non-specific, any1.03 (1.02–1.04)1.03 (1.02–1.05)1.02 (1.01–1.03)
Tiredness1.03 (1.02–1.04)1.02 (1.01–1.04)1.01 (1.01–1.02)
Difficulties in concentrating1.00 (1.00–1.01)1.00 (1.00–1.01)1.00 (1.00–1.01)
Irritability1.03 (1.02–1.03)1.02 (1.01–1.04)1.02 (1.00–1.03)
Dizziness1.01 (1.01–1.01)1.01 (1.00–1.02)1.01 (1.00–1.01)
a Adjusted for gender, age, smoking status, presence of carpet in workspace, new furniture, new decoration, painting recently in workspace, leaking, speck of moulds, allergies, chemical and environmental tobacco smoking sensitivity, asthma, nasosinusitis, atopic rhinitis, migraine, working stress, lacking of family support, sanitizing by using chemical, exposure to environmental tobacco smoking, working time per week and working time per day, relative humidity and room temperature. b Carbon dioxide concentrations (dCO2) differences between indoor and outdoor were included in the model.

4. Discussion

This study demonstrated that SBS symptoms experienced among employees in high-rise buildings exhibited a stronger association with CO2 concentrations than with TVOCs concentrations in their offices. The CO2 concentrations measured in office units, ranging from 467 to 2800 ppm, were much greater than that in the outdoor air (1160 vs. 434 ppm on average). The concentrations of CO2 in office buildings are primarily dependent on occupant density and ventilation rates [25].
In our study, tiredness and dizziness were associated with dCO2 after controlling for TVOCs; but there were no significant associations between dCO2 and respiratory, eye or skin symptoms. The dCO2 measures the difference in CO2 concentrations between indoor air and outdoor air.
The CO2 association is somewhat consistent with the findings in the previous study [12,13,15,26,27]. Jung et al. found that the neuroendocrine system was associated with dCO2 and SBS symptoms were associated with the allostatic load level in the neuroendocrine and metabolic systems [27]. Tsai et al. found eye irritation and respiratory symptoms were associated with high levels of indoor CO2 [15]. No causal relationship between CO2 exposure and SBS symptoms was considered in the study by Seppänen et al. [12], but they did find that compared with occupants in rooms with high ventilation rates, those in rooms with less ventilation rate had ORs of SBS ranging from 1.1 to 6.0, and of respiratory complaints ranging from 1.5 to 2.0.
The dCO2 association with SBS symptoms in this study is different from findings in other studies in symptom sites. The study based on 41 American office buildings shows that the dCO2 arises per 100 ppm the ORs of having sore throat, stuffy nose, chest tightness and wheezing range from 1.1–1.5. ORs increased to 1.3–2.3 for those exposed to maximum dCO2 per hour greater than 250 ppm [13]. Erdmann and Apte presented a similar study with significant ORs 1.1–1.2 per 100 ppm increases in dCO2 for mucosal symptom and lower respiratory symptoms [26]. They considered that the cause of SBS was similar to the indoor dCO2. However, other pollutants were not determined in these studies.
It has been hypothesized that office workers exposed to indoor air pollutants would have elevated risk of building-related SBS syndrome. Takigawa et al. reported that newly constructed hospitals with TVOC concentrations greater than 1200 g/m3 could induce symptoms involving not only the skin, eyes, ears, throat and chest, but also the central nervous system, autonomic system, musculoskeletal system, and digestive system with gender difference, being higher for females [28]. Saijo et al. recently studied newly constructed buildings and stated that toluene, butyl acetate, ethylbenzene, α-pinene, p-dichlorobenzene, nonanal and xylene were significantly responsible for respiratory symptoms [29]. A survey in three North European cities found the indoor concentrations of 1-octen-3-ol and 3-methylfuran increased the risk of mucosal symptoms, and the indoor levels of some microbial volatile organic compounds and formaldehyde was associated with the risk of SBS [30].
In this study, the average TVOC concentration was higher in indoor air than in outdoor air (1190 vs. 180 ppb, respectively), with a large variation among offices (range from 6 to 55,730 ppb). The offices with subsidiary printing centers have noticeably higher TVOCs concentrations (median = 504 ppb, range = 95–55,730 ppb) than other offices without printing machines (median = 100 ppb, range = 10–362 ppb). VOCs in the indoor air are probably the factor associated with human health and comfort and individuals may feel discomfort if the indoor level of VOCs is above 3 mg/m3 in non-industrial environments [21]. Our study found that an elevated TVOC level was associated with increased prevalence of eye dryness, eye irritation, upper respiratory syndrome of stuffy nose, sneezing and dry throat, lower respiratory syndrome of difficulty breathing, skin syndrome of skin dryness, and non-specific syndromes of tiredness, angry easily, difficulty concentrating and dizziness (ORs range 1.00–1.06 for per 100 ppb of TVOCs increase). These findings were evident in adjusted MLR models through adjustment for potential confounders.
In this study, we encountered a problem in TVOC measurement because the wavelengths available in the photo-ionization detector for detecting various VOC species are limited. The portable PID monitors used to measure TVOCs in this study was equipped with a 10.6 eV photo-ionization detector. The instrument responds to organic and inorganic gases that have an ionization potential of less than 10.6 eV, including aromatic hydrocarbons, olefins, and higher molecular weight alkanes. It does not respond to light hydrocarbons such as methane, ethane, propane, acetylene, formaldehyde and methanol. Condensing humidity in the PID will cause false values by using a cool instrument in hot and humid air. In order to prevent false signals readings, we adjusted the instrument temperature to a level similar to the room temperature before each sampling.
Previous studies on SBS in Western countries were performed using a much larger sample size than ours [13,30]. It is interesting however to note that the risk associations found in our study are somewhat alike to their findings. It is likely our study is strengthened because we have carefully measured the 8-hour environmental risk exposures to obtain reliable data for participants. We also used adequate methods to evaluate the risk relationships. In the adjusted GEE MLR models, dCO2 and indoor VOCs concentrations are significantly associated with different symptoms (Table 4 and Table 5). In these models, the significant adjusted ORs per 100 ppm increase in dCO2 for the non-specific syndromes of tiredness and dizziness are different from those per 100 ppb increases in TVOCs for eye irritation, stuffy nose, difficulties in breathing, skin dryness, and irritability. We found that an elevated prevalence of SBS symptoms is associated with different indicators of indoor air quality.
This study applied personal responses to environmental assessments of 87 offices in eight high-rise buildings to investigate the association between indoor exposure to CO2 and TVOCs and SBS. It is plausible to explain the association by a biological mechanism. The ORs measured in the GEE MLR analyses show that risks of non-specific syndromes of tiredness and dizziness increase by 14% and 20%, respectively, associated with per 100 ppm increment of dCO2. CO2 levels in the blood may increase as dCO2 increases and cause an decrease in the oxygen saturation of the hemoglobin, resulting in oxygen starvation; which may well explain the association between dCO2 and complaints of tiredness and dizziness. On the other hand, the slight risks of eye irritation, stuffy nose and dry throat, difficulty in breathing, skin dryness, irritability and dizziness are associated with the volatile compounds in TVOCs.

5. Conclusions

Our study results suggest that symptoms of SBS are associated with various etiological factors. Non-specific syndromes of tiredness, difficulty to concentrate and dizziness are moderately associated with the difference of CO2 levels between the indoors and the outdoors. However, the risks of eye irritation, stuffy nose and dry throat, difficulty breathing, skin dryness, irritability and dizziness are slightly associated with TVOCs.

Acknowledgments

The authors gratefully acknowledge all the participants in this study. This work was supported by the National Science Council, Taiwan (grant number NSC 92-2320-B-039-054).

Author Contributions

Chen Yi-Chun assisted data analyses, interpreted data, drafted the manuscript, and completed the revision. Lu Chung-Yen designed the study, recruited subjects, carried out laboratory work and performed statistical analysis of data. Lin Jia-Min and Chen Ying-Yi assisted in laboratory work and manuscript interpretation. All authors have approved the manuscript.

Conflicts of Interest

The authors declare no conflict of interest.

References

  1. Freijer, J.I.; Bloemen, H.J.T. Modeling relationships between indoor and outdoor air quality. J. Air Waste Manage. Assoc. 2000, 50, 292–300. [Google Scholar] [CrossRef]
  2. Yassi, A.; Kjellström, T.; de Kok, T.; Guidotti, T.L. Basic Environmental Health, 1st ed.; University Press: Oxford, UK, 2001; pp. 291–292. [Google Scholar]
  3. Azuma, K.; Ikeda, K.; Kagi, N.; Yanagi, U.; Osawa, H. Prevalence and risk factors associated with nonspecific building-related symptoms in office employees in Japan: Relationships between work environment, Indoor Air Quality, and occupational stress. Indoor Air 2014. [Google Scholar] [CrossRef]
  4. Redlich, C.A.; Sparer, J.; Cellen, M.R. Sick-building syndrome. Occup. Med. 1997, 349, 1013–1016. [Google Scholar]
  5. Teculescu, D.B.; Sauleau, E.A.; Massin, N.; Bohadana, A.B.; Buhler, O.; Benamghar, L.; Mur, J.M. Sick-building symptoms in office workers in northeastern France: A pilot study. Int. Arch. Occup. Environ. Health 1998, 71, 353–356. [Google Scholar] [CrossRef] [PubMed]
  6. Mahnoudi, M.; Gershwin, M.E. Sick building syndrome. Ⅲ. Stachybotrys chartarum. J. Asthma 2000, 37, 191–198. [Google Scholar] [CrossRef] [PubMed]
  7. Niven, R.M.; Fletcher, A.M.; Pickering, C.A.C.; Faragher, E.B.; Potter, I.N.; Booth, W.B.; Jones, T.J.; Potter, P.D.R. Building sickness syndrome in healthy and unhealthy buildings: An epidemiological and environmental assessment with cluster analysis. Occup. Environ. Med. 2000, 57, 627–634. [Google Scholar] [CrossRef] [PubMed]
  8. Mendell, M.J. Non-specific symptoms in office workers: A review and summary of the epidemiologic literature. Indoor Air 1993, 3, 227–236. [Google Scholar] [CrossRef]
  9. Skyberg, K.; Skulberg, K.R.; Eduard, W.; Skåret, E.; Levy, F.; Kjuus, H. Symptoms prevalence among office employees and associations to building characteristics. Indoor Air 2003, 13, 246–252. [Google Scholar] [CrossRef] [PubMed]
  10. Bourbeau, J.; Brisson, C.; Allaire, S. Prevalence of the sick building syndrome symptoms in office workers before and six months and three years after being exposed to a building with an improved ventilation system. Occup. Environ. Med. 1997, 54, 49–53. [Google Scholar] [CrossRef] [PubMed]
  11. Backman, H.; Haghighat, F. Indoor-air quality and ocular discomfort. Amer. Optom. Assoc. 1999, 70, 309–316. [Google Scholar]
  12. Seppänen, O.A.; Fisk, W.J.; Merdell, M.J. Association of ventilation rates and CO2 concentrations with health and other responses in commercial and institutional buildings. Indoor Air 1999, 9, 226–252. [Google Scholar] [CrossRef] [PubMed]
  13. Apte, M.G.; Fisk, W.J.; Daisey, J.M. Associations between indoor CO2 concentrations and sick building syndromes in U.S. office buildings: An analysis of the 1994–1996 BASE study data. Indoor Air 2000, 10, 246–257. [Google Scholar] [CrossRef] [PubMed]
  14. Engvall, K.; Norrby, C.; Norbäck, D. Sick building syndrome in relation to building dampness in multi-family residential buildings in Stockholm. Int. Arch. Occup. Environ. Health 2001, 74, 270–278. [Google Scholar] [CrossRef] [PubMed]
  15. Tsai, D.H.; Lin, J.S.; Chan, C.C. Office workers’ sick building syndrome and indoor carbon dioxide concentrations. J. Occup. Environ. Hyg. 2012, 9, 345–351. [Google Scholar] [CrossRef] [PubMed]
  16. Norback, D.; Torgen, M.; Edling, C. Volatile organic compounds, respirable dust, and personal factors related to prevalence and incidence of sick building syndrome in primary schools. Brit. J. Ind. Med. 1990, 47, 733–741. [Google Scholar]
  17. Pommer, L.; Fick, J.; Sundell, J.; Nilsson, C.; Sjöström, M.; Stenberg, B.; Andersson, B. Class separation of buildings with high and low prevalence of SBS by principal component analysis. Indoor Air 2004, 14, 16–23. [Google Scholar] [CrossRef] [PubMed]
  18. Bako-Biro, Z.; Wargocki, P.; Weschler, C.J.; Fanger, P.O. Effects of pollution from personal computers on perceived air quality, SBS symptoms and productivity in offices. Indoor Air 2004, 14, 178–187. [Google Scholar] [CrossRef] [PubMed]
  19. Kim, J.L.; Elfman, L.; Mi, Y.; Wieslander, G.; Smedje, G.; Norbäck, D. Indoor molds, bacteria, microbial volatile organic compounds and plasticizers in schools—Associations with asthma and respiratory symptoms in pupils. Indoor Air 2007, 17, 153–163. [Google Scholar] [CrossRef] [PubMed]
  20. Takigawa, T.; Saijo, Y.; Morimoto, K.; Nakayama, K.; Shibata, E.; Tanaka, M.; Yoshimura, T.; Chikara, H.; Kishi, R. A longitudinal study of aldehydes and volatile organic compounds associated with subjective symptoms related to sick building syndrome in new dwellings in Japan. Sci. Total Environ. 2012, 417–418, 61–67. [Google Scholar]
  21. Mølhave, L. Volatile organic compounds, indoor air quality and health. Indoor Air 1991, 1, 357–376. [Google Scholar] [CrossRef]
  22. Barrefors, G.; Petersson, G. Assessment of ambient volatile hydrocarbons from tobacco smoke and from vehicle emissions. J. Chromatogr. 1993, 643, 71–76. [Google Scholar] [CrossRef] [PubMed]
  23. Lu, C.Y.; Ma, Y.C.; Lin, J.M.; Li, C.Y.; Lin, R.S.; Sung, F.C. Oxidative stress associated with indoor air pollution and sick building syndrome-related symptoms among office workers in Taiwan. Inhal. Toxicol. 2007, 19, 57–65. [Google Scholar] [CrossRef] [PubMed]
  24. Lu, C.Y.; Ma, Y.C.; Lin, J.M.; Chuang, C.Y.; Sung, F.C. Oxidative DNA damage estimated by urinary 8-hydroxydeoxyguanosine and indoor air pollution among non-smoking office employees. Environ. Res. 2007, 103, 331–337. [Google Scholar] [CrossRef] [PubMed]
  25. ASHRAE, ASHRAE Standard 62–2001. Ventilation for Acceptable Indoor Air Quality; American Society of Heating, Refrigerating, and Air-conditioning Engineers: Atlanta, GA, USA, 2001.
  26. Erdmann, C.A.; Apte, M.G. Mucous membrane and lower respiratory building related symptoms in relation to indoor carbon dioxide concentrations in the 100-building BASE dataset. Indoor Air 2004, 14, 127–134. [Google Scholar] [CrossRef] [PubMed]
  27. Jung, C.C.; Liang, H.H.; Lee, H.L.; Hsu, N.Y.; Su, H.J. Allostatic load model associated with indoor environmental quality and sick building syndrome among office workers. PLoS One 2014. [Google Scholar] [CrossRef]
  28. Takigawa, T.; Horike, T.; Ohashi, Y.; Kataoka, H.; Wang, D.H.; Kira, S. Were volatile organic compounds the inducing factors for subjective symptoms of employees working in newly constructed hospital. Environ. Toxic 2004, 19, 280–290. [Google Scholar] [CrossRef]
  29. Saijo, Y.; Kishi, R.; Sata, F.; Katakura, Y.; Urashima, Y.; Hatakeyama, A.; Kobayashi, S.; Jin, K.; Kurahashi, N.; Kondo, T.; Gong, Y.Y.; Umemura, T. Symptoms in relation to chemicals and dampness in newly built dwellings. Int. Arch. Occup. Environ. Health 2004, 77, 461–470. [Google Scholar] [CrossRef] [PubMed]
  30. Sahlberg, B.; Gunnbjörnsdottir, M.; Soon, A.; Jogi, R.; Gislason, T.; Wieslander, G.; Janson, C.; Norback, D. Airborne molds and bacteria, microbial volatile organic compounds (MVOC), plasticizers and formaldehyde in dwellings in three North European cities in relation to sick building syndrome (SBS). Sci. Total Environ. 2013, 444, 433–440. [Google Scholar] [CrossRef] [PubMed]

