
Effects of Simulated Heat Waves with Strong Sudden Cooling Weather on ApoE Knockout Mice

Abstract
:1. Introduction
2. Experimental Section
2.1. Equipment and Materials
2.2. Animals and Grouping
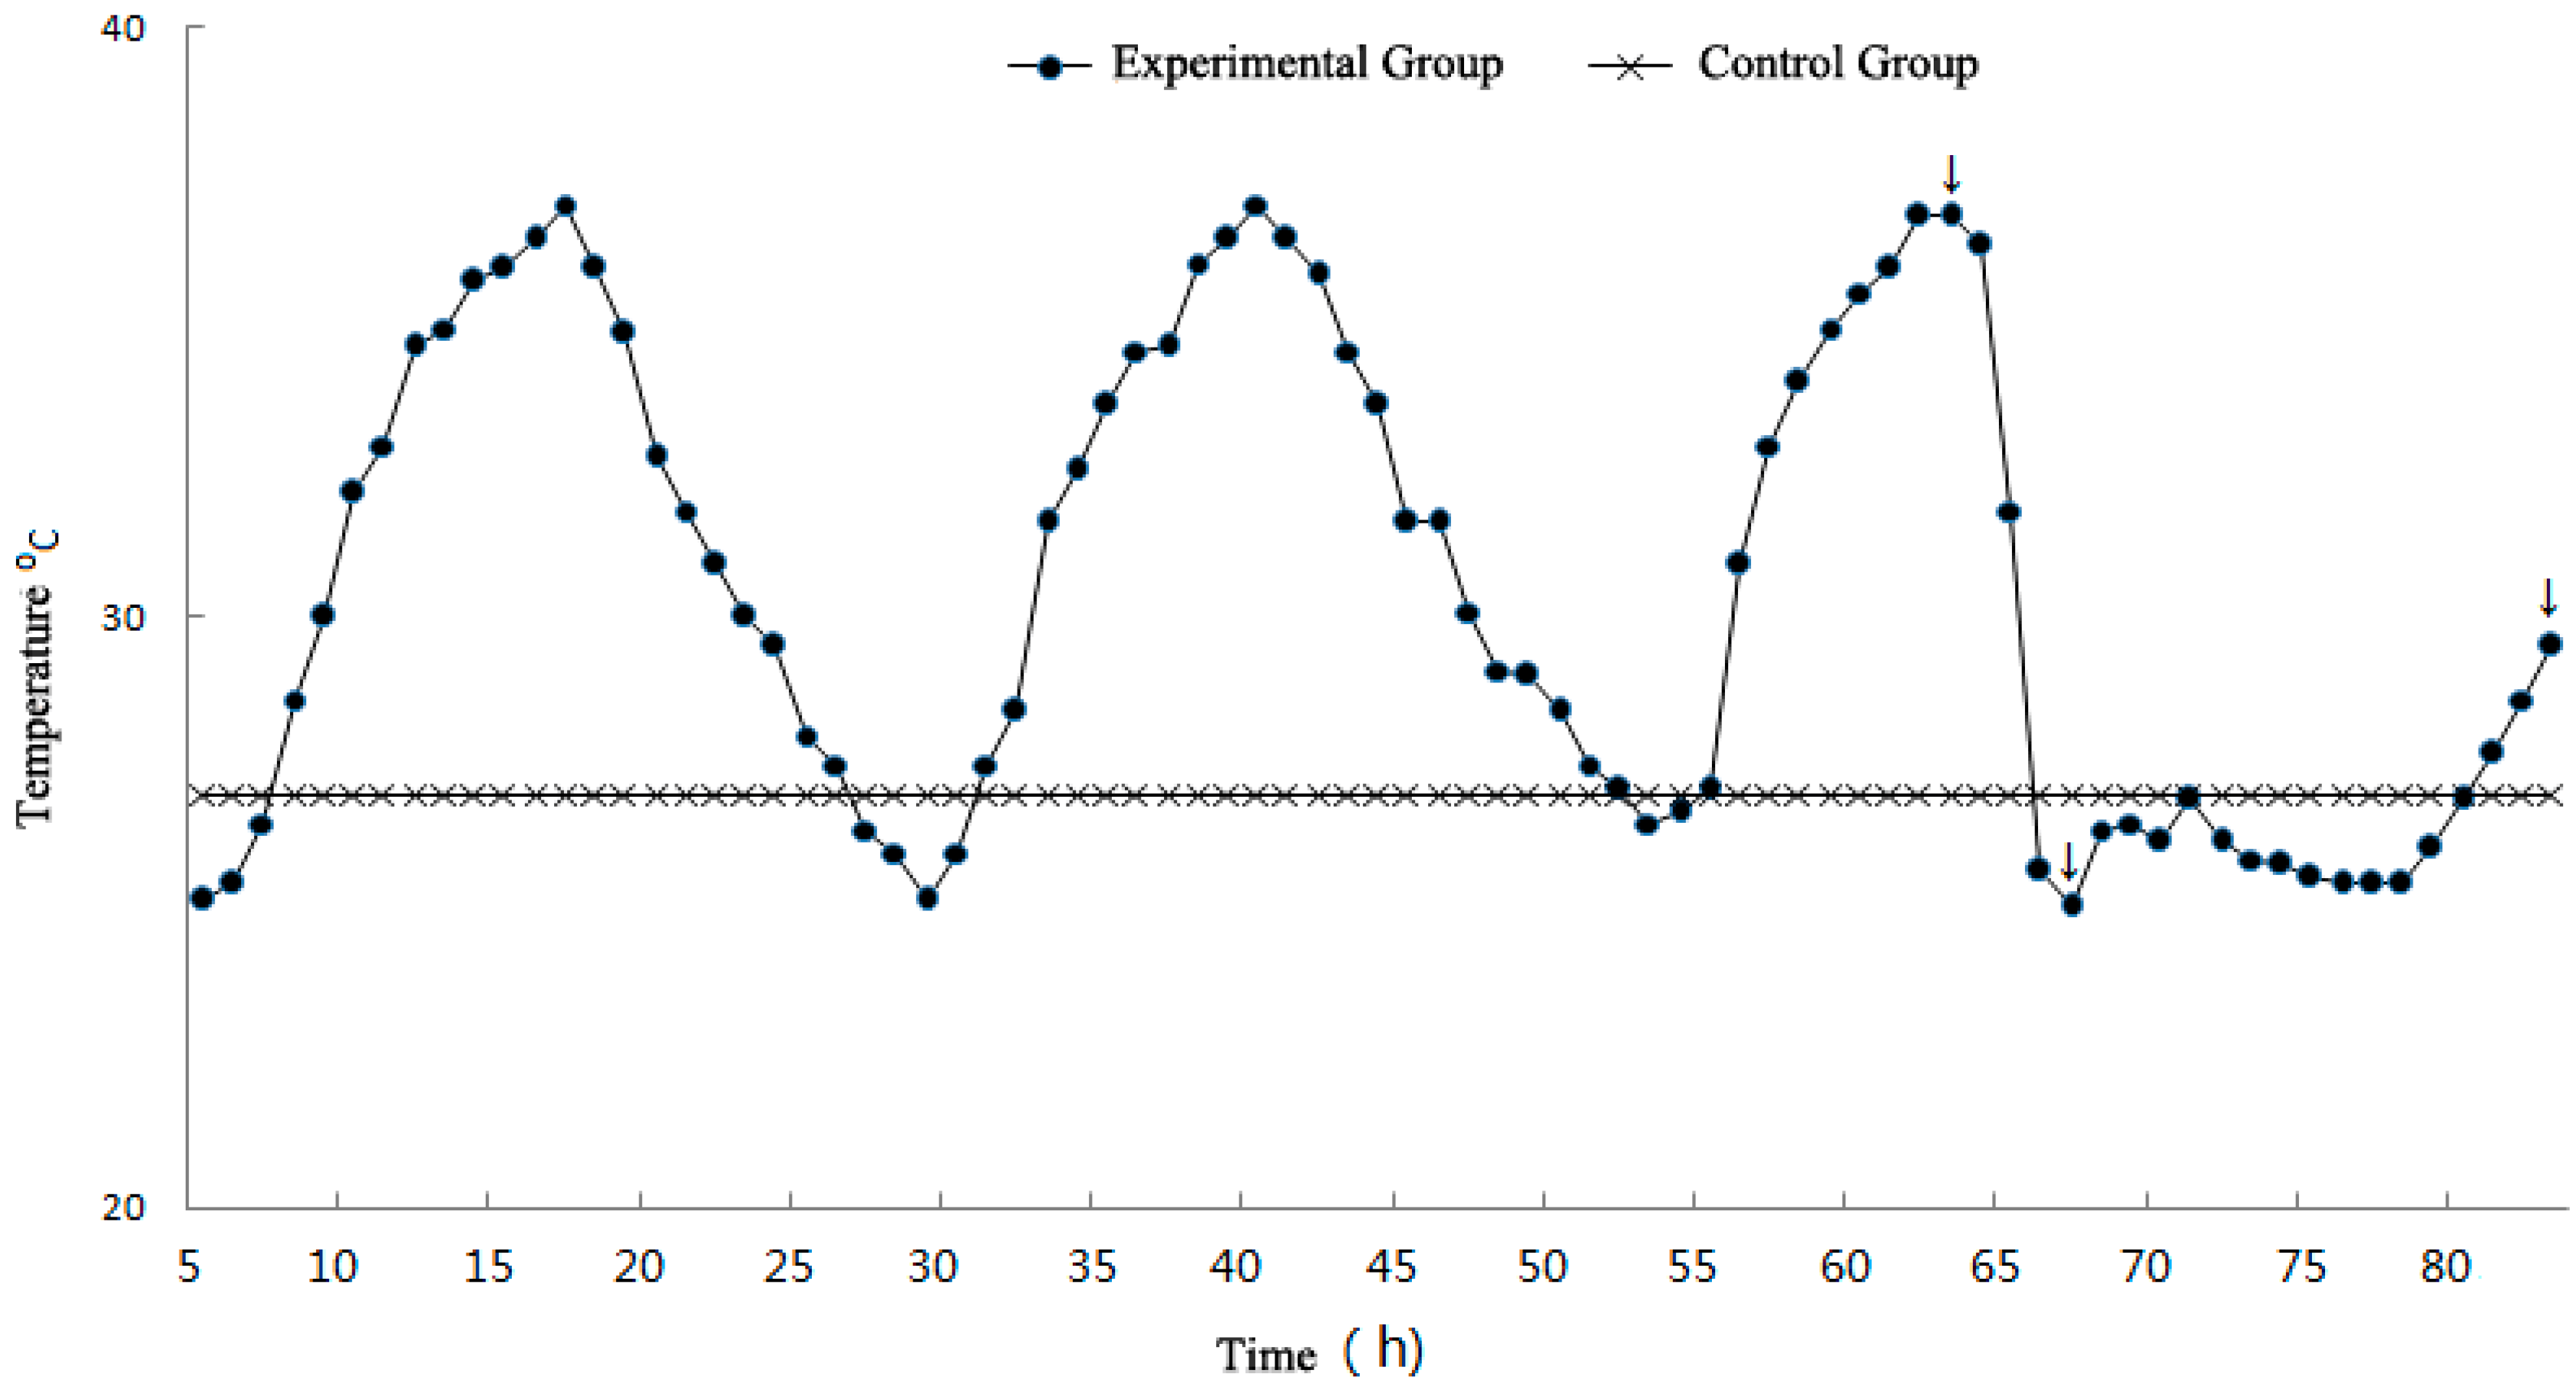
2.3. Establishment of the Experimental Curve
2.4. Experimental Process
2.4.1. Preparation for the Experiment and Heat Wave Simulation
2.4.2. Monitoring of Physiological Indicators and Sampling of Plasma and Tissue Fluid
2.4.3. Monitoring of Biochemical Indicators
2.5. Statistical Analysis
2.6. Ethic Statement
3. Results and Discussion
3.1. Changes in Physiological Indicators

| Group | Control Group | Heat Wave Group | Temperature Drop Group | Rewarming Temperature Group |
|---|---|---|---|---|
| Rectal Temperature (°C) | 37.98 ± 0.25 | 38.04 ± 0.25 | 36.98 ± 0.21 *,# | 38.09 ± 0.32 *,** |
| Body Weight (g) | 28.03 ± 2.48 | 28.00 ± 1.88 | 27.88 ± 1.33 | 29.83 ± 1.73 ** |
| Heart rate (beat/min) | 617 ± 40.67 | 575 ± 51.27 | 471 ± 34 * | 496 ± 47 * |
| SBP (mmHg) | 119 ± 1 | 118 ± 2.3 | 122 ± 0.67 *,# | 117.7 ± 1.44 ** |
3.2. Analysis of Heat Stimulation Factors, including HSP60, SOD, TNF, sICAM-1, and HIF-1α
| Index | Control Group | Heat Wave Group | Temperature Drop Group | Rewarming Temperature Group |
|---|---|---|---|---|
| HSP60 (ng/ml) | 6.45 ± 0.47 | 7.88 ± 0.29 * | 4.60 ± 0.39 *,# | 6.26 ± 0.84 # |
| SOD (U/mgprot) | 420.19 ± 10.28 | 382.45 ± 7.27 * | 412.84 ± 17.87 # | 408.43 ± 56.33 # |
| TNF (pg/ml) | 6.79 ± 0.67 | 7.98 ± 0.69 * | 7.08 ± 0.83 *,# | 7.26 ± 0.93 * |
| sICAM-1 (ng/L) | 65.66 ± 2.16 | 84.09 ± 8.41 * | 71.85 ± 3.64 *,# | 72.89 ± 5.39 *,# |
| HIF-1α (pg/L) | 745.22 ± 104.83 | 819.56 ± 83.59 * | 652.47 ± 130.05 *,# | 713.33 ± 97.86 # |
3.3. Analysis of Vasoconstrictor Materials
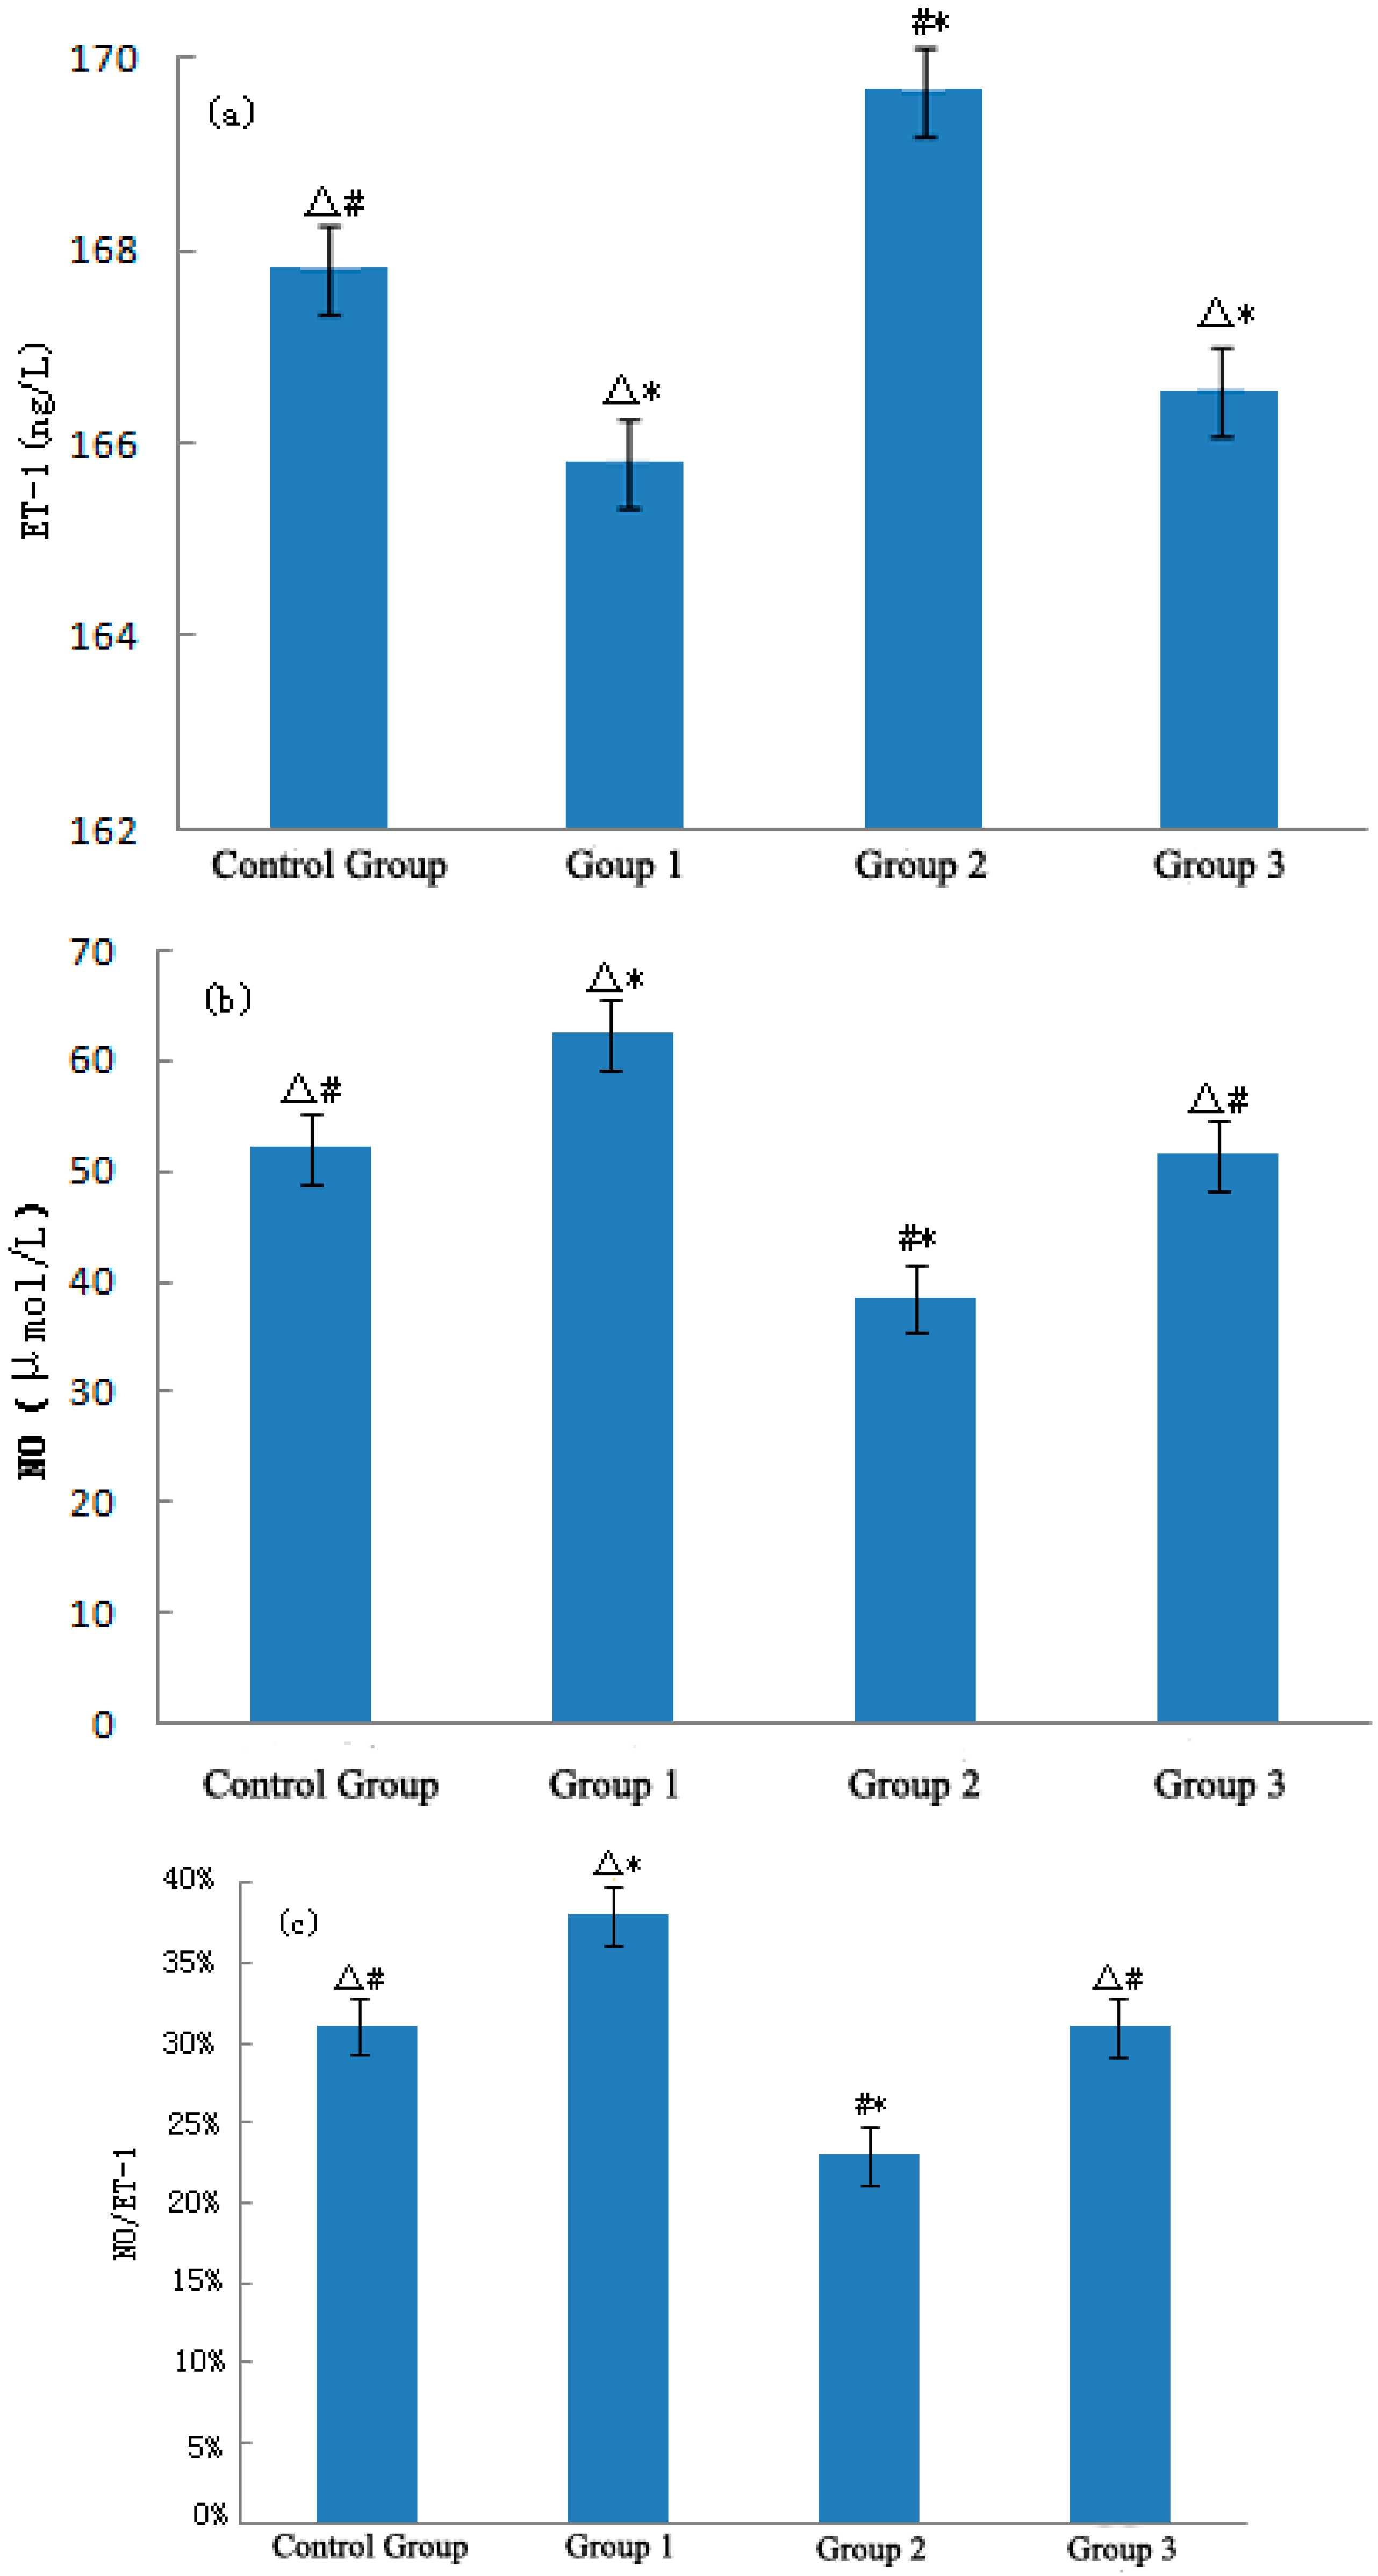
3.3.1. ET-1 and NO

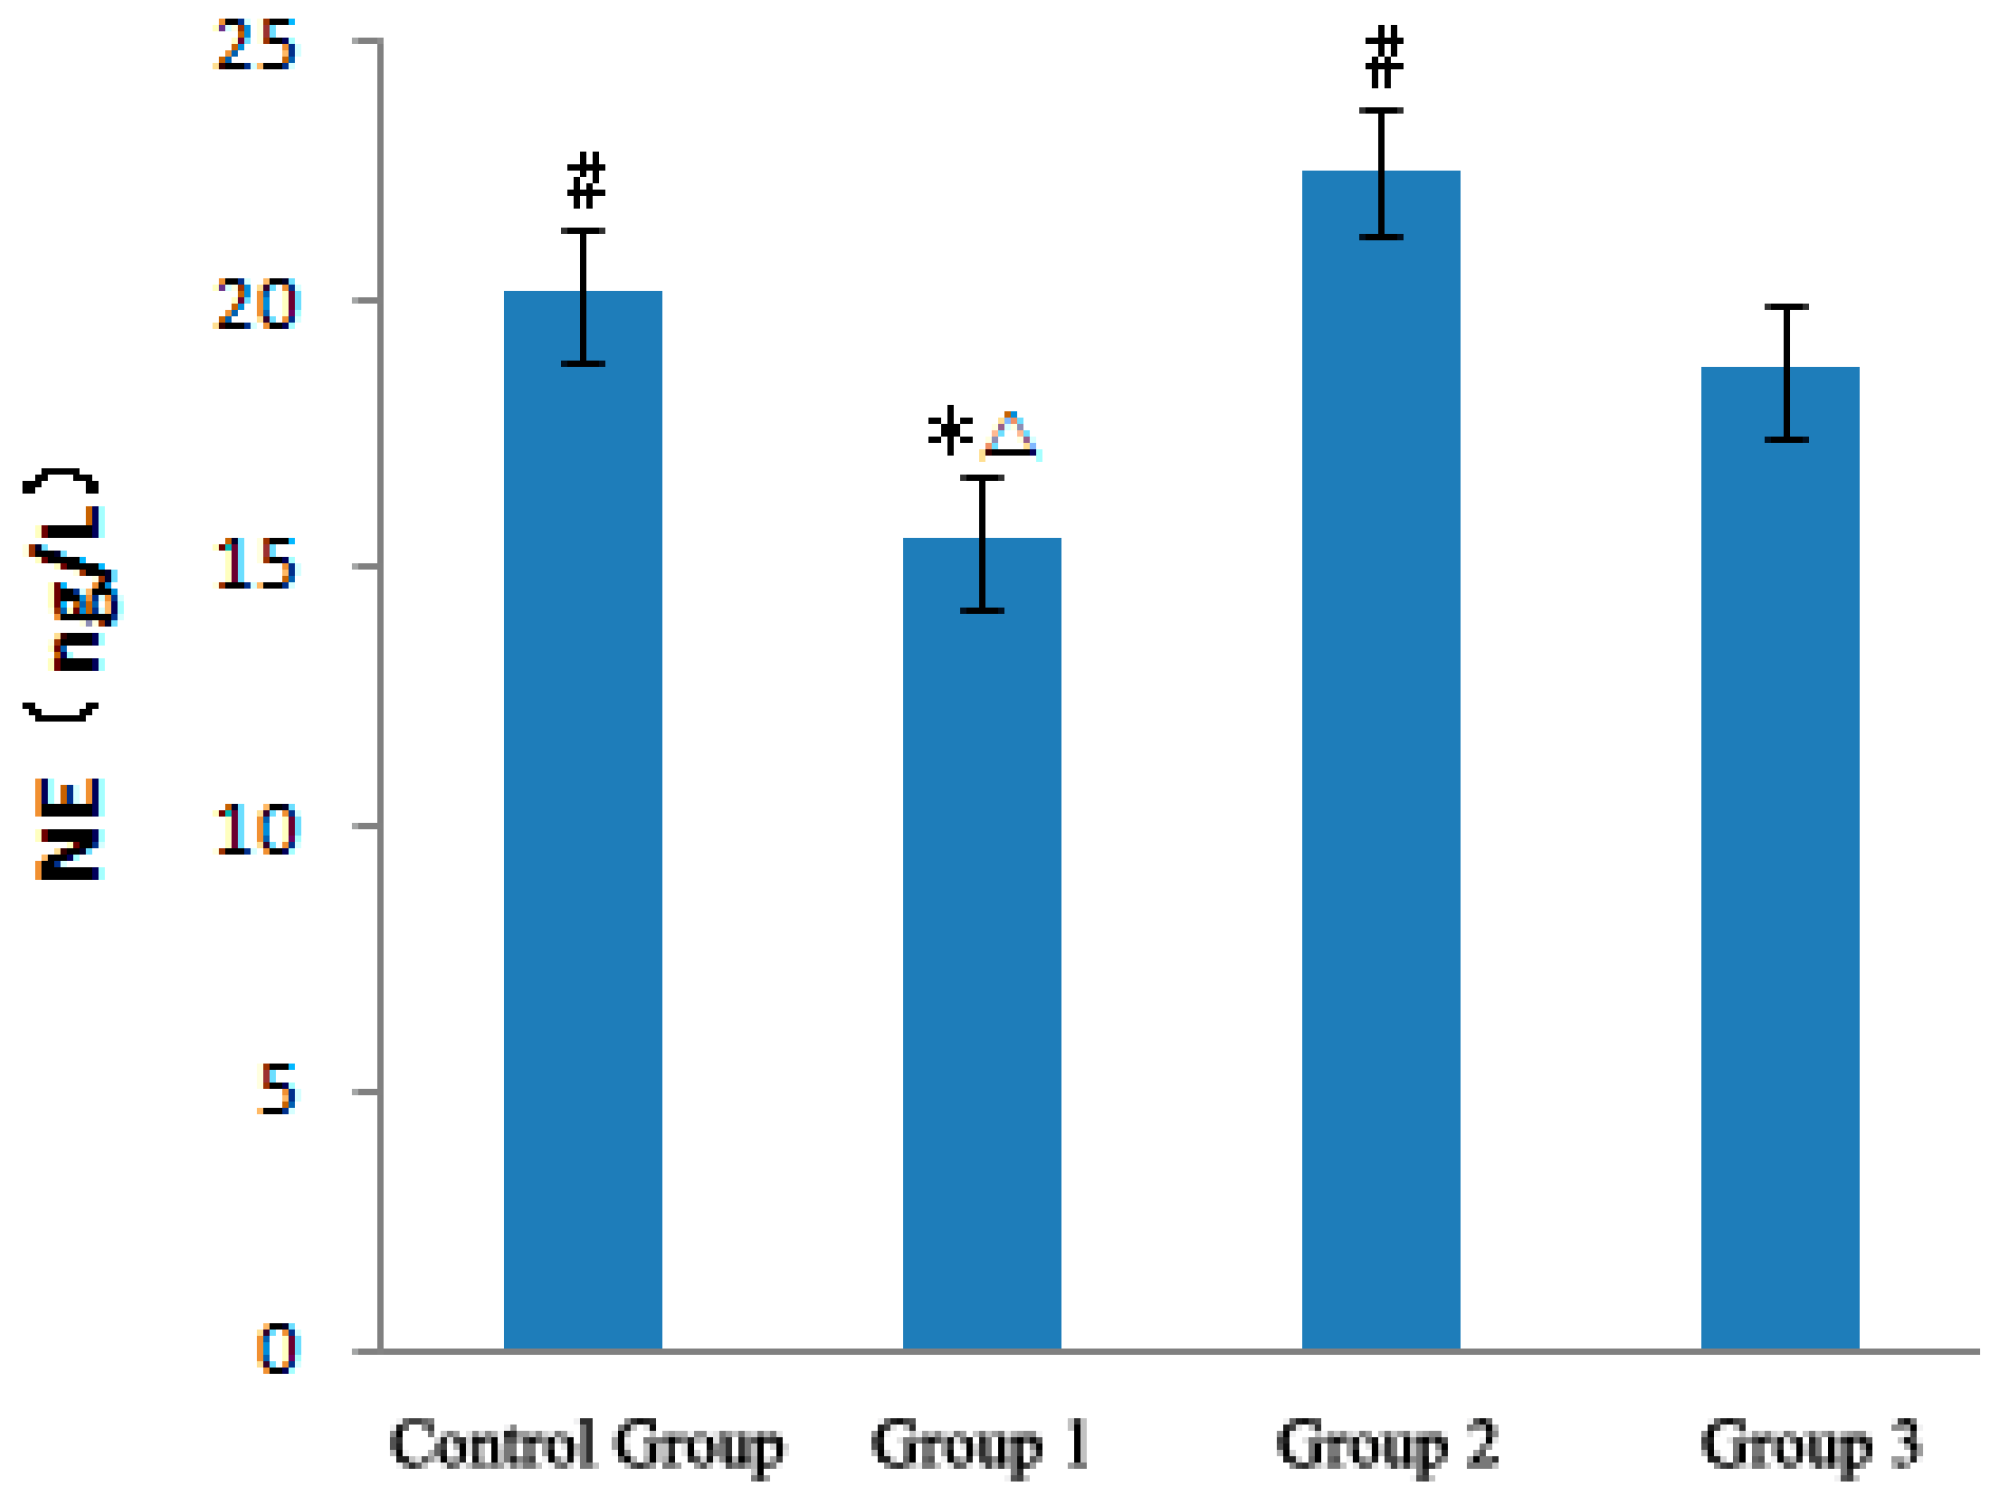
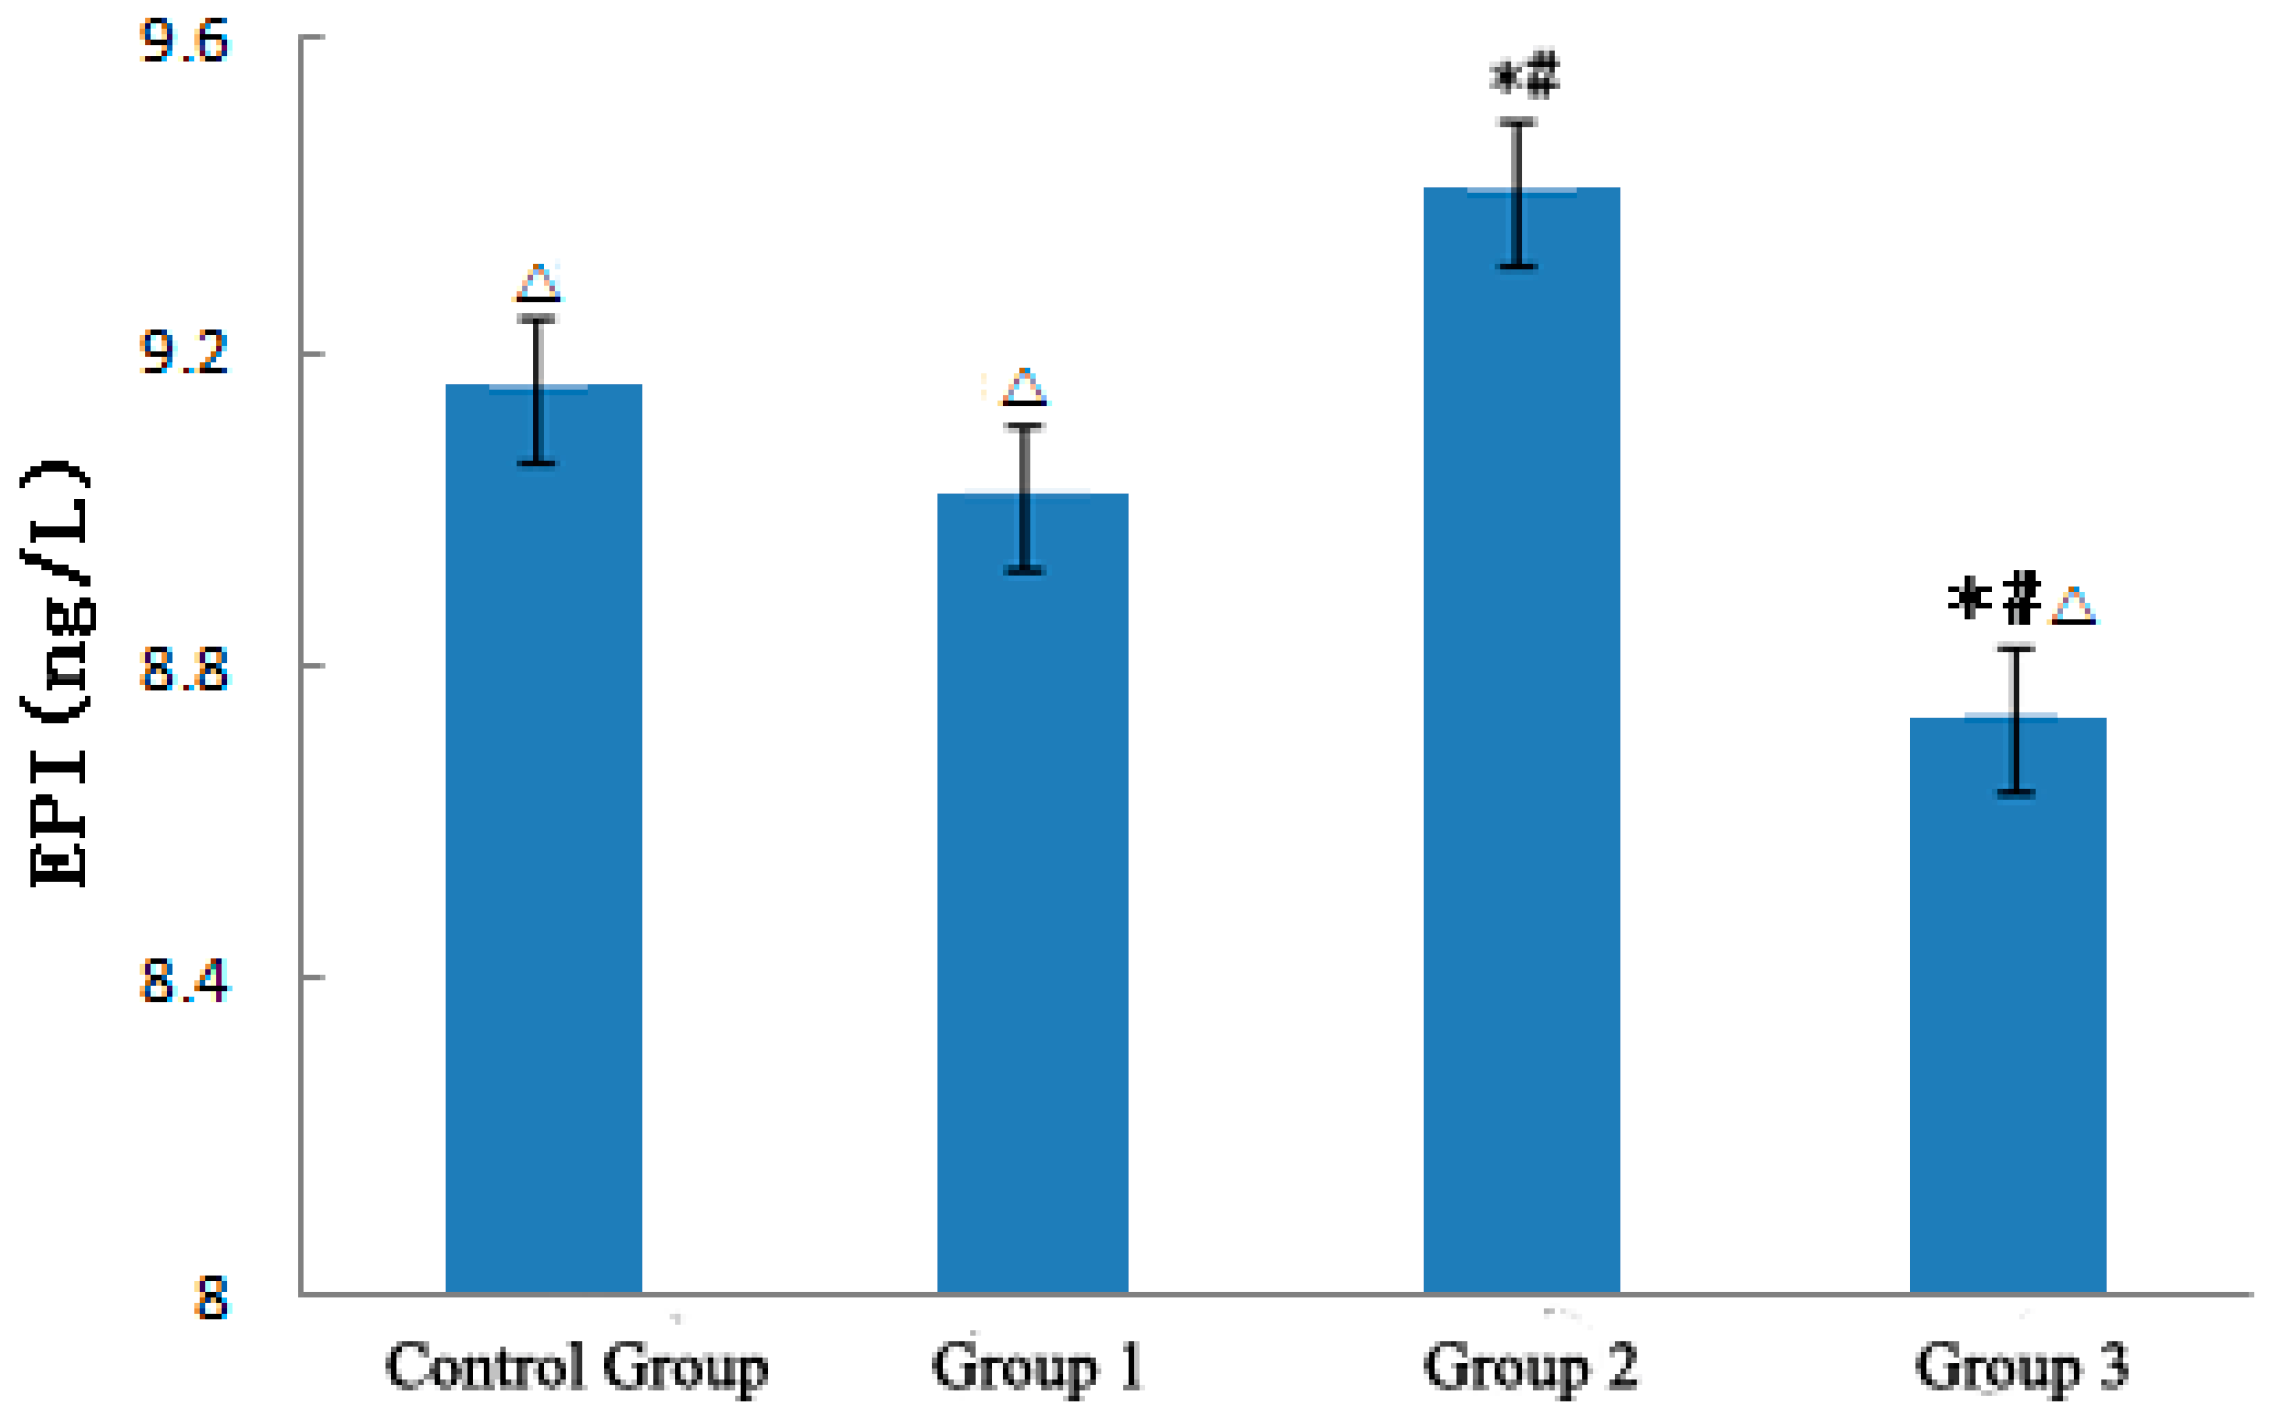
3.3.2. NE and EPI

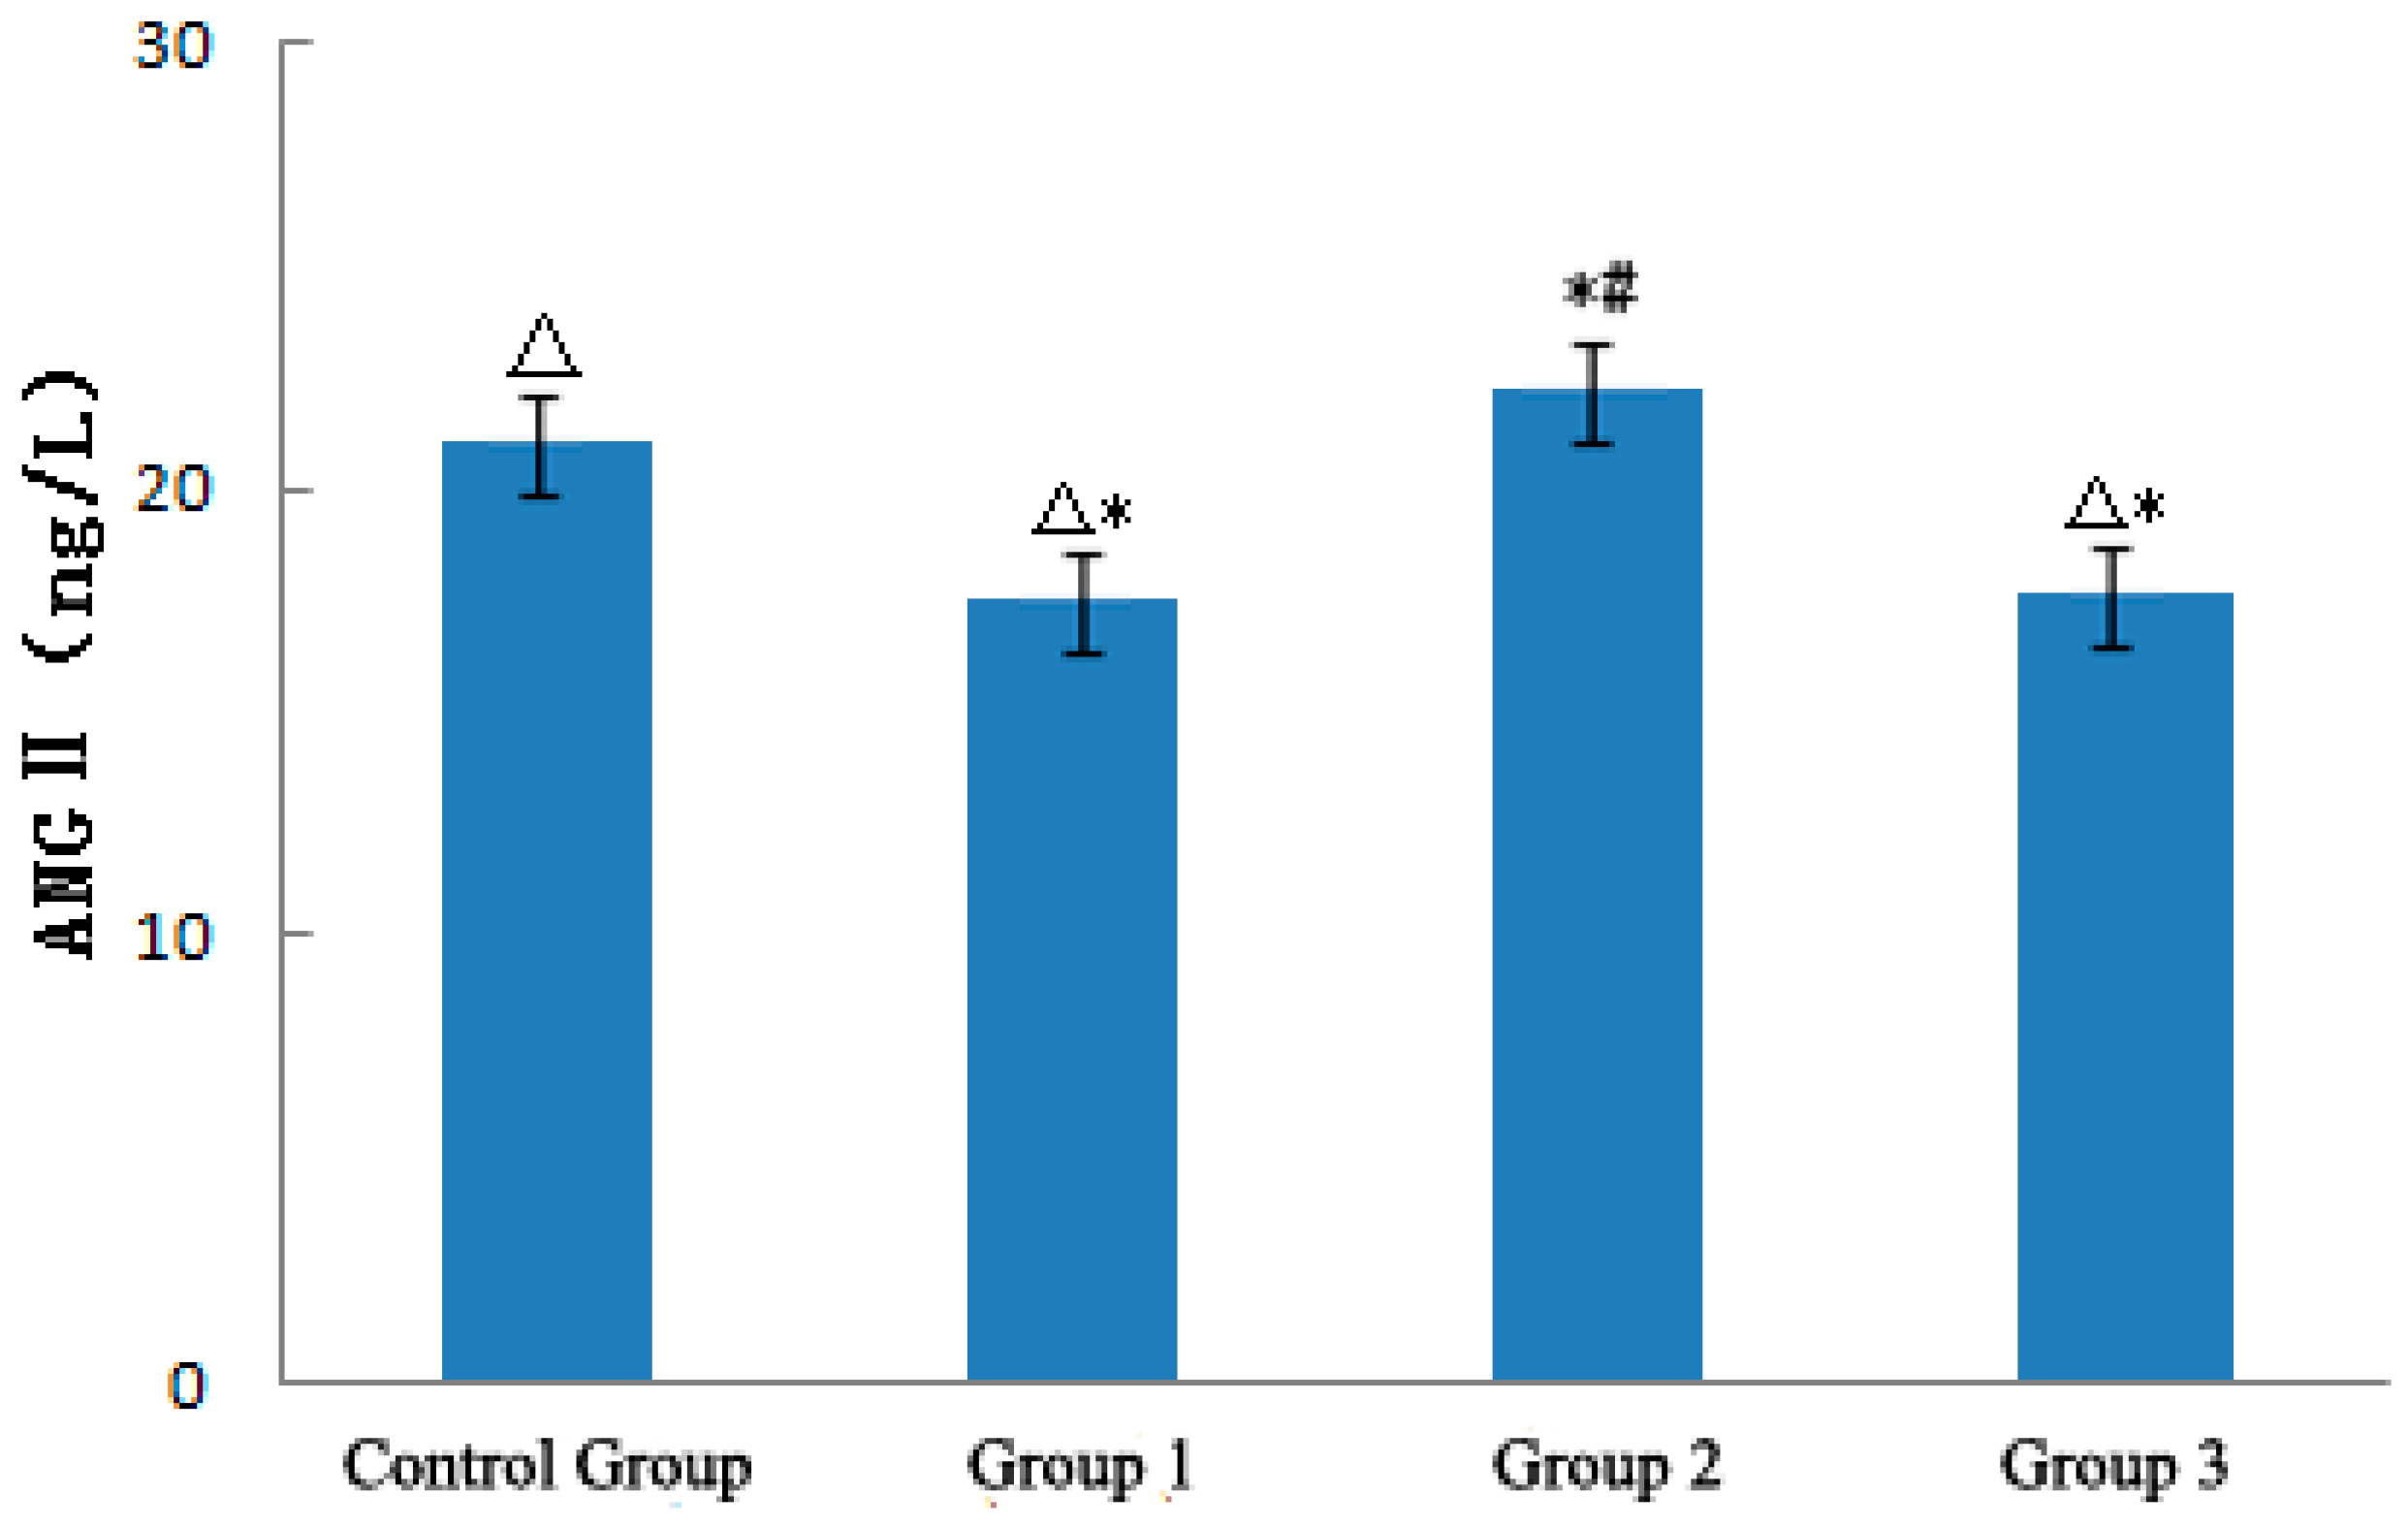
3.3.3. ANGII
3.4. Experimental Results of Cardiovascular Risk Factors
| Index | Control Group | Heat Wave Group | Temperature Drop Group | Rewarming Temperature Group |
|---|---|---|---|---|
| HDL-C (mmol/L) | 0.66344 ± 0.27 | 0.64618 ± 0.03 | 0.61865 ± 0.02 | 0.70578 ± 0.49 ** |
| LDL-C (mmol/L) | 1.66200 ± 0.09 | 1.54135 ± 0.16 ** | 1.68585 ± 0.16 # | 1.49493 ± 0.16 ** |
| Tc (mmol/L) | 2.25762 ± 0.05 | 2.20990 ± 0.22 | 2.34685 ± 0.11 | 2.04389 ± 0.93 ** |
| TG (mmol/L) | 1.7155 ± 0.15 #,** | 2.83420 ± 0.71 * | 3.09825 ± 0.93 * | 2.90980 ± 0.92 * |
| LDL-C/HDL-C | 2.505 | 2.402 | 2.725 # | 2.118 |
4. Conclusions
- 1
- A strong sudden temperature drop during a heat wave process evidently affects the physiological indicators of ApoE−/− mice. Whereas the heat wave increased the rectal temperature, the strong sudden temperature drop decreased the rectal temperature, increased blood pressure, decreased heart rate, and minimally affected the body weight.
- 2
- With the strong sudden temperature drop during the heat wave process, the levels of HSP60, TNF, sICAM-1, and HIF-1α (except SOD) of ApoE−/− mice showed similar variation trends and were significantly higher in the heat wave group than those in the control group. After the mice experienced a strong sudden temperature drop stimulation, the four indicators were reduced to different degrees. HSP60 and HIF-α levels in the temperature drop group decreased, and the decrease was lower than those in the control and heat wave groups. TNF and sICAM-1 levels slightly decreased, and the decrease was higher than that in the control group. Therefore, the two inflammatory factors adversely affected the cardiovascular system during the strong cooling process. The expression level of SOD in ApoE−/− mice decreased in the heat wave process and was restored with a strong sudden temperature drop. The obtained value was close to the level in the control group.
- 3
- The strong sudden temperature drop during the heat wave process could increase the level of ET-1 in ApoE−/− mice. NO was positively correlated with variations in temperature and significantly increased with the heat wave and decreased with the strong sudden temperature drop. The ratio between NO and ET-1 significantly increased as a result of the heat wave and was conducive to relaxing blood vessels and loss heat. By contrast, the strong sudden temperature drop apparently decreased NO/ET-1 levels, which was conducive to shrinking of blood vessels and maintaining the warmth of the body. The strong sudden temperature drop affected the NE levels of ApoE−/− mice. NE was inversely correlated with temperature variations, and decreased with the heat wave, and became conducive to relaxing blood vessels. Conversely, NE was increased by a strong sudden temperature drop and became conducive to shrinking blood vessels. The heat wave did not affect the level of EPI of ApoE−/− mice, but the strong sudden temperature drop increased EPI and was conducive to shrinking blood vessels. The strong sudden temperature drop during the heat wave process evidently affected the ANG II levels of ApoE−/− mice, and a continuous heat wave could decrease ANGII, causing blood vessels to expand [4], and be conducive to losing heat. Strong sudden temperature drops can significantly increase ANGII, induce vasomotor effects, and cause high blood pressure [14,15,16,17,18], leading to CVD exacerbation [17].
- 4
- The strong sudden temperature drop during the heat wave process could affect the blood lipid levels of ApoE−/− mice. In the entire process, HDL-C of ApoE−/− mice slightly decreased and TG significantly sustained the increase. LDL-C, TC, and LDL-C/HDL-C levels were inversely correlated with temperature variations, as they decreased with the heat wave, and increased with a strong sudden temperature drop. Therefore, strong sudden temperature drops during a heat wave process can increase the levels of cardiovascular blood lipid risk factors in mice.
- 5
- The possible mechanism of the occurrence and aggravation of CVD could be due to heat waves with strong sudden cooling weather.
Acknowledgments
Author Contributions
Conflicts of Interest
References
- Zhang, D.; Li, S.; Gao, X. Analyzing the relationship between cardiac and cerebral vascular diseases and meteorological conditions. In Proceedings of the 28th Session of the China Meteorological Society Annual Meeting-S14 Climatic and Environmental Change and Human Health, Xiamen, China, 9–11 November 2011; pp. 135–141.
- Cheng, Y.; Zhou, M. Oxidative stress-inflammatory new progress in the study on occurrence of role in the development of atherosclerosis. Chin. J. Arterioscler. 2008, 16, 757–762. [Google Scholar]
- Zhen, C.; Zhang, W.; Niang, Y. Effect of heat stress in rats with early inflammatory factor level and ulinastatin intervention. J. Med. Postgrad. 2011, 24, 25–28. [Google Scholar]
- Wang, C.; Zhang, S.; Tian, Y.; Wang, B.; Shen, S. Effects of Simulated Heat Waves on ApoE−/− Mice. Int. J. Environ. Res. Public Health 2014, 11, 1549–1556. [Google Scholar] [CrossRef] [PubMed]
- Sun, Z.; Fregly, M.J.; Cade, J.R. Effect of renal denervation on elevation of blood pressure in cold-exposed rats. Can. J. Physiol. Pharmacol. 1995, 73, 72–78. [Google Scholar] [CrossRef] [PubMed]
- Sun, Z. Genetic AVP deficiency abolishes cold-induced diuresis but does not attenuate cold-induced hypertension. Am. J. Physiol. Renal. Physiol. 2006, 290, F1472–F1477. [Google Scholar] [CrossRef] [PubMed]
- Zhang, X.; Zhou, J.; Zhang, S.; Ma, S.; Wang, B. Experimental research of the impact of simulated cold wave on hypertension disease. Meteorolo. Mon. 2014, 40, 789–793. [Google Scholar]
- Wang, Y.; Wang, Q. Observation of the blood lipid in cardiovascular and cerebrovascular diseases patients. Chin. Community Dr. (Compr. Ed.) 2005, 7, 66. [Google Scholar]
- Yang, Y. Investigation and analysis on 3000 cases of blood lipid level in the elderly. Chin. Community Dr. (Med. Prof.) 2010, 12, 216. [Google Scholar]
- Zhang, S. Medical Meteorological Forecast, 1st ed.; China Meteorological Press: Beijing, China, 2010. [Google Scholar]
- Li, X.; Mao, W.; Wu, H.; Chen, Q. Experimental study on the effect of “Denglao Guanxin Capsule” on atherosclerotic plaque. Prac. Pharm. Clin. Remed. 2012, 15, 616–617. [Google Scholar]
- Zhu, W.; Zhang, S.; Tian, Y.; Luo, B.; Wang, B. Effects of heat wave on ET-1, NO and body temperature in ApoE-deficient mice. Sci. Technol. Eng. 2013, 13, 4626–4630. [Google Scholar]
- Bai, H.; Li, J.; Liu, J.; Tian, Y.; Zhu, D. Effect of high fat diet on biochemical and pathological morphology in mice. Chin. J. Comp. Med. 2010, 20, 41–45. [Google Scholar]
- Zhang, S.; Ma, S.; Zhou, J.; Luo, B.; Wang, B.; Qin, Y. Study of influence mechanism of cold wave on hypertension disease. Meteorol. Mon. 2013, 39, 789–793. [Google Scholar]
- Luo, B.; Zhang, S.; Ma, S.; Zhou, J.; Wang, B. Effects of cold air on cardiovascular disease risk factors in rat. Int. J. Environ. Res. Public Health 2012, 9, 2312–2325. [Google Scholar] [CrossRef] [PubMed]
- Luo, B.; Zhang, S. Artificial cold air increases the cardiovascular risks in spontaneously hypertensive rats. Int. J. Environ. Res. Public Health 2012, 9, 3197–3208. [Google Scholar] [CrossRef] [PubMed]
- Luo, B.; Zhang, S.; Ma, S.; Zhou, J.; Wang, B. Effects of different cold-air exposure intensities on the risk of cardiovascular disease in healthy and hypertensive rats. Int. J. Biometeorol. 2014, 58, 185–194. [Google Scholar] [CrossRef] [PubMed]
- Zhang, X.; Zhang, S.; Wang, C.; Wang, B.; Guo, P. Effects of moderate strength cold air exposure on blood pressure and biochemical indicators among cardiovascular and cerebrovascular patients. Int. J. Environ. Res. Public Health 2014, 11, 2472–2487. [Google Scholar] [CrossRef] [PubMed]
- Mandal, K.; Jahangiri, M.; Xu, Q. Autoimmunity to heat shock proteins in atherosclerosis. Autoimmun. Rev. 2004, 3, 31–37. [Google Scholar] [CrossRef] [PubMed]
- He, W.; Yi, L. Advances in heat shock protein 60 and coronary atherosclerosis relationship. Chin. J. Lab. Diagn. 2012, 16, 750–753. [Google Scholar]
- Yang, J.; Wu, X.; Bo, X.; Xie, P.; Zhang, C. The value of human heat shock protein 60 in acute coronary syndrome. Modern Med. 2011, 39, 1–5. [Google Scholar] [CrossRef]
- Hu, P.; Wu, G.; Xia, Q.; Mao, Z. Achievement in SOD mimics with antioxidant and anti- inflammation function. Prog. Chem. 2009, 21, 873–879. [Google Scholar]
© 2015 by the authors; licensee MDPI, Basel, Switzerland. This article is an open access article distributed under the terms and conditions of the Creative Commons Attribution license (http://creativecommons.org/licenses/by/4.0/).
Share and Cite
Zhang, S.; Kuang, Z.; Zhang, X. Effects of Simulated Heat Waves with Strong Sudden Cooling Weather on ApoE Knockout Mice. Int. J. Environ. Res. Public Health 2015, 12, 5743-5757. https://doi.org/10.3390/ijerph120605743
Zhang S, Kuang Z, Zhang X. Effects of Simulated Heat Waves with Strong Sudden Cooling Weather on ApoE Knockout Mice. International Journal of Environmental Research and Public Health. 2015; 12(6):5743-5757. https://doi.org/10.3390/ijerph120605743
Chicago/Turabian StyleZhang, Shuyu, Zhengzhong Kuang, and Xiakun Zhang. 2015. "Effects of Simulated Heat Waves with Strong Sudden Cooling Weather on ApoE Knockout Mice" International Journal of Environmental Research and Public Health 12, no. 6: 5743-5757. https://doi.org/10.3390/ijerph120605743