
Comparative Cytotoxicity Study of Silver Nanoparticles (AgNPs) in a Variety of Rainbow Trout Cell Lines (RTL-W1, RTH-149, RTG-2) and Primary Hepatocytes

 and
and
Abstract
:1. Introduction
2. Experimental Section
2.1. Chemicals and Reagents
2.2. Nanoparticles
2.3. Physico-Chemical Characterization of Nanoparticles
2.4. Cell Line Culture
2.5. Primary Hepatocyte Isolation and Culture
2.6. Exposures
2.7. Cytotoxicity Assessment Using AlamarBlue, CFDA-AM and Neutral Red Uptake (NRU) Assay
2.8. Interference
2.9. Statistics
3. Results
3.1. Physico-Chemical Characterisation

| NM-300K Suspension (93.5 µg/mL) | Hydrodynamic Size by Intensity | Hydrodynamic Size by Volume | Hydrodynamic Size by Number | ||||||||
|---|---|---|---|---|---|---|---|---|---|---|---|
| Medium Type (Cells) | Temp (˚C) | Cl Ion (mM) | Cysteine */ Cystine Content (µM) | Time (h) | PdI | Z-Av (d.nm ± sd) | Peak 1 (d.nm ± sd) (%) | Peak 2 (d.nm ± sd) (%) | Peak 1 (d.nm± sd) (%) | Peak 2 (d.nm± sd) (%) | Peak 1 (d.nm ± sd) (%) |
| MilliQ Water MEM(-) | 20 | − | − | T0 | 0.473 | 36 ± 7 | 6 ± 1 (14) | 54 ± 6 (86) | 4 ± 1 (98) | 25 ± 3 (2) | 4± 1 (100) |
| T24 | 0.484 | 36 ± 10 | 6 ± 1 (9) | 56 ± 3 (91) | 4 ± 2 (97) | 30 ± 4 (3) | 3 ±1 (100) | ||||
| 20 | 75.7 | 99 | T0 | 0.453 | 44 ± 12 | 6 ± 1 (10) | 62 ± 8 (90) | 5 ± 1 (95) | 30 ±6 (5) | 4 ± 1(100) | |
| T24 | 0.569 | 188 ± 72 | 467± 56 (54) | 42 ± 3 (46) | 29 ± 3 (90) | 570 ±30(10) | 24 ±3 (100) | ||||
| L-15 (RTL-W1 *) | 20 | 88.0 | 990 * | T0 | 0.418 | 34 ± 1 | 7 ± 1 (8) | 53 ± 3 (92) | 5.8 ± 1 (93) | 28 ± 3 (7) | 5 ± 1 (100) |
| T24 | 0.234 | 209 ±4 | 254 ± 27 (100) | 294 ± 36 (100) | 136 ± 13(100) | ||||||
| EMEM (pyr) (RTH-149) | 20 | 75.7 | 99 | T0 | 0.529 | 58 ± 2 | 9 ± 2 (9) | 70 ± 9 (91) | 7 ± 1 (95) | 24 ± 7 (5) | 5 ± 2(100) |
| T24 | 0.441 | 53 ± 1 | 9 ± 1 (11) | 83 ± 2 (89) | 8 ± 1 (96) | 23 ± 3 (4) | 6 ± 1(100) | ||||
| EMEM (NEAA) (RTG-2) | 20 | 75.7 | 99 | T0 | 0.455 | 53 ± 3 | 8 ± 1 (7) | 79 ± 7 (93) | 5 ± 1 (97) | 21 ± 7 (3) | 4 ± 1 (100) |
| T24 | 0.297 | 43 ± 1 | 7 ± 2 (5) | 64 ± 7 (95) | 6 ± 2 (92) | 26 ± 8 (8) | 5 ± 2 (100) | ||||
| M199 (primary hepatocytes) | 16 | 75.3 | 5 * /83 | T0 | 0.430 | 35 ± 1 | 6 ± 2 (6) | 58 ± 3 (94) | 5 ± 1 (92) | 26 ± 6 (8) | 4 ± 1 (100) |
| T24 | 0.428 | 35 ± 1 | 6 ± 1 (8) | 58 ± 4 (92) | 5 ±1 (96) | 26 ± 2 (4) | 4 ± 1 (100) | ||||
| Mean size distribution | T0 | 0.458 | 45 ± 12 | 7.5 ± 1 (7) | 65 ± 12 (93) | 6 ± 1 (94) | 24 ± 3 (6) | 5 ± 1 (100) | |||
| * excluding RTL-W1 culture medium L-15 | T24 * | 0.389 | 44 ± 9 | 7.3 ± 2 (8) | 68 ± 13 (92) | 6 ± 2 (95) | 25 ± 2 (5) | 5 ± 1 (100) | |||
3.2. Interference
3.3. Cytotoxicity of AgNO3 and NM-300K
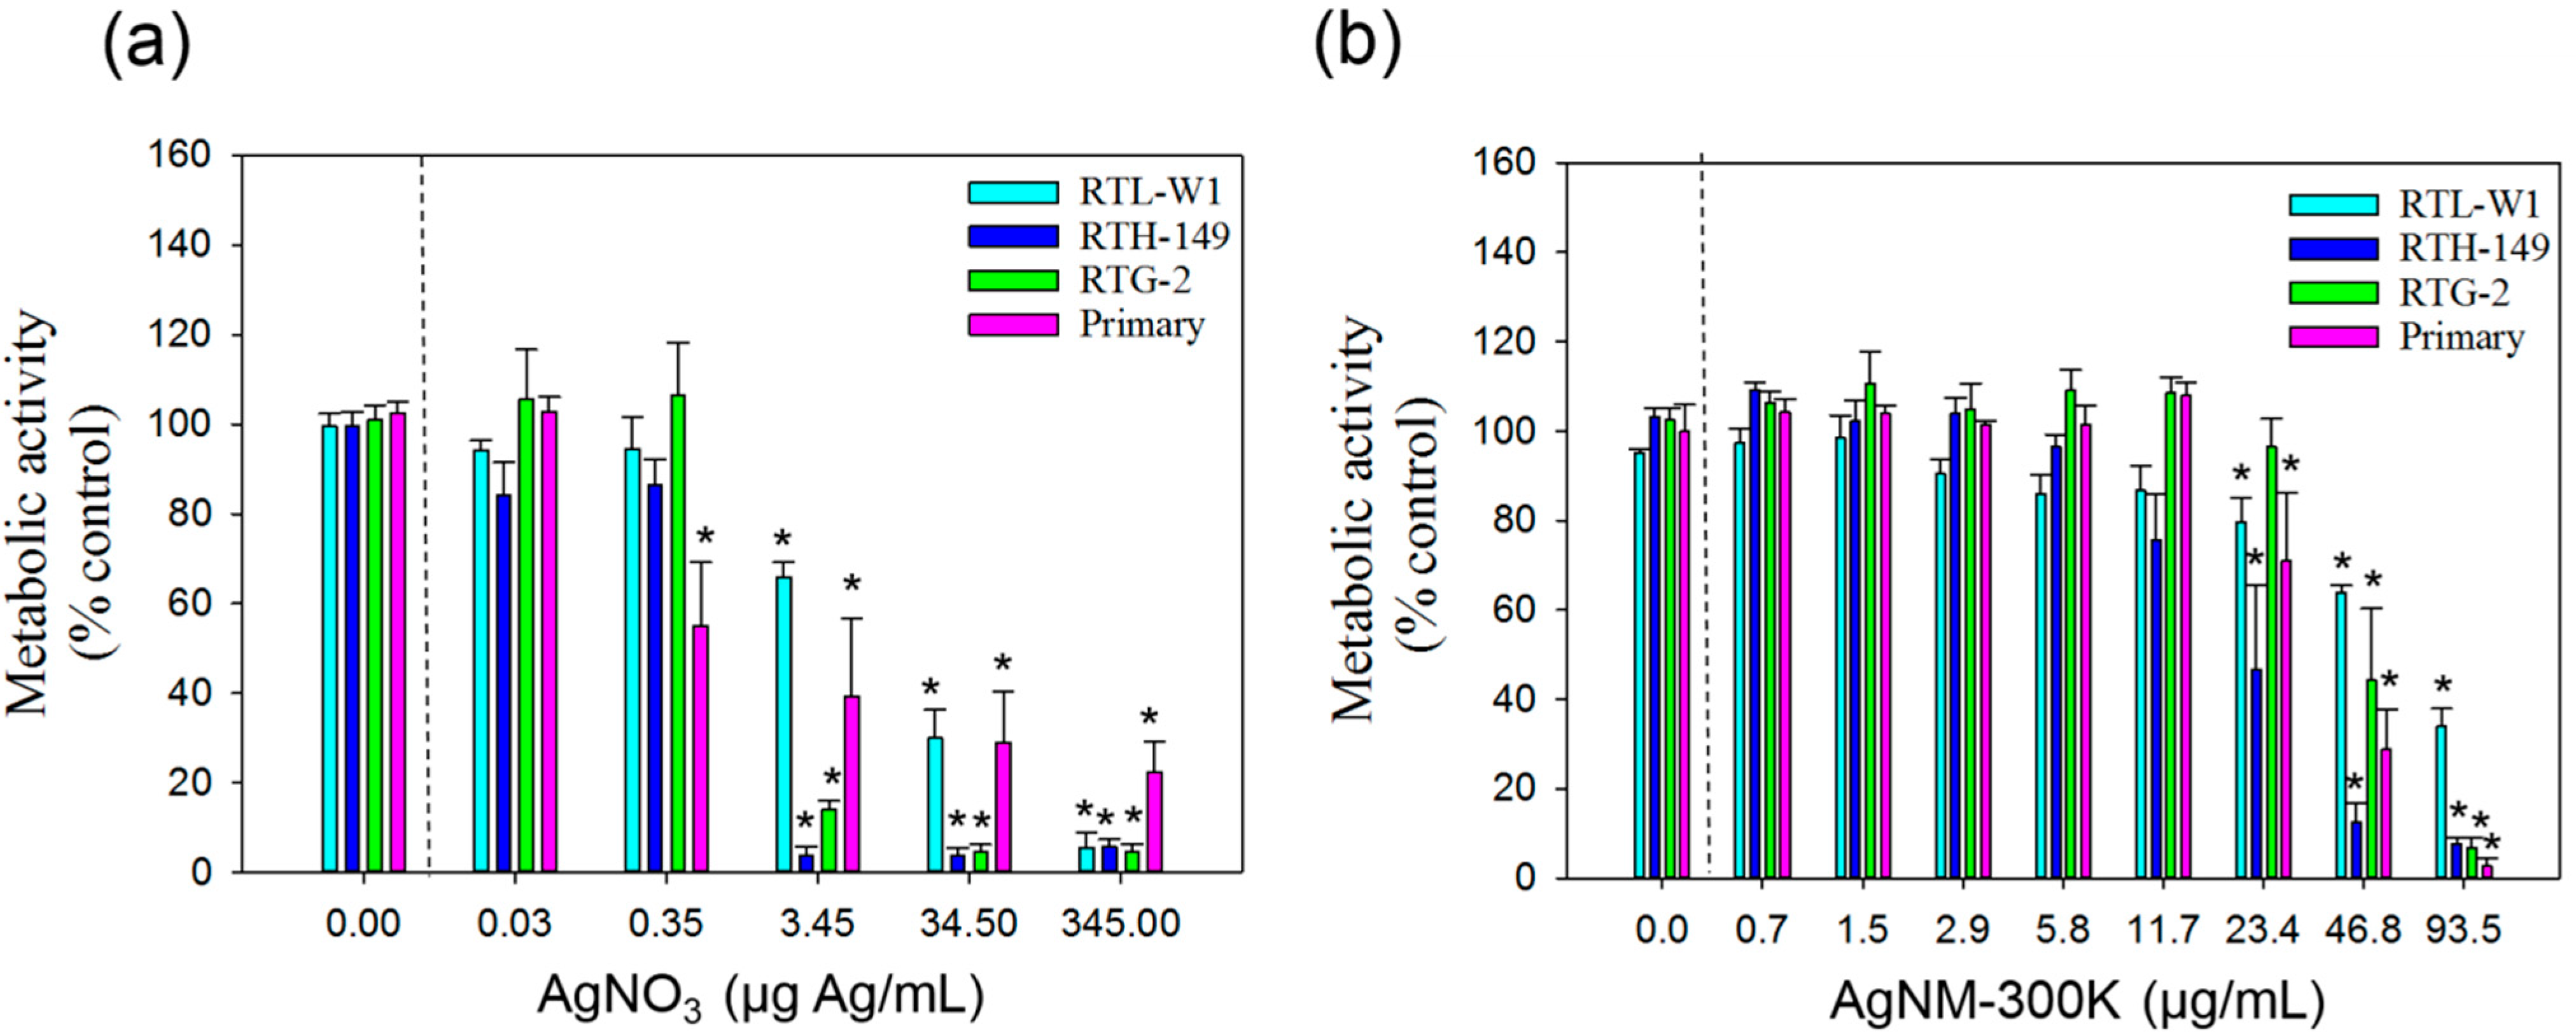
3.3.1. AlamarBlue Assay

| Assay system | AlamarBlue | CFDA-AM | NRU | ||||
|---|---|---|---|---|---|---|---|
| AgNO3 | NM-300K | AgNO3 | NM-300K | AgNO3 | NM-300K | ||
| Cell line | IC50 (µg/mL) | ||||||
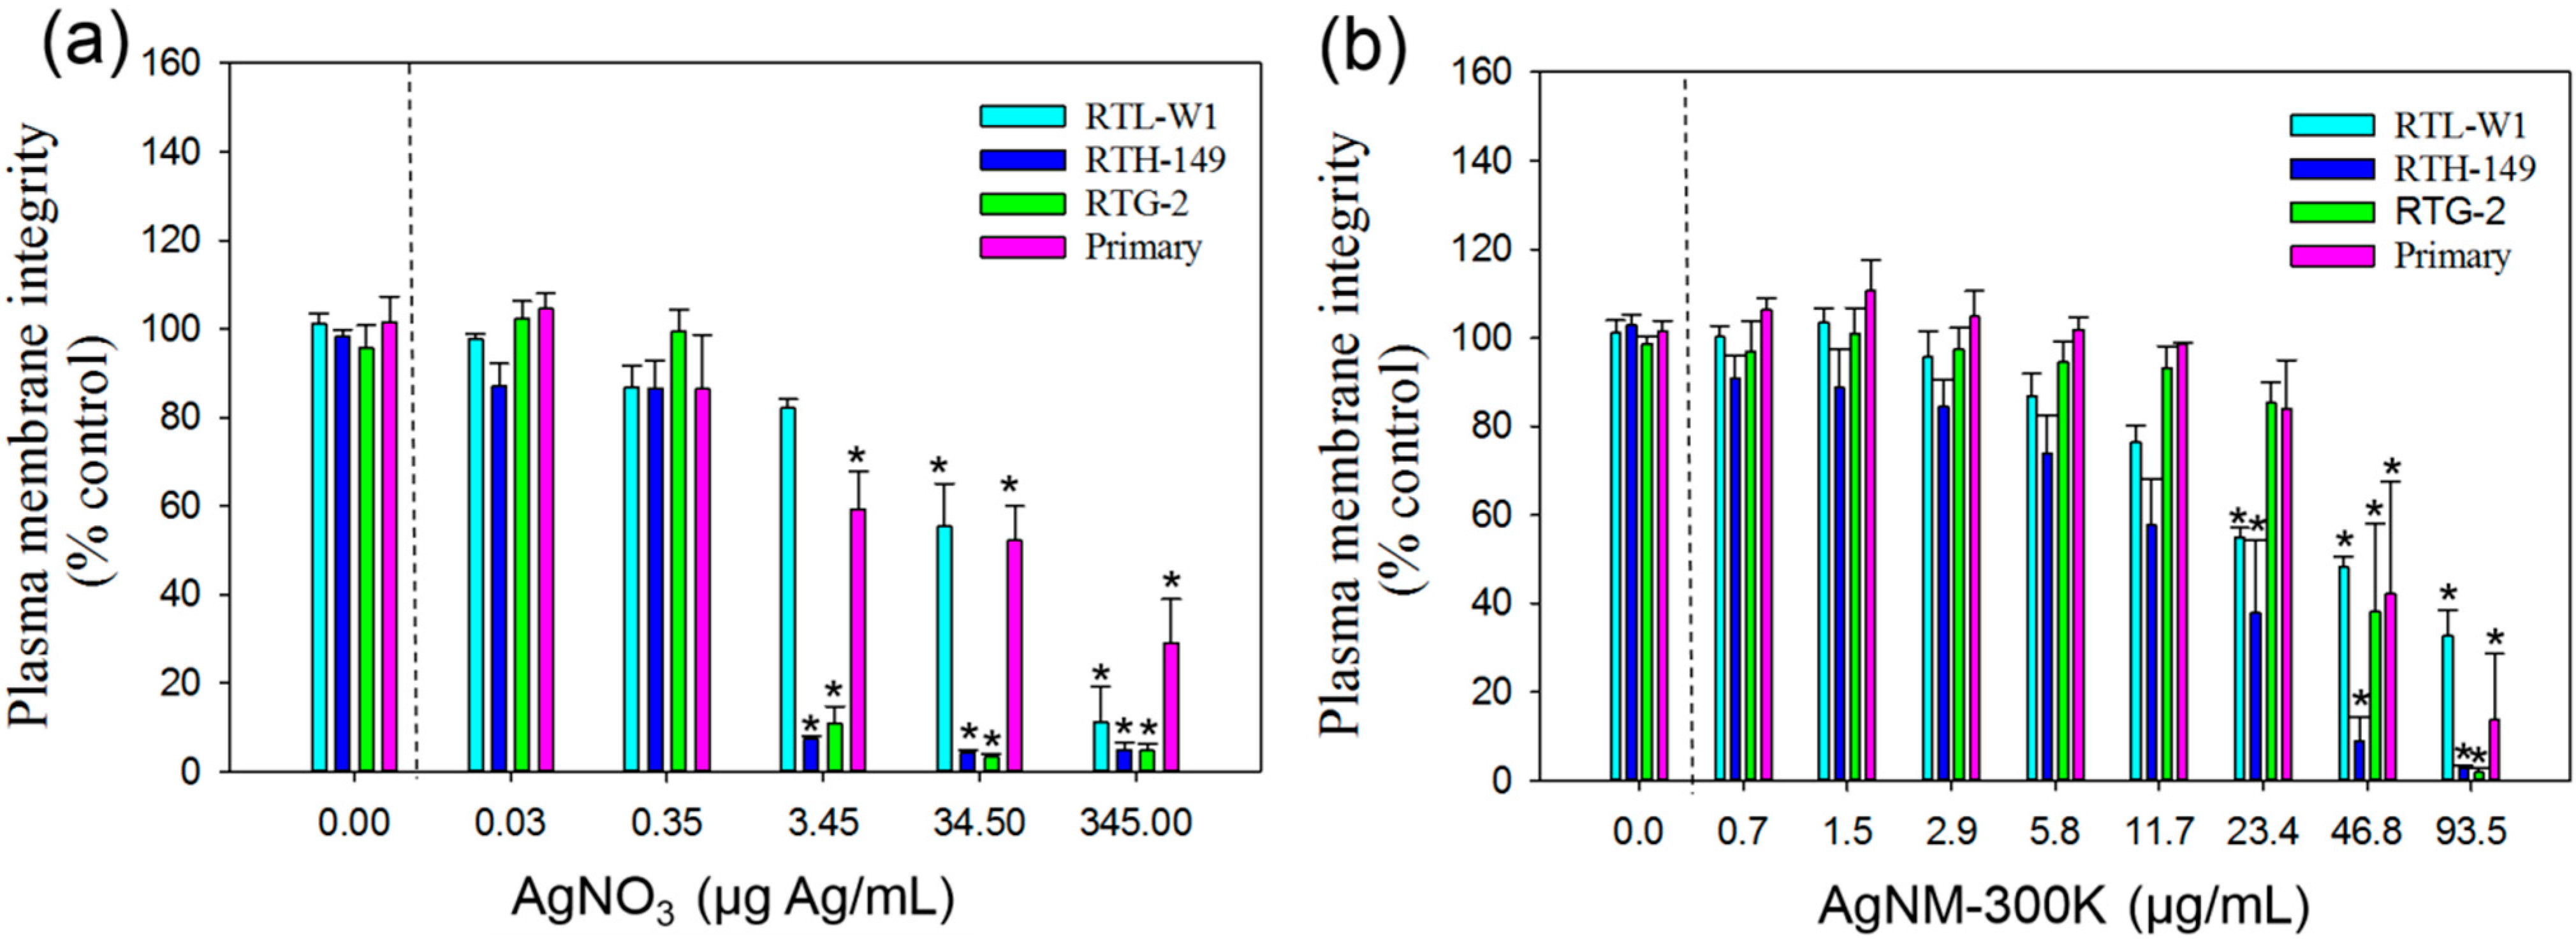
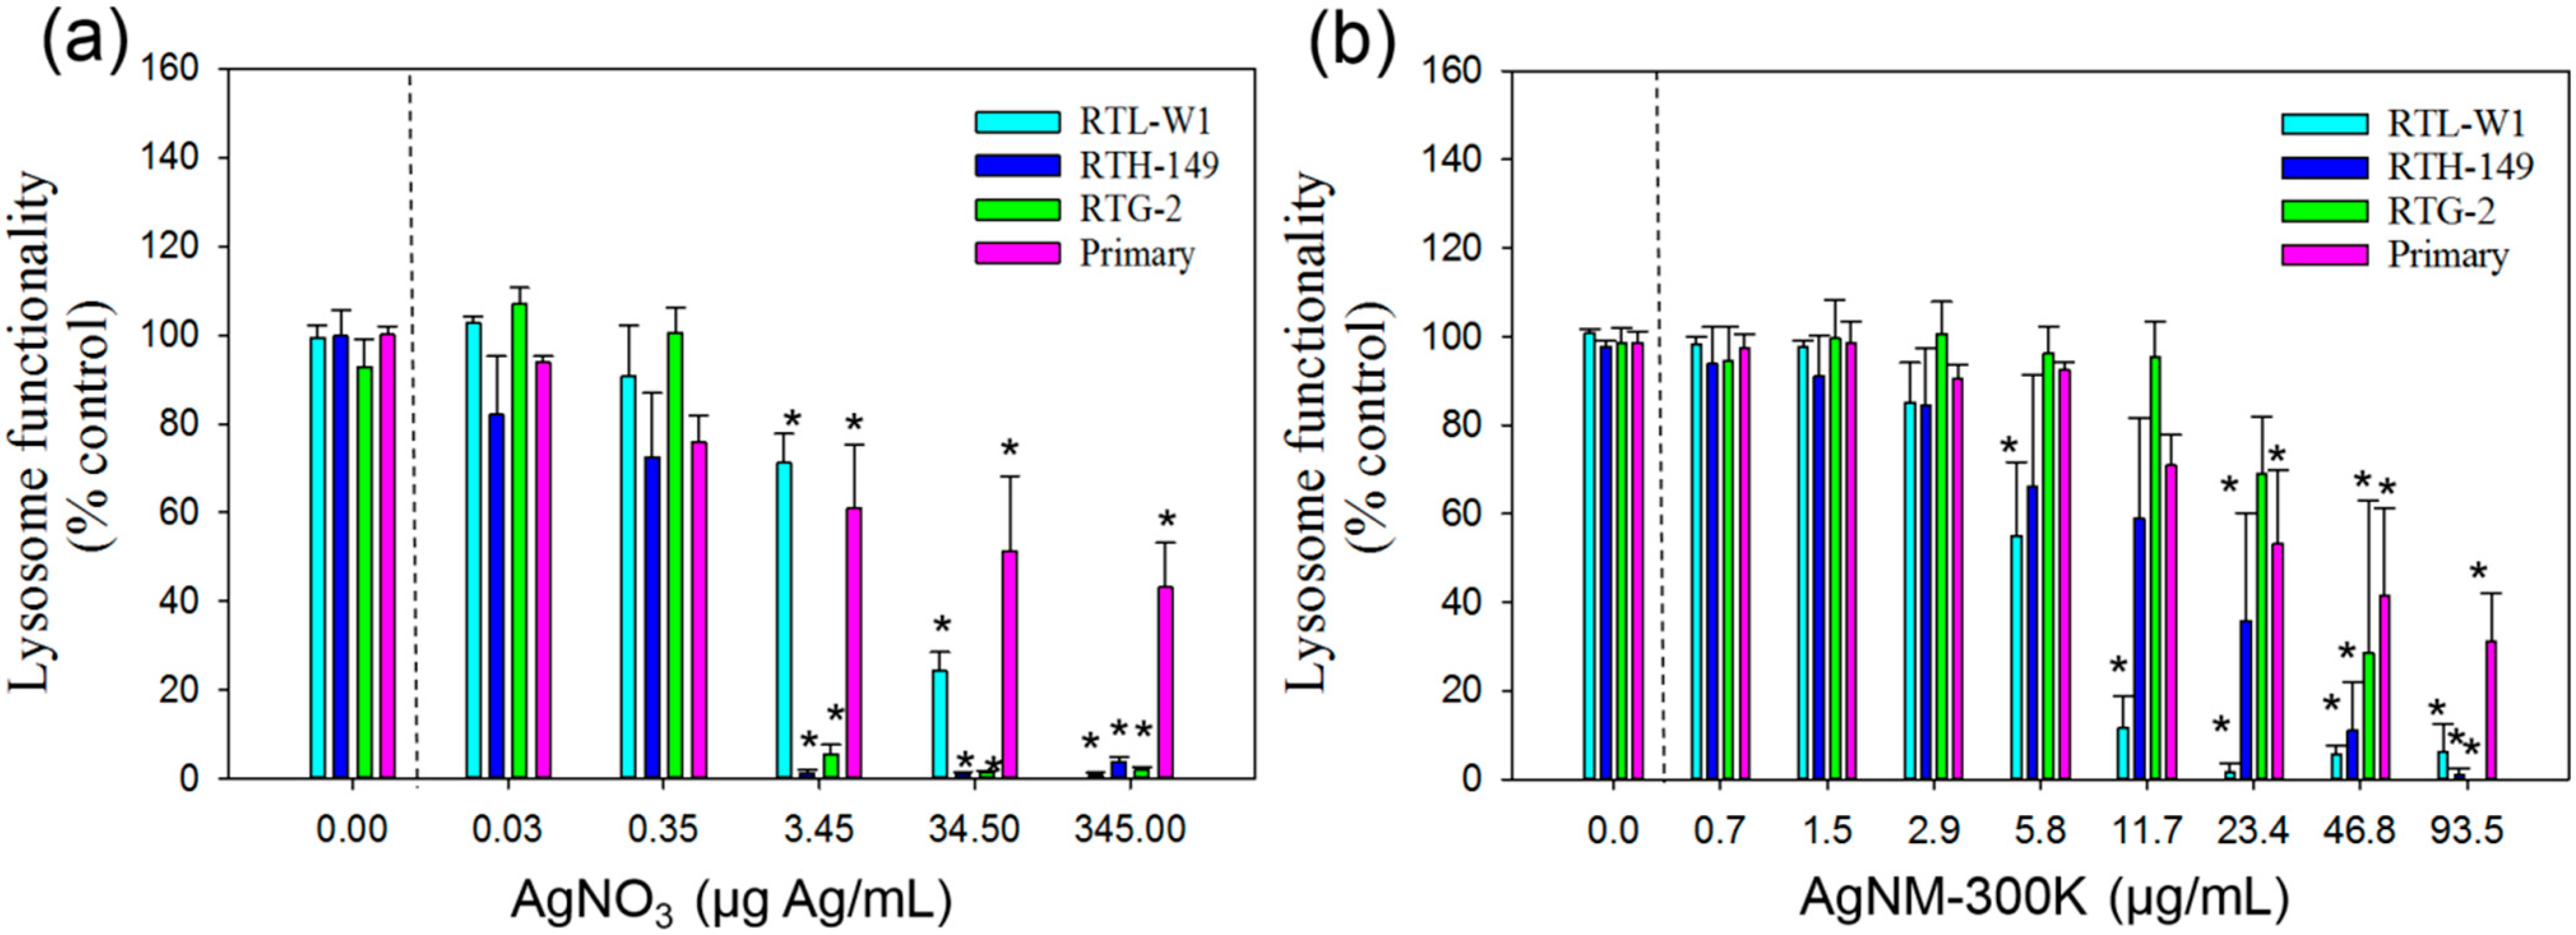
| RTL-W1 | 11 | 75.9 | 32.2 | 15.9 | 10.9 | 10.7 | |
| RTH-149 | 1.1 | 19.8 | 1.4 | 21.8 | 0.4 | 24.9 | |
| RTG-2 | 2.8 | 41.7 | 1.3 | 43.1 | 1.0 | 37.2 | |
| Primary hepatocytes | 2.0 | 30.6 | 2.7 | 37.7 | 3.8 | 45.2 | |
3.3.2. CFDA-AM Assay

3.3.3. Neutral Red Uptake Assay

4. Discussion
5. Conclusions
Supplementary Files
Supplementary File 1Acknowledgments
Author Contributions
Conflicts of Interest
References
- Woodrow Wilson Database, 2014. Nanotechnology consumer product inventory. Woodrow Wilson International Centre for Scholars. Available online: http://www.nanotechproject.org/cpi/ website (accessed on 10 October 2014).
- Mueller, N.C.; Nowack, B. Exposure modeling of engineered nanoparticles in the environment. Environ. Sci. Technol. 2008, 42, 4447–4453. [Google Scholar] [CrossRef] [PubMed]
- Benn, T.M.; Westerhoff, P. Nanoparticle silver released into water from commercially available sock fabrics. Environ. Sci. Technol. 2008, 42, 4133–4139. [Google Scholar] [CrossRef] [PubMed]
- Geranio, L.; Heuberger, M.; Nowack, B. The behavior of silver nanotextiles during washing. Environ. Sci. Technol. 2009, 43, 8113–8118. [Google Scholar] [CrossRef] [PubMed]
- Kaegi, R.; Sinnet, B.; Zuleeg, S.; Hagendorfer, H.; Mueller, E.; Vonbank, R.; Boller, M.; Burkhardt, M. Release of silver nanoparticles from outdoor facades. Environ. Pollut. 2010, 158, 2900–2905. [Google Scholar] [CrossRef] [PubMed]
- Fabrega, J.; Luoma, S.N.; Tyler, C.R.; Galloway, T.S.; Lead, J.R. Silver nanoparticles: Behaviour and effects in the aquatic environment. Environ. Int. 2011, 37, 517–531. [Google Scholar] [CrossRef] [PubMed]
- Gottschalk, F.; Kost, E.; Nowack, B. Engineered nanomaterials in water and soils: A risk quantification based on probabilistic exposure and effect modeling. Environ. Toxicol. Chem. 2013, 32, 1278–1287. [Google Scholar] [CrossRef] [PubMed]
- Wood, C.M.; Hogstrand, C.; Galvez, F.; Munger, R.S. The physiology of waterborne silver toxicity in freshwater rainbow trout (Oncorhynchus mykiss): 1. The effects of ionic Ag+. Aquat. Toxicol. 1996, 35, 93–109. [Google Scholar] [CrossRef]
- Hogstrand, C.; Galvez, F.; Wood, C.M. Toxicity, silver accumulation and metallothionein induction in freshwater rainbow trout during exposure to different silver salts. Environ. Toxicol. Chem. 1996, 15, 1102–1108. [Google Scholar] [CrossRef]
- Bilberg, K.; Hovgaard, M.B.; Besenbacher, F.; Baatrup, E. In vivo toxicity of silver nanoparticles and silver ions in zebra fish (Danio rerio). J. Toxicol. 2012. [Google Scholar] [CrossRef]
- Choi, J.E.; Kim, S.; Ahn, J.H.; Youn, P.; Kang, J.S.; Park, K.; Yi, J.; Ryu, D.Y. Induction of oxidative stress and apoptosis by silver nanoparticles in the liver of adult zebra fish. Aquat. Toxicol. 2010, 100, 151–159. [Google Scholar] [CrossRef] [PubMed]
- Griffitt, R.J.; Luo, J.; Gao, J.; Bonzongo, J.-C.; Barber, D.S. Effects of particle composition and species on toxicity of metallic nanomaterials in aquatic organisms. Environ. Toxicol. Chem. 2008, 27, 1972–1978. [Google Scholar] [CrossRef] [PubMed]
- Chae, Y.J.; Pham, C.H.; Lee, J.; Bae, E.; Yi, J.; Gu, M.B. Evaluation of the toxic impact of silver nanoparticles on Japanese medaka (Oryzias latipes). Aquat. Toxicol. 2009, 94, 320–327. [Google Scholar] [CrossRef] [PubMed]
- Wu, Y.; Zhou, Q.; Li, H.; Liu, W.; Wang, T.; Jiang, G. Effects of silver nanoparticles on the development and histopathology biomarkers of Japanese medaka (Oryzias latipes) using the partial-life test. Aquat. Toxicol. 2010, 100, 160–167. [Google Scholar] [CrossRef] [PubMed]
- Griffitt, R.J.; Brown-Peterson, N.J.; Savin, D.A.; Manning, C.S.; Boube, I.; Ryan, R.A.; Brouwer, M. Effects of chronic nanoparticulate silver exposure to adult and juvenile sheepshead minnows (Cyprinodon variegatus). Environ. Toxicol. Chem. 2012, 31, 160–167. [Google Scholar] [CrossRef] [PubMed]
- Johari, S.A.; Kalbassi, M.R.; Soltani, M.; Yu, I.J. Toxicity comparison of colloidal silver nanoparticles in various life stages of rainbow trout (Oncorhynchus mykiss). Iran. J. Fish. Sci. 2013, 12, 76–95. [Google Scholar]
- EU Directive 67/548/EEC on the classification, packaging and labelling of dangerous substances of 27 June 1967 on the approximation of laws, regulations and administrative provisions relating to the classification, packaging and labelling of dangerous substances. Available online: http://eur-lex.europa.eu/homepage.html (accessed on 15 November 2014).
- Regulation (EC) No 1272/2008 on the classification, labelling and packaging of substances and mixtures; amending and repealing Directives 67/548/EEC and 1999/45/EC, and amending Regulation (EC) No 1907/2006. EU directive 2008/112/EC amending Council Directives 76/768/EEC, 88/378/EEC, 1999/13/EC and Directives 2000/53/EC, 2002/96/EC and 2004/42/EC in order to adapt them to Regulation (EC) No 1272/2008 on classification, labelling and packaging of substances and mixtures. Available online: http://eurlex.europa.eu/legalcontent/EN/TXT/?qid=1401782728680&uri=CELEX:32008R1272 (accessed on 15 November 2014).
- Fernández, D.; García-Gómez, C.; Babín, M. In vitro evaluation of cellular responses induced by ZnO nanoparticles, zinc ions and bulk ZnO in fish cells. Sci. Total Environ. 2013, 452–453, 262–274. [Google Scholar] [PubMed]
- Song, L.; Connolly, M.; Fernández-Cruz, M.L.; Vijver, M.G.; Fernández, M.; Conde, E.; de Snoo, G.R.; Peijnenburg, W.J.; Navas, J.M. Species-specific toxicity of copper nanoparticles among mammalian and piscine cell lines. Nanotoxicology 2014, 8, 383–393. [Google Scholar] [CrossRef] [PubMed]
- Vo, N.T.; Bufalino, M.R.; Hartlen, K.D.; Kitaev, V.; Lee, L.E. Cytotoxicity evaluation of silica nanoparticles using fish cell lines. In Vitro Cell Dev. Biol. Anim. 2014, 50, 427–438. [Google Scholar] [CrossRef] [PubMed]
- Taju, G.; Abdul-Majeed, S.; Nambi, K.S.; Sahul-Hameed, A.S. In vitro assay for the toxicity of silver nanoparticles using heart and gill cell lines of Catla catla and gill cell line of Labeo rohita. Comp. Biochem. Physiol. Pt. C 2014, 161, 41–52. [Google Scholar]
- Commission Regulation (EC) No 134/2009 amending Regulation (EC) No. 1907/2006 of the European Parliament and of the Council on the Registration, Evaluation, Authorisation and Restriction of Chemicals (REACH) as regards Annex XI. Available online: http://eur-lex.europa.eu/legalcontent/EN/TXT/?qid=1401782624095&uri=CELEX:32009R0134 (accessed on 15 November 2014).
- Salari-Joo, H.; Kalbassi, M.R.; Yu, I.J.; Lee, J.H.; Johari, S.A. Bioaccumulation of silver nanoparticles in rainbow trout (Oncorhynchus mykiss): Influence of concentration and salinity. Aquat. Toxicol. 2013, 140–141, 398–406. [Google Scholar] [PubMed]
- Wu, Y.; Zhou, Q. Silver nanoparticles cause oxidative damage and histological changes in medaka (Oryzias latipes) after 14 days of exposure. Environ. Toxicol. Chem. 2013, 32, 165–173. [Google Scholar] [CrossRef] [PubMed]
- Scown, T.M.; Santos, E.M.; Johnston, B.D.; Gaiser, B.; Baalousha, M.; Mitov, S.; Lead, J.R.; Stone, V.; Fernandes, T.F.; Jepson, M.; et al. Effects of aqueous exposure to silver nanoparticles of different sizes in rainbow trout. Toxicol. Sci. 2010, 115, 521–534. [Google Scholar] [CrossRef] [PubMed]
- Kermanizadeh, A.; Gaiser, B.K.; Ward, M.B.; Stone, V. Primary human hepatocytes versus hepatic cell line: assessing their suitability for in vitro nanotoxicology. Nanotoxicology 2013, 7, 1255–1271. [Google Scholar] [CrossRef] [PubMed]
- OECD-WPMN, Series on the Safety of Manufactured Nanomaterials, List of manufactured nanomaterials and list of endpoints for phase one of the OECD testing programme, No. 6-ENV/JM/MONO (2008)13/REV, Organisation for Economic Co-operation and Development, Paris, France. Available online: http://search.oecd.org/officialdocuments/publicdisplaydocumentpdf/?cote=ENV/JM/MONO(2008)13/REV&docLanguage=En (accessed on 20 November 2014).
- Klein, C.; Comero, S.; Stahlmecke, B.; Romazanov, J.; Kuhlbusch, T.; van Doren, E.; de Temmerman, P.-J.; Mast, J.; Wick, P.; Krug, H.; et al. NM-Series of Representative Manufactured Nanomaterials: NM-300 Silver Characterisation, Stability, Homogeneity; Publications Office of the European Union: City of Luxembourg, Luxembourg, 2011. [Google Scholar]
- Malhão, F.; Urbatzka, R.; Navas, J.M.; Cruzeiro, C.; Monteiro, R.A.; Rocha, E. Cytological, immunocytochemical, ultrastructural and growth characterization of the rainbow trout liver cell line RTL-W1. Tissue Cell. 2013, 45, 159–174. [Google Scholar] [CrossRef] [PubMed]
- Lee, L.E.; Clemons, J.H.; Bechtel, D.G.; Caldwell, S.J.; Han, K.B.; Pasitschniak-Arts, M.; Mosser, D.D.; Bols, N.C. Development and characterization of a rainbow trout liver cell line expressing cytochrome P450-dependent monooxygenase activity. Cell. Biol. Toxicol. 1993, 9, 279–294. [Google Scholar] [CrossRef] [PubMed]
- Fryer, L.; McCain, B.; Leong, J. A cell line derived from Rainbow Trout (Salmo gairdneri) Hepatoma. Fish Pathol. 1981, 15, 193–200. [Google Scholar] [CrossRef]
- Wolf, K.; Quimby, M.C. Established eurythermic line of fish cells in vitro. Science 1962, 135, 1065–1066. [Google Scholar] [CrossRef] [PubMed]
- Mommsen, T.P.; Moon, T.W.; Walsh, P.J. Hepatocytes: Isolation, maintenance and utilization. In Biochemistry and Molecular Biology of Fishes: Analytical techniques; Hochachka, P.W., Mommsen, T.P, Eds.; Elsevier: Amsterdam, Netherlands, 1994; Volume 3, pp. 355–373. [Google Scholar]
- Segner, H. Isolation and primary culture of teleost hepatocytes. Comp. Biochem. Physiol. Pt. A 1998, 120, 71–81. [Google Scholar] [CrossRef]
- Navas, J.M.; Segner, H. Vitellogenin synthesis in primary cultures of fish liver cells as endpoint for in vitro screening of the (anti)estrogenic activity of chemical substances. Aquatic Toxicol. 2006, 80, 1–22. [Google Scholar] [CrossRef]
- Massarsky, A.; Abraham, R.; Nguyen, K.C.; Rippstein, P.; Tayabali, A.F.; Trudeau, V.L.; Moon, T.W. Nanosilver cytotoxicity in rainbow trout (Oncorhynchus mykiss) erythrocytes and hepatocytes. Comp. Biochem. Physiol. Pt. C 2014, 159, 10–21. [Google Scholar]
- Dayeh, V.R.; Schirmer, K.; Lee, L.E.J.; Bols, N.C. Rainbow trout gill cell line microplate cytotoxicity test. In Small-Scale Freshwater Toxicity Investigations; Blaise, C., Férard, J.F., Eds.; Springer Netherlands: Berlin, Germany, 2005; Volume 1, pp. 473–503. [Google Scholar]
- Han, X.; Gelein, R.; Corson, N.; Wade-Mercer, P.; Jiang, J.; Biswas, P.; Finkelstein, J.N.; Elder, A.; Oberdörster, G. Validation of an LDH assay for assessing nanoparticle toxicity. Toxicology 2011, 287, 99–104. [Google Scholar] [CrossRef] [PubMed]
- Kroll, A.; Pillukat, M.H.; Hahn, D.; Schnekenburger, J. Interference of engineered nanoparticles with in vitro toxicity assays. Arch. Toxicol. 2012, 86, 1123–1136. [Google Scholar] [CrossRef] [PubMed]
- Samberg, M.E.; Oldenburg, S.J.; Monteiro-Riviere, N.A. Evaluation of silver nanoparticle toxicity in skin in vivo and keratinocytes in vitro. Environ. Health Perspect. 2010, 118, 407–413. [Google Scholar] [CrossRef] [PubMed]
- Wörle-Knirsch, J.M.; Pulskamp, K.; Krug, H.F. Oops they did it again! Carbon nanotubes hoax scientists in viability assays. Nano Lett. 2006, 6, 1261–1268. [Google Scholar] [CrossRef] [PubMed]
- Grosell, M.; Hogstrand, C.; Wood, C.M.; Hansen, H.J. A nose-to-nose comparison of the physiological effects of exposure to ionic silver versus silver chloride in the European eel (Anguilla anguilla) and the rainbow trout (Oncorhynchus mykiss). Aquat. Toxicol. 2000, 48, 327–342. [Google Scholar] [CrossRef] [PubMed]
- George, S.; Lin, S.; Ji, Z.; Thomas, C.R.; Li, L.; Mecklenburg, M.; Meng, H.; Wang, X.; Zhang, H.; Xia, T.; Hohman, J.N.; Lin, S.; Zink, J.I.; Weiss, P.S.; Nel, A.E. Surface defects on plate-shaped silver nanoparticles contribute to its hazard potential in a fish gill cell line and zebra fish embryos. ACS Nano 2012, 6, 3745–3759. [Google Scholar] [CrossRef] [PubMed]
- Yue, Y.; Behra, R.; Sigg, L.; Fernández-Freire, P.; Pillai, S.; Schirmer, K. Toxicity of silver nanoparticles to a fish gill cell line: Role of medium composition. Nanotoxicology 2015, 9, 54–63. [Google Scholar] [CrossRef] [PubMed]
- Fernández-Cruz, M.L.; Lammel, T.; Connolly, M.; Conde, E.; Barrado, A.I.; Derick, S.; Perez, Y.; Fernandez, M.; Furger, C.; Navas, J.M. Comparative cytotoxicity induced by bulk and nanoparticulated ZnO in the fish and human hepatoma cell lines PLHC-1 and Hep G2. Nanotoxicology 2013, 7, 935–952. [Google Scholar] [CrossRef] [PubMed]
- Asghari, S.; Johari, S.A.; Lee, J.H.; Kim, Y.S.; Jeon, Y.B.; Choi, H.J.; Moon, M.C.; Yu, I.J. Toxicity of various silver nanoparticles compared to silver ions in Daphnia magna. J. Nanobiotechnol. 2012, 10, 14. [Google Scholar] [CrossRef]
- Lubick, N. Nanosilver toxicity: Ions, nanoparticles—Or both? Environ. Sci. Technol. 2008. [Google Scholar] [CrossRef]
- Farkas, J.; Christian, P.; Urrea, J.A.; Roos, N.; Hassellöv, M.; Tollefsen, K.E.; Thomas, K.V. Effects of silver and gold nanoparticles on rainbow trout (Oncorhynchus mykiss) hepatocytes. Aquat. Toxicol. 2010, 96, 44–52. [Google Scholar] [CrossRef] [PubMed]
- Dayeh, V.R.; Lynn, D.H.; Bols, N.C. Cytotoxicity of metals common in mining effluent to rainbow trout cell lines and to the ciliated protozoan, Tetrahymena thermophila. Toxicol. Vitro 2005, 19, 399–410. [Google Scholar] [CrossRef]
- Kermanizadeh, A.; Vranic, S.; Boland, S.; Moreau, K.; Baeza-Squiban, A.; Gaiser, B.K.; Andrzejczuk, L.A.; Stone, V. An in vitro assessment of panel of engineered nanomaterials using a human renal cell line: Cytotoxicity, pro-inflammatory response, oxidative stress and genotoxicity. BMC Nephrol. 2013. [Google Scholar] [CrossRef]
- Kalbassi, M.R.; Salari-joo, H.; Johari, A. Toxicity of silver nanoparticles in aquatic ecosystems: Salinity as the main cause in reducing toxicity. Iran. J. Toxicol. 2011, 5, 436–443. [Google Scholar]
- Gaiser, B.K.; Hirn, S.; Kermanizadeh, A.; Kanase, N.; Fytianos, K.; Wenk, A.; Haberl, N.; Brunelli, A.; Kreyling, W.G.; Stone, V. Effects of silver nanoparticles on the liver and hepatocytes in vitro. Toxicol. Sci. 2013, 131, 537–547. [Google Scholar] [CrossRef] [PubMed]
- Stern, S.T.; Adiseshaiah, P.P.; Crist, R.M. Autophagy and lysosomal dysfunction as emerging mechanisms of nanomaterial toxicity. Part. Fibre. Toxicol. 2012. [Google Scholar] [CrossRef]
- Mothersill, C.; Austin, B. In Vitro Methods in Aquatic Ecotoxicology; Springer and Praxis Publishing: Chichester, UK, 2003; pp. 381–384. [Google Scholar]
- Castano, A.; Bols, N.; Braunbeck, T.; Dierickx, P.; Halder, M.; Isomaa, B.; Kawahara, K.; Lee, L.E.J.; Mothersill, C.; Pärt, P.; et al. The use of fish cells in ecotoxicology. Report and recommendations of the ECVAM workshop 47. Atla-Altern. Lab Anim. 2003, 31, 317–351. [Google Scholar]
- Segner, H.; Lenz, D. Cytotoxicity assays with the rainbow trout R1 cell line. Toxicol. Vitro 1993, 7, 537–540. [Google Scholar] [CrossRef]
© 2015 by the authors; licensee MDPI, Basel, Switzerland. This article is an open access article distributed under the terms and conditions of the Creative Commons Attribution license (http://creativecommons.org/licenses/by/4.0/).
Share and Cite
Connolly, M.; Fernandez-Cruz, M.-L.; Quesada-Garcia, A.; Alte, L.; Segner, H.; Navas, J.M. Comparative Cytotoxicity Study of Silver Nanoparticles (AgNPs) in a Variety of Rainbow Trout Cell Lines (RTL-W1, RTH-149, RTG-2) and Primary Hepatocytes. Int. J. Environ. Res. Public Health 2015, 12, 5386-5405. https://doi.org/10.3390/ijerph120505386
Connolly M, Fernandez-Cruz M-L, Quesada-Garcia A, Alte L, Segner H, Navas JM. Comparative Cytotoxicity Study of Silver Nanoparticles (AgNPs) in a Variety of Rainbow Trout Cell Lines (RTL-W1, RTH-149, RTG-2) and Primary Hepatocytes. International Journal of Environmental Research and Public Health. 2015; 12(5):5386-5405. https://doi.org/10.3390/ijerph120505386
Chicago/Turabian StyleConnolly, Mona, Maria-Luisa Fernandez-Cruz, Alba Quesada-Garcia, Luis Alte, Helmut Segner, and Jose M. Navas. 2015. "Comparative Cytotoxicity Study of Silver Nanoparticles (AgNPs) in a Variety of Rainbow Trout Cell Lines (RTL-W1, RTH-149, RTG-2) and Primary Hepatocytes" International Journal of Environmental Research and Public Health 12, no. 5: 5386-5405. https://doi.org/10.3390/ijerph120505386