This is the first study showing that male and female active commuting behaviors of walking and cycling in a metropolitan Nordic setting can be divided into three different modality groups (single-mode walking and cycling commuters, respectively, and dual-mode commuters) and that these groups have both important similarities and differences in their behaviors. For example, the median trip durations are rather stable for these groups and for gender (25–35 min per trip), when not considering the dual mode group when cycling, whereas the trip frequency varies greatly over the year depending on the modality. While the single-mode pedestrians’ median trip frequency is high and stable over the year, the cyclists’ median trip frequency is low or non-existent during the period of November–March. This overall cycling scheme refers to both gender and single-mode as well as dual-mode groups. However, the dual-mode commuters replace cycling with walking during the winter period. Note that, as indicated in
Table 1, the temperature and precipitation patterns for the four indicator months during the year prior to when the respondents answered the questionnaire resembled the average values in the region for a longer period of time. Thus, both the seasonality in frequency of trips per week in different months and the high levels of the total number of active commuting trips over the year, ranging between 231 and 389 for the different modality groups, are most likely a close reflection of the normal pattern of active commuting in this region.
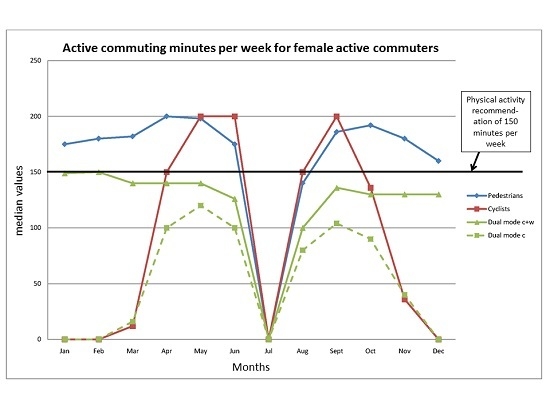
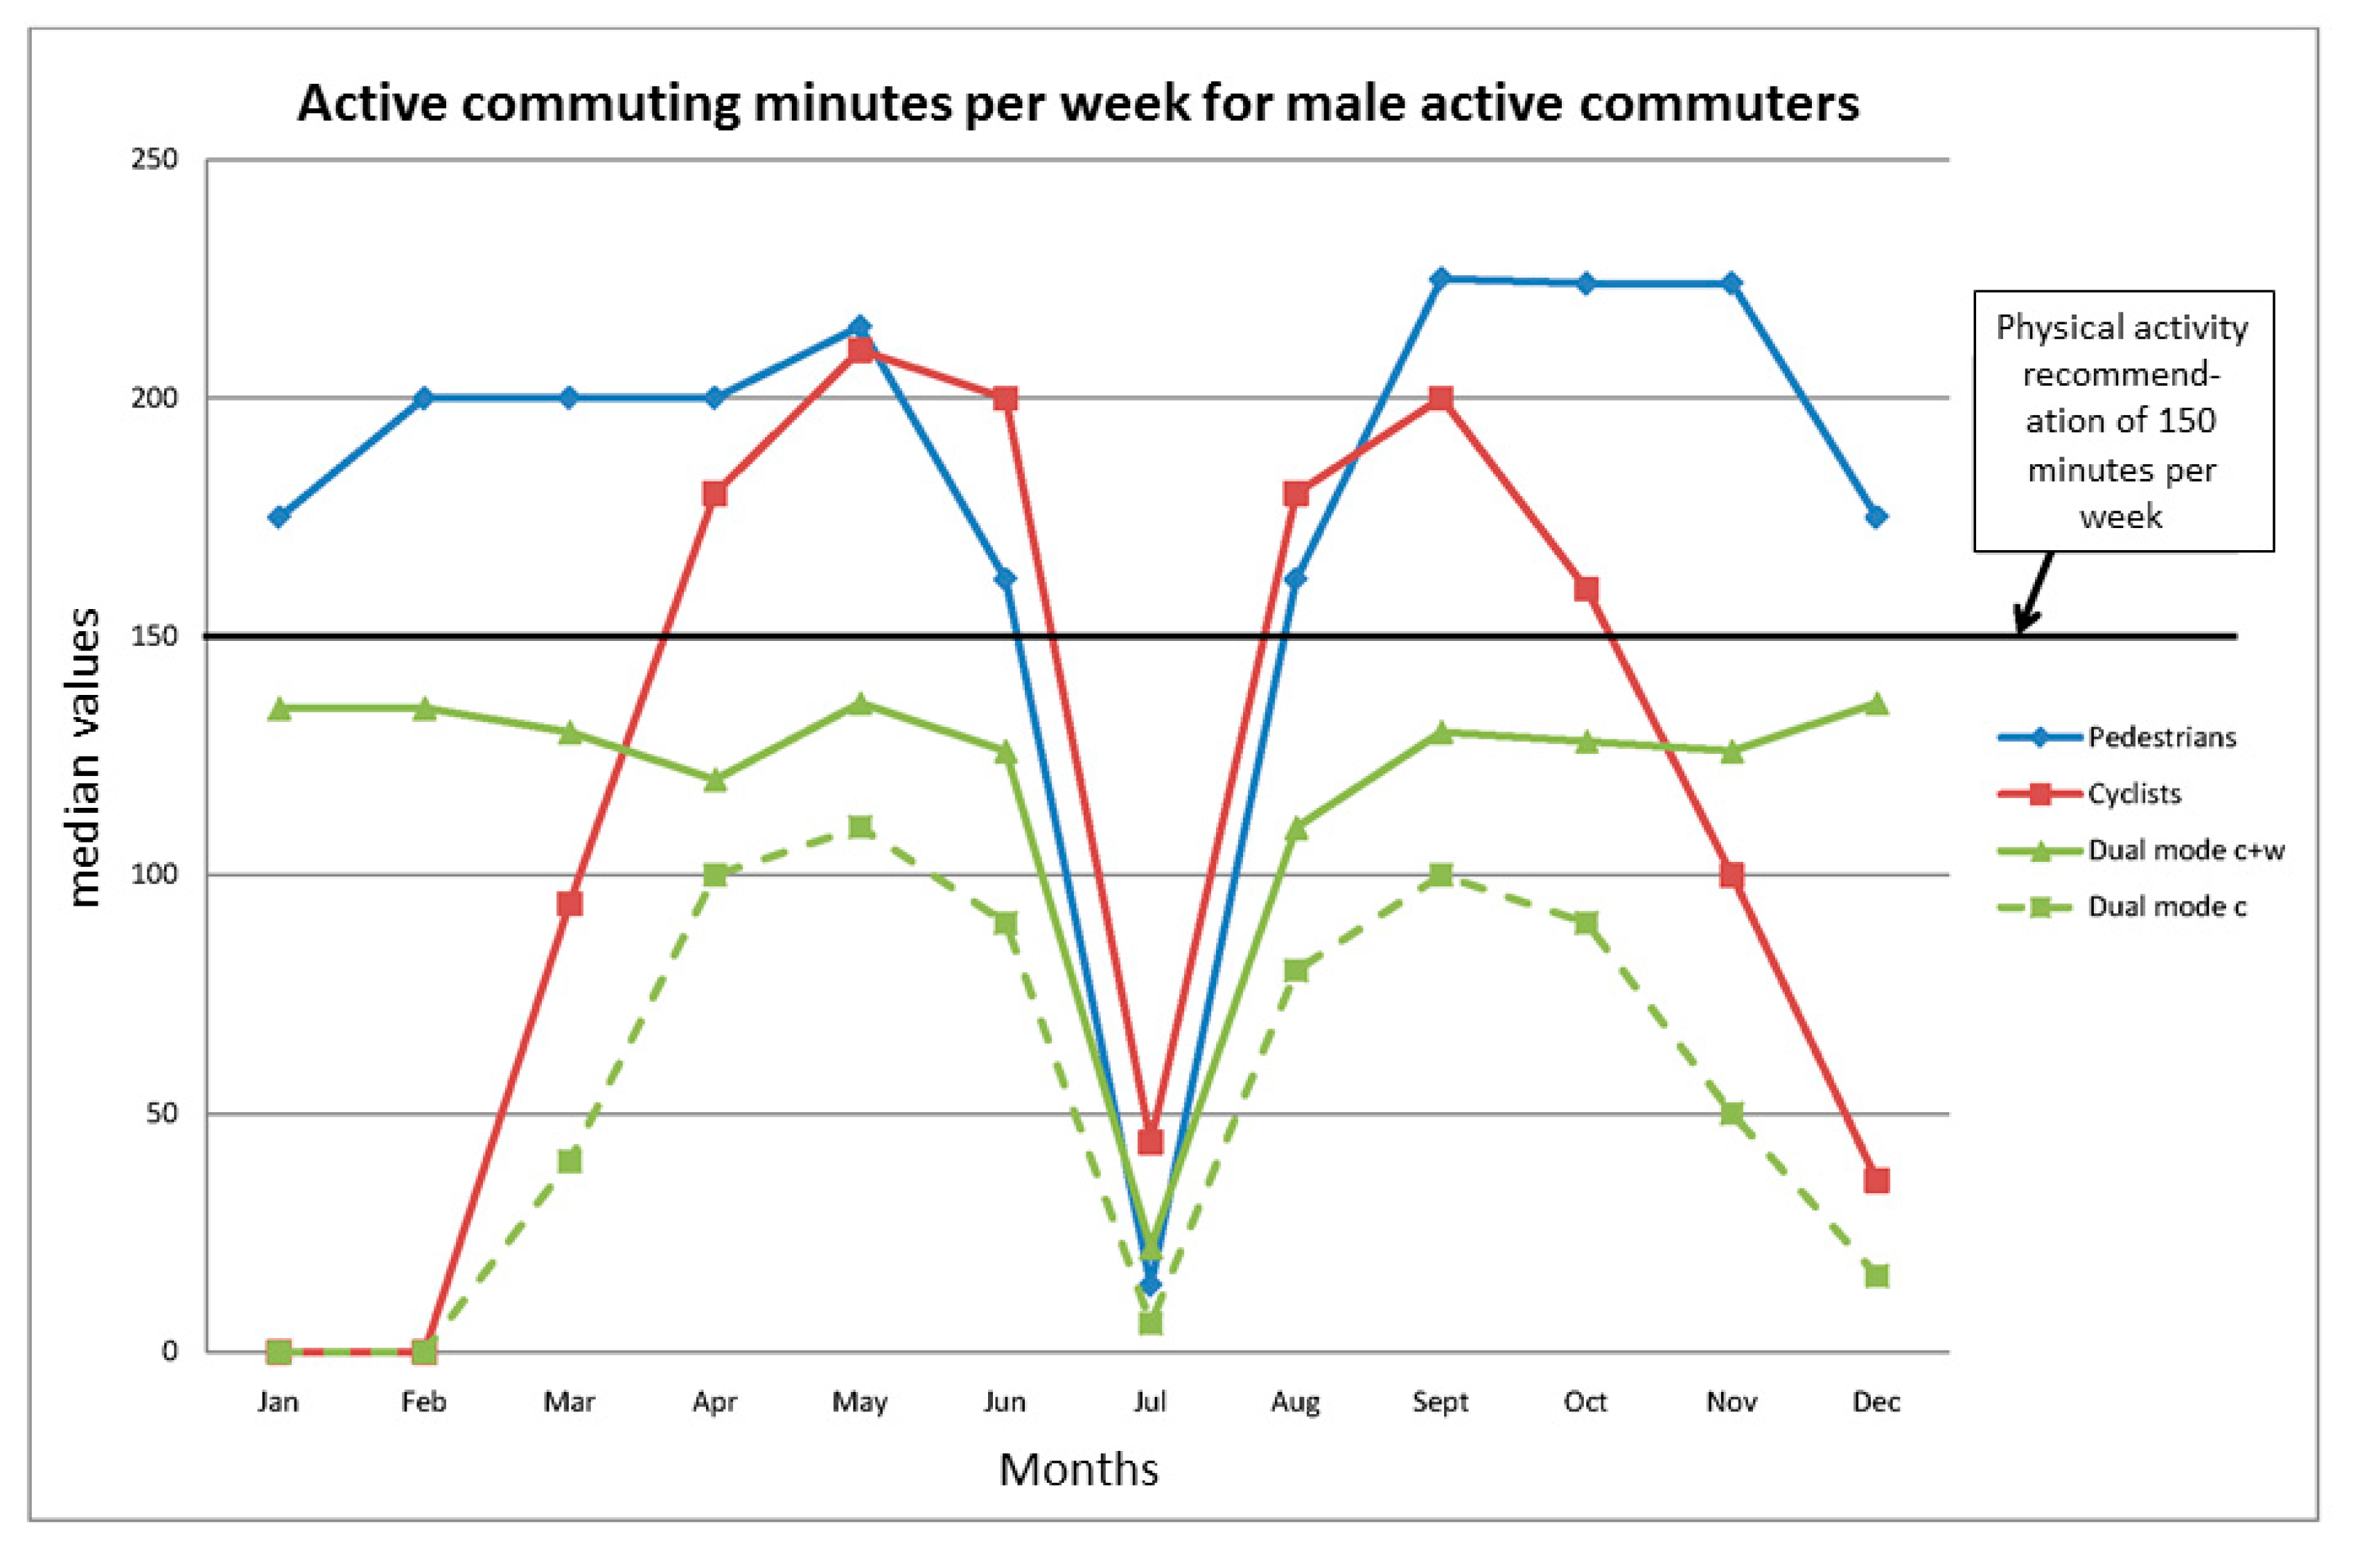
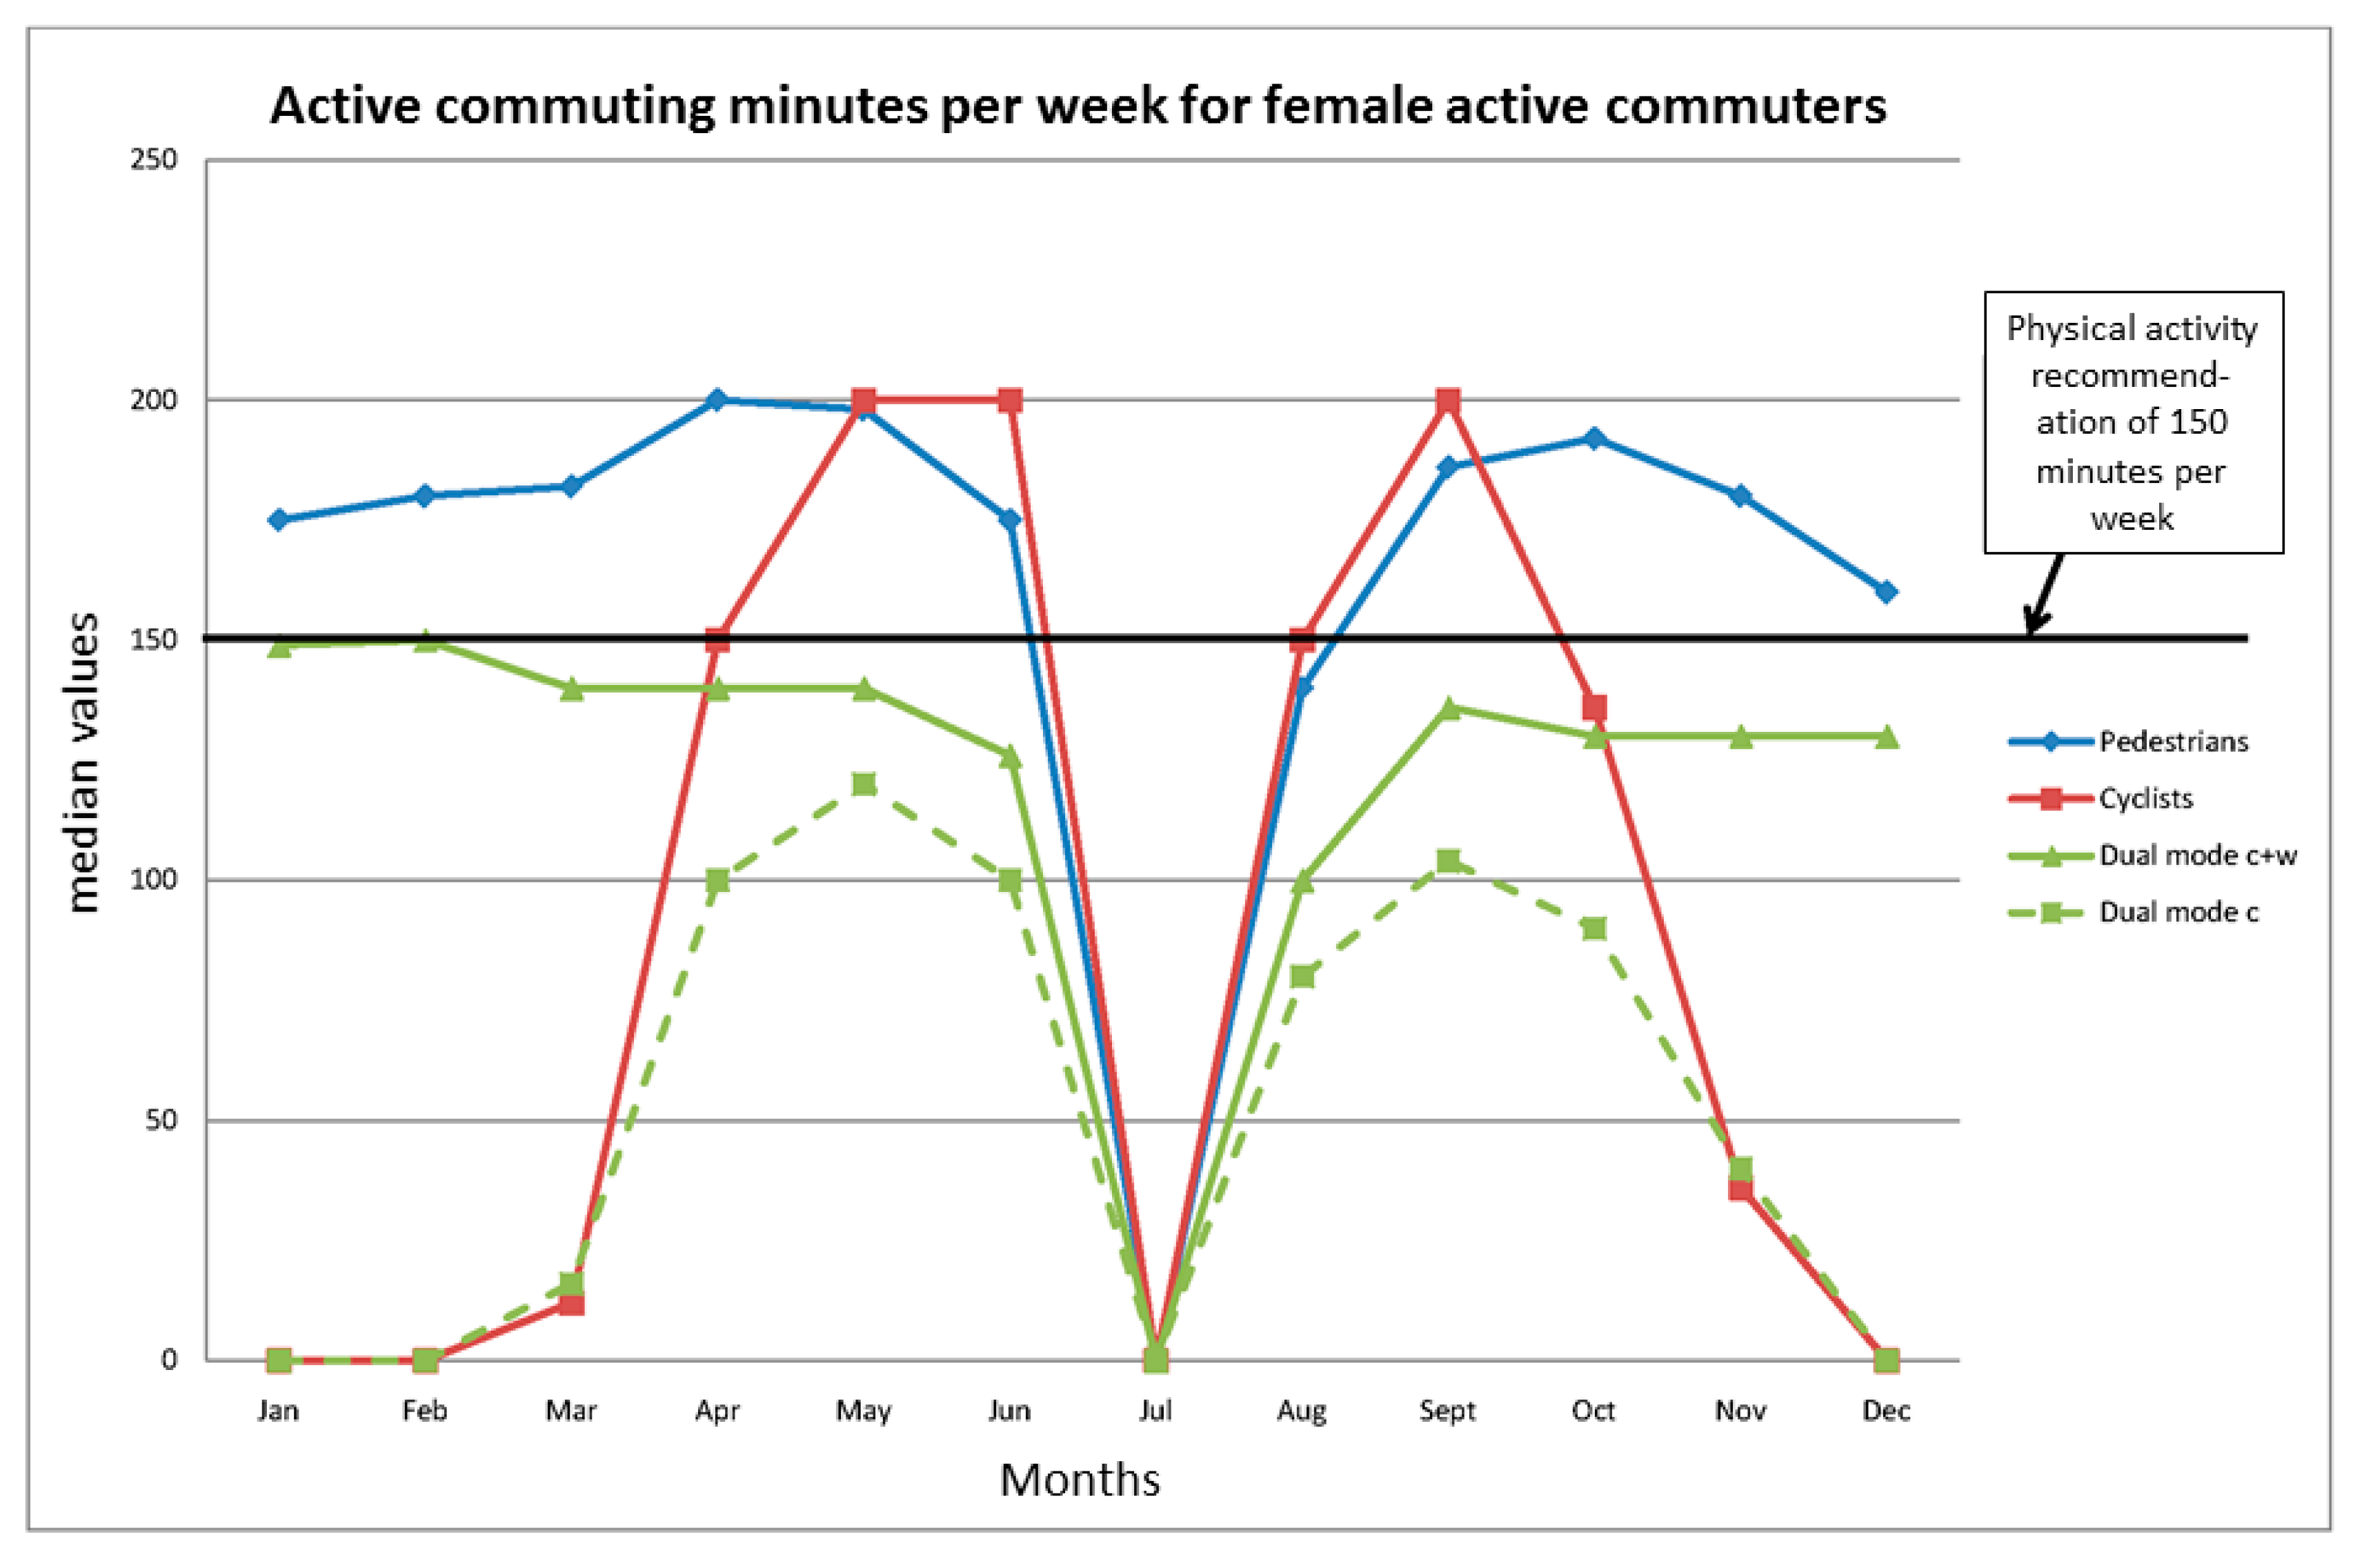
The results regarding the extent to which the different modality groups and genders meet the minimal physical activity levels (150 minutes) per week with their active commuting behaviors indicate that this is the case for the single-mode pedestrians and that the dual-mode commuters are close to reaching these levels over the year, whereas this is the case during only six months of the year for the single-mode cyclists. Other results also indicate that, to a great extent, the commuting behaviors meet, or have the potential to meet, other temporal demands on physical activity for health enhancement, e.g., the minimum activity bout length of 10 min and 30 min of activity accumulated per day. A number of active commuters do also meet the optimal levels of 300 min per week during different periods of the year. Finally, the high numbers of trips per year add to the value of these behaviors from a public health perspective. These results will be discussed below.
4.1. The Metropolitan Setting As Study Area
From a public health point of view, an analysis of active commuting behaviors in a metropolitan setting is important since such urban living areas constitute one of the major human habitats globally. It is therefore clearly useful to understand the extent to which active commuting is feasible as a public health strategy in such areas. A crucial variable from this point of view is the distribution of trip distances between home and place of work or study within the population. Obviously, living and working in a small town constitutes a fundamentally different distance distribution than doing so within a metropolitan area, and this may also affect other variables, such as trip duration and frequency, and possibly velocity and the number of red-light stops.
We do not know the more precise commuting distance distribution within the studied region, but Statistics Sweden has divided Sweden into 82 functional labor markets areas, so-called LA areas, and Stockholm is the node of one of them. An LA area is defined as one or more municipalities in which no more than 20% of the workforce commutes to other municipalities. The functional labor market of Stockholm encompasses the whole of our study area and 10 neighboring municipalities with a total area of about 20,000 square km,
cf. [
16,
17]. It is apparent that, for a certain proportion of the population, many commuting distances within such a wide area are too long to be covered solely by active commuting. Another consequence of such a study area is that the behavioral distribution of active commuting distances and durations is most likely to be substantially wider than in, for example, a small city. This means that within the higher levels of durations and distances covered by the active commuters in this study, we will probably find close to the maximal part of the distribution of values for this behavior in a population perspective. This is all the more plausible because there are good reasons to believe that our study group represents a more physically fit and motivated group than the corresponding general age groups in the population.
4.2. Duration, Distance and Velocity
The median values for the durations are remarkably stable when we consider the male and female single-mode pedestrians and cyclists, as well as dual-mode commuters when they walk (range, 25–35 min). In our mind, this is an indication of rather uniform reasoning about the issue of time budget allocation for active commuting between the modality and gender groups. Interestingly, Hu
et al. [
18] noted similar active commuting durations in the metropolitan area of Tianjin, China, with a substantially greater population (9 million) than Greater Stockholm. This may be taken as an indication that the noted behaviors in this study represent more or less maximal realistic behaviors with regard to durations in a metropolitan area.
The durations reported by the participants also include stops at red lights, and possibly also other types of stops. We do not know the exact amount of time these periods of inactivity account for; however, considering that we have a variability of between 1 and 3 red-light stops and, based on inspections of stop times in GPS tracings of active commuters in Stockholm, described in Stigell and Schantz [
11], a reasonable value appears to be about 0.5–1.5 min. Thus, we see no reason why stops for red light would change the overall picture presented.
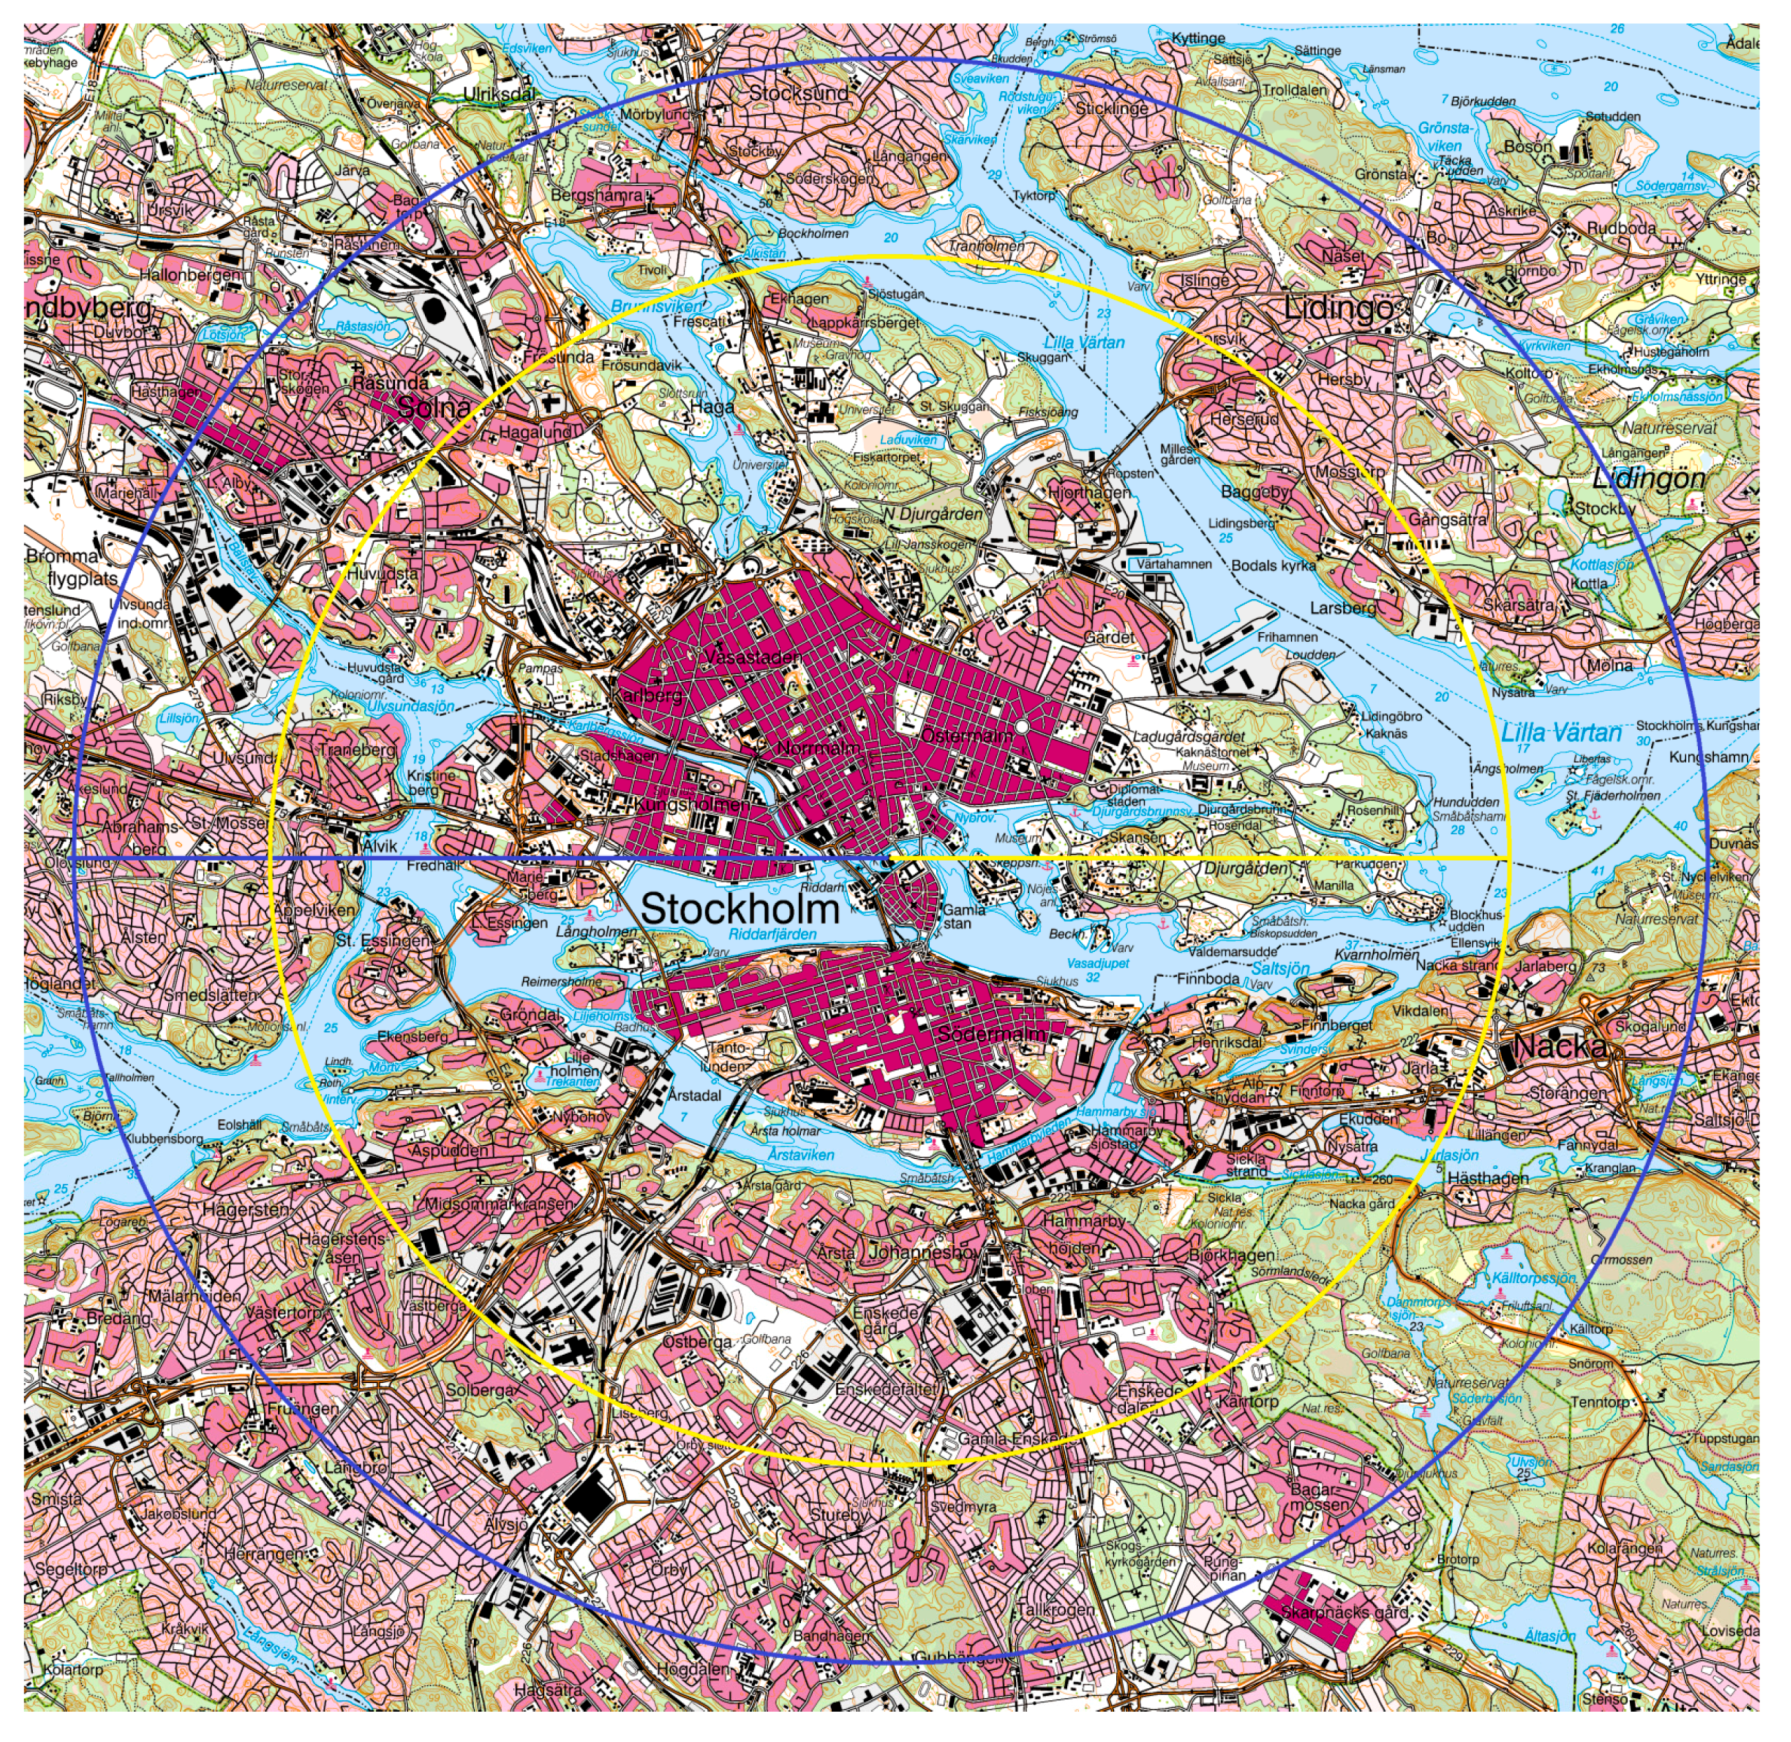
As could be expected, the trip distances, as measured by a criterion method [
15], vary between the modal groups. We observed about 15%–25% longer median distances for dual-mode than for single-mode pedestrians, and about 190%–290% longer distances were observed for the single-mode cyclists. This is, to our knowledge, the first time that such long commuting distances for single-mode commuting cycling (md, males, 9 km; females, 6.7 km), are reported, and it is reasonable to assume that this is an effect of the study area used, as well as the fact that we have separated single and dual-mode cyclists. We have converted these distances into their corresponding straight line distances [
19] and illustrate them in
Figure 5 as the radius in circles with the center placed in the core of the metropolitan area of Greater Stockholm. Within those circles we find both a high density of workplaces and a high residential density. For instance, within the yellow circle, about 350,000–400,000 of the region’s 1.9 million people live. Indeed, this is a quite typical European urban setting, and it points to the fact that a substantial portion of the inhabitants affected by this type of urban planning have realistic bicycling distances to their workplaces.
At the same time, given that our study was conducted in a widespread metropolitan area with a substantial proportion of distances that are too long for active commuting even by cycling, we believe that the distance data presented generally stand for behaviors in which the values above the median gradually approach the upper distance limits that can realistically be expected to be undertaken, at least within the segment of potentially new active commuters in the population. At this point of development in our understanding of active commuting behaviors, we suggest that the 3rd quartiles for trip distance in each modality group and gender can be used as a provisional indication of upper distance limits for active commuting behaviors within the population. Future studies should further our understanding of these issues through in-depth analyses of its dependence of age, work capacity, motivation, and bicycle gear number.
Another finding was that male single-mode cyclists cover longer distances than females. This is a reflection of higher cycling velocities among men, since the commuting time did not differ between the genders. There are several different possible explanations for this. Shorter all-mode commuting distances for women have been reported in Sweden [
20,
21,
22], and for bicycle commuting in other countries [
23,
24]. Such differences in distance are often explained by the household responsibility hypothesis or by observations that female-dominated workplaces, like child and healthcare centers, have a more even spatial distribution in the urban area (
cf. [
25,
26]). This could be interpreted in terms of women not having to cycle as fast as men to reach their workplaces within a certain commuting time allocation. However, since dual mode cyclists of both genders have about the same distance to work, and men still have higher cycling velocities than women, we believe that alternative explanations must also be searched for. For example, social norms acting via e.g., dress codes and acceptance of sweating, may influence the velocity of cycling, and this can also be due to higher demands on traffic safety among women [
27,
28]. Physiological explanations also need to be considered; whereas the leg muscle force capacity for walking and cycling appears to create rather similar conditions for both genders [
29], the aerobic capacity relative to body mass has been shown to differ between genders (15%–20%) in a fashion that can, to a great extent, explain the differences in cycling velocity noted between men and women [
30]. Finally, we note in this study that men generally have bicycles with a greater number of gears (
Table 4). Whatever the reason is, the higher cycling velocities for men than for women in both the single and dual-mode groups are in accord with the results of other studies on bicycle commuting [
31,
32,
33].
Figure 5.
Map over the more central parts of the Greater Stockholm region, Sweden. Median distances for single-mode cyclists are indicated as the radius between the circles and the core of the inner urban area of Stockholm. The actual route distances (males 9.0 km, and females 6.7 km) have been transformed into the corresponding straight-line distances, which, on the average, are 80% of the actual route distances in this region [
19]. The blue radius and circle represents males, and the yellow ones females. Within the yellow circle live about 350,000–400,000 inhabitants. Lantmäteriet
©, Gävle, Sweden (I2014/00630).
We also noted that dual-mode cyclists have lower velocities than single-mode cyclists (
Table 5). An explanation for this might be the longer distances of single-mode commuting. In line with that, El-Geneidy
et al. [
34] have reported that longer distances in cycling as a mode of transport were associated with higher velocities. They reported that an increase in total distance of 1.6 km
, i.e., 1 mile, results in an 0.38 km/h higher velocity. A partial explanation of such a phenomenon could be that dual-mode cyclists use bicycles with a lower number of gears than single-mode cyclists (see
Table 4). Another possibility is that the single-mode cyclists represent a subgroup with higher aerobic power than the dual-mode group, and thus that selection factors play a role here. Finally, the fact that the dual-mode cyclists, compared to the single-mode cyclists, cycle to a greater extent in the inner urban area (
cf. Table 2 and
Table 3) may also have affected their velocities, given that the inner urban and suburban areas constitute distinctly different traffic environments [
10].
4.3. Seasonal Variation in Trip Frequency
To the best of our knowledge, this paper is the first to assess differences in self-reported walking and cycling frequencies between single and dual-mode active commuters of both genders. The reason for this is that single and dual-mode commuters are usually assessed jointly, and that commuters are categorized from their mode at the time of assessment [
22]; thus, hiding a possible mode choice variability with the seasons. Furthermore, imprecise measuring methods have sometimes been used in reporting yearly frequencies. For example, activity diaries normally cover the last days’ or weeks’ travel, or population-based travel surveys and bicycle flow measurements that only encompass data or changes at an aggregated level. As a result, very little is known about how the behaviors of individual active commuters vary over the year.
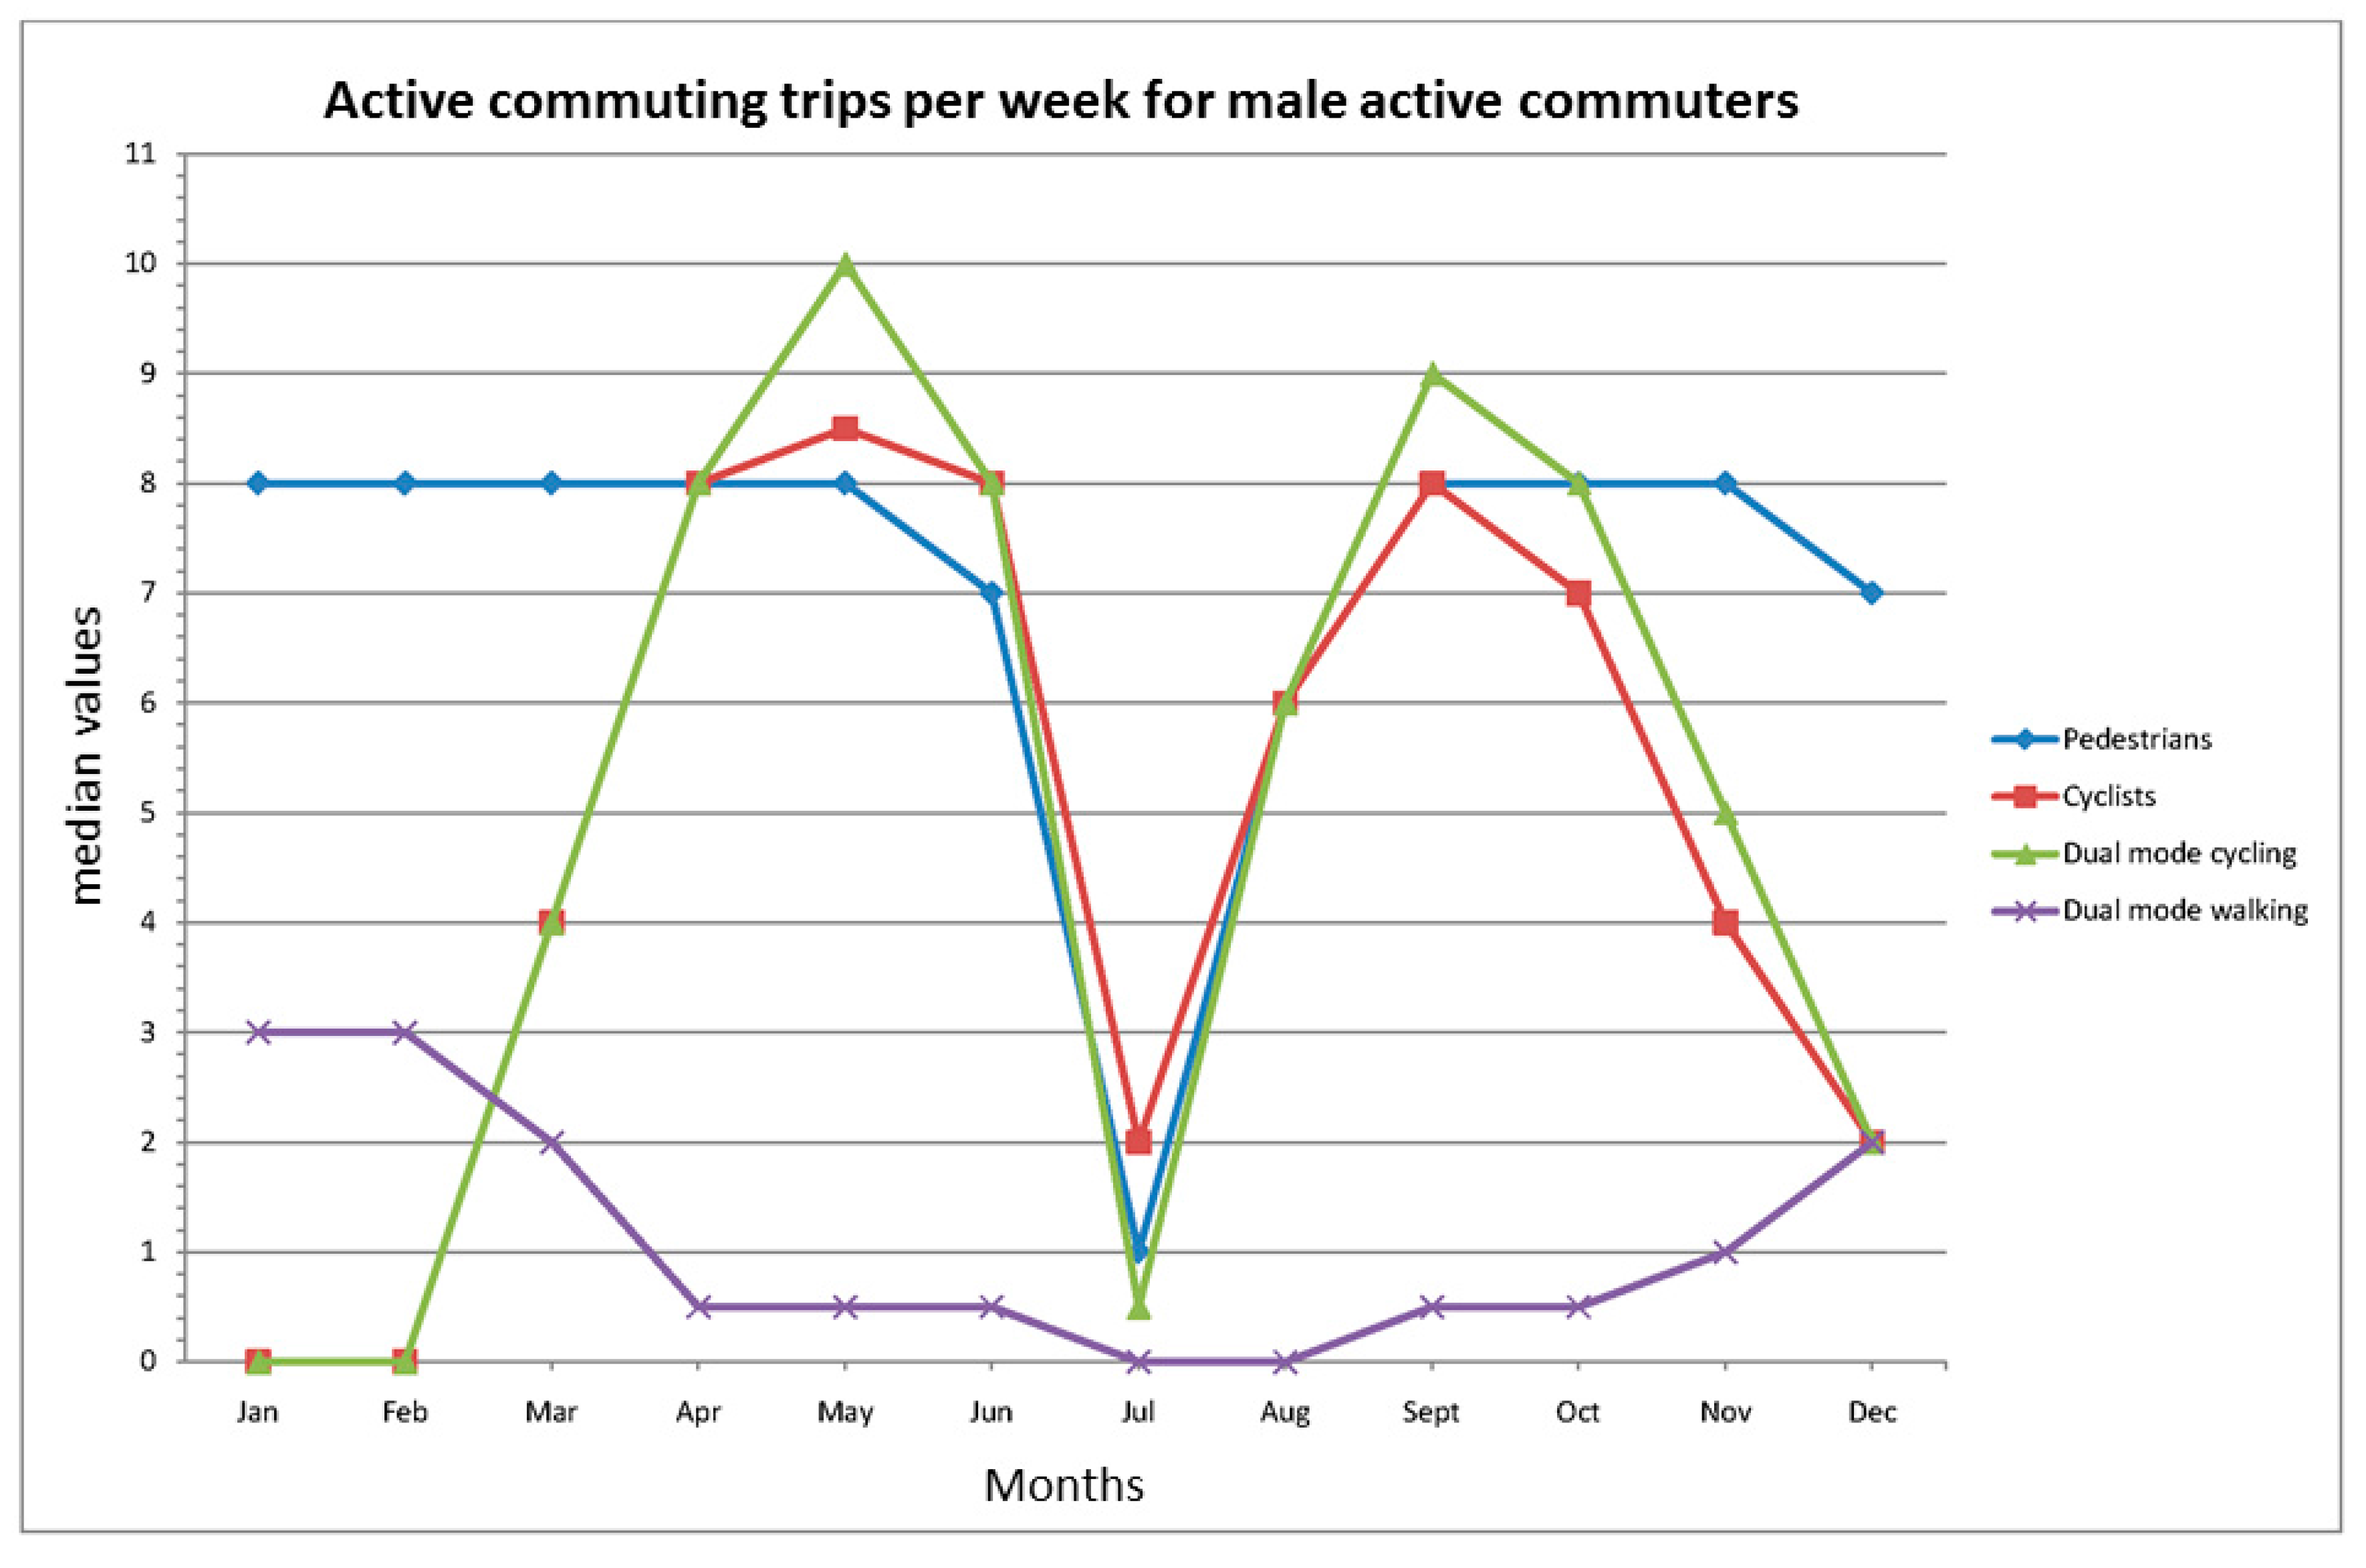
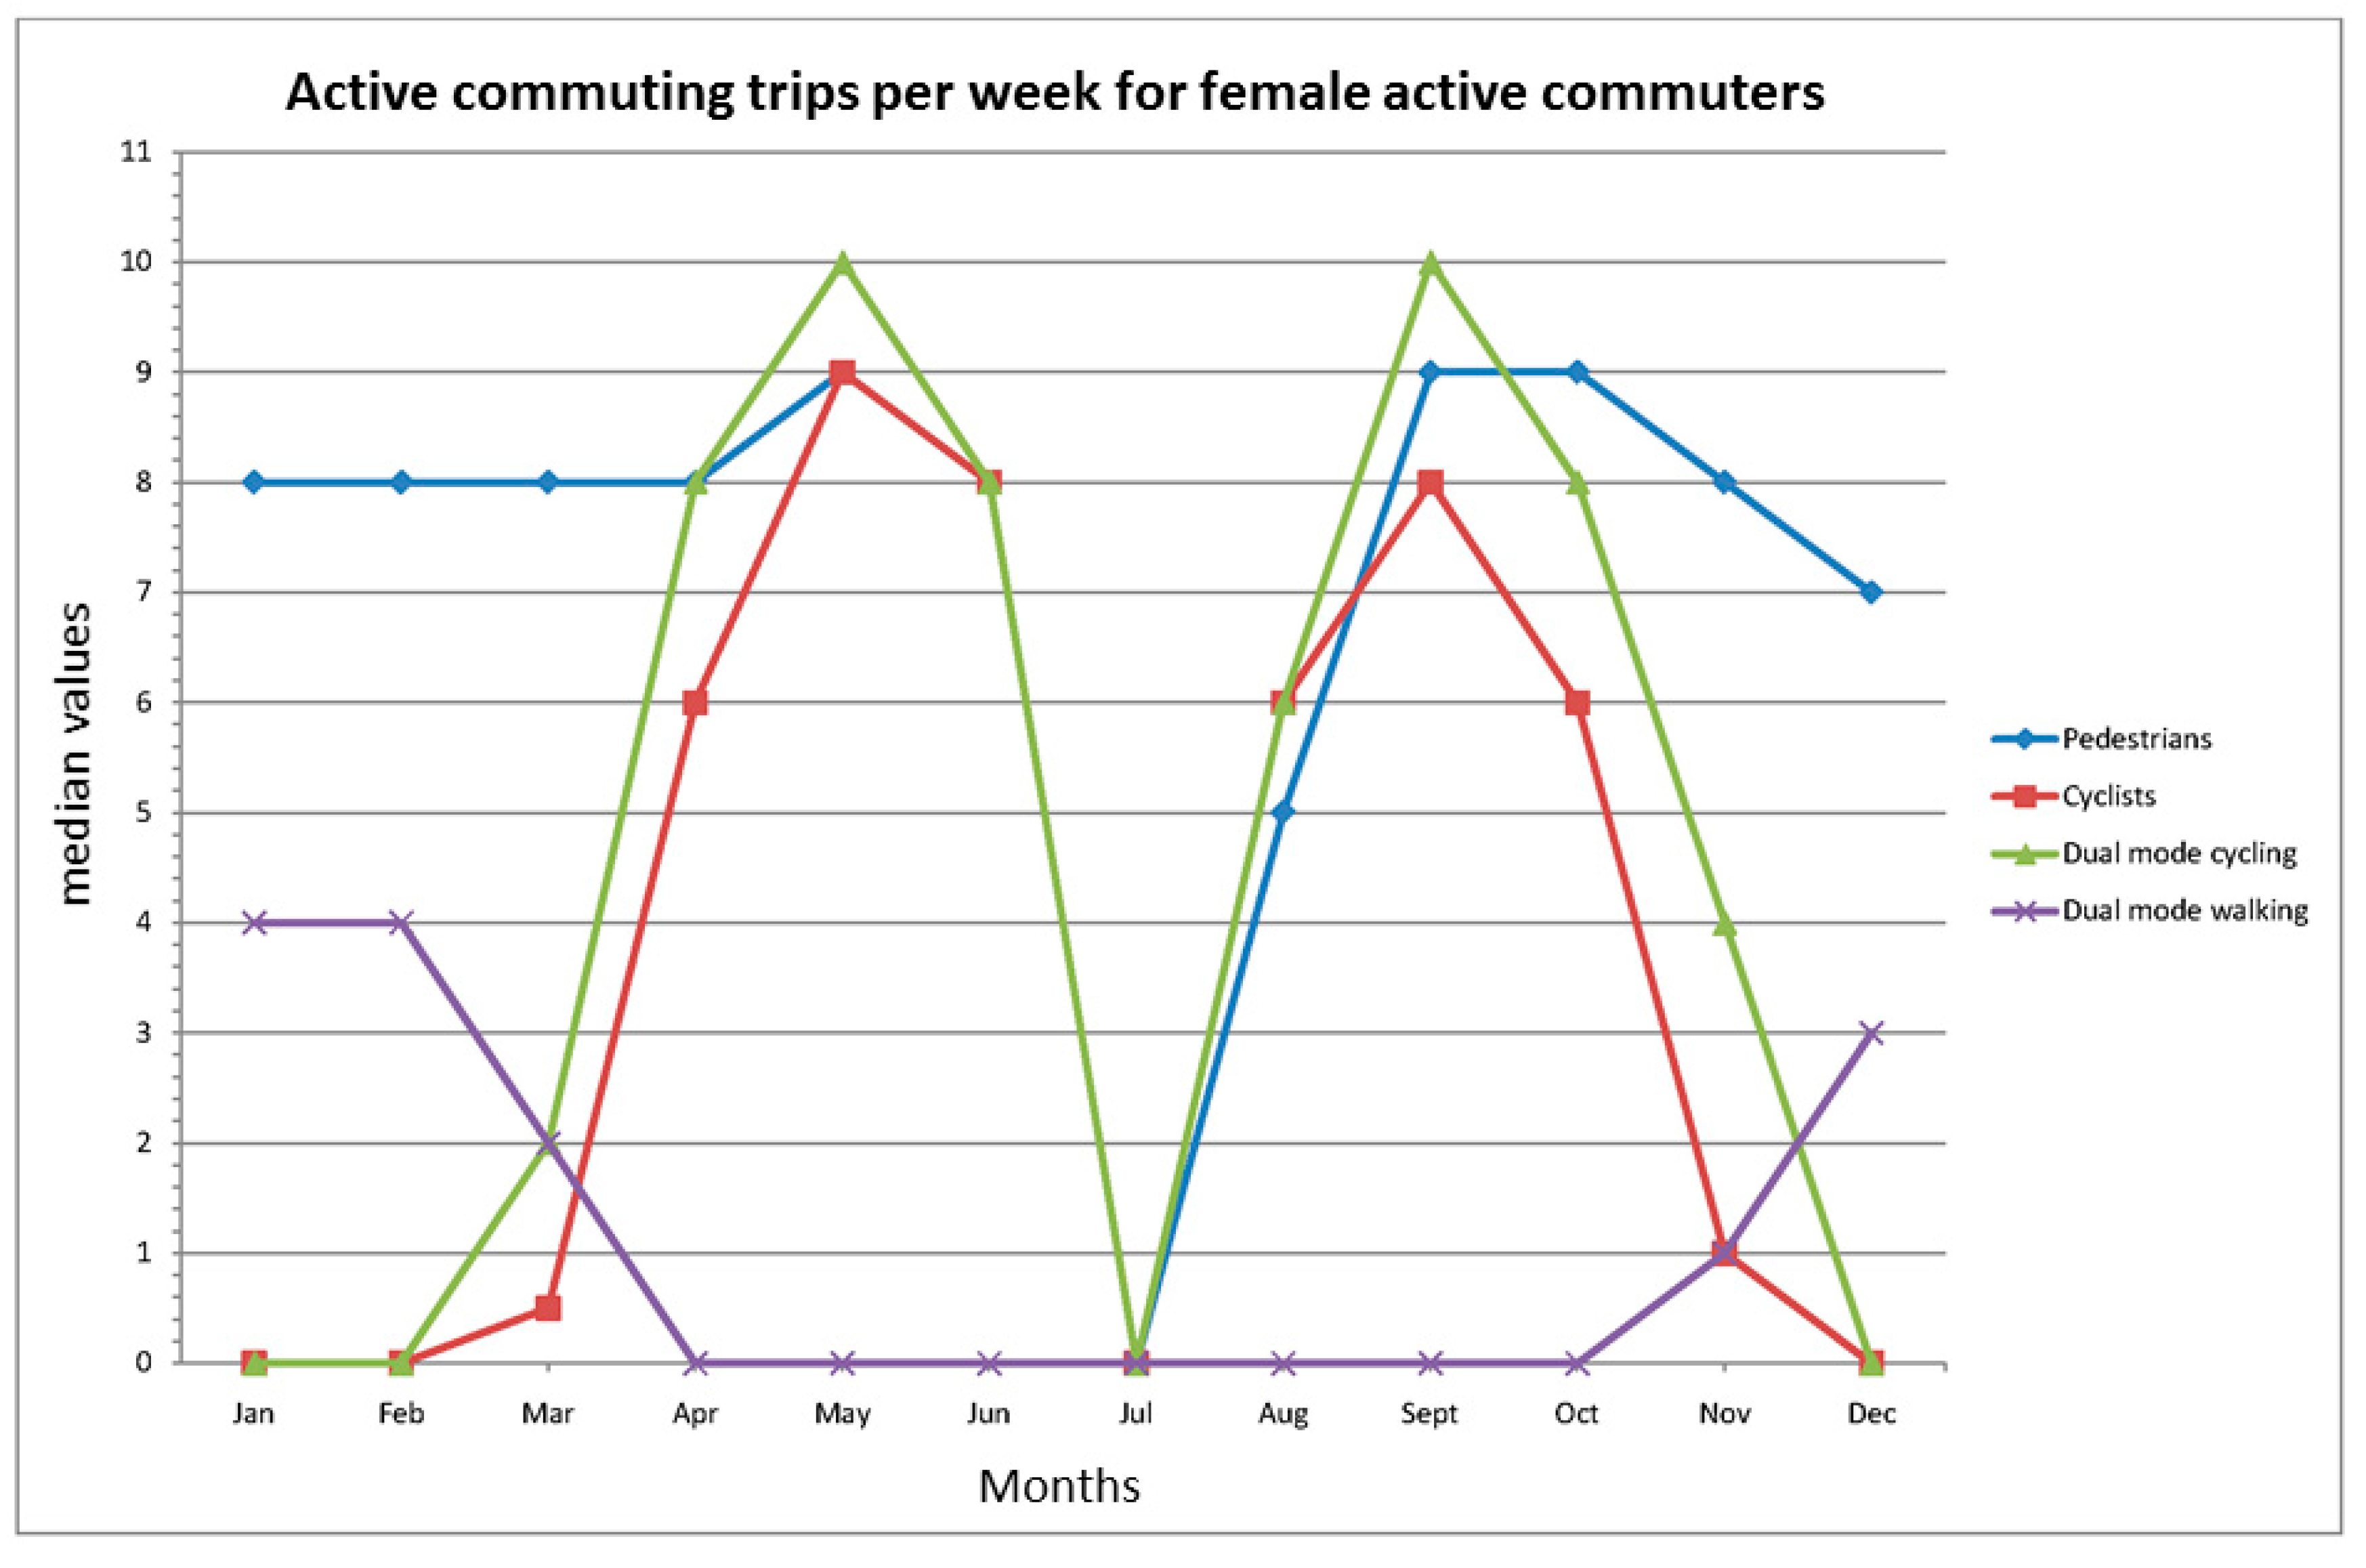
Three striking characteristics are revealed in the present study. First of all, the high and stable trip frequency over the year noted among both male and female single-mode pedestrians. This stability is only interrupted during the month of July, and the cause for this is that July is the primary holiday month in Sweden. Second, this stability is in contrast with the high variability in cycling frequency for both genders among the single and dual-mode cyclists. Third, the variations in cycling frequency are replaced in the dual mode group of both genders by compensations in walking frequency. The latter finding underlines the importance of including questions about several active commuting modes, or at least walking and cycling, in trip and physical activity surveys; otherwise, the total active commuting frequency and physical activity levels might be underestimated.
Previous research has found seasonal variation in young adults’ total physical activity (see, e.g., [
35]) and in leisure-time physical activity (see, e.g., [
36]) with lower levels in the wintertime compared to other seasons. In line therewith, we note a rather dramatic seasonality in bicycle commuting among both single and dual-mode commuters. The decrease in cycle commuting between November and March is similar to the variations in flows of cyclists in the bicycle counts for arterial streets leading to the inner urban areas of Stockholm, as well as within the inner urban area [
37,
38]. It is also in line with findings from other cities in Sweden [
39]. What is new in this study is that we note the same overall pattern of seasonality in both genders, and that it is seen to the same extent in single-mode cyclists with long distances as in dual mode cyclists with shorter distances. This is an indication that the cycling behaviors are very sensitive to changes in the external environment between the summer and winter halves of the year. This is strikingly different compared to the stability in the walking commuting behavior among single-mode pedestrians. To our knowledge, this has not been reported previously. McCormack
et al. [
40] assessed the seasonal variation in walking for transportation in Calgary in Canada. In contrast to the present study, they found a decrease in the wintertime. However, they assessed walking for transportation in general, and not walking to work specifically. As in the present study, they noted that the seasonal variation differs between different types of physical activity. For instance, they found significant seasonal differences in moderate-intensity physical activity, but not in vigorous activity.
What can explain the overall variations in cycling trip frequency compared to the stable frequency pattern of the pedestrians? When winter comes to Stockholm, many environmental changes occur in parallel: it gets darker, colder, and snow and ice may appear on the roads. It is therefore difficult to judge the effect of each individual factor. For instance, darkness could, hypothetically, affect the mode groups differently, but, at least in December and the adjacent months, the majority of the commuters in all three modal groups seem to start their commute before sunrise and return home after sunset (
cf. descriptions of participants in Methods and
Table 1). Therefore, this is not a plausible explanation for the differences between pedestrians and bicyclists.
Interestingly, the changeover in the external environment seems to affect men and women at somewhat different time points. Men continue to cycle for a longer period in the fall, and also to a greater extent during the winter, and those who stop cycling during the winter seem to start earlier in the spring than their female counterparts. Thus, there is a gender difference that stands out in a more detailed analysis of the seasonal variability. Possible reasons for this gender difference in the present study might be perceptions of more unsafe bicycling conditions and reduced comfort during the winter. Women appear to value the importance of personal and traffic safety higher than men (see, e.g., [
34,
35]) and they also appear to value cycling comfort higher than men (see [
34]). Interestingly, for walking, we found no gender difference in commuting frequencies, so the explanation for the difference must include something specific for the cycling mode. Unlike walking, cycling includes keeping a vehicle in balance so as not to fall, and cyclists are therefore more exposed to poor road conditions. In line with this, Winters
et al. [
41] found that regular cyclists in Vancouver, Canada, perceived icy and snowy routes as major deterrents. However, the interaction with other traffic might also be a critical factor. The risk of not being seen by car drivers when cycling in darkness, and not seeing motorized vehicles, might be critical for the perception of safety. Finally, it should be mentioned that during the study period, and for several decades before it, managing the routes for cyclists in case of snowing has had a low priority.
Interestingly, the median distance values for the dual-mode walkers are between 17% and 26% longer than in the single mode pedestrians. The number of walking trips in the dual mode group is, however, clearly lower than among the single-mode pedestrians, indicating that a walking commuting distance of about 3 km has passed the limit for many individuals as a high trip frequency behavior. In contrast, the long distances observed among single-mode bicyclists (males, 9 km; females, 6.7 km) are travelled with the same frequency during the summer half of the year as for the dual-mode cyclists, although the dual-mode commuters have 55%–68% shorter distances.
Future studies should assess walking and cycling with different purposes, as well as in combination with other transportation modes, from a perspective of seasonal variation, and should also explore the extent to which seasonal variations in active commuting can be overcome by means of improved winter route maintenance and better street-lighting. Indeed, to study these matters in different climate and daylight zones would be of clear value.
4.4. Durations in Relation to Physical Activity Recommendations
There are several parts of the minimal recommended levels of physical activity of moderate intensity. One specifies that the physical activity bouts should be at least 10 min long. Another that one should accumulate 30 min of 10-minute or longer bouts, at least five days a week, thus amounting to a total of 150 min per week [
5]. The latter figure agrees with the WHO physical activity recommendations from 2010 [
6], which, however, include no statement about how many days one should spend to accumulate the 150 min. However, if more intensive exercise is undertaken, the time needed can be less [
5,
6].
With regard to the minimal recommendations, the first prerequisite of at least 10-minute-long physical activity bouts is met by more than 92% in most modality groups, but decreases to 75%–84% in the dual-mode group when cycling. Another prerequisite deal with the number of days per week. It is notable that a common peak frequency for the different modality groups is 8 per week. The most common pattern of commuting involves two trips per day (
cf. Table 5), which would indicate that such days of active commuting are undertaken four days a week. Considering that about 90% of the individuals in most modality groups have 15-minute or longer commutes, this means that they accumulate at least 30 min of moderate physical activity per day during four days per week. This represents, as stated, the peak median behavior for most modal groups.
The third type of minimum physical activity demand relates to a total of 150 min of moderate activity. This is a figure based on 30 min five days a week [
5]. Those recommendations do not discuss whether this volume of physical activity can be undertaken just as well on four days, but, as stated before, leave open the possibility of higher intensity physical activity on a lower number of days. Again, the WHO recommendations do not state anything about the number of days per week for the accumulation of 150 min per week [
6]. However, in their interpretation statement, it is recommended that the physical activity is “spread throughout the week” and implemented as “regular physical activity throughout the week (such as five or more times per week)” [
6]. No doubt, the median trip frequency patterns of all modality groups, fulfill these criteria when they implement their active commuting behaviors. The majority in the pedestrian group did also meet the 150 min part of the recommendation with exclusively commuting physical activity, except for in July, which is the predominant summer holiday month (
Table 7,
Figure 3 and
Figure 4). The median levels of physical activity accumulated in the dual-mode group from cycling do not meet these guidelines. However, if walking and cycling times are added together, the dual-mode group has median values which, for most of the year, are only slightly lower than the physical activity recommendations (
Table 7,
Figure 3 and
Figure 4). The median single-mode cyclists meet the recommendation solely in the spring–mid-fall part of the year (
Table 7,
Figure 3 and
Figure 4). Thus, to meet the recommendations all-year round, the single-mode cyclists need to complement with other forms of physical activity in the wintertime. That is also true for the dual-mode group during most parts of the year, but to a rather modest extent. The dual-mode strategy therefore has clear advantages, and it is interesting to note that this seems to be a strategy that functions up to distances of about 4–5 km as judged from the 3rd distance quartiles of men and women.
The minimum recommendation is one thing; however, there are also recommendations saying that about 60 min of moderate-intensity physical activity per day signifies meeting more optimal levels of physical activity from a health-enhancing perspective [
5,
6]. Within most of the modality groups, about 50% have single-commute durations of 30 min or more (
cf. Table 5). This means that if two commute trips per day are made, they will reach the optimal physical activity levels. On viewing both the number of trips per week and the total amount of physical activity time, it is apparent that a substantial portion of the active commuters accumulate optimal quantities of physical activity most working days of the week.
Duration represents, however, only one aspect of the physical activity recommendations, intensity being another. The calculated median velocities in the present study ranged from 5.2 to 5.4 km/h for walking and from 12.8 to 18.6 km/h for cycling. Are they intense enough to meet the recommendations? This is hard to tell, since they are based on valid distance values, but also on duration values that include time for red-light stops. Furthermore, due to rounding off in the majority of the cases, the duration values involve errors on the individual level, which, however, might cancel out at the group level. Nevertheless, with these limitations in mind, the median walking velocity in the present study is included in the proposed range of brisk walking in the recommendation of 3–4 mph or 4.8–6.4 km/h [
42]. The lower limit in the recommendation corresponds to the first quartile of walking velocity in the present study, an indication that the velocity is in general brisk and of moderate intensity even if it also includes stops at red lights and junctions,
cf. [
43].
No velocity limits are set for cycling in the physical activity recommendation, but a moderate intensity correspond to 3–6 METs, and in the Compendium of Physical Activity, 4 METs correspond to 16 km/h [
44]; hence, this is 1 MET higher than the minimal recommendation and an indication that the median bicycling velocities in the present study are of moderate intensity. Correspondingly, Haskell
et al. [
5] suggest that both walking and cycling, with a transportation purpose, should be recognized as being of moderate intensity.
Finally, some comments follow here on the single-mode cycling strategy in relation to possible effects on health. If there is no substitution during the winter for the physical activity gained from cycling during the summer, a detraining effect will most likely take over rather quickly, leading to a lowered metabolic capacity as indicated by decreases in capillarization, levels of oxidative enzymes and the capacity for mitochondrial ATP production in skeletal muscle [
45,
46], and also a lowered glucose tolerance [
47]. Interestingly, there is also a study on the effect of seasonal
vs. all-year-round levels of physical activity on premature mortality, showing a beneficial effect only for the all-year-round physical activity [
48]. Indeed, this is another and important reason to try to stimulate and enhance the conditions for all-year-round cycling.
4.5. Representativeness
In Stockholm, rather few people commute actively. In the most active period,
i.e., during the summer time, about 15%–20% of the work trips are by foot or bicycle the whole way [
49] and, consequently, it is costly to randomly recruit an adequate number of active commuters to make between-group comparisons. This study sample was therefore recruited by advertisements. We believe that this recruitment method will, if at all, only moderately affect our study aims. This belief is based on several comparisons. In Stigell 2011 [
50] the commuting behaviors of the advertisement-recruited sample were compared with those of the street-recruited sample of cyclists and a general concordance was noted. The only exception was in the yearly trip frequency, which was an expected difference between the samples since the street-recruited single-mode cyclists were gathered during the wintertime. Furthermore, to check if there was a clear selection bias, the sociodemographic characteristics of single-mode cyclists in our advertisement-recruited sample were compared with those of the street-recruited sample and a concordance was found. To further assess the representativeness of our results, we have compared our sample with a random population sample of active commuters from Greater Stockholm, recruited during the same period of time for the Regional Travel Survey 2004 (RVU04) [
49]. The RVU04 was part of the evaluation of the Stockholm congestion charge trials and is described in detail elsewhere [
51,
52]. In brief, questionnaires and single-day travel diaries were sent to 77,000 individuals in Stockholm County in September and October 2004. About half of the individuals responded (
n = 36,049) and of these, 1338 pedestrian and 990 bicycle commuters corresponded to our inclusion criteria. However, the RVU04 did not distinguish between dual and single-mode commuters; therefore, to be comparable with that sample, we aggregated single and dual modes in the present study to obtain integrated walking and bicycling groups (data not shown).
In the RVU04 the mean age was 41–42 years in the gender and mode groups, compared to 46–49 years in the present sample (see
Table 2). There was a majority of female commuters in both the RVU04, 55%–59%, and in our sample, 59%–82% in the different mode groups. Furthermore, there were rather small differences in income, driver’s license possession and access to a car, with all samples having a higher income than the mean in the County and high access to a car and a high percentage with a driver’s license (data not shown). Overall, although there appear to be some differences between the three samples, on the whole, our advertisement-recruited sample seems to target a similar socio-economic group of active commuters to that of the RVU04 sample. Thus, taken altogether, the comparison between different samples suggests that socioeconomically speaking, the advertisement-recruited sample is reasonably representative of the population of active commuters in the study area.
4.6. Strengths and Limitations
The research was conducted in the metropolitan area of Stockholm, Sweden, where cycling and walking commuting are socially accepted behaviors. This strengthens the study in two ways. First it provides us with a more diverse study population in terms of more women and persons with a high socio-economic status than in other cultural settings where bicycling is regarded as the modal choice of low-income groups or fearless young men. Second, the Stockholm metropolitan area has a large “labor basin”, which gives a wide range of commuting distances, which, in turn, makes it possible to study active commuting behaviours when they are “stretched out” in terms of duration and distance. In addition, the sample is large enough to make reasonable between-group comparisons. It is also a strength that we make use of a criterion method for establishing the trip distances.
However, there are also limitations to the study. Our participants were recruited by advertisements, which introduce a risk of selection bias. To decrease that risk, we stressed in the advertisement that we also welcomed commuters with very short commuting trips and the minimum number of trips per year was set to “at least once a year.” We also focused our analyses on between-group comparisons, which are presumably less affected by a potential selection bias. Other limitations are the use of a self-report questionnaire with an up to one-year recall of commuting frequencies. This might be a difficult task for the participants. However, since most of the participants are habitual commuters, this might reduce the complexity of the task since habits might be easier to recall than single episodes.
The validity of the commuting time variable suffers from effects of the participants rounding off commuting times to multiples of five or ten, which is a phenomenon that seems to be common in surveys of travel behaviors [
53]. If the commuting time is used to measure the duration of physical activity, this is a deficit. Furthermore, commuting is an intermittent activity with 1–3 stops per trip at red lights, and perhaps also at, e.g., busy intersections. It should also be mentioned that bicyclists might also stop pedaling downhill, or at high velocities. Thus, all commuting time is not physical activity time. We believe, however, that these pauses in physical activity have a minor influence on the commuting durations. The participants stated their mean commuting time at the time of receiving the questionnaire, but the duration might also vary in relation to seasons in a way that, in such a case, is not covered. Consequently, the trip distance might be a more robust measure of the active commuting “duration” than the stated commuting time.


