
Changes in the Effect of Heat on Mortality in the Last 20 Years in Nine European Cities. Results from the PHASE Project


 , , , ,
Abstract
:1. Introduction
2. Methods
2.1. Study Design and Population
2.2. Mortality Data
2.3. Environmental Data
2.4. Statistical Analysis

| Population | Average Daily Death by Cause | Mean Temperature (°C) § | Heat Prevention Plan | |||||||||
|---|---|---|---|---|---|---|---|---|---|---|---|---|
| Cities | Period | Total | Percent Aged 65+ | Percent Aged 75+ | Period Specific Summer Death Rate * | Total | Respiratory | Cardiovascular | Average | 75th Pctile | 95th Pctile | Year of Activation, Coverage |
| Valencia | 1996–2002 | 745,501 | 17.1 | 7.4 | 371.6 | 15.1 | 1.6 | 5.3 | 22.2 | 25.6 | 28.9 | 2004, national |
| 2004–2010 | 802,273 | 17.4 | 8.5 | 344.1 | 15.1 | 1.7 | 4.8 | 22.0 | 25.9 | 29.7 | ||
| Barcelona | 1997–2002 | 1,507,563 | 21.9 | 10.0 | 441.0 | 36.3 | 3.3 | 12.5 | 20.4 | 23.6 | 26.8 | 2004, national, regional |
| 2004–2009 | 1,601,630 | 20.7 | 10.8 | 394.6 | 34.5 | 3.5 | 10.7 | 21.8 | 25.5 | 28.8 | ||
| Athens | 1996–2002 | 3,288,193 | 15.7 | 6.3 | 409.5 | 73.6 | 5.5 | 36.1 | 24.3 | 28.4 | 34.0 | n.a. |
| 2004–2010 | 3,283,460 | 16.7 | 7.8 | 426.5 | 76.5 | 7.8 | 34.8 | 24.3 | 28.3 | 33.2 | ||
| Rome | 1996–2002 | 2,596,061 | 17.9 | 7.3 | 370.2 | 52.5 | 2.6 | 21.1 | 20.5 | 24.0 | 28.2 | 2004, national, regional |
| 2004–2010 | 2,679,363 | 20.5 | 9.1 | 366.6 | 53.7 | 3.1 | 21.3 | 21.1 | 25.0 | 29.4 | ||
| Budapest | 1996–2002 | 1,817,370 | 17.0 | 7.2 | 679.4 | 65.9 | 1.9 | 32.7 | 18.1 | 21.7 | 28.2 | 2006, national |
| 2004–2010 | 1,706,734 | 18.3 | 8.7 | 638.2 | 59.5 | 2.5 | 28.9 | 18.5 | 22.1 | 28.3 | ||
| Paris | 1997–2002 | 6,199,901 | 13.1 | 6.1 | 371.7 | 106.8 | 6.7 | 29.9 | 17.0 | 19.9 | 26.7 | 2004, national |
| 2004–2009 | 6,518,897 | 12.9 | 6.6 | 272.3 | 97.0 | 5.5 | 24.1 | 17.4 | 20.2 | 26.5 | ||
| London | 1996–2002 | 7,163,486 | 12.7 | 6.0 | 376.4 | 147.3 | 23.3 | 57.9 | 15.2 | 17.9 | 24.1 | 2004, national |
| 2004–2010 | 7,613,413 | 11.7 | 5.7 | 296.0 | 123.1 | 16.4 | 43.3 | 15.6 | 18.1 | 24.6 | ||
| Stockholm | 1996–2002 | 1,800,947 | 14.4 | 7.4 | 298.7 | 29.4 | 2.2 | 13.4 | 13.3 | 17.1 | 23.3 | n.a. |
| 2004–2010 | 1,955,036 | 14.4 | 6.9 | 261.9 | 28.0 | 1.9 | 11.4 | 13.6 | 17.2 | 23.1 | ||
| Helsinki | 1996–2002 | 942,492 | 11.4 | 5.0 | 332.5 | 17.1 | 1.5 | 7.4 | 12.6 | 16.9 | 22.7 | n.a. |
| 2004–2010 | 1,010,775 | 12.7 | 5.6 | 312.1 | 17.2 | 0.9 | 6.9 | 13.0 | 17.0 | 23.8 | ||
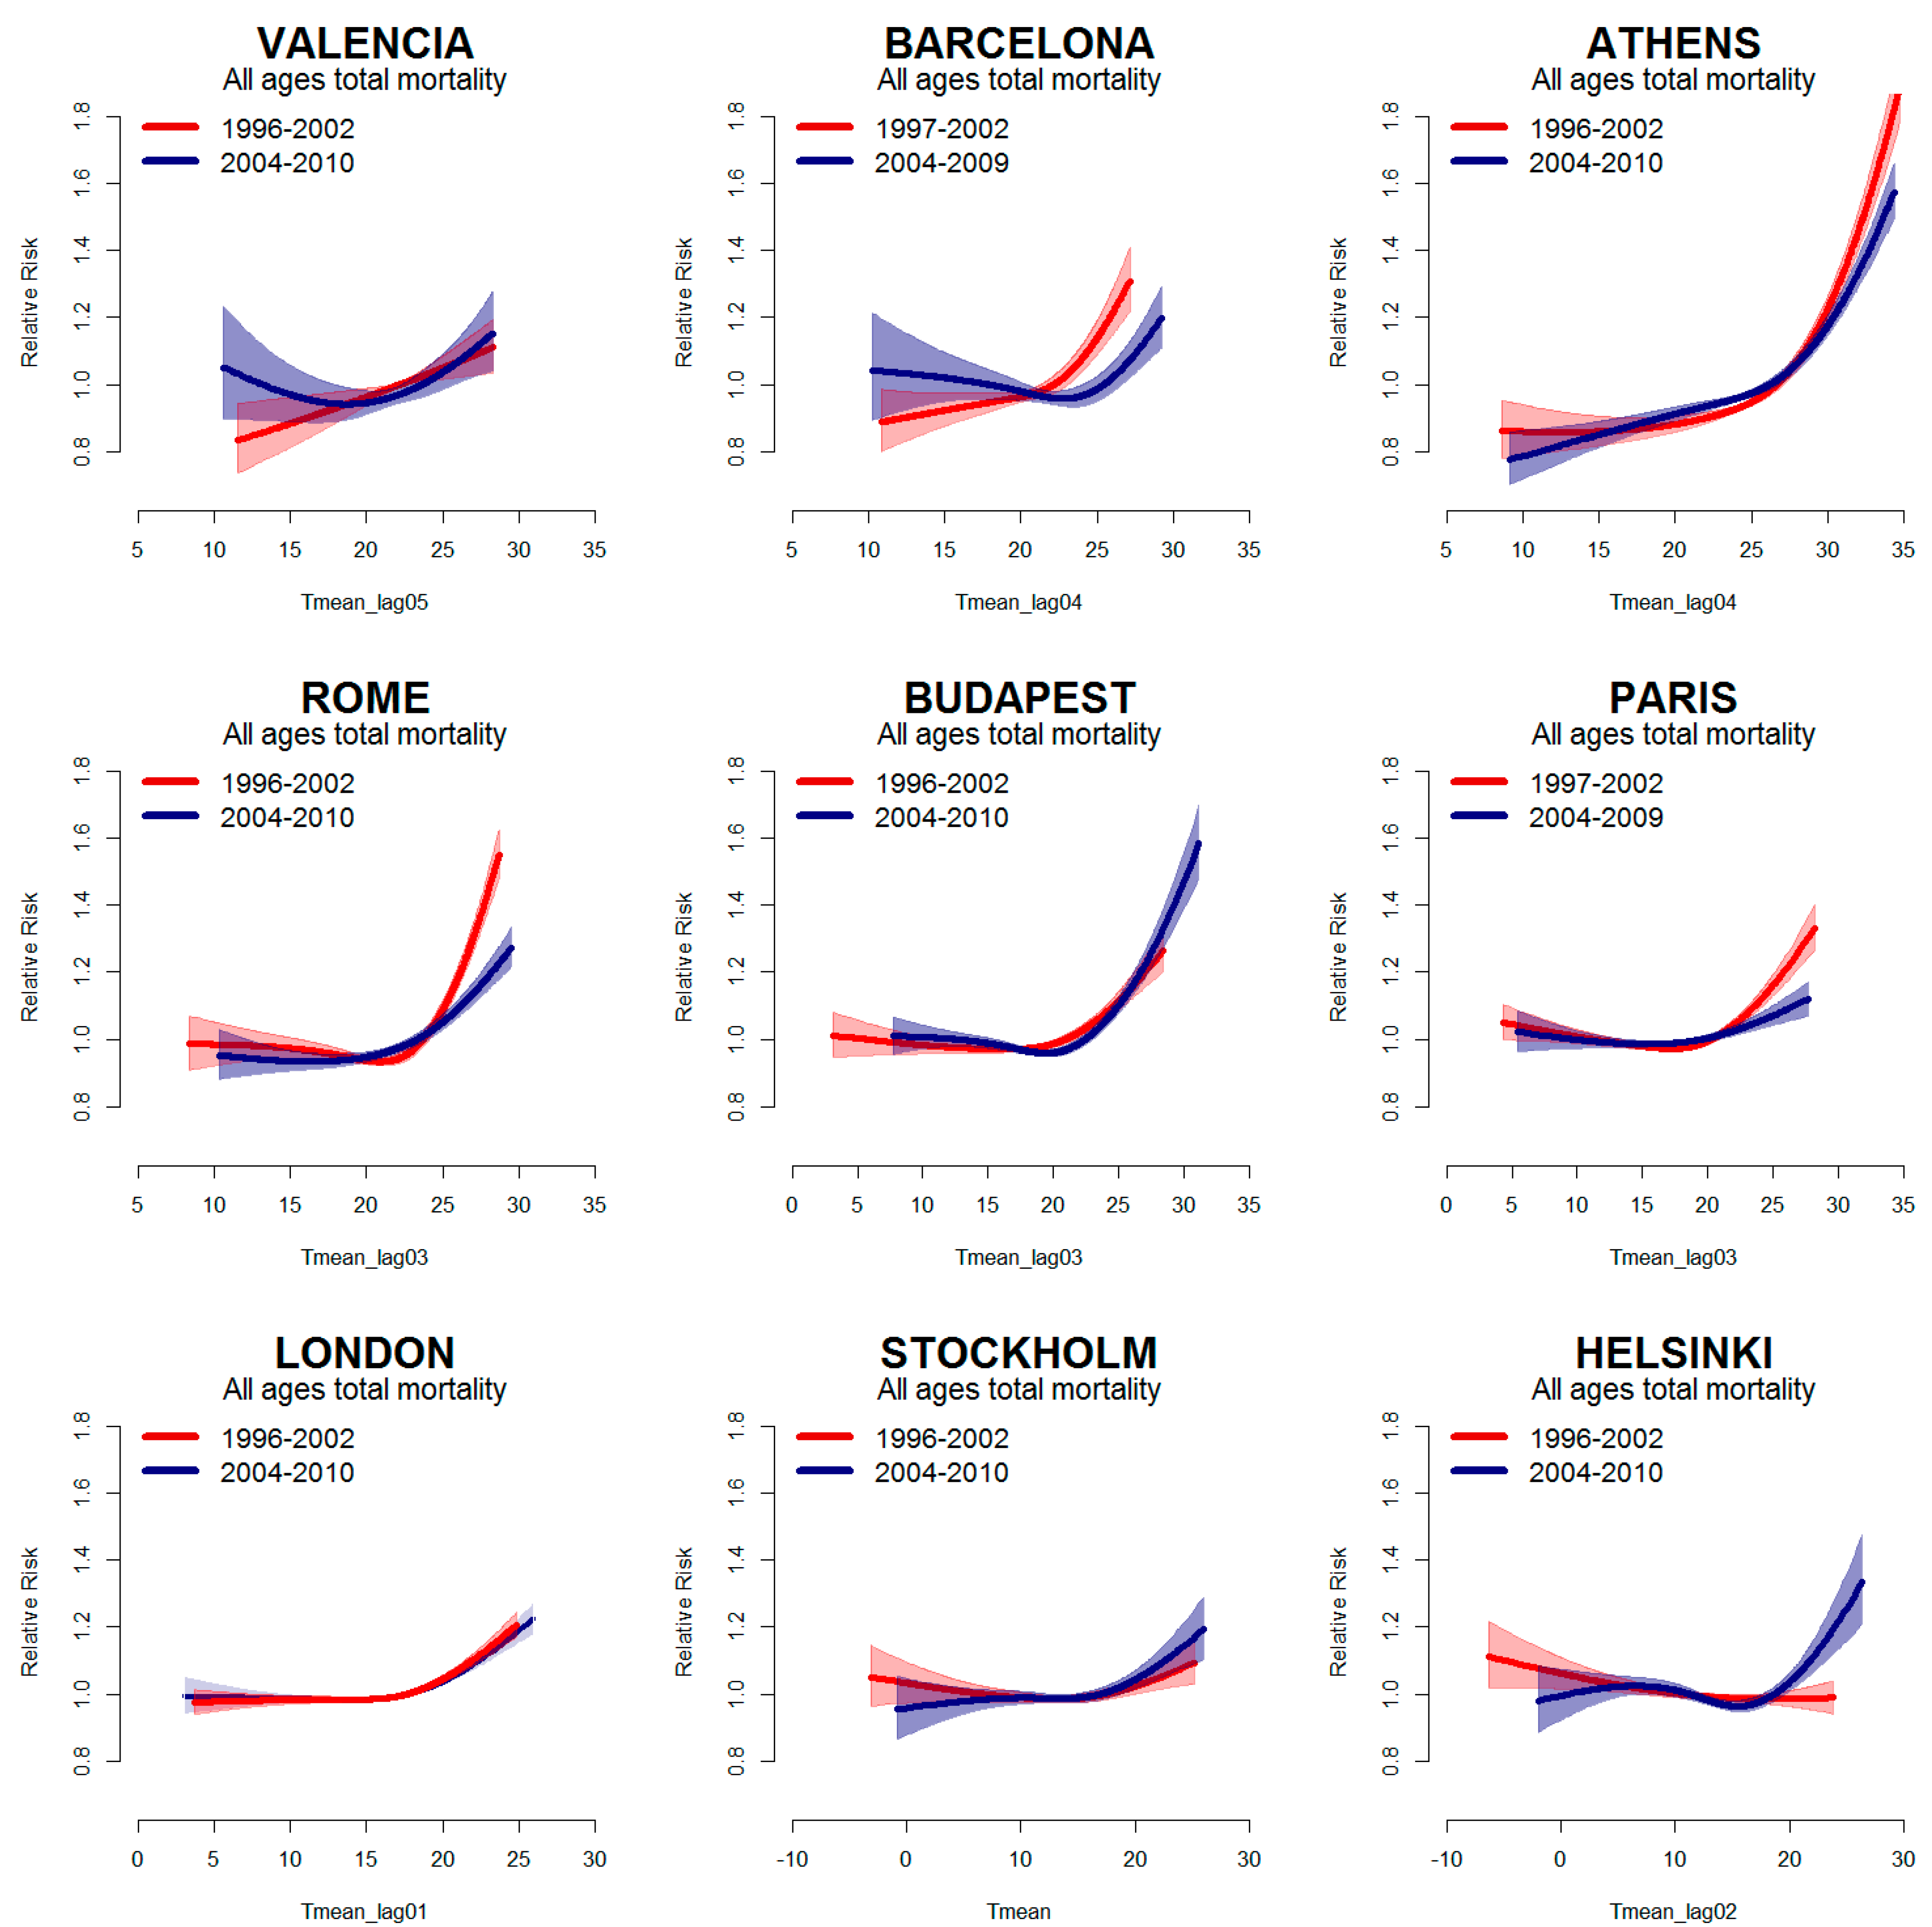
3. Results

| Cities | Period | All Causes | Respiratory Causes | Cardiovascular Causes | ||||||
|---|---|---|---|---|---|---|---|---|---|---|
| RR | 95% Cl | P Value a | RR | 95% Cl | P Value a | RR | 95% Cl | P Value a | ||
| Valencia | 1996–2002 | 1.11 | 1.04–1.17 | 0.81 | 0.53–1.33 | 1.12 | 0.85–1.46 | |||
| 2004–2010 | 1.18 | 1.03–1.36 | 0.216 | 1.28 | 0.86–1.92 | 0.159 | 1.27 | 0.98–1.64 | 0.507 | |
| Barcelona | 1997–2002 | 1.27 | 1.18–1.36 | 1.55 | 1.23–1.96 | 1.42 | 1.25–1.60 | |||
| 2004–2009 | 1.26 | 1.17–1.36 | 0.946 | 1.65 | 1.30–2.10 | 0.700 | 1.27 | 1.10–1.47 | 0.263 | |
| Athens | 1996–2002 | 1.63 | 1.53–1.75 | 2.10 | 1.72–2.56 | 1.79 | 1.64–1.96 | |||
| 2004–2010 | 1.35 | 1.29–1.42 | <0.001 | 1.42 | 1.23–1.63 | 0.001 | 1.53 | 1.43–1.64 | 0.006 | |
| Rome | 1996–2002 | 1.53 | 1.45–1.61 | 2.04 | 1.65–2.53 | 1.72 | 1.59–1.86 | |||
| 2004–2010 | 1.27 | 1.19–1.35 | <0.001 | 1.64 | 1.29–2.08 | 0.180 | 1.32 | 1.19–1.46 | <0.001 | |
| Budapest | 1996–2002 | 1.29 | 1.22–1.37 | 1.07 | 0.76–1.50 | 0.97 | 0.88–1.06 | |||
| 2004–2010 | 1.33 | 1.27–1.40 | 0.451 | 1.52 | 1.24–1.87 | 0.082 | 1.44 | 1.35–1.53 | <0.001 | |
| Paris | 1997–2002 | 1.31 | 1.24–1.37 | 1.72 | 1.43–2.06 | 1.25 | 1.15–1.37 | |||
| 2004–2009 | 1.11 | 1.06–1.17 | <0.001 | 1.26 | 1.02–1.55 | 0.026 | 1.04 | 0.95–1.15 | 0.006 | |
| London | 1996–2002 | 1.20 | 1.16–1.25 | 1.26 | 1.15–1.39 | 1.23 | 1.15–1.30 | |||
| 2004–2010 | 1.18 | 1.12–1.23 | 0.429 | 1.35 | 1.19–1.53 | 0.413 | 1.22 | 1.13–1.32 | 0.958 | |
| Stockholm | 1996–2002 | 1.10 | 1.04–1.17 | 1.25 | 1.01–1.54 | 1.07 | 0.98–1.17 | |||
| 2004–2010 | 1.12 | 1.06–1.19 | 0.628 | 1.25 | 1.02–1.53 | 0.999 | 1.17 | 1.07–1.27 | 0.157 | |
| Helsinki | 1996–2002 | 1.02 | 0.93–1.12 | 1.42 | 1.05–1.92 | 1.00 | 0.87–1.15 | |||
| 2004–2010 | 1.24 | 1.14–1.35 | 0.003 | 1.06 | 0.68–1.65 | 0.287 | 1.18 | 1.02–1.35 | 0.111 | |
| P1 (Before 2003) | P2 (After 2003) | Change in Attributable Deaths | ||||||
|---|---|---|---|---|---|---|---|---|
| Cities | AR% | 95% Cl | Attributable Death | AR% | 95% Cl | Attributable Death | Number of Deaths * | P Value |
| Valencia | 0.6 | (0.2–1.0) | 112 | 1.0 | (0.5–1.5) | 194 | 82 | 0.343 |
| Barcelona | 2.2 | (1.7–2.7) | 896 | 2.3 | (2.0–2.6) | 870 | 19 | 0.916 |
| Athens | 3.4 | (3.0–3.8) | 3200 | 2.4 | (2.1–2.7) | 2343 | −985 | 0.005 |
| Rome | 2.8 | (2.6–3.1) | 1900 | 1.9 | (1.6–2.3) | 1321 | −623 | 0.006 |
| Budapest | 1.5 | (1.3–1.8) | 1291 | 1.7 | (1.3–2.0) | 1302 | 136 | 0.597 |
| Paris | 1.6 | (1.3–1.8) | 1846 | 0.8 | (0.6–1.1) | 890 | −787 | 0.005 |
| London | 0.8 | (0.6–0.9) | 1486 | 0.7 | (0.5–0.9) | 1080 | −162 | 0.554 |
| Stockholm | 0.7 | (0.3–1.0) | 247 | 0.7 | (0.4–1.0) | 252 | 17 | 0.889 |
| Helsinki | 0.1 | (−0.5–0.6) | 14 | 0.9 | (0.4–1.4) | 202 | 188 | 0.115 |

4. Discussion
5. Conclusions
Supplementary Material
| City | Year of Activation | Level (Responsible Body) | Warning System (Model Type) | Susceptible Subgroups | Information Campaign, Professional Training Programmes | Emergency Actions During Heat Waves | Health Surveillance (Indicator; Timing) | Evaluation of Preventive Measures |
|---|---|---|---|---|---|---|---|---|
| Valencia | 2004 | national (Ministry of Health) | Yes (Maximum apparent temperature-mortality regression model) | elderly, chronically ill, pharmaceutical treatments, persons with cognitive diseases | general population, susceptible groups, athletes, social and health workers | reinforced communication to health professionals, social services, general population; additional measures for targeted groups (home visits by the social workers, telemonitoring) | Yes (mortality; daily) | |
| Barcelona | 2004 | national (Ministry of Health) regional (Dep.t of Health of Autonomous region) | Yes (Threshold model based on temperature (Tappmax)-mortality relationship) | children, elderly, chronically ill, people in pharmaceutical treatment, disabled, isolated people, pregnant women | general population, susceptible groups, athletes, social and health workers | opening cooling spaces, postponing non-urgent surgery, protected discharges | Yes (mortality; daily) | |
| Athens | No | general population, susceptible groups | No | |||||
| Rome | 2004 | national (Ministry of Health) regional (regional Department of Health Care) | Yes (Threshold model based on temperature (Tappmax)-mortality relationship; Air mass based model) | elderly, isolated people, chronically ill, people in pharmaceutical treatments, pregnant women, workers in construction, transport and mining sectors | general population, susceptible groups, social and health workers | opening cooling spaces, postponing non-urgent surgery, protected discharges, mobilise community and voluntary support; additional measures for targeted groups (home visits by the family doctors) | Yes (mortality, daily; emergency visits, weekly for emergency visits) | before and after study comparing the health effects of high temperatures (Schifano 2012) evaluation of GPs surveillance comparing tempertuare effects on sruveilled/not surveilled (Bargagli 2011) |
| Budapest | 2006 | national (National Health Service) | Yes (climatological tempertuare threshold model) | people in health facilities, homeless people | general population | reinforced social care services, intensified air conditioning in health care facilities, providing water in public areas especially to homeless people | Yes (mortality, ambulance calls; daily) | |
| Paris | 2004 | national (Ministry of Health) | Yes (Threshold model based on temperature (tmin and Tmax)-mortality relationship) | children, elderly, chronically ill, people with cognitive troubles, imprisoned people, phamaceutical treatments, disabled, isolated people, drug/alcohol abusers, homeless people | general population, susceptible groups, social and health workers | activation of free help line, opening cooling spaces, emergency plans in hospitals and retirement homes, reinforce the patrols of the Samu Social (for homeless people) | Yes (mortality, emergency visits; daily) | before and after study comparing the health effects of heatwaves (Fouillet 2008) |
| London | 2004 | national (National Health Service) | Yes (climatological tempertaure threshold models -Tmax Tmin) | children, elderly, chronically ill, disabled, drug/alcohol abusers | general population, susceptible groups, Muslims during Ramadan, social and health workers | media alerts, support organisations to reduce unnecessary travel, review safety of public events, mobilise community and voluntary support | Yes (mortality, emergency visits and NHS 111 calls; weekly, during heat waves daily) | |
| Stockholm | general population | |||||||
| Helsinki | general population, health workers |
Acknowledgments
Author Contributions
Conflicts of Interest
References
- World Meteorological Organization (WMO). Atlas of Mortality and Economic Losses from Weather, Climate and Water Extremes (1970–2012); World Meteorological Organization: Geneva, Switzerland, 2014. [Google Scholar]
- Baccini, M.; Biggeri, A.; Accetta, G.; Kosatsky, T.; Katsouyanni, K.; Analitis, A.; Anderson, H.R.; Bisanti, L.; D’Ippoliti, D.; Danova, J.; et al. Heat effects on mortality in 15 European cities. Epidemiology 2008, 19, 711–719. [Google Scholar] [CrossRef] [PubMed]
- D’Ippoliti, D.; Michelozzi, P.; Marino, C.; de’Donato, F.; Menne, B.; Katsouyanni, K.; Ursula, K.; Antonis, A.; Mercedes, M.-R.; Anna, P.; et al. The impact of heat waves on mortality in 9 European cities: Results from the EuroHEAT project. Environ. Health 2010, 9. [Google Scholar] [CrossRef] [PubMed]
- Kovats, R.S.; Valentini, R.; Bouwer, L.M.; Georgopoulou, E.; Jacob, D.; Martin, E.; Rounsevell, M.; Soussana, J.-F. Europe. In Climate Change 2014: Impacts, Adaptation, and Vulnerability. Part B: Regional Aspects; Barros, V.R., Field, C.B., Dokken, D.J., Mastrandrea, M.D., Mach, K.J., Bilir, T.E., Chatterjee, M., Ebi, K.L., Estrada, Y.O., Genova, R.C., et al., Eds.; Cambridge University Press: Cambridge, UK; New York, NY, USA, 2014. [Google Scholar]
- Basu, R. High ambient temperature and mortality: A review of epidemiologic studies from 2001 to 2008. Environ. Health 2009, 8. [Google Scholar] [CrossRef] [PubMed]
- Anderson, B.G.; Bell, M.L. Weather-related mortality: How heat, cold, and heat waves affect mortality in the United States. Epidemiology 2009, 20, 205–213. [Google Scholar] [CrossRef] [PubMed]
- Hajat, S.; Kosatky, T. Heat-related mortality: A review and exploration of heterogeneity. J. Epidemiol. Commun. Health 2010, 64, 753–760. [Google Scholar] [CrossRef] [PubMed]
- Benmarhnia, T.; Deguen, S.; Kaufman, J.S.; Smargiassi, A. Vulnerability to heat-related mortality. Epidemiology 2015, 26, 781–793. [Google Scholar] [CrossRef] [PubMed]
- Ballester, J.; Robine, J.-M.; Herrmann, F.R.; Rodó, X. Long-term projections and acclimatization scenarios of temperature-related mortality in Europe. Nature Commun. 2011, 2. [Google Scholar] [CrossRef] [PubMed]
- Lowe, D.; Ebi, K.L.; Forsberg, B. Heatwave early warning systems and adaptation advice to reduce human health consequences of heatwaves. Int. J. Environ. Res. Public Health 2011, 8, 4623–4648. [Google Scholar] [CrossRef] [PubMed]
- Bittner, M.-I.; Matthies, E.F.; Dalbokova, D.; Menne, B. Are European countries prepared for the next big heat-wave? European J. Public Health 2014, 24, 615–619. [Google Scholar] [CrossRef] [PubMed]
- Davis, R.E.; Knappenberger, P.C.; Novicoff, W.M.; Michaels, P.J. Decadal changes in summer mortality in U.S. cities. Int. J. Biometeorol. 2013, 47, 166–175. [Google Scholar]
- Barnett, A.G. Temperature and cardiovascular deaths in the US elderly: Changes over time. Epidemiology 2007, 18, 369–372. [Google Scholar] [CrossRef] [PubMed]
- Sheridan, S.C.; Kalkstein, A.J.; Kalkstein, L.S. Trends in heat-related mortality in the United States, 1975–2004. Natur. Hazards 2009, 50, 145–160. [Google Scholar] [CrossRef]
- Bobb, J.F.; Peng, R.D.; Bell, M.L.; Dominici, F. Heat-related mortality and adaptation to heat in the United States. Environ. Health Perspect. 2014. [Google Scholar] [CrossRef] [PubMed]
- Gasparrini, A.; Guo, Y.; Hashizume, M.; Kinney, P.L.; Petkova, E.P.; Lavigne, E.; Zanobetti, A.; Schwartz, J.D.; Tobias, A.; Leone, M.; et al. Temporal variation in heat-mortality associations: A multicountry study. Environ. Health Perspect. 2015. [Google Scholar] [CrossRef] [PubMed] [Green Version]
- Nordio, F.; Zanobetti, A.; Colicino, E.; Kloog, I.; Schwartz, J. Changing patterns of the temperature–mortality association by time and location in the US, and implications for climate change. Environ. Int. 2015, 81, 80–86. [Google Scholar] [PubMed]
- Fouillet, A.; Rey, G.; Wagner, V.; Laaidi, K.; Empereur-Bissonnet, P.; Le Tertre, A.; Frayssinet, P.; Bessemoulin, P.; Laurent, F.; De Crouy-Chanel, P.; et al. Has the impact of heat waves on mortality changed in France since the European heat wave of summer 2003? A study of the 2006 heat wave. Int. J. Epidemiol. 2008, 37, 309–317. [Google Scholar] [CrossRef] [PubMed]
- Kyselý, J.; Plavcová, E. Declining impacts of hot spells on mortality in the Czech Republic, 1986–2009: Adaptation to climate change? Climatic Change 2012, 113, 437–453. [Google Scholar] [CrossRef]
- Schifano, P.; Leone, M.; De Sario, M.; de’Donato, F.; Bargagli, A.; D’Ippoliti, D.; Marino, C.; Michelozzi, P. Changes in the effects of heat on mortality among the elderly from 1998–2010: Results from a multicenter time series study in Italy. Environ. Health 2012, 11. [Google Scholar] [CrossRef] [PubMed]
- Morabito, M.; Profili, F.; Crisci, A.; Francesconi, P.; Gensini, G.F.; Orlandini, S. Heat-related mortality in the Florentine area (Italy) before and after the exceptional 2003 heat wave in Europe: An improved public health response? Int. J. Biometeorol. 2012, 56, 801–810. [Google Scholar] [CrossRef] [PubMed]
- Heudorf, U.; Schade, M. Heat waves and mortality in Frankfurt am Main, Germany, 2003–2013: What effect do heat-health action plans and the heat warning system have? Zeitschrift Für Gerontologie Und Geriatrie 2014, 47, 475–482. [Google Scholar] [CrossRef] [PubMed]
- Barnett, A.G.; Tong, S.; Clements, A.C.A. What measure of temperature is the best predictor of mortality? Environ. Res. 2010, 110, 604–611. [Google Scholar] [CrossRef] [PubMed] [Green Version]
- Katsouyanni, K.; Schwartz, J.; Spix, C.; Touloumi, G.; Zmirou, D.; Zanobetti, A.; Wojtyniak, B.; Vonk, J.M.; Tobias, A.; Pönkä, A. Short-term effects of air pollution on health: A European approach using epidemiologic time series data: The APHEA protocol. J. Epidemiol. Commun. Health 1996, 50 (Suppl. 1), S12–S18. [Google Scholar] [CrossRef]
- Gasparrini, A.; Armstrong, B.; Kenward, M.G. Distributed lag non-linear models. Stat. Med. 2010, 29, 2224–2234. [Google Scholar] [CrossRef] [PubMed]
- Stafoggia, M.; Forastiere, F.; Agostini, D.; Biggeri, A.; Bisanti, L.; Cadum, E.; Caranci, N.; de’Donato, F.; De Lisio, S.; De Maria, M.; et al. Vulnerability to heat-related mortality: A multicity, population-based, case-crossover analysis. Epidemiology 2006, 17, 315–323. [Google Scholar] [CrossRef] [PubMed]
- Gasparrini, A.; Leone, M. Attributable risk from distributed lag models. BMC Med. Res. Methodol. 2014, 14. [Google Scholar] [CrossRef] [PubMed]
- WHO Regional Office for Europe. Heat-Health Action Plans Guidance; World Health Organization: Copenhagen, Denmark, 2008. [Google Scholar]
- Boeckmann, M.; Rohn, I. Is planned adaptation to heat reducing heat-related mortality and illness? A systematic review. BMC Public Health 2014, 14. [Google Scholar] [CrossRef] [PubMed]
- Toloo, G.; FitzGerald, G.; Aitken, P.; Verrall, K.; Tong, S. Evaluating the effectiveness of heat warning systems: Systematic review of epidemiological evidence. Int. J. Public Health 2013, 58, 667–681. [Google Scholar] [CrossRef] [PubMed]
- Stallings-Smith, S.; Zeka, A.; Goodman, P.; Kabir, Z.; Clancy, L. Reductions in cardiovascular, cerebrovascular, and respiratory mortality following the national Irish smoking ban: Interrupted time-series analysis. PLoS ONE 2013, 8. [Google Scholar] [CrossRef]
- Medina-Ramón, M.; Schwartz, J. Temperature, temperature extremes, and mortality: A study of acclimatisation and effect modification in 50 US cities. Occup. Environ. Med. 2007, 64, 827–833. [Google Scholar] [CrossRef] [PubMed]
- Ostro, B.; Rauch, S.; Green, R.; Malig, B.; Basu, R. The Effects of temperature and use of air conditioning on hospitalizations. Am. J. Epidemiol. 2010, 172, 1053–1061. [Google Scholar] [CrossRef] [PubMed]
- O’Neill, M.S.; Zanobetti, A.; Schwartz, J. Modifiers of the temperature and mortality association in seven US cities. Am. J. Epidemiol. 2003, 157, 1074–1082. [Google Scholar] [CrossRef] [PubMed]
- Zanobetti, A.; O’Neill, M.S.; Gronlund, C.J.; Schwartz, J.D. Susceptibility to mortality in weather extremes: Effect modification by personal and small-area characteristics. Epidemiology 2013, 24, 809–819. [Google Scholar] [CrossRef] [PubMed]
- Schifano, P.; Cappai, G.; De Sario, M.; Michelozzi, P.; Marino, C.; Bargagli, A.; Perucci, C.A. Susceptibility to heat wave-related mortality: A follow-up study of a cohort of elderly in Rome. Environ. Health 2009, 8. [Google Scholar] [CrossRef] [PubMed]
- Oudin, A.D.; Schifano, P.; Asta, F.; Lallo, A.; Michelozzi, P.; Rocklöv, J.; Forsberg, B. The effect of heat waves on mortality in susceptible groups: A cohort study of a Mediterranean and a northern European City. Environ. Health 2015, 14. [Google Scholar] [CrossRef]
- Gronlund, C.J.; Berrocal, V.J.; White-Newsome, J.L.; Conlon, K.C.; O’Neill, M.S. Vulnerability to extreme heat by socio-demographic characteristics and area green space among the elderly in Michigan, 1990–2007. Environ. Res. 2015, 136, 449–461. [Google Scholar] [CrossRef] [PubMed]
- O’Leary, J.M.; Siddiqi, O.K.; de Ferranti, S.; Landzberg, M.J.; Opotowsky, A.R. The changing demographics of congenital heart disease hospitalizations in the United States, 1998 through 2010. JAMA 2013, 309, 984–986. [Google Scholar] [CrossRef] [PubMed]
- Price, D.B.; Yawn, B.P.; Jones, R.C.M. Improving the differential diagnosis of chronic obstructive pulmonary disease in primary care. Mayo Clinic Proc. 2010, 85, 1122–1129. [Google Scholar] [CrossRef] [PubMed]
- European Union. Eurostat Regional Yearbook 2014. Available online: http://ec.europa.eu/eurostat/documents/3217494/5786129/KS-HA-14-001-00-EN.PDF (accessed on 2 December 2015).
- The Crisis, Hospitals and Healthcare. HOPE Report. Available online: http://www.hope.be/05eventsandpublications/docpublications/86_crisis/86_HOPE-The_Crisis_Hospitals_Healthcare_April_2011.pdf (accessed on 2 December 2015).
© 2015 by the authors; licensee MDPI, Basel, Switzerland. This article is an open access article distributed under the terms and conditions of the Creative Commons by Attribution (CC-BY) license (http://creativecommons.org/licenses/by/4.0/).
Share and Cite
De’ Donato, F.K.; Leone, M.; Scortichini, M.; De Sario, M.; Katsouyanni, K.; Lanki, T.; Basagaña, X.; Ballester, F.; Åström, C.; Paldy, A.; et al. Changes in the Effect of Heat on Mortality in the Last 20 Years in Nine European Cities. Results from the PHASE Project. Int. J. Environ. Res. Public Health 2015, 12, 15567-15583. https://doi.org/10.3390/ijerph121215006
De’ Donato FK, Leone M, Scortichini M, De Sario M, Katsouyanni K, Lanki T, Basagaña X, Ballester F, Åström C, Paldy A, et al. Changes in the Effect of Heat on Mortality in the Last 20 Years in Nine European Cities. Results from the PHASE Project. International Journal of Environmental Research and Public Health. 2015; 12(12):15567-15583. https://doi.org/10.3390/ijerph121215006
Chicago/Turabian StyleDe’ Donato, Francesca K., Michela Leone, Matteo Scortichini, Manuela De Sario, Klea Katsouyanni, Timo Lanki, Xavier Basagaña, Ferran Ballester, Christofer Åström, Anna Paldy, and et al. 2015. "Changes in the Effect of Heat on Mortality in the Last 20 Years in Nine European Cities. Results from the PHASE Project" International Journal of Environmental Research and Public Health 12, no. 12: 15567-15583. https://doi.org/10.3390/ijerph121215006