Article

Towards Investigating Global Warming Impact on Human Health Using Derivatives of Photoplethysmogram Signals

1
Electrical and Computer Engineering in Medicine Group, University of British Columbia and BC Children’s Hospital, Vancouver, BC V6H 3N1, Canada
2
Department of Computing Science, University of Alberta, Edmonton, AB T6G 2E8, Canada
3
National Critical Care and Trauma Response Centre, Darwin, NT 0810, Australia
4
D-Lab, Massachusetts Institute of Technology, Boston, MA 02139, USA
5
School of Electrical and Electronic Engineering, University of Adelaide, Adelaide, SA 5005, Australia
6
Graduate School of Biomedical Engineering, UNSW, Sydney, NSW 2052, Australia
*
Author to whom correspondence should be addressed.
Int. J. Environ. Res. Public Health 2015, 12(10), 12776-12791; https://doi.org/10.3390/ijerph121012776
Submission received: 11 August 2015 / Revised: 29 September 2015 / Accepted: 8 October 2015 / Published: 14 October 2015

Abstract

:
Recent clinical studies show that the contour of the photoplethysmogram (PPG) wave contains valuable information for characterizing cardiovascular activity. However, analyzing the PPG wave contour is difficult; therefore, researchers have applied first or higher order derivatives to emphasize and conveniently quantify subtle changes in the filtered PPG contour. Our hypothesis is that analyzing the whole PPG recording rather than each PPG wave contour or on a beat-by-beat basis can detect heat-stressed subjects and that, consequently, we will be able to investigate the impact of global warming on human health. Here, we explore the most suitable derivative order for heat stress assessment based on the energy and entropy of the whole PPG recording. The results of our study indicate that the use of the entropy of the seventh derivative of the filtered PPG signal shows promising results in detecting heat stress using 20-second recordings, with an overall accuracy of 71.6%. Moreover, the combination of the entropy of the seventh derivative of the filtered PPG signal with the root mean square of successive differences, or RMSSD (a traditional heart rate variability index of heat stress), improved the detection of heat stress to 88.9% accuracy.

1. Introduction

According to the Intergovernmental Panel on Climatic Change (IPCC), accelerated global warming is predicted due to increasing anthropogenic greenhouse gas emissions. There is a 3% increase in the death rates per 1 °C increase in temperature for all causes of mortality for hot and arid regions where the temperature of the warmest months exceeds 30 °C [1]. Climate change is anticipated to have a long-term impact on human health. The spread of heart diseases may contribute to high mortality, along with heat-related deaths. The early detection of heat stress-related diseases in individuals who are unaware of their existence is thus important. The earlier complications are detected in patients with known heart disease who are not yet symptomatic, the more successful the treatment [2].
The literature identifies two main heat stress indices: body core temperature (BCT) and heart rate variability (HRV). In terms of BCT, in 2002, the National Athletic Trainers’ Association recommended measuring rectal temperature as a standard criterion for recognizing exertional heat stroke [3]. Five years later, Casa et al. [4] found that the gastrointestinal temperature was the only measurement that accurately assessed BCT. Moreover, they found that oral, axillary, aural, temporal and field forehead temperatures were significantly different from the rectal temperature and, therefore, are considered invalid for assessing hyperthermia in individuals exercising outdoors in the heat.
Regarding HRV, recent studies [5,6,7] have reported that when subjects are continuously subjected to dry heat, the heat induces a stress response indicated by a significantly increased heart rate (HR). This increase in HR appears to occur via a significant reduction in parasympathetic control of the HR, indicated by reduced HRV.
Using these two heat stress indices is not practical, as measuring the BCT has an invasive nature, and calculating HRV requires electrocardiogram signals recorded over a long time. Therefore, there is a need to develop an easier and non-invasive method to aid in the management of human resources engaged in critical activities and to potentially prevent heat-related deaths. Accurate and simple-to-measure diagnostic biosignals are desirable, such as fingertip photoplethysmogram (PPG) signals. Advances in photoplethysmography may potentially lead to a new complementary tool for the management of vascular heat-related diseases.
Although the clinical significance of the PPG wave contour has been investigated over many decades [8,9,10,11,12], there is still a paucity of studies analyzing the PPG signal recording as a whole without analyzing the waveforms on a beat-by-beat basis. In the literature, analyzing the PPG is traditionally carried out on a beat-by-beat basis [13,14,15,16,17,18]; however, analyzing the PPG wave contour is difficult [19], as PPG signals usually contain different types of noise, such as power-line interference, low amplitude waveforms, low-frequency baseline fluctuations and irregular heart beats [20]. Therefore, researchers have applied the first derivative [21,22], second derivative [23,24,25,26,27], third derivative [28] and fourth derivative [29] to accentuate the subtle changes in the PPG contour. In this paper, we will examine whether the higher derivatives of unfiltered and filtered PPG signals contain useful information for heat stress assessment.

2. Materials and Methods

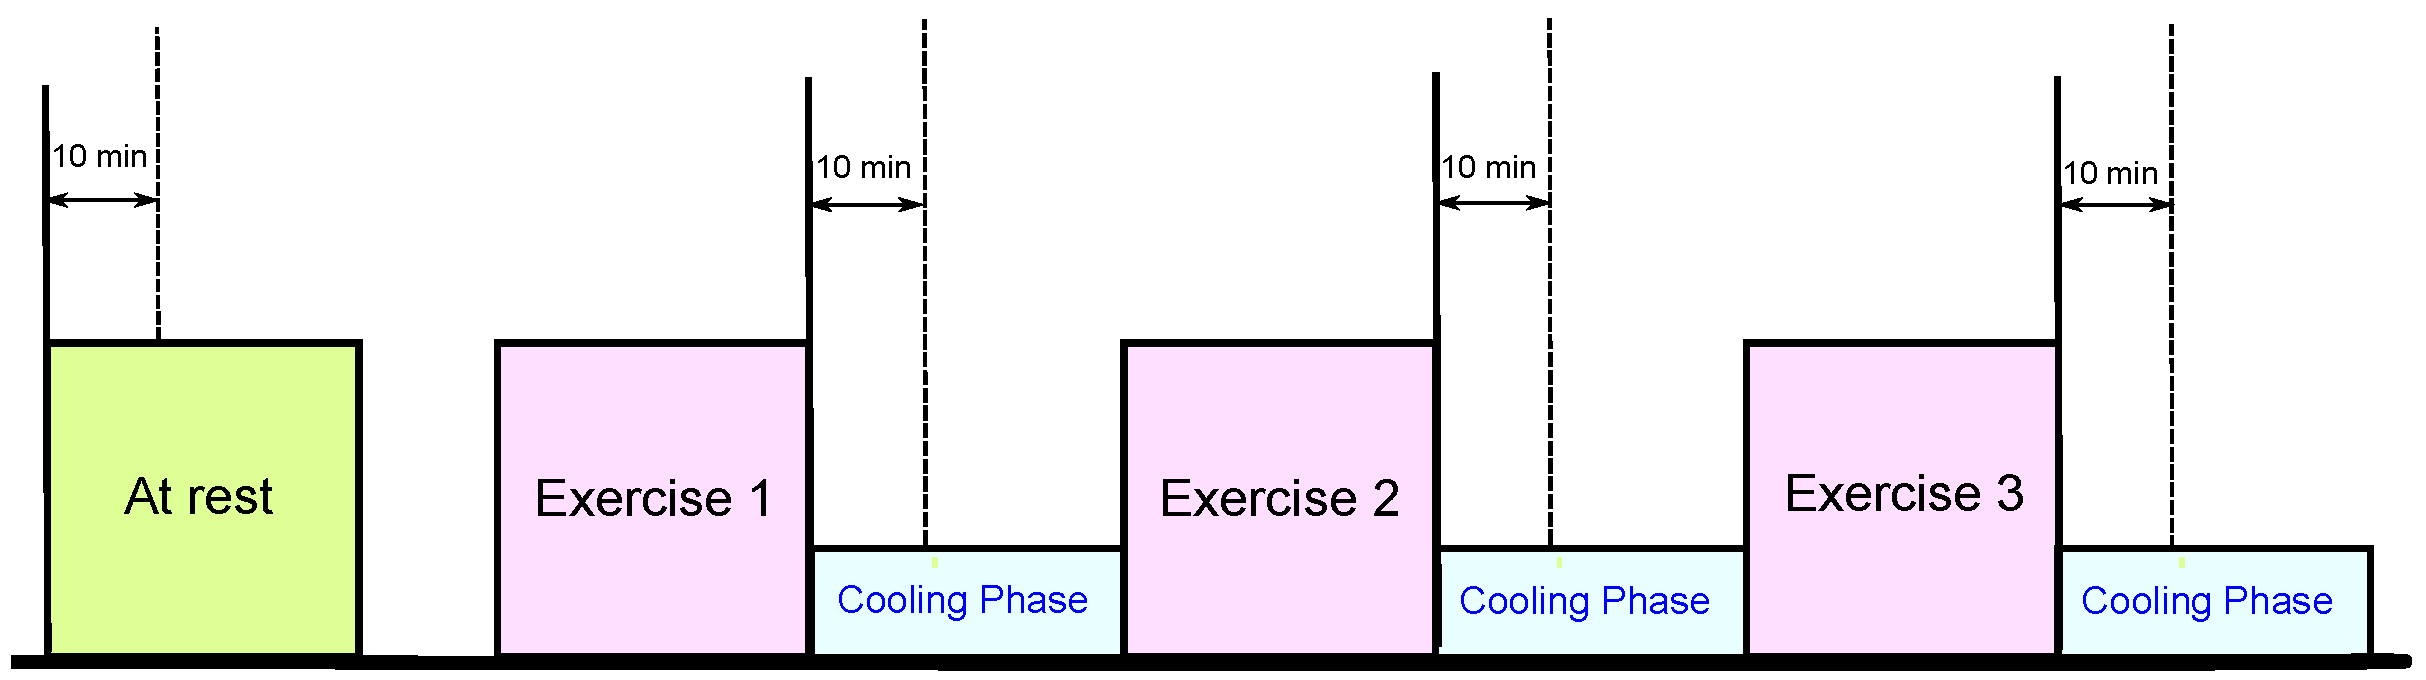
2.1. Data Collection

The heat stress PPG data for this study were collected as part of a National Critical Care and Trauma Response Centre (NCCTRC) project to assess the physiological and perceptual responses of emergency responders to simulated chemical, biological and radiological (CBR) incidents in tropical environmental conditions to compare the efficacy of various cooling methods. The background of the NCCTRC’s thermal research can be found in [30]. Forty healthy, heat-acclimatized emergency responders (30 males and 10 females) with a median ± interquartile range age of 34.0 ± 9.0 years volunteered and provided written informed consent to participate in this study, which was approved by the Human Research Ethics Committee of the Northern Territory Department of Health and the Menzies School of Health Research. Participants undertook 30 min of triaging and resuscitating, transporting and decontaminating weighted manikins while wearing Level 3 personal protective equipment, which comprises a fully-enclosed, impermeable suit that includes boots, gloves, hood, face mask and respirator (SE400i, S.E.A. Group, Warriewood, Australia), followed by 30 min of rest and cooling to avoid overheating during the exercise. This protocol was repeated three times with PPG data collected during each rest period, as shown in Figure 1. Here, PPG data were measured using a photoplethysmography-equipped device (Salus APG, Japan) at a sampling rate of 367 Hz, with the sensor located at the cuticle of the second digit of the left hand. Measurements were taken for 20 s while participants were resting in a seated position. Note that monitoring PPG during exercise was not possible due to the personal protective equipment (gloves) required to perform physical tasks.
Figure 1. Measurement protocol. The duration of the whole experiment was approximately 4 h; each exercise consumed approximately 30 min, while the photoplethysmogram (PPG) signals were collected during the 30-minute break of each exercise.
Ijerph 12 12776 g001
The participants were normotensive (mean systolic blood pressure (BP) of 129.3 mmHg, range 110–165 mmHg) and had no known cardiovascular, neurological or respiratory disease. The range of systolic BP exceeds the usual normotensive range. However, the vast majority of guidelines recommend that hypertension be identified when systolic blood pressure exceeds 140 mmHg [31]. Therefore, based on this, the mean systolic BP was within the normotensive range.
Prior to the experiment, the participants provided information about their physical condition. Physical information, such as height and weight, was also measured for a reference and is summarized in Table 1. Alcohol consumption and smoking were prohibited during 24 h and 2 h before experimentation, respectively. For signal analysis, MATLAB 2010b (The MathWorks, Inc., Natick, MA, USA) was used. Blood pressure measurements were conducted on the right arm using the HEM-907 (Omron Healthcare, Kyoto, Japan) digital automatic BP monitor. We collected only one measurement; the procedure is repeated if the BP values were extremely high or low. Note that the blood pressure monitor is checked and calibrated annually.
Table 1. Data for the participants in this study. Here, IQR stands for interquartile range.
CharacteristicMedianIQR
Age (years)34.09.0
Body Mass (kg)80.215.9
Height (cm)18010
Body Mass Index ( kg · m - 2 )26.23.8
Resting Systolic Blood Pressure (mmHg)127.520.0
Resting Heart Rate (bpm)76.017.5
Resting Core Temperature (°C)37.40.6
After Exercise 1 Systolic Blood Pressure (mmHg)140.025.0
After Exercise 1 Heart Rate (bpm)132.044.3
After Exercise 1 Core Temperature (°C)38.30.8
After Exercise 2 Systolic Blood Pressure (mmHg)141.030.0
After Exercise 2 Heart Rate (bpm)145.540.3
After Exercise 2 Core Temperature (°C)38.21.2
After Exercise 3 Systolic Blood Pressure (mmHg)130.021.5
After Exercise 3 Heart Rate (bpm)143.040.2
After Exercise 3 Core Temperature (°C)38.01.2

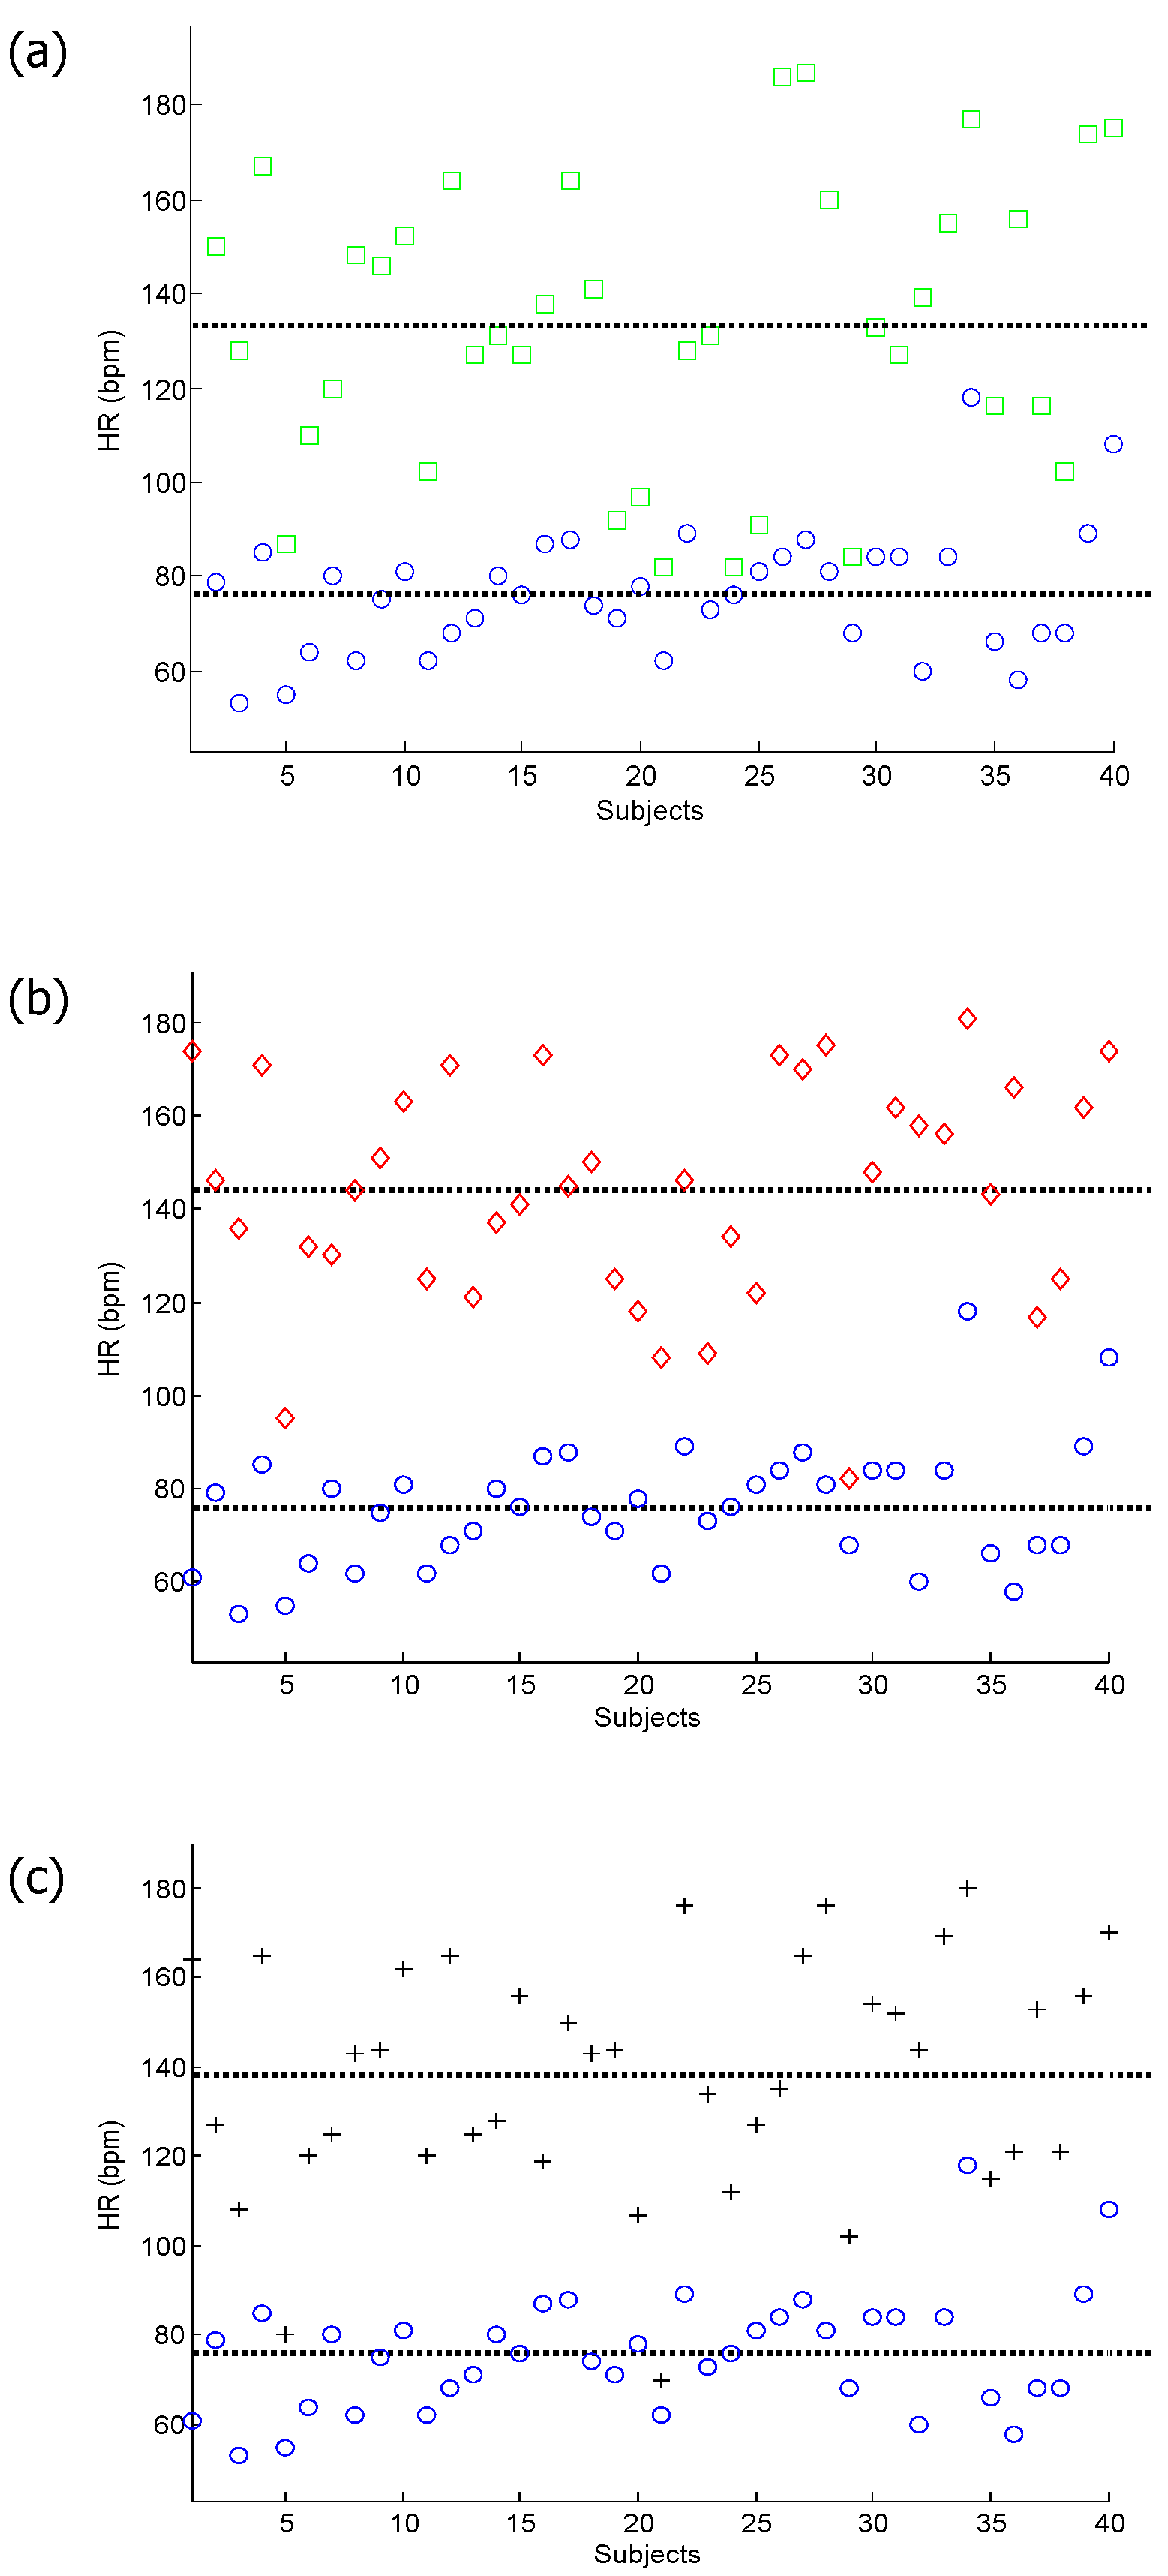
2.2. Body Core Temperature

An ingestible telemetric temperature sensor (CorTemp 100, HTI Technologies, Florida, MI, USA) was used to measure BCT by transmitting a signal proportional to the temperature of the gastrointestinal tract to a handheld receiver. Once located in the gastrointestinal tract, the thermosensitive pill is a valid index of core temperature when referenced to rectal or esophageal temperature [32,33].
Participants ingested a core temperature pill with fluid prior to breakfast, which preceded the commencement of data collection by approximately 4 h. This time frame was adopted to allow the pill to empty from the stomach and enter the small intestine while minimizing the risk of the pill being emptied from the body prior to the completion of the study [32]. To control for the possibility of local cooling of the telemetry pill via the ingestion of fluids and/or crushed ice, subjects were excluded from the study if gastrointestinal temperature was less than 35.5 °C and/or decreased by 2 °C in any 5-min period during the rest phase. Note that if the pill was located in the stomach, a rapid decrease in pill temperature would occur, exceeding the 2 °C/5 min change tolerated within the experiment. If that occurred, the data for that participant were excluded from the study. Thus, we were able to confirm non-invasively that the pills were not located in the stomach and had therefore passed through the pyloric sphincter into the intestines.

3. Methodology

The PPG and its various derivatives define an ordered hierarchy of meaningful physiologic concepts of blood movement. There are special names for the derivatives of position (the first derivative is called velocity; the second derivative is called acceleration; etc.). In this study, our goal is to systematically examine the derivatives of the PPG signal to determine the most informative derivative that can be used for heat stress assessment. In addition, we investigate whether filtering the PPG signals potentially improves the heat stress analysis.

3.1. Derivatives

We examine the utility of employing derivatives of the PPG signal using basic differentiation of the signal, which is defined as follows:
S i [ n ] = d S d t | t = n T = 1 T ( S i - 1 [ n ] - S i - 1 [ n - 1 ] ) ,
where T is the sampling interval and equals the reciprocal of the sampling frequency, n is the number of data points, i [ 1 , 20 ] is the derivative step and S 0 is the unfiltered PPG signal. The basic first differentiation, shown in Equation (1), is applied recursively up to 20 times to unfiltered and filtered PPG signals. The filtered PPG signal is the output of a second order bandpass Butterworth filter from 0.5–7 Hz of the unfiltered PPG signal, based on our previous optimization over different frequency bands [34].

3.2. Feature Extraction

We extracted from each subject a total of 80 features (2 features × 2 signal status flags × 20 derivative orders) at the four time points (control and three interventions), where the signal status can be either before or after bandpass filtering. The extracted features are the normalized energy and the normalized Shannon entropy [35], as follows:
E j = 1 N n = 1 N S j [ n ] 2 ,
P j = - 1 N n = 1 N S j [ n ] 2 log e ( S j [ n ] 2 ) ,
where n is the number of data points, j [ 0 , 20 ] is the derivative step, E 0 is the energy of the unfiltered PPG signal ( S 0 ) and P 0 is the entropy of the unfiltered PPG signal ( S 0 ).

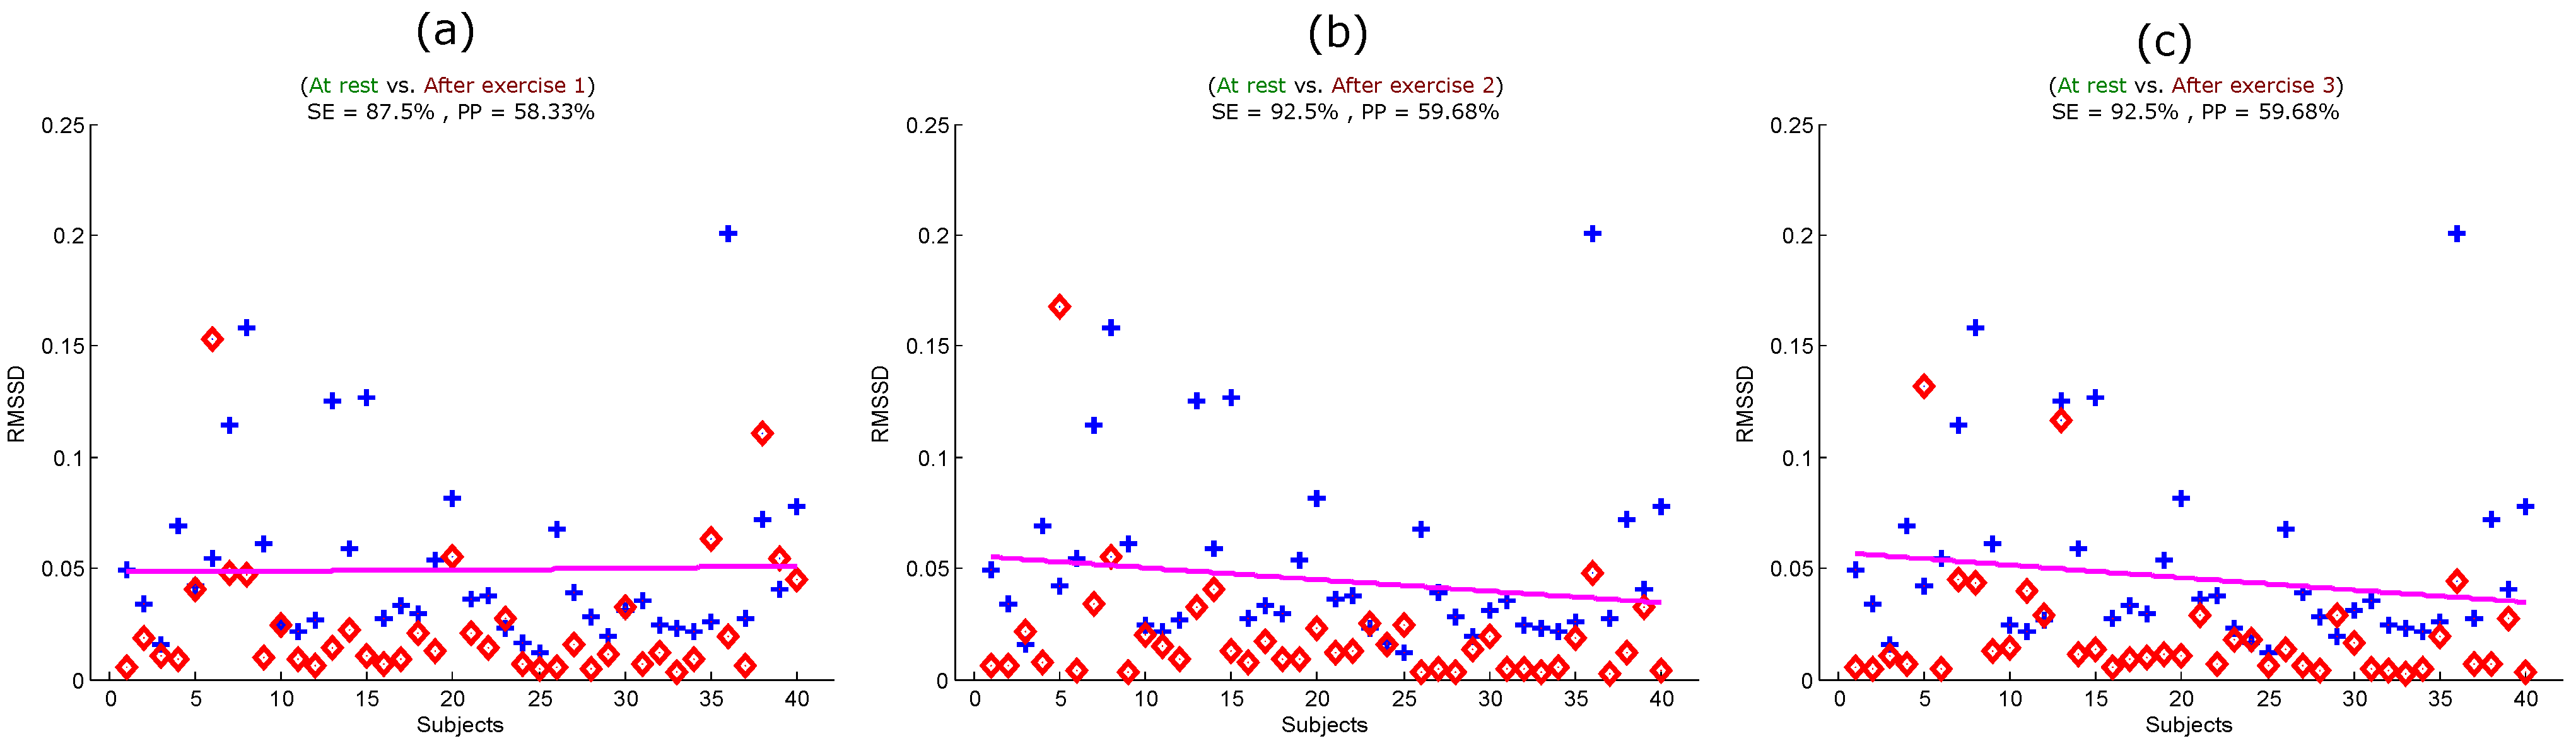
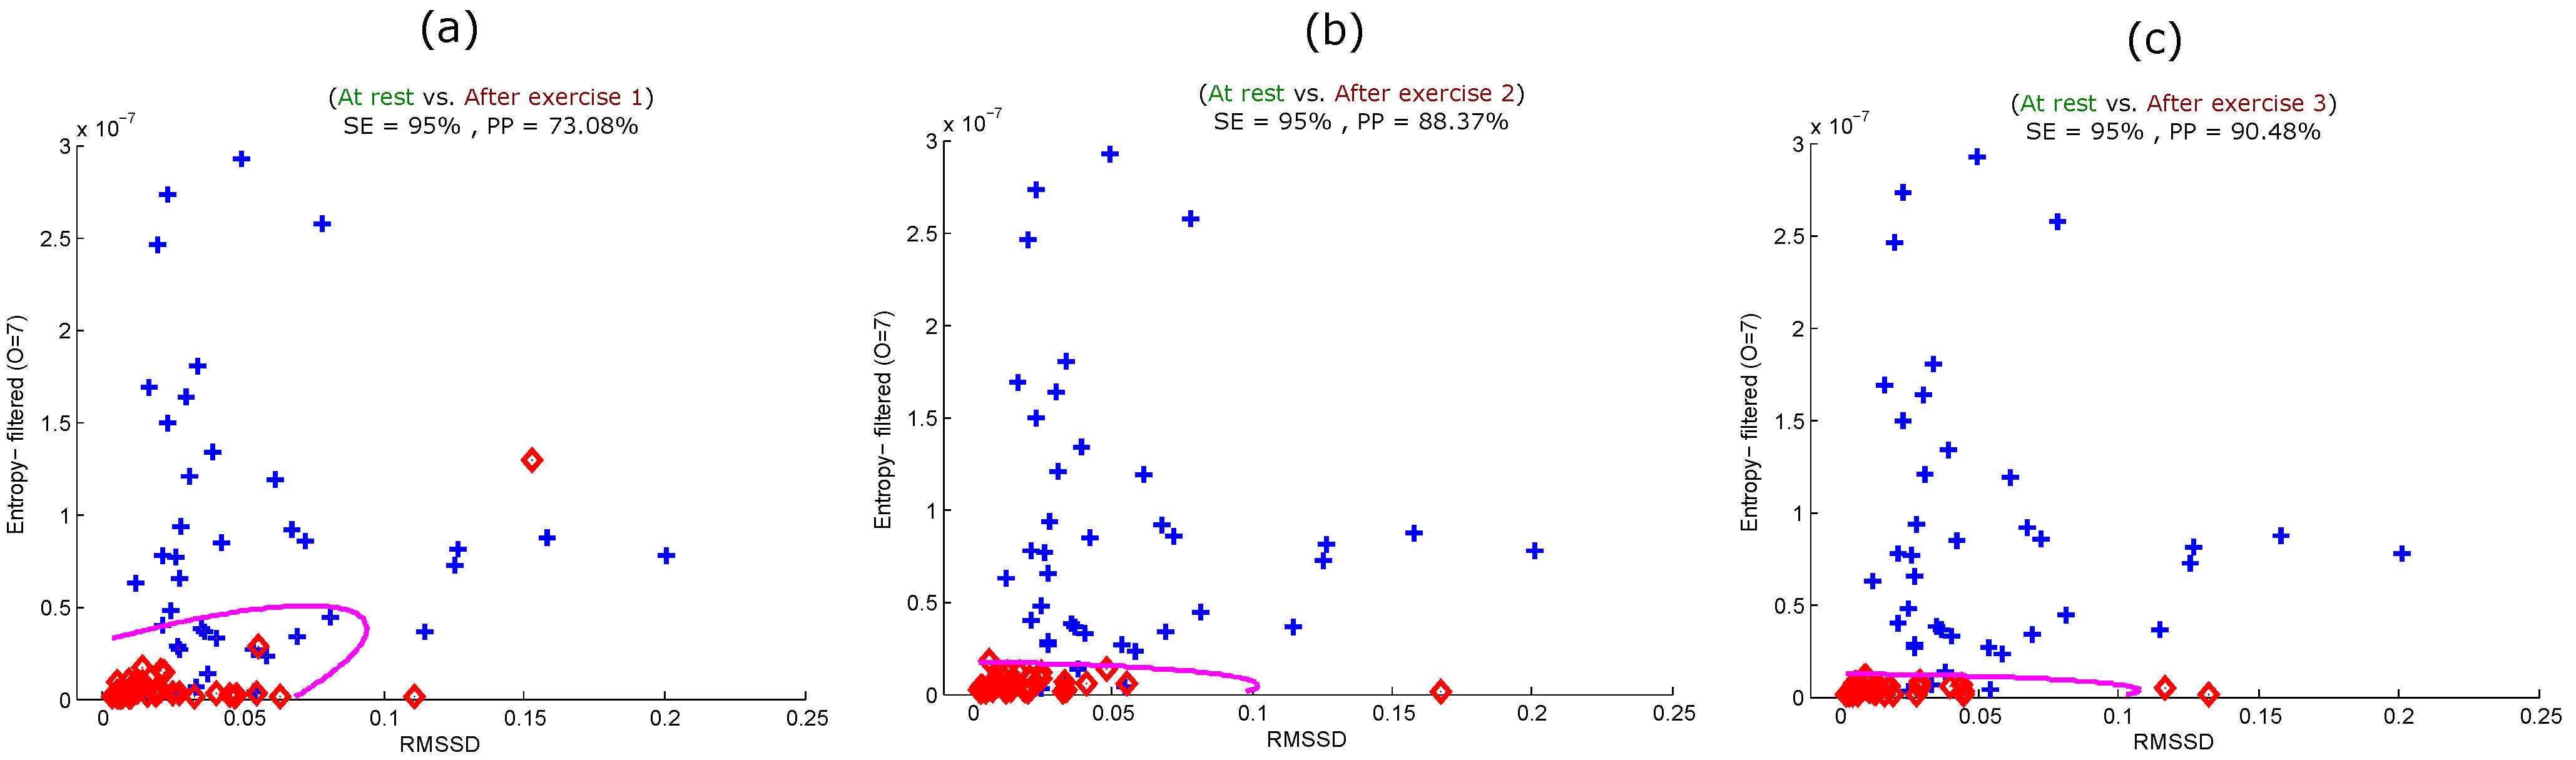
3.3. Statistical Analysis

We calculated each time domain feature (energy or entropy) for each PPG signal recording. As we had 40 subjects, each feature set contains 80 values. Each feature set consists of 40 values calculated from subjects measured before the simulated heat stress induction and 40 values calculated from subjects measured after the simulated heat stress induction. For each derivative order, we compared the values within each feature set by applying the two-sided Wilcoxon-Mann-Whitney test, and p 0.05 was considered significant. Because we considered all of these features simultaneously, the p-values need to be appropriately corrected by applying Bonferroni post-correction [36]. Because we are dealing with many different simultaneous tests (240 tests in total), it is more natural to try to control the false discovery (false positive) rate. Therefore, we used the Holm-Bonferroni method, as it controls the false positive rate and offers a simple test uniformly more powerful than the Bonferroni correction [37].
As the main objective of this research is to find the optimal derivative order for assessing simulated heat stress induction, we tested four classifiers: Mahalanobis distance, linear discriminant analysis (LDA), quadratic discriminant analysis (QDA) and the linear support vector machine (SVM). The classification rates were calculated using leave-one-out cross-validation. Two statistical measures were used for the output of the LDA analysis: sensitivity (SE), which was calculated using the formula TP / ( TP + FN ) , and positive predictivity (PP), which was calculated using the formula TP / ( TP + FP ) . In these formulas, TP is the number of true positives (subjects measured after simulated heat stress induction detected as subjects measured after simulated heat stress induction), FN is the number of false negatives (subjects measured after simulated heat stress induction have not been detected as subjects measured after simulated heat stress induction) and FP is the number of false positives (subjects measured before simulated heat stress induction detected as subjects measured after simulated heat stress induction). To compare the performance of the features given the small dataset in each classifier, we applied the F 1 score, which is defined as 2 × ( SE × PP ) / ( SE + PP ) . The overall accuracy (OA) is the average of the F 1 scores for all classifiers.

4. Results and Discussion

Increased HR is due to both the direct and indirect effects of heat stress. Direct effects include heated blood perfusing the sinoatrial node of the heart, triggering a more rapid depolarization and, thus, more contractions per minute, and indirect effects include increased cutaneous blood flow, a reduction in total peripheral resistance without adequate compensation by other vascular beds and less blood returning to the heart. Therefore, extra heart beats are required to maintain blood flow [38]. The HR is also increased by the previous physical exertion. Heat stress occurs during physical exertion in the heat (heat stroke is an acute syndrome caused by an excessive increase in BCT as a result of overloading or failure of the thermoregulatory system during exposure to heat stress).
The core temperature data confirm that the participants experienced substantial body heat storage. We would have seen a different HR response if we heated the participants without the use of exercise (sitting still in a sauna); however, that model has limited application to the assessment of heat stress in real-world settings. Fitness plays a role in HR recovery; those who are fitter have a finer regulation of blood flow and require fewer cardiac cycles per minute to restore the body to normal following exertion. Fitness was a constant in this study due to the same participants being assessed during each recovery period.
It is known that when subjects are continuously subjected to dry heat, the heat induces a stress response as indicated by a significantly increased HR [5]. This increase in HR appears to occur via a significant reduction in parasympathetic control of the HR, indicated by the reduced root mean square of the successive differences (RMSSD). By visual inspection in Figure 2, it is clear that the HRs are increased after simulated heat stress induction.
Figure 2. Analysis of the heart rate. (a) Heart rate for subjects measured before the simulated heat stress induction (at rest (blue circles)) against those measured after the first simulated heat stress induction (Exercise 1 (green squares)); (b) heart rate for subjects measured at rest against those measured after the second simulated heat stress induction (Exercise 2 (red diamond)); (c) heart rate for subjects measured at rest against those measured after the third simulated heat stress induction (Exercise 3 (black pluses)).
Ijerph 12 12776 g002
Moreover, the significant reduction of RMSSD in subjects measured after exercises, shown in Figure 3, confirms the heat stress impact. Note that the tachycardia reflects heat stress, not exercise, as the PPG was assessed during the rest period when BCT remained elevated, but HR had decreased.
Figure 3. Boxplot of the root mean square of successive differences (RMSSD) of PPG signals measured before and after simulated heat stress induction. Here, the p-value is calculated using the paired Mann–Whitney test ( p 0.05 was considered significant).
Ijerph 12 12776 g003
Here, the entropy and energy of different derivatives of 20-second PPG signals are calculated for 40 subjects measured before and after simulated heat stress induction. Based on the derivative optimization shown in Table 2, the results show that the second and third derivatives are optimal (the lowest p-value) when they are applied to the unfiltered PPG signals to calculate the energy and entropy features. It was not clear which derivative order is optimal for distinguishing between at rest and after exercise, as the lowest p-value was obtained by a range of different derivative orders from 8 to 20.
To determine which derivative order is more informative for calculating the energy and entropy to detect heat stress, we employed four classifiers: Mahalanobis distance, LDA, QDA and SVM with leave-one-out cross-validation. The OA of the four classifiers in detecting after exercise measurements is presented in Table 3. By applying this step, we can clearly differentiate between the derivative orders compared to the calculation of p-values shown in Table 2. The sixth order is optimal for detecting the heat stress using raw PPG signals, while the seventh order is optimal for detecting the heat stress using filtered PPG signals. The highest OA of the energy and entropy of the unfiltered PPG signals is 79.1% and 82.4%, respectively. The OA improved slightly after filtering the PPG signal to reach 84.8% and 86.2% for the energy and entropy features, respectively.
Table 2. Feature comparison in differentiating between before and after exercise measurements. The p-value of discriminating between before exercise (BE) and after three exercises (E1, E2 and E3) is calculated using the Mann-Whitney test. The average of the three p-values ( p ¯ ) is given in the last column of each feature. The lowest p ¯ of each feature is highlighted. Uncorrected p-values from the Mann-Whitney test, where * and ** indicate p 0.05 and p 0.005 , respectively; † indicates p-values that remain significant with a p 0.05 after post-correction (Bonferroni-Holm, α < 0.05 ).
Energy-UnfilteredEntropy-UnfilteredEnergy-FilteredEntropy-Filtered
Derivativep1p2p3 p ¯ p1p2p3 p ¯ p1p2p3 p ¯ p1p2p3 p ¯
Order(BE vs. E1)(BE vs. E2)(BE vs. E3)(BE vs. E1)(BE vs. E2)(BE vs. E3)(BE vs. E1)(BE vs. E2)(BE vs. E3)(BE vs. E1)(BE vs. E2)(BE vs. E3)
02.1 × 10 - 1 6.4 × 10 - 3 * * 1.1 × 10 - 2 * 7.5 × 10 - 2 2.5 × 10 - 1 2.6 × 10 - 1 1.9 × 10 - 2 * 1.8 × 10 - 1 1.4 × 10 - 1 8.4 × 10 - 3 * * 1.6 × 10 - 2 * 5.3 × 10 - 2 1.4 × 10 - 1 8.1 × 10 - 2 * 2.2 × 10 - 3 * * 7.3 × 10 - 2
16.1 × 10 - 1 2.9 × 10 - 1 9.6 × 10 - 1 6.2 × 10 - 1 9.7 × 10 - 1 9.0 × 10 - 2 * 5.3 × 10 - 1 5.3 × 10 - 1 1.2 × 10 - 2 * * 2.1 × 10 - 4 * * 9.7 × 10 - 5 * * 4.3 × 10 - 3 * * 1.5 × 10 - 2 * 1.9 × 10 - 4 * * 8.7 × 10 - 5 * * 5.1 × 10 - 3 * *
27.3 × 10 - 7 * * 6.5 × 10 - 8 * * 6.1 × 10 - 8 * * 2.8 × 10 - 7 * * 7.3 × 10 - 7 * * 6.5 × 10 - 8 * * 6.1 × 10 - 8 * * 2.8 × 10 - 7 * * 5.7 × 10 - 3 * * 1.0 × 10 - 4 * * 7.8 × 10 - 5 * * 2.0 × 10 - 3 * * 4.8 × 10 - 3 * * 6.9 × 10 - 5 * * 3.5 × 10 - 5 * * 1.6 × 10 - 3 * *
37.3 × 10 - 7 * * 6.5 × 10 - 8 * * 6.1 × 10 - 8 * * 2.8 × 10 - 7 * * 6.8 × 10 - 7 * * 6.5 × 10 - 8 * * 6.1 × 10 - 8 * * 2.7 × 10 - 7 * * 4.4 × 10 - 3 * * 4.9 × 10 - 5 * * 5.2 × 10 - 5 * * 1.5 × 10 - 3 * * 4.2 × 10 - 3 * * 4.6 × 10 - 5 * * 7.3 × 10 - 5 * * 1.4 × 10 - 3 * *
47.3 × 10 - 7 * * 6.5 × 10 - 8 * * 6.5 × 10 - 8 * * 2.9 × 10 - 7 * * 7.3 × 10 - 7 * * 6.5 × 10 - 8 * * 6.5 × 10 - 8 * * 2.9 × 10 - 7 * * 6.0 × 10 - 3 * * 5.2 × 10 - 5 * * 4.6 × 10 - 5 * * 2.0 × 10 - 3 * * 5.7 × 10 - 3 * * 6.2 × 10 - 5 * * 7.3 × 10 - 5 * * 2.0 × 10 - 3 * *
57.3 × 10 - 7 * * 8.2 × 10 - 8 * * 7.0 × 10 - 8 * * 2.9 × 10 - 7 * * 7.3 × 10 - 7 * * 8.2 × 10 - 8 * * 7.0 × 10 - 8 * * 2.9 × 10 - 7 * * 8.3 × 10 - 1 2.1 × 10 - 1 7.9 × 10 - 1 6.1 × 10 - 1 9.8 × 10 - 1 9.8 × 10 - 2 * 4.7 × 10 - 1 5.1 × 10 - 1
67.8 × 10 - 7 * * 8.8 × 10 - 8 * * 7.6 × 10 - 8 * * 3.2 × 10 - 7 * * 7.8 × 10 - 7 * * 8.8 × 10 - 8 * * 7.6 × 10 - 8 * * 3.2 × 10 - 7 * * 7.3 × 10 - 7 * * 9.5 × 10 - 8 * * 8.2 × 10 - 8 * * 3.0 × 10 - 7 * * 7.3 × 10 - 7 * * 8.8 × 10 - 8 * * 7.6 × 10 - 8 * * 3.0 × 10 - 7 * *
77.8 × 10 - 7 * * 1.0 × 10 - 7 * * 7.6 × 10 - 8 * * 3.2 × 10 - 7 * * 7.8 × 10 - 7 * * 1.0 × 10 - 7 * * 7.6 × 10 - 8 * * 3.2 × 10 - 7 * * 7.3 × 10 - 7 * * 7.0 × 10 - 8 * * 6.1 × 10 - 8 * * 2.9 × 10 - 7 * * 7.3 × 10 - 7 * * 7.0 × 10 - 8 * * 6.1 × 10 - 8 * * 2.9 × 10 - 7 * *
89.0 × 10 - 7 * * 1.3 × 10 - 7 * * 9.5 × 10 - 8 * * 3.7 × 10 - 7 * * 9.7 × 10 - 7 * * 1.3 × 10 - 7 * * 1.0 × 10 - 7 * * 4.0 × 10 - 7 * * 7.3 × 10 - 7 * * 6.5 × 10 - 8 * * 6.1 × 10 - 8 * * 2.8 × 10 - 7 * * 7.3 × 10 - 7 * * 6.5 × 10 - 8 * * 6.1 × 10 - 8 * * 2.8 × 10 - 7 * *
91.8 × 10 - 6 * * 7.6 × 10 - 7 * * 4.3 × 10 - 7 * * 1.0 × 10 - 6 * * 3.1 × 10 - 6 * * 1.4 × 10 - 6 * * 1.4 × 10 - 6 * * 2.0 × 10 - 6 * * 7.3 × 10 - 7 * * 6.5 × 10 - 8 * * 6.1 × 10 - 8 * * 2.8 × 10 - 7 * * 7.3 × 10 - 7 * * 6.5 × 10 - 8 * * 6.1 × 10 - 8 * * 2.8 × 10 - 7 * *
101.5 × 10 - 5 * * 2.2 × 10 - 5 * * 2.2 × 10 - 5 * * 1.9 × 10 - 5 * * 8.0 × 10 - 6 * * 7.1 × 10 - 6 * * 1.1 × 10 - 6 * * 5.4 × 10 - 6 * * 7.3 × 10 - 7 * * 6.5 × 10 - 8 * * 6.1 × 10 - 8 * * 2.8 × 10 - 7 * * 7.3 × 10 - 7 * * 6.5 × 10 - 8 * * 6.1 × 10 - 8 * * 2.8 × 10 - 7 * *
111.8 × 10 - 4 * * 1.7 × 10 - 3 * * 2.7 × 10 - 4 * * 7.0 × 10 - 4 * * 7.4 × 10 - 5 * * 4.5 × 10 - 4 * * 7.3 × 10 - 5 * * 2.0 × 10 - 4 * * 7.3 × 10 - 7 * * 6.5 × 10 - 8 * * 6.1 × 10 - 8 * * 2.8 × 10 - 7 * * 7.3 × 10 - 7 * * 6.5 × 10 - 8 * * 6.1 × 10 - 8 * * 2.8 × 10 - 7 * *
121.9 × 10 - 3 * * 1.7 × 10 - 1 1.6 × 10 - 2 * 6.4 × 10 - 2 1.9 × 10 - 3 * * 1.7 × 10 - 1 1.0 × 10 - 2 * 6.2 × 10 - 2 7.3 × 10 - 7 * * 6.5 × 10 - 8 * * 6.1 × 10 - 8 * * 2.8 × 10 - 7 * * 7.3 × 10 - 7 * * 6.5 × 10 - 8 * * 6.1 × 10 - 8 * * 2.8 × 10 - 7 * *
132.5 × 10 - 2 * 7.3 × 10 - 1 1.9 × 10 - 1 3.1 × 10 - 1 3.9 × 10 - 2 * 4.7 × 10 - 1 2.8 × 10 - 1 2.6 × 10 - 1 7.3 × 10 - 7 * * 6.5 × 10 - 8 * * 6.1 × 10 - 8 * * 2.8 × 10 - 7 * * 7.3 × 10 - 7 * * 6.5 × 10 - 8 * * 6.1 × 10 - 8 * * 2.8 × 10 - 7 * *
141.4 × 10 - 1 1.8 × 10 - 1 7.5 × 10 - 1 3.6 × 10 - 1 1.2 × 10 - 1 2.4 × 10 - 1 5.8 × 10 - 1 3.1 × 10 - 1 7.3 × 10 - 7 * * 6.5 × 10 - 8 * * 6.1 × 10 - 8 * * 2.8 × 10 - 7 * * 7.3 × 10 - 7 * * 6.5 × 10 - 8 * * 6.1 × 10 - 8 * * 2.8 × 10 - 7 * *
154.3 × 10 - 1 5.5 × 10 - 2 6.4 × 10 - 1 3.8 × 10 - 1 3.0 × 10 - 1 6.8 × 10 - 2 7.8 × 10 - 1 3.8 × 10 - 1 7.3 × 10 - 7 * * 6.5 × 10 - 8 * * 6.1 × 10 - 8 * * 2.8 × 10 - 7 * * 7.3 × 10 - 7 * * 6.5 × 10 - 8 * * 6.1 × 10 - 8 * * 2.8 × 10 - 7 * *
167.1 × 10 - 1 2.0 × 10 - 2 * 3.9 × 10 - 1 3.7 × 10 - 1 7.0 × 10 - 1 1.5 × 10 - 2 * 3.8 × 10 - 1 3.6 × 10 - 1 7.3 × 10 - 7 * * 6.5 × 10 - 8 * * 6.1 × 10 - 8 * * 2.8 × 10 - 7 * * 7.3 × 10 - 7 * * 6.5 × 10 - 8 * * 6.1 × 10 - 8 * * 2.8 × 10 - 7 * *
178.2 × 10 - 1 1.2 × 10 - 2 * 2.6 × 10 - 1 3.6 × 10 - 1 8.7 × 10 - 1 1.1 × 10 - 2 * 2.3 × 10 - 1 3.7 × 10 - 1 7.3 × 10 - 7 * * 6.5 × 10 - 8 * * 6.1 × 10 - 8 * * 2.8 × 10 - 7 * * 7.3 × 10 - 7 * * 6.5 × 10 - 8 * * 6.1 × 10 - 8 * * 2.8 × 10 - 7 * *
188.5 × 10 - 1 1.1 × 10 - 2 * 2.3 × 10 - 1 3.6 × 10 - 1 8.7 × 10 - 1 1.2 × 10 - 2 * 2.2 × 10 - 1 3.6 × 10 - 1 7.3 × 10 - 7 * * 6.5 × 10 - 8 * * 6.1 × 10 - 8 * * 2.8 × 10 - 7 * * 7.3 × 10 - 7 * * 6.5 × 10 - 8 * * 6.1 × 10 - 8 * * 2.8 × 10 - 7 * *
198.6 × 10 - 1 1.2 × 10 - 2 * 2.3 × 10 - 1 3.6 × 10 - 1 8.1 × 10 - 1 1.2 × 10 - 2 * 2.4 × 10 - 1 3.5 × 10 - 1 7.3 × 10 - 7 * * 6.5 × 10 - 8 * * 6.1 × 10 - 8 * * 2.8 × 10 - 7 * * 7.3 × 10 - 7 * * 6.5 × 10 - 8 * * 6.1 × 10 - 8 * * 2.8 × 10 - 7 * *
208.2 × 10 - 1 1.3 × 10 - 2 * 2.9 × 10 - 1 3.8 × 10 - 1 8.0 × 10 - 1 1.3 × 10 - 2 * 2.7 × 10 - 1 3.6 × 10 - 1 7.3 × 10 - 7 * * 6.5 × 10 - 8 * * 6.1 × 10 - 8 * * 2.8 × 10 - 7 * * 7.3 × 10 - 7 * * 6.5 × 10 - 8 * * 6.1 × 10 - 8 * * 2.8 × 10 - 7 * *
Table 3. Leave-one-out heat stress classification performance on PPG-chemical, biological and radiological (CBR) responders in the tropical condition database. Four classification methods are used in this analysis: linear discriminant analysis, quadratic discriminant analysis and the linear support vector machine. The PPG signals were collected from 40 heat acclimatized emergency responders for 20 s during the 10-minute break of each exercise (cf. Figure 1). To evaluate the performance of each feature, we applied the F 1 score, which is defined as 2 × ( SE × PP ) / ( SE + PP ) . Here, OA stands for overall accuracy (average of F 1 scores for all classifiers). The highest OA of each feature is highlighted.
Energy-UnfilteredEntropy-UnfilteredEnergy-FilteredEntropy-Filtered
Order(BE vs. E1)(BE vs. E2)(BE vs. E3)OA(BE vs. E1)(BE vs. E2)(BE vs. E3)OA(BE vs. E1)(BE vs. E2)(BE vs. E3)OA(BE vs. E1)(BE vs. E2)(BE vs. E3)OA
063.851.363.359.556.166.151.257.866.360.167.264.658.667.860.962.4
140.350.665.852.266.654.655.258.871.171.047.363.152.471.270.064.5
280.883.168.877.667.886.787.480.673.573.786.477.887.674.073.978.5
380.882.669.277.669.387.087.481.275.174.686.378.787.673.774.178.5
480.383.570.878.270.086.488.081.576.175.785.579.187.374.273.778.4
578.882.250.770.651.885.386.774.658.560.084.267.685.953.654.364.6
677.880.279.279.180.082.584.882.481.581.783.582.285.884.084.384.7
777.480.179.579.080.479.181.280.285.986.482.084.885.286.786.886.2
875.677.580.878.081.374.576.277.386.186.178.283.579.787.187.484.7
973.575.880.876.781.369.869.873.686.186.172.481.673.687.788.083.1
1069.569.680.873.381.360.862.668.286.186.166.079.468.487.788.081.4
1164.165.380.870.181.352.155.663.086.186.158.476.963.987.788.079.9
1256.357.380.864.881.345.144.456.986.186.153.175.150.087.788.075.2
1355.652.880.863.181.338.614.444.886.186.149.774.047.087.788.074.2
1450.049.580.860.181.355.955.964.486.186.145.472.546.087.788.073.9
1549.248.680.859.581.358.156.965.486.186.149.974.131.487.788.069.0
1647.246.480.858.181.358.157.565.686.186.155.475.955.287.788.077.0
1740.535.680.852.381.357.457.565.486.186.154.875.754.887.788.076.8
1831.934.780.849.181.357.657.565.586.186.154.275.554.487.788.576.9
1932.337.280.850.181.358.058.065.786.186.453.075.254.487.188.276.6
2039.839.080.853.281.358.658.666.286.786.753.075.553.086.387.675.6
As a general observation in Table 3, the OA significantly increased after applying the second derivative to the PPG signals, especially the filtered PPG signals. However, the OA starts to decrease after applying the sixth order to the raw PPG signals and after applying the seventh order to the filtered PPG signals. The optimal feature for detecting heat stress is the entropy of the seventh derivative of filtered PPG signals. Figure 4 reveals a significant decrease in the optimal feature for subjects measured after exercise: the p-values for differentiating between at rest and after the three exercises were 7.2 × 10 - 7 , 6.5 × 10 - 8 and 6.1 × 10 - 8 . This effect has never been described in the literature. This new outcome shows that the entropy of the seventh derivative of filtered PPG signals can be used to assess heat stress without the need for measuring the HR or BCT and can be used as an indicator of heat stress tolerance.
Figure 4. Boxplot of the optimal feature (entropy of the filtered PPG signal) of PPG signals measured before and after simulated heat stress induction. Here, the p-value is calculated using the paired Mann-Whitney test ( p 0.05 was considered significant).
Ijerph 12 12776 g004
To ensure that the entropy of the seventh derivative of filtered PPG signals can be used to replace other measures of heat stress, it is important to compare its performance with another heat stress index, such as BCT or RMSSD. The problem is that we could not measure BCT immediately after exercise, as a few subjects had to wait, which cooled them down a bit [34]. Therefore, we had to compare the optimal feature with the RMSSD calculated from the PPG signals. Figure 5 shows the performance of the RMSSD in detecting all simulated heat stress inductions. The RMSSD detected heat stress after the first exercise with an SE of 87.5% and a PP of 58.33%, as shown in Figure 5a. The detection of heat stress was slightly improved after Exercise 2 and Exercise 3 with an SE of 92.5% and a PP of 59.68%, as shown in Figure 5b,c. Note that the RMSSD showed no classification improvement in detecting heat stress after Exercise 2 and Exercise 3; the sensitivity and positive predictivity remained the same.
Figure 5. Quadratic classification of PPG signals measured before and after the simulated heat stress induction based on the RMSSD. Here, RMSSD stands for the square root of the mean of the squares of the successive heartbeats intervals; SE stands for sensitivity; and PP stands for positive predictivity. (a) At rest vs. after exercise 1; (b) at rest vs. after exercise 2; (c) at rest vs. after exercise 3. The plus signs refer to subjects measured at rest, while the diamond signs refer to subjects measured after exercise (the simulated heat stress induction).
Ijerph 12 12776 g005
To maximize the heat stress detection performance, we combined the optimal feature (entropy of the seventh derivative of filtered PPG) and the traditional HRV heat stress index (RMSSD). Figure 6 shows the performance of the combination in detecting all simulated heat stress inductions. The combined features detected heat stress after the first exercise with an SE of 95% and a PP of 73.08%, as shown in Figure 6a. The detection of heat stress was slightly improved after Exercise 2 with an SE of 95% and a PP of 88.37%, as shown in Figure 6b.
Figure 6. Quadratic classification of PPG signals measured before and after the simulated heat stress induction based on the optimal feature (entropy of the filtered PPG signal) and RMSSD. Here, RMSSD stands for the square root of the mean of the squares of the successive heartbeats intervals; SE stands for sensitivity; and PP stands for positive predictivity. (a) At rest vs. after exercise 1; (b) at rest vs. after exercise 2; (c) at rest vs. after exercise 3. The plus signs refer to subjects measured at rest, while the diamond signs refer to subjects measured after exercise (the simulated heat stress induction).
Ijerph 12 12776 g006
The progression of detecting heat stress continued, and the accuracy improved after Exercise 3, with an SE of 95% and a PP of 90.48%, as shown in Figure 6c. It is clear that the use of combined features noticeably improved the heat stress detection performance with each sequential heat stress simulation induction stage.
It is important to emphasize that this study replicated “real-world” heat stress by simulating emergency responder work settings. Although the participant number may seem modest, the logistics of establishing a simulation of this size were very challenging and likely explain why there are few reports of the use of technology to assist in the detection and management of heat stress in field settings. We believe that the modest participant number ( n = 40 ) ought to be considered in conjunction with the experimental setting. A larger sample size and a more diverse dataset are needed in order to generalize the findings of this study.
To our knowledge, there is no available PPG database containing data measured in tropical conditions or after heat stress that would allow a more thorough assessment and comparison of the tested algorithms. In future studies, it may be advisable to have multiple PPG systems to collect the signal immediately after exercise. In the present study, data were collected immediately after exercise; however, some participants may have cooled down whilst queuing for measurement. Furthermore, we used the standard definition of entropy in our analysis to measure the randomness of the PPG morphology, regardless if the PPG signal is noisy with high gain or fluctuations. An open question for future studies is to explore the effect of using alternative entropic measures for this purpose.

5. Conclusions

The findings of this preliminary study indicate that heat stress can be assessed using unfiltered PPG signals without filtering and without beat-by-beat analysis. Moreover, filtering the PPG signal before differentiation slightly improves the heat stress assessment. The combination of RMSSD and the entropy of the seventh derivative of the filtered PPG signal can be used to detect heat stress measurements without the need for measuring BCT. The results of this study indicate that analysis of the whole PPG recording without detecting beats or wave amplitudes can be a potential modality for heat stress analysis and the identification of individuals at risk.

Acknowledgments

Mohamed Elgendi gratefully acknowledges the Northern Territory Fire and Rescue Service and the National Critical Care and Trauma Response Centre (Darwin, Australia) for assistance with the research project.

Author Contributions

Mohamed Elgendi and Ian Norton designed the experiment. Mohamed Elgendi, Richard R. Fletcher, Derek Abbott and Nigel H. Lovell performed the statistical analysis. Mohamed Elgendi, Ian Norton, Matt Brearley, Richard R. Fletcher, Dale Schuurmans, Derek Abbott and Nigel H. Lovell conceived of the study and drafted the manuscript. The authors approved the final manuscript.

Conflicts of Interest

The authors declare no conflict of interest.

References

  1. McMichael, A.; Kovats, S.; Edwards, S.; Wilkinson, P.; Wilson, T. Comparative Quantification of Health Risks: Global and Regional Burden of Disease due to Selected Major Risk Factors; Ezzati, M., Lopez, A., Rodgers, A., Murray, C.J.L., Eds.; Technical report; World Health Organization: Geneva, Switzerland, 2004. [Google Scholar]
  2. Baddour, L.M.; Wilson, W.R.; Bayer, A.S.; Fowler, V.G.; Bolger, A.F.; Levison, M.E.; Ferrieri, P.; Gerber, M.A.; Tani, L.Y.; Gewitz, M.H.; et al. Infective Endocarditis: Diagnosis, Antimicrobial Therapy, And Management of Complications: A Statement for Healthcare Professionals From the Committee on Rheumatic Fever, Endocarditis, and Kawasaki Disease, Council on Cardiovascular Disease in the Young, and the Councils on Clinical Cardiology, Stroke, and Cardiovascular Surgery and Anesthesia, American Heart Association: Endorsed by the Infectious Diseases Society of America. Circulation 2005, 111, e394–e434. [Google Scholar] [PubMed]
  3. Binkley, H.M.; Beckett, J.; Casa, D.J.; Kleiner, D.M.; Plummer, P.E. National Athletic Trainers’ Association position statement: Exertional heat illnesses. J. Athl. Train. 2002, 37, 329–343. [Google Scholar] [PubMed]
  4. Casa, D.J.; Becker, S.M.; Ganio, M.S.; Brown, C.M.; Yeargin, S.W.; Roti, M.W.; Siegler, J.; Blowers, J.A.; Glaviano, N.R.; Huggins, R.A.; et al. Validity of devices that assess body temperature during outdoor exercise in the heat. J. Athl. Train. 2007, 42, 333–342. [Google Scholar] [PubMed]
  5. Bruce-Low, S.S.; Cotterrell, D.; Jones, G.E. Heart rate variability during high ambient heat exposure. Aviat. Space Environ. Med. 2006, 77, 915–920. [Google Scholar] [PubMed]
  6. Jagomägi, K.; Ates, O.; Talts, J.; Raamat, R.; Cotuk, B.; Burk, A.; Karelson, K.; Ööpik, V.; Traks, T.; Kivastik, J. Effects of Heat Stress on the Blood Pressure and Heart Rate Variability in Young Men. In Proceedings of the International Symposium on Biomedical Engineering and Medical Physics, Riga, Latvia, 10–12 October 2012; Dekhtyar, Y., Katashev, A., Lancere, L., Eds.; Springer Berlin Heidelberg: Heidelberg, Germany, 2013; Volume 38, pp. 103–106. [Google Scholar]
  7. Flouris, A.; Bravi, A.; Wright-Beatty, H.; Green, G.; Seely, A.; Kenny, G. Heart rate variability during exertional heat stress: Effects of heat production and treatment. Eur. J. Appl. Physiol. 2014, 114, 785–792. [Google Scholar] [CrossRef] [PubMed]
  8. Chrife, R.; Pigott, V.; Spodick, D. Measurement of the left ventricular ejection time by digital plethysmography. Am. Heart J. 1971, 82, 222–227. [Google Scholar] [CrossRef]
  9. Kelly, R.; Hayward, C.; Avolio, A.; O’Rourke, M. Noninvasive determination of age-related changes in the human arterial pulse. Circ 1989, 80, 1652–1659. [Google Scholar] [CrossRef]
  10. O’Rourke, M.; Avolio, A.; Kelly, R. The Arterial Pulse; Lea & Febiger: Baltimore, MD, USA, 1992. [Google Scholar]
  11. Darne, B.; Girerd, X.; Safar, M.; Cambien, F.; Guize, L. Pulsatile versus steady component of blood pressure: A cross-sectional analysis and a prospective analysis on cardiovascular mortality. Hypertension 1989, 13, 392–400. [Google Scholar] [CrossRef] [PubMed]
  12. Barenbrock, M.; Spieker, C.; Kerber, S.; Vielhauer, C.; Hoeks, A.; Zidek, W.; Rahn, K. Different effects of hypertension, atherosclerosis and hyperlipidemia on arterial distensibility. Hypertension 1995, 13, 1712–1717. [Google Scholar]
  13. Shelley, K.H. Photoplethysmography: Beyond the calculation of arterial oxygen saturation and heart rate. Anesth. Analg. 2007, 105, S31–S36. [Google Scholar] [PubMed]
  14. Song, S.; Cho, J.; Oh, H.; Lee, J.; Kim, I. Estimation of blood pressure using Photoplethysmography on the wrist. In Proceedings of the IEEE Computers in Cardiology, Park City, UT, USA, 13–16 September 2009; pp. 741–744.
  15. Elgendi, M.; Jonkman, M.; de Boer, F. Measurement of a-a intervals at rest in the second derivative plethysmogram. In Proceedings of the IEEE 2009 International Symposium on Bioelectronics and Bioinformatics, RMIT University, Melbourne, Australia, 9–11 December 2009; pp. 75–79.
  16. Elgendi, M.; Jonkman, M.; de Boer, F. Applying the APG to measure heart rate variability. In Proceedings of the 2nd International Conference on Computer and Automation Engineering, Singapore, 26–28 February 2010; pp. 100–104.
  17. Ruiz-Rodríguez, J.C.; Ruiz-Sanmartín, A.; Ribas, V.; Caballero, J.; García-Roche, A.; Riera, J.; Nuvials, X.; de Nadal, M.; de Sola-Morales, O.; Serra, J.; et al. Innovative continuous non-invasive cuffless blood pressure monitoring based on photoplethysmography technology. Intensive Care Med. 2013, 39, 1618–1625. [Google Scholar] [CrossRef] [PubMed]
  18. Elgendi, M.; Fletcher, R.; Norton, I.; Brearley, M.; Abbott, D.; Lovell, N.H.; Schuurmans, D. On Time Domain Analysis of Photoplethysmogram Signals for Monitoring Heat Stress. Sensors 2015, 15, 24716–24734. [Google Scholar] [PubMed]
  19. Elgendi, M. On the analysis of fingertip photoplethysmogram signals. Curr. Cardiol. Rev. 2012, 8, 14–25. [Google Scholar] [CrossRef] [PubMed]
  20. Elgendi, M. Detection of c, d, and e waves in the acceleration photoplethysmogram. Comput. Methods Programs Biomed. 2014, 117, 125–136. [Google Scholar] [CrossRef] [PubMed]
  21. Millaseau, S.; Kelly, R.; Ritter, J.; Chowienczyk, P. Determination of age-related increases in large artery stiffness by digital pulse contour analysis. Clin. Sci. 2002, 103, 371–377. [Google Scholar] [CrossRef]
  22. Millaseau, S.; Ritter, J.; Takazawa, K.; Chowienczyk, P. Contour analysis of the photoplethysmographic pulse measured at the finger. J. Hypertens 2006, 24, 1449–1456. [Google Scholar]
  23. Imanaga, I.; Hara, H.; Koyanagi, S.; Tanaka, K. Correlation between wave components of the second derivative of plethysmogram and arterial distensibility. Jpn. Heart J. 1998, 39, 775–784. [Google Scholar] [CrossRef] [PubMed]
  24. Takazawa, K.; Tanaka, N.; Fujita, M.; Matsuoka, O.; Saiki, T.; Aikawa, M.; Tamura, S.; Ibukiyama, C. Assessment of vasoactive agents and vascular aging by the second derivative of photoplethysmogram waveform. Hypertension 1998, 32, 365–370. [Google Scholar] [CrossRef] [PubMed]
  25. Bortolotto, A.; Jacques, B.; Takeshi, K.; Kenji, T.; Michel, S. Assessment of vascular aging and atherosclerosis in hypertensive subjects: Second derivative of photoplethysmogram versus pulse wave velocity. Am. J. Hypertens. 2000, 13, 165–171. [Google Scholar] [CrossRef]
  26. Elgendi, M.; Norton, I.; Brearley, M.; Abbott, D.; Schuurmans, D. Detection of a and b waves in the acceleration photoplethysmogram. Biomed. Eng. Online 2014, 13. [Google Scholar] [CrossRef] [PubMed]
  27. Elgendi, M.; Norton, I.; Brearley, M.; Abbott, D.; Lovell, N.H.; Schuurmans, D. Frequency analysis of photoplethysmogram and its derivatives. Comput. Methods Programs Biomed. 2015, in press. [Google Scholar]
  28. Karamanoglu, M. A System for Analysis of Arterial Blood Pressure Waveforms in Humans. Comput. Biomed. Res. 1997, 30, 244–255. [Google Scholar] [CrossRef] [PubMed]
  29. Pilt, K.; Ferenets, R.; Meigas, K.; Lindberg, L.G.; Temitski, K.; Viigimaa, M. New photoplethysmographic signal analysis algorithm for arterial stiffness estimation. Sci. World J. 2013, 24, 1449–1456. [Google Scholar] [CrossRef] [PubMed]
  30. Brearley, M.B.; Heaney, M.F.; Norton, I.N. Physiological responses of medical team members to a simulated emergency in tropical field conditions. Prehosp. Disaster Med. 2013, 28, 139–144. [Google Scholar] [PubMed]
  31. Weber, M.A.; Schiffrin, E.L.; White, W.B.; Mann, S.; Lindholm, L.H.; Kenerson, J.G.; Flack, J.M.; Carter, B.L.; Materson, B.J.; Ram, C.V.S.; et al. Clinical practice guidelines for the management of hypertension in the community. J. Clin. Hypertens 2014, 16, 14–26. [Google Scholar] [CrossRef] [PubMed]
  32. O’Brien, C.; Hoyt, R.W.; Buller, M.J.; Castellani, J.W.; Young, A.J. Telemetry pill measurement of core temperature in humans during active heating and cooling. Med. Sci. Sports Exerc. 1998, 30, 468–472. [Google Scholar] [CrossRef] [PubMed]
  33. Casa, D.J.; Becker, S.M.; Ganio, M.S.; Brown, C.M.; Yeargin, S.W.; Roti, M.W.; Siegler, J.; Blowers, J.A.; laviano, N.R.; Huggins, R.A.; Armstrong, L.E.; Maresh, C.M. Validity of devices that assess body temperature during outdoor exercise in the heat. J. Athl. Train. 2007, 42, 333–342. [Google Scholar] [PubMed]
  34. Elgendi, M.; Norton, I.; Brearley, M.; Abbott, D.; Schuurmans, D. Systolic peak detection in acceleration photoplethysmograms measured from emergency responders in tropical conditions. PLoS ONE 2013, 8. [Google Scholar] [CrossRef] [PubMed] [Green Version]
  35. Coifman, R.; Wickerhauser, M. Entropy-based algorithms for best basis selection. IEEE Trans. Inf. Theory 1992, 38, 713–718. [Google Scholar] [CrossRef]
  36. Bonferroni, C. Teoria statistica delle classi e calcolo delle probabilità. Pubblicazioni R Ist. Super. Sci. Econ. Commer. Firenze 1936, 8, 3–62. [Google Scholar]
  37. Holm, S. A simple sequentially rejective multiple test procedure. Scand. J. Stat. 1979, 6, 65–70. [Google Scholar]
  38. Wilson, T.E.; Crandall, C.G. Effect of thermal stress on cardiac function. Exerc. Sport Sci. Rev. 2011, 39, 12–17. [Google Scholar] [CrossRef] [PubMed]

