1. Introduction
Bacillus anthracis, a Gram-positive, spore forming, rod shaped bacterium, exists in the environment in two states, as metabolically active vegetative cells or as dormant endospores. In unfavorable conditions, the vegetative cells will undergo sporulation to promote the formation of environmentally stable spores. These resistant spores can persist in the environment for months to years, until favorable growth conditions are met again [
1]. Due to this ability to undergo sporulation, and the characteristics of being a mesophilic, facultative anaerobe,
B. anthracis can be found in soils worldwide [
2]. Herbivores become infected from ingesting spores from soil, and humans can become infected from contact with an infected animal. Through this exposure, cutaneous or inhalational anthrax can develop. Recent incidents of anthrax have occurred following exposure to infected cattle. Anthrax was confirmed in an Australian knackery worker exposed to infected cattle [
3]. In 2011, nine cases of cutaneous anthrax were reported following villagers butchering, skinning and consuming meat obtained from infected livestock in the Chittoor district, Pradesh, India [
4]. Many anthrax cases have been associated with those who make or use musical drums made from natural animal hides [
5,
6]. The naturally occurring environmental pathway for anthrax transmission and exposure has been well established.
In addition to the risk of exposure in the natural environment to these bacteria, there is a bioterrorism threat associated with
B. anthracis. Pathogenic spores were aerosolized at multiple targeted sites, in the 2001 U.S. Postal Service attacks, making the threat of bioterrorism a reality and a major threat to the security of the nation [
7]. Bioterrorism and weaponization of
B. anthracis is a likely public health threat because of the ease of obtaining these bacteria from the natural environment, preparing them to become pathogenic, spreading (aerozolization of endospores) through the environment, and the bacteria’s spores are resistance to heat and sodium hypochlorite (bleach) disinfection [
8]. While,
B. anthracis can be cultured with limited resources, its weaponization is much more difficult [
9].
Due to the potential for residual
B. anthracis from a bioterrorism event it is necessary to find reliable methods for quick assessments of cleanliness of hospitals or bioterrorist target sites. Hospitals are vulnerable to contamination from
B. anthracis as individuals contaminated from a bioterrorist event or those infected naturally may present to the hospital while still contaminated and prior to knowledge of either their contamination or diagnosis being known to the facility. Thus, they have the potential to contaminate multiple areas within the hospital or other facility they may visit. Currently, microbial contamination is determined via culture-based methodologies which require trained professional staff and can be time consuming expensive, and hazardous. It is important to have a quick method for determining cleanliness, both in the laboratory and the healthcare setting. Based on information gathered from the food industry’s previous twenty years of research with adenosine triphosphate (ATP) bioluminescence [
10,
11], researchers have begun to use ATP bioluminescence detection methods to determine hospital surfaces’ cleanliness following decontamination [
12,
13,
14]. While ATP bioluminescence could not identify species, it has the potential to show if an organism, such as
B. anthracis, were present following a known contamination event.
If ATP measurements were demonstrated to be a reliable and accurate estimation of B. anthracis contamination on multiple surfaces, the next step would be to factor in potential environmental contamination to then determine if the technology could be used in place of standard microbial plate counts. Thus, reducing the need to perform time-consuming plate counts. Therefore, as a first step this study aimed to determine if the ATP measurements corresponded to the level (concentration in colony forming units (CFU) per surface) of contamination with both vegetative cells and endospores of B. anthracis Sterne 34F2 on multiple surfaces.
2. Experimental Section
A laboratory study was conducted to evaluate if an ATP bioluminescence assay, using the 3M™ Clean-Trace™ ATP Surface test (3M Health Care, St. Paul, MN, USA), could be used to determine the presence and relative concentration of vegetative and spore forms of B. anthracis Sterne 34F2.
These evaluations were conducted on multiple surfaces at three concentrations of approximately 10
4, 10
6, 10
8 colony forming units per surface (CFU/surface). Seventeen different surfaces that are common to the healthcare environment were selected for evaluation. Surfaces evaluated in this study were either recovered from surplus hospital equipment or purchased from a home improvement store, and were cut to approximately 100 cm
2 when possible (
Table 1).
Table 1.
Healthcare related surfaces (coupons) that were evaluated.
Table 1.
Healthcare related surfaces (coupons) that were evaluated.
| Item Description | Surface Area (cm2) |
|---|
| Aluminum-sheet metal (Steelworks, Cincinnati, OH, USA) | 100 |
Bed mattress fabric—cut from old hospital mattress from a Hill-Rom Advance 2000
(Hill-Rom Holdings, Inc., Batesville, IN, USA) | 100 |
Bed rail made of Polyvinyl Chloride (PVC)—cut from
an old hospital bed from a Hill-Rom Advance 2000 | 100 |
Carpet-coronet idolized esteemed berber similar to the weave used in the hospital
made of nylone (Coronet, Dalton, GA, USA) | 100 |
| Ceramic tile-white (U. S. Ceramic Tile Company part of Roca Tile Group, Miami, FL, USA) | 110 |
Chrome light switch cover—polished material similar to some faucets
(Liberty Harware, Winston-Salem, NC, USA) | 50 |
| Keyboard (Dell, Round Rock, TX, USA) | 50 |
| Lexan polycarbonate sheet (Lowe’s, Omaha, NE, USA) | 100 |
Nickel light switch cover—satin material similar to some faucets
(Liberty Harware, Winston-Salem, NC, USA) | 100 |
| Paper (Boise White Paper, LLC, Boise, ID, USA) | 100 |
| Plastic Acrylic Sheet (Lowe’s, Omaha, NE, USA) | 100 |
| Plastic light switch cover (Cooper LightingUnbreakable, Peachtree City, GA, USA) | 80 |
| Porcelain tile—rialto Beige (Del Conca, Loudon, TN, USA) | 100 |
| PVC-ranch base molding (Royal Molding, Woodbridge, Ontario, Canada) | 112 |
| Stainless steel—T304 (Steelworks, Cincinnati, OH, USA) | 100 |
| Vinyl flooring—overlook II Sandstone (Armstrong, Lancaster, PA, USA) | 100 |
Wood—stained similar to chair arms-Autumn Maple
(Mullican Flooring, Johnson City, TN, USA) | 112.5 |
A number of coupons were kept their original size so the surface area of the coupons varies, but results are always reported per surface. Coupons were cleaned immediately after experimentation by using a 5,000–6,000 ppm sodium hypochlorite soak for 20 min that was pH adjusted to 7 using acetic acid, sterile water rinses, and then autoclaved, when possible, with storage under sterile conditions until evaluation. Quality assurance demonstrated the success of the sterilization process throughout the study. All coupons were inspected prior to use and any coupon showing any signs of material degradation was replaced with a new coupon.
For each evaluation 12 coupons of each surface were utilized with three coupons as the negative ATP control, three as the negative culturable control, three as the ATP exposure, and three as the culturable exposure. Each evaluation was conducted in triplicate for both the vegetative and spore forms of B. anthracis and at each of the three predetermined target concentrations (104, 106, 108 CFU/surface). Each of the exposure coupons had 50 microliters (μL) of the organism suspension placed upon its surface to bring the level of organisms per surface up to concentration (104, 106, 108 CFU/surface). This was accomplished by pipetting five drops of 10 μL each of an organism stock solution evenly onto the coupon surface. The coupons were left undisturbed and allowed to dry in a biosafety cabinet for ten minutes prior to being swabbed for analysis with either culture or ATP.
2.1. Inoculate Preparation
Pure cultures of
B. anthracis Sterne 34F2 were utilized to prepare an inoculate suspension of vegetative
B. anthracis at the desired experimental concentrations. The inoculate was prepared by transferring a colony forming unit from a tryptic soy agar (TSA) plate to a tube of 40 mL of tryptic soy broth (TSB), and allowing it to incubate at 37 °C for at least 24 h or until sufficient growth at 37 °C [
15,
16]. Multiple tubes were incubated at a time in order to assure the correct concentrations. The tubes were centrifuged for 15 min at 4 °C at 1,000× g on a Beckman TH-4 rotor (Beckman Coulter, Brea, CA, USA) to get a soft pellet of bacterial cells. The supernatant was then decanted and the procedure repeated twice. Then the resulting pellet was resuspended in phosphate buffered saline and combined with other tubes to achieve the appropriate concentration for the stock suspension. The stock solution was evaluated for total count utilizing microscopic and culturable methodology to assure clean vegetative cells [
15,
16].
The spore suspension was created by spreading the vegetative suspension of
B. anthracis Sterne 34F2 onto Modified TSA w/5% SBCaCl
2, MnCl
2 plates and allowing them to incubate at 37 °C for 48 h, and then an additional 24 h at room temperature [
15,
16]. The resulting biomass from at least three plates, depending on desired concentration, was suspended into 30 mL sterile distilled water (dH
2O). This suspension was held at room temperature for 72 h to allow the lysis of vegetative cells. The solution was then centrifuged at 8,000× g for 10 min at 4 °C, washed with dH
2O, then centrifuged again. The spore suspension was evaluated for viability and observed microscopically to confirm the cleanliness of the suspension and that at least 90% of those were bright refractive endospores. The final supernatant was resuspended in dH
2O, and adjusted to the desired stock solution concentration [
15,
16]. The spore suspensions were held at 4°C and utilized within two weeks before a new stock solution was created.
2.2. Culturable Microbiological Methods
Throughout the study both culture-based methods and ATP based methods were used to determine the concentrations of B. anthracis in suspensions and on an inoculated surfaces. For culture methods a pre-moistened sterile polyester tipped swab (Thermo Fisher Scientific, Waltham, MA, USA) with phosphate buffered saline but no Tween nor inhibitors was swabbed for 30 s against the coupon surfaces (control and experimental). The culture method and the ATP swabs were made as similar as possible. The tip of the swab was removed and placed into 1 mL of sterile phosphate buffered saline (vegetative cells) or Milli-Q water (endospores). Then the Eppendorf tube was vortexed for 30 s. Serial dilution was conducted in triplicate onto tryptic soy agar and incubated for 48 h at 37 °C. The resulting counts were then reported as CFU/surface.
2.3. ATP Bioluminescence Methods
ATP based methods were based upon the manufacturer’s recommendation for the 3M™ Clean-Trace™ ATP Surface Test kit, including the 3M™ Clean-Trace™ ATP Surface swabs and 3M™ Clean-Trace™ NGi Luminometer. Like the culture methods the coupon was swabbed for 30 s with the pre-moistened 3M™ Clean-Trace ATP Surface swabs. The ATP swabs were activated according to manufacturer instructions and then the Clean-Trace NGi Luminometer was used to determine the ATP measurement, which were reported digitally as Relative Light Units (RLU).
2.4. Quality Control/Quality Assurance
Triplicate evaluation of the organism suspension (CFU and RLU) was conducted both before and after each surface was tested to ensure consistency. Any test that was not within the predetermined limits was disregarded and the evaluation was repeated. Additionally, standard positive and negative control measures were conducted for serial dilution and agar plating.
2.5. Statistical Methods
Prior to analysis adjustments were done to remove background noise and to correct for differences in intended versus actual suspension concentrations. Each session of lab work included three ATP control measurements and three culture-based control measurements taken prior to and at the conclusion of all work. These control measurements were repeated for each surface used during the session and were taken on surfaces that had just undergone sterilization. Control values were calculated separately for ATP and culture-based measurements. Each control value was calculated as the average of all six culture-based or ATP control measurements collected during that session. These control values were subtracted from all measured experimental values collected during the session to remove the background noise. To correct for session to session variance in suspension concentration, the measurements were then multiplied by a factor equal to the nominal concentration divided by the actual concentration as measured by CFU analysis. These second-level adjustment factors were also calculated on a session by session basis.
Analysis was done using the base 10 logarithms of adjusted values and consisted of using Pearson correlation coefficients to compare ATP and culture-based measurements overall, by organism stage, by suspension concentration, and by surface. Analyses were conducted using SAS/STAT software, Version 9.3 (SAS Institute, Cary, NC, USA) with a p-value greater than 0.05 used to indicate significance.
3. Results and Discussion
Throughout the study the target concentrations for CFU/surface were achieved; however, since multiple organism suspensions had to be created throughout the study period it was necessary to standardize. As a result, we recorded both actual and adjusted concentration of RLU and CFU per surface evaluated, which allowed the comparison despite variations within each of the organism suspension (
Table 2). In examining
Table 2, it is clear that the actual and adjusted concentrations for both CFU and RLU are similar within an organism concentration, but by doing the adjustment it allows for a better comparison across organism concentrations.
Table 2.
B. anthracis Sterne 34F2 (endospore and vegetative cell) concentrations on surfaces *.
Table 2.
B. anthracis Sterne 34F2 (endospore and vegetative cell) concentrations on surfaces *.
Target Concentration
CFU/Surface | Variable | Mean | Standard Deviation | Median | Minimum | Maximum |
|---|
Endospores
104 | Actual RLU/Surface | 2.15 × 101 | 1.47 × 101 | 1.67 × 101 | 8.00 × 100 | 6.63 × 101 |
| Adjusted RLU/Surface | 2.40 × 101 | 1.59 × 101 | 1.88 × 101 | 1.09 × 101 | 6.92 × 101 |
| Actual CFU/Surface | 1.70 × 10³ | 7.61 × 10² | 1.73 × 10³ | 6.60 × 10² | 3.20 × 10³ |
| Adjusted CFU/Surface | 1.96 × 10³ | 1.02 × 10³ | 2.04 × 10³ | 7.42 × 10² | 4.42 × 10³ |
Endospores
106 | Actual RLU/Surface | 2.82 × 101 | 1.48 × 101 | 2.70 × 101 | 9.33 × 100 | 6.67 × 101 |
| Adjusted RLU/Surface | 2.82 × 101 | 1.82 × 101 | 2.70 × 101 | 4.79 × 100 | 8.46 × 101 |
| Actual CFU/Surface | 1.96 × 10⁵ | 1.19 × 10⁵ | 1.54 × 10⁵ | 5.93 × 10⁴ | 5.13 × 10⁵ |
| Adjusted CFU/Surface | 2.21 × 10⁵ | 1.59 × 10⁵ | 2.15 × 10⁵ | 1.17 × 10⁴ | 5.97 × 10⁵ |
Endospores
108 | Actual RLU/Surface | 3.41 × 101 | 1.31 × 101 | 3.13 × 101 | 1.77 × 101 | 6.13 × 101 |
| Adjusted RLU/Surface | 5.33 × 101 | 2.30 × 101 | 4.69 × 101 | 1.95 × 101 | 9.84 × 101 |
| Actual CFU/Surface | 1.65 × 10⁷ | 1.13 × 10⁷ | 1.28 × 10⁷ | 4.07 × 10⁶ | 4.67 × 10⁷ |
| Adjusted CFU/Surface | 2.47 × 10⁷ | 1.54 × 10⁷ | 2.11 × 10⁷ | 6.59 × 10⁶ | 6.79 × 10⁷ |
Vegetative Cells
104 | Actual RLU/Surface | 9.81 × 10² | 7.55 × 10² | 1.09 × 10³ | 7.53 × 101 | 2.44 × 10³ |
| Adjusted RLU/Surface | 5.00 × 10³ | 6.24 × 10³ | 1.75 × 10³ | 1.37 × 10² | 2.09 × 10⁴ |
| Actual CFU/Surface | 1.04 × 10³ | 7.13 × 10² | 8.47 × 10² | 2.77 × 10² | 2.72 × 10³ |
| Adjusted CFU/Surface | 2.33 × 10³ | 8.71 × 10² | 2.26 × 10³ | 9.47 × 10² | 4.19 × 10³ |
Vegetative Cells
106 | Actual RLU/Surface | 6.68 × 10⁴ | 2.95 × 10⁴ | 7.48 × 10⁴ | 1.63 × 10⁴ | 1.17 × 10⁵ |
| Adjusted RLU/Surface | 5.98 × 10⁴ | 2.20 × 10⁴ | 5.97 × 10⁴ | 2.43 × 10⁴ | 1.05 × 10⁵ |
| Actual CFU/Surface | 3.26 × 10⁵ | 2.66 × 10⁵ | 2.74 × 10⁵ | 4.33 × 10⁴ | 1.10 × 10⁶ |
| Adjusted CFU/Surface | 2.82 × 10⁵ | 2.09 × 10⁵ | 2.11 × 10⁵ | 6.96 × 10⁴ | 7.98 × 10⁵ |
Vegetative Cells
108 | Actual RLU/Surface | 1.51 × 10⁵ | 6.76 × 10⁴ | 1.56 × 10⁵ | 3.28 × 10⁴ | 3.13 × 10⁵ |
| Adjusted RLU/Surface | 8.60 × 10⁵ | 6.16 × 10⁵ | 6.07 × 10⁵ | 1.26 × 10⁵ | 1.99 × 10⁶ |
| Actual CFU/Surface | 4.77 × 10⁶ | 4.58 × 10⁶ | 3.30 × 10⁶ | 5.33 × 10⁵ | 1.60 × 10⁷ |
| Adjusted CFU/Surface | 2.94 × 10⁷ | 3.70 × 10⁷ | 1.32 × 10⁷ | 1.06 × 10⁶ | 1.32 × 10⁸ |
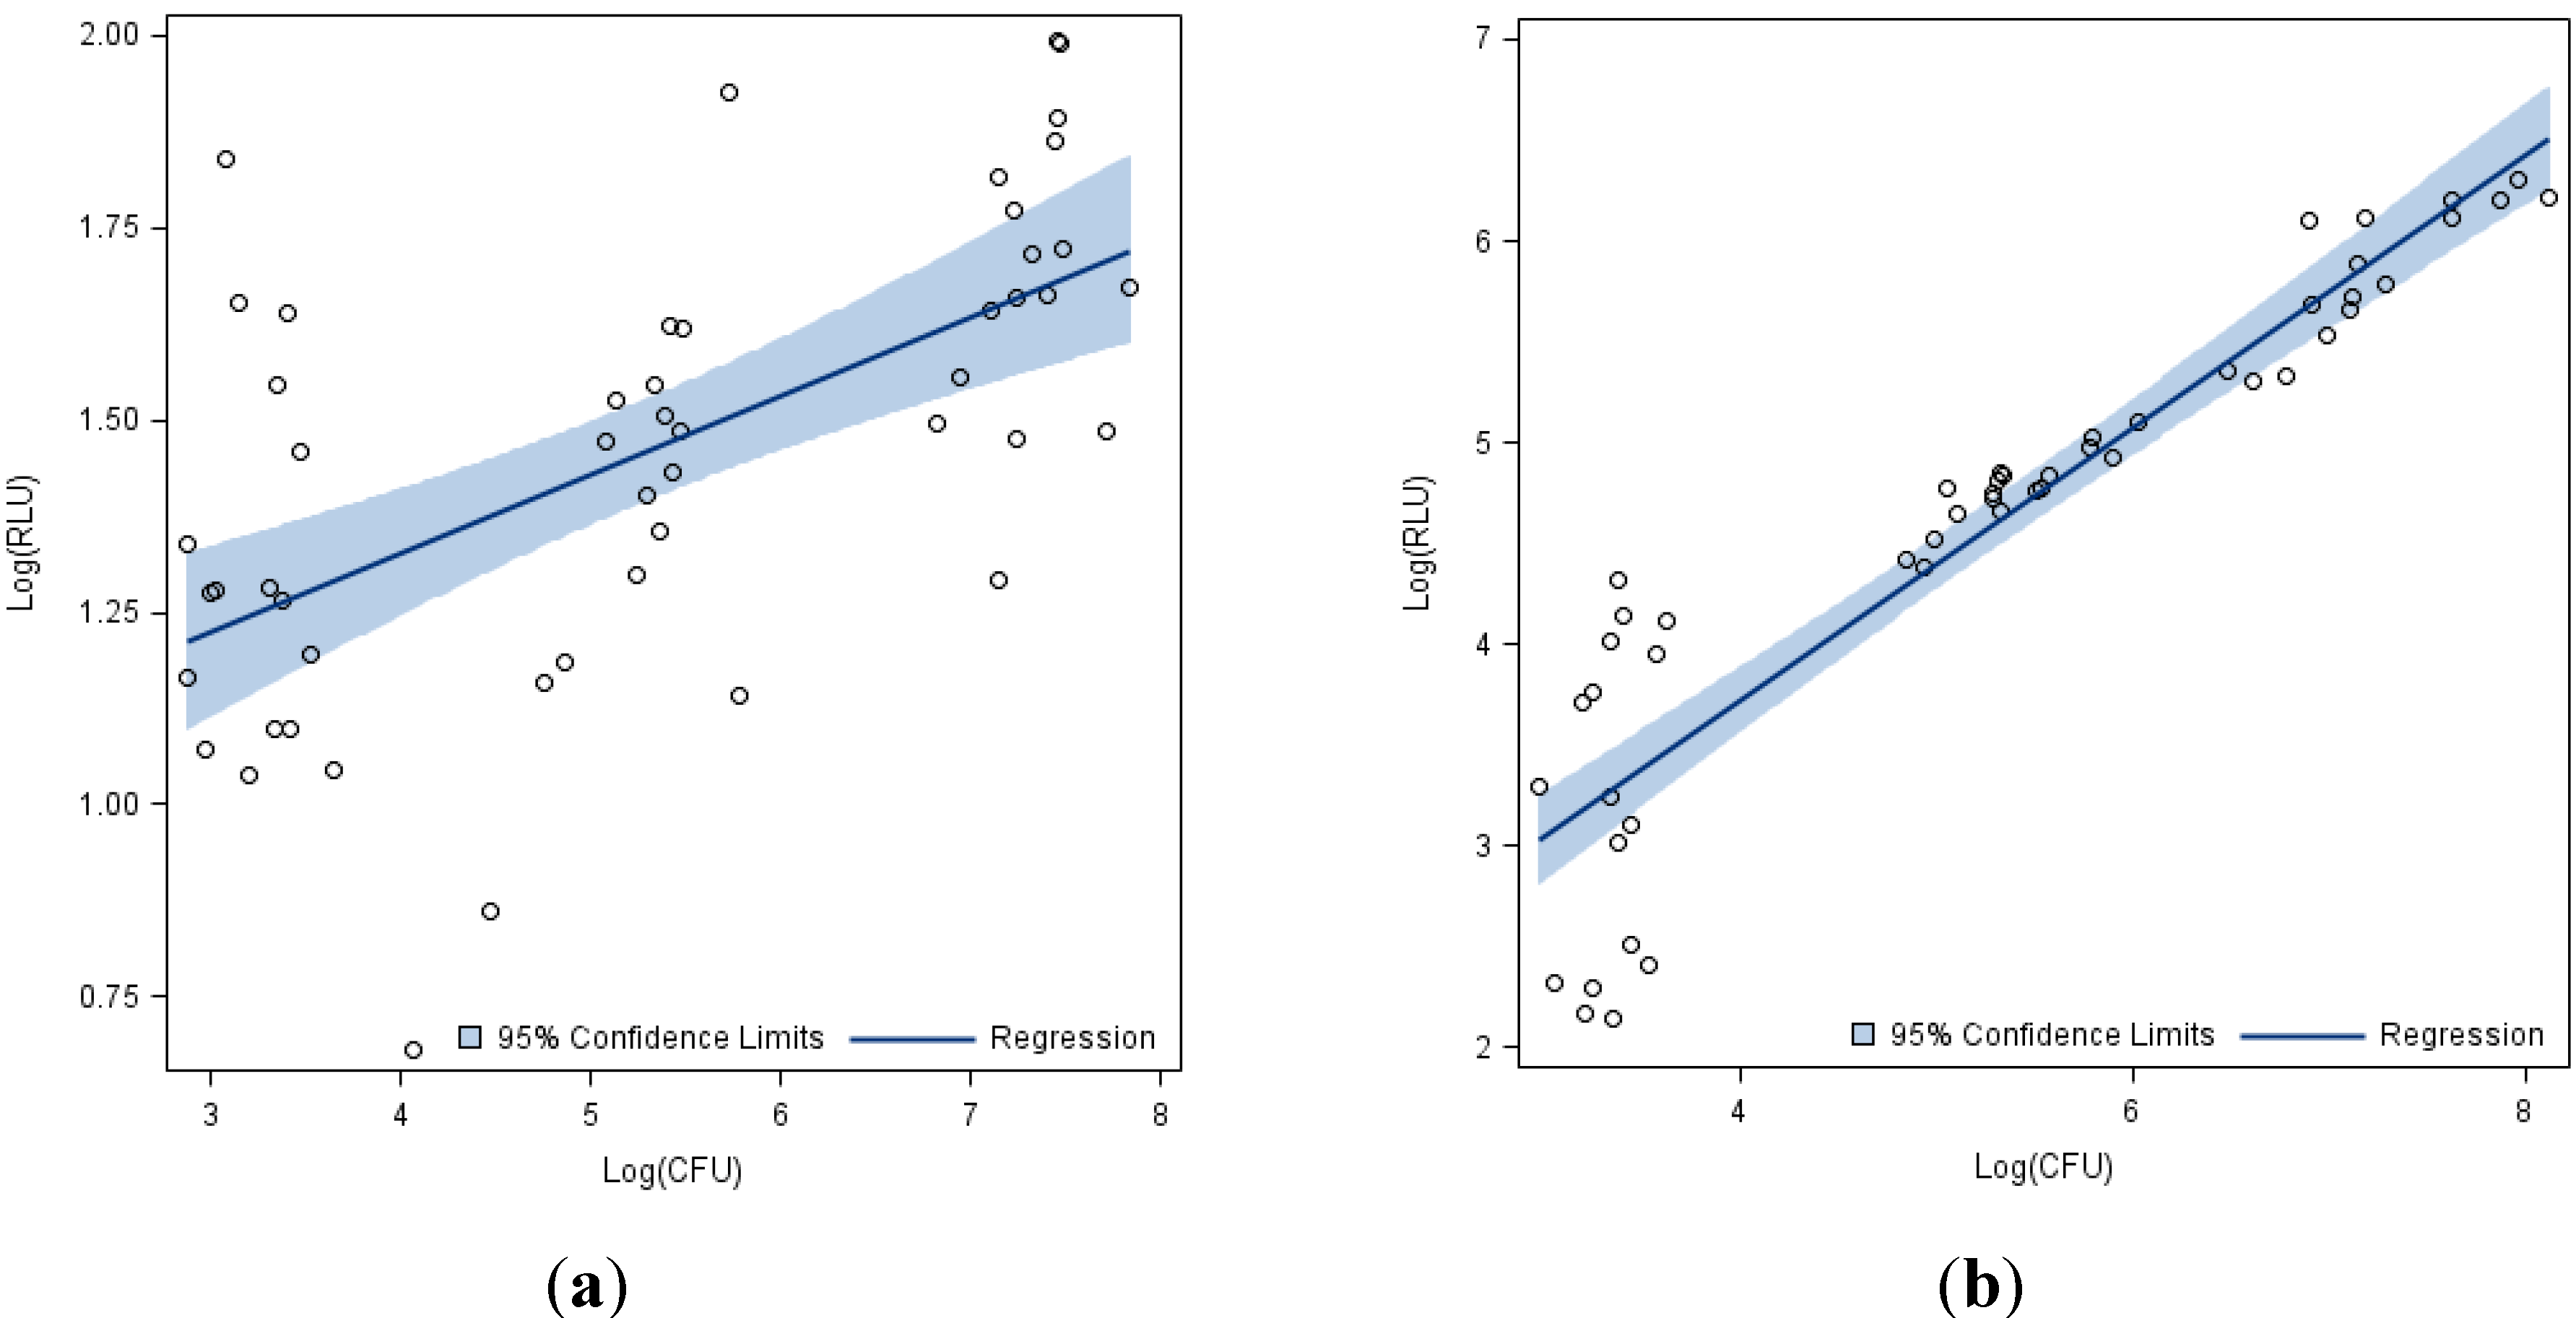
The results showed a positive correlation between the log-adjusted CFU and RLU for both endospores (
Figure 1a) and vegetative cells (
Figure 1b). While this correlation was statistically significant when all three concentrations (10
4, 10
6, 10
8 CFU/Surface) were evaluated together this did not hold when each individual concentration was evaluated (
Table 3).
Figure 1.
Log adjusted Relative Light Units (RLU) from ATP bioluminescence assay vs. Log adjusted Colony Forming Units (CFU) from culture-based methods for B. anthracis across all 17 surfaces and three concentrations. (a) Endospores. (b) Vegetative Cells.
Figure 1.
Log adjusted Relative Light Units (RLU) from ATP bioluminescence assay vs. Log adjusted Colony Forming Units (CFU) from culture-based methods for B. anthracis across all 17 surfaces and three concentrations. (a) Endospores. (b) Vegetative Cells.
Table 3.
Correlations between log(RLU) and log(CFU) for B. anthracis Sterne 34F2.
Table 3.
Correlations between log(RLU) and log(CFU) for B. anthracis Sterne 34F2.
| Organism | Nominal Slurry Concentration
CFU/Surface | N | Pearson Correlation Coefficient log(RLU) vs. log(CFU) | p-value |
|---|
| Endospores | 104 | 17 | −0.085 | 0.747 |
| 106 | 17 | 0.798 | <0.001 |
| 108 | 17 | 0.340 | 0.182 |
| All concentrations | 51 | 0.598 | <0.001 |
| Vegetative Cells | 104 | 17 | 0.271 | 0.293 |
| 106 | 17 | 0.874 | <0.001 |
| 108 | 17 | 0.886 | <0.001 |
| All concentrations | 51 | 0.925 | <0.001 |
| All organisms | All concentrations | 102 | 0.355 | <0.001 |
Seventeen surfaces were evaluated for this study and when all surfaces were evaluated together, there was a positive correlation between the log adjusted CFU and RLU when both endospores and vegetative cells were combined (
Table 3). Neither endospores nor vegetative cells showed a statistically significant positive correlation at the 10
4 concentration. This could be a result of the detection limits for each of the tests, including the manufacturer acknowledgement that 10
3–10
4 CFU is at the lower range of the detection limit for the 3M™ Clean-Trace™ ATP Surface Test kit. Additionally, endospores at the 10
8 concentration did not show a statistically significant correlation which could be the result of the known low levels of ATP in endospores becoming more obvious at higher suspension concentrations [
17,
18]. The spore form of
B. anthracis is the form that is used for weaponization [
19]. The results of our study show that the low ATP signal which does not correlate well to the CFU results would not make the ATP measuring devices effective in confirming contamination residual from a bioterrorist event. Additionally, the low signal related to the spore form of the organism would likely be lost in the background noise of other ATP and microbial sources that one would encounter in the natural environment.
The correlations for vegetative cells on each individual surface were very strong and statistically significant as were several of the surfaces exposed to spores (
Table 4). Nine of the seventeen surfaces evaluated demonstrated a positive and statistically significant correlation between ATP (RLU) and the increasing bacterial spore concentration (CFU) whereas all surfaces demonstrated statistical significance for the vegetative cells (
Table 4). However, this trend was lost when combining both the vegetative cells and endospore evaluation. When the vegetative cells and spores were combined and each surface was examined individually, the correlations became much weaker and not significant because the RLU numbers for vegetative cells were consistently much higher (several orders of magnitude) than they were for spores (
Table 4).
Table 4.
Correlations between RLU and CFU on individual surfaces.
Table 4.
Correlations between RLU and CFU on individual surfaces.
| Surface Material | Combined Vegetative Cells and Endospores | Vegetative Cells | Endospores |
|---|
| Pearson Correlation | p-value | Pearson Correlation | p-value | Pearson Correlation | p-value |
|---|
| Aluminum | 0.284 | 0.254 | 0.995 | <0.001 | 0.574 | 0.106 |
| Bed mattress fabric | 0.259 | 0.300 | 0.970 | <0.001 | 0.843 | 0.004 |
| Bed rail | 0.320 | 0.196 | 0.986 | <0.001 | 0.484 | 0.187 |
| Carpet | 0.340 | 0.168 | 0.969 | <0.001 | 0.782 | 0.013 |
| Ceramic tile | 0.257 | 0.303 | 0.991 | <0.001 | −0.306 | 0.424 |
| Chrome light switch cover | 0.248 | 0.321 | 0.996 | <0.001 | 0.557 | 0.120 |
| Keyboard | 0.319 | 0.197 | 0.952 | <0.001 | 0.477 | 0.195 |
| Lexan polycarbonate | 0.516 | 0.028 | 0.991 | <0.001 | 0.937 | <0.001 |
| Nickel light switch cover | 0.421 | 0.082 | 0.989 | <0.001 | 0.780 | 0.013 |
| Paper | 0.500 | 0.035 | 0.931 | <0.001 | 0.668 | 0.049 |
| Plastic acrylic sheet | 0.308 | 0.214 | 0.989 | <0.001 | 0.697 | 0.037 |
| Plastic light switch cover | 0.476 | 0.054 | 0.990 | <0.001 | 0.669 | 0.070 |
| Porcelain tile | 0.462 | 0.054 | 0.989 | <0.001 | 0.778 | 0.014 |
| PVC | 0.288 | 0.247 | 0.985 | <0.001 | 0.727 | 0.027 |
| Stainless steel | 0.528 | 0.024 | 0.981 | <0.001 | 0.377 | 0.318 |
| Vinyl flooring | 0.195 | 0.438 | 0.998 | <0.001 | 0.844 | 0.004 |
| Wood-stained | 0.231 | 0.357 | 0.994 | <0.001 | −0.006 | 0.989 |
Only three of the seventeen surfaces for combined vegetative cells and spores were found to have a statistically significant correlation. This could indicate that we did not have a large enough sample size to determine significance for the other thirteen surfaces or that there are inherent differences between recoveries from each of the surfaces. This could also indicate differences in recovery efficiency across the seventeen surfaces.
It is important to note that stainless steel was one of the surfaces found to have a statistically significant correlation between RLU and CFU, and stainless steel is the carrier surface recommended for several methods conducted by the United States Environmental Protection Agency to evaluate disinfectant efficiency [
20]. So, differences in recovery between surfaces could result in differences between laboratory evaluations on stainless steel and disinfectant practices in the field; the surface texture of stainless steel could lend itself to both better disinfection and better recovery than other surfaces commonly found in the healthcare environment. By using stainless steel in surface evaluations and disinfection studies, there could be an inherent inflation of the study results.
This study indicated there was successful recovery and statistically significant relationship between RLU and CFU for vegetative cells on stainless steel but not spores of the same organism. Additionally, stainless steel is not the primary surface found in the hospital room or other environments. This might indicate a need to broaden surface disinfection studies beyond utilizing stainless steel to evaluate disinfection efficiency on a variety of surfaces, including plastics that are common in daily life, in order to get a more complete picture of disinfection as it is likely to take place in hospital environmental cleaning.
There are a number of limitations to our study. First, we only used one device, the 3M™ Clean-Trace™ ATP Surface test, to evaluate the ATP component of our study. Additionally, we only evaluated a limited number of surfaces that do not represent the whole of surface times that would be found in the environment. Also, our study was done under aseptic conditions so there was not the background noise of other ATP and microbial sources that one would encounter in the natural environment. Any future evaluation should consider these limitations.


