The Incidence of West Nile Disease in Russia in Relation to Climatic and Environmental Factors

 and
and
Abstract
:1. Introduction
2. Materials and Methods
3. Results and Discussion


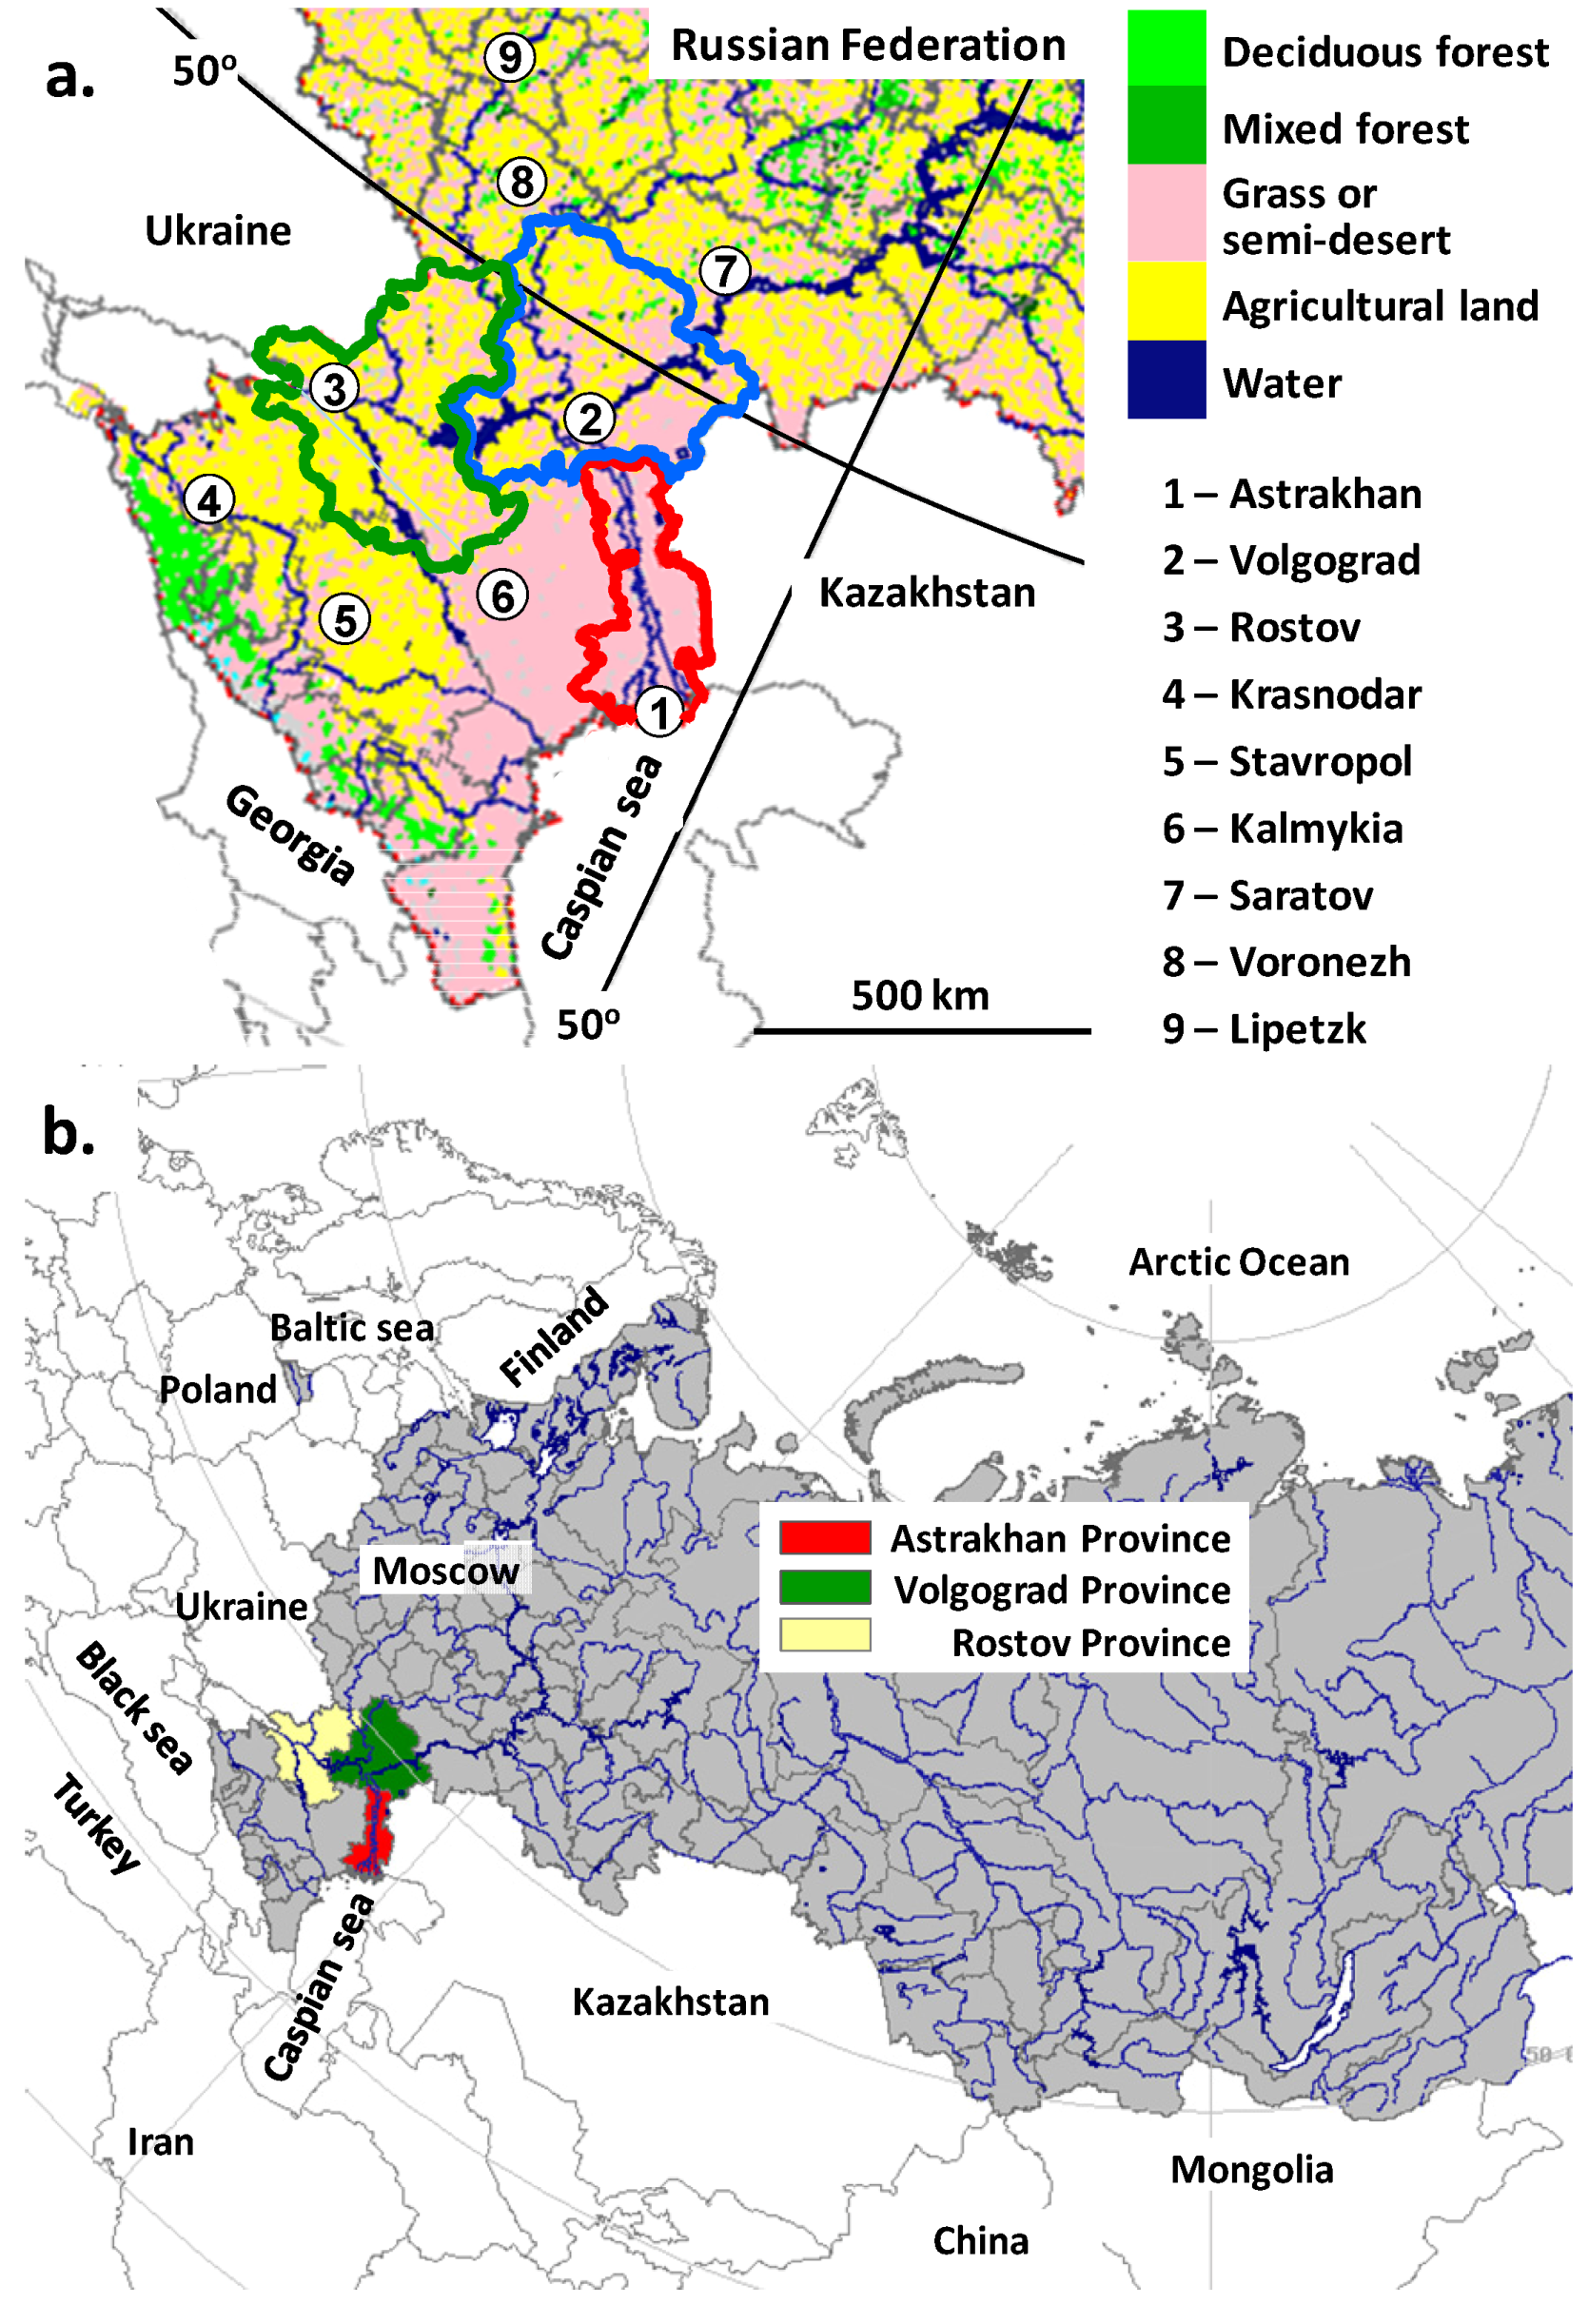
| Astrakhan Province | Volgograd Province | Rostov Province | |
|---|---|---|---|
| Total population | 1,000,000 | 2,600,000 | 4,300,000 |
| Proportion of urban residents in the total population, % | 67% | 76% | 67% |
| Total area, sq km | 44,100 | 113,900 | 100,800 |
| Agricultural land, cropland, % | 1% | 38.1% | 52.3% |
| Steppe (grass and/or semi-desert), % | 55.2% | 29.6% | 14.6% |
| Grassland, % | 37.1% | 22.4% | 23.6% |
| Soil with a minimum of vegetation, % | 5.4% | 5.2% | 6.2% |
| Water surface, % | 1.0% | 2.3% | 1.1% |
| Deciduous forest, % | 0.0% | 1.2% | 0.8% |
| Light coniferous forest, % | 0.0% | 0.8% | 1.0% |
| Urban zone, % | 0.3% | 0.3% | 0.4% |
| Astrakhan Province | Volgograd Province | Rostov Province | ||||
|---|---|---|---|---|---|---|
| Year | WND incidence per 100,000 population | Classifi-cation of changes in WND incidence | WND incidence per 100,000 population | Classifi-cation of changes in WND incidence | WND incidence per 100,000 population | Classifi-cation of changes in WND incidence |
| 1997 | 0.80 | > 0.19 | 0? | |||
| 1998 | 0.90 | Stability * | > 1.31 | Increase? | 0? | |
| 1999 | 9.50 | Increase | > 14.3 | Increase | 0? | |
| 2000 | 3.70 | Decrease | 1.20 | Decrease | 0.11 | Increase? |
| 2001 | 4.90 | Increase | 0.56 | Decrease | 0.11 | Stability |
| 2002 | 3.70 | Decrease | 0.53 | Stability | 0.00 | Decrease |
| 2003 | 1.20 | Decrease | 0.00 | Decrease | 0.05 | Increase |
| 2004 | 2.60 | Increase | 0.00 | Stability | 0.16 | Increase |
| 2005 | 7.30 | Increase | 0.11 | Stability | 0.37 | Increase |
| 2006 | 1.41 | Decrease | 0.45 | Stability | 0.30 | Decrease |
| 2007 | 3.32 | Increase | 2.40 | Increase | 0.44 | Increase |
| 2008 | 0.10 | Decrease | 0.08 | Decrease | 0.02 | Decrease |
| 2009 | 0.30 | Stability | 0.19 | Stability | 0.02 | Stability |
| 2010 | 1.19 | Increase | 15.92 | Increase | 1.39 | Increase |
| 2011 | 1.78 | Increase | 2.34 | Decrease | 0.37 | Decrease |
| 2012 | 7.11 | Increase | 8.07 | Increase | 1.12 | Increase |
| 2013 | 6.03 | Decrease | 1.85 | Decrease | 0.19 | Decrease |
| Mean, 2001–2012 | 2.91 | 2.55 | 0.36 | |||

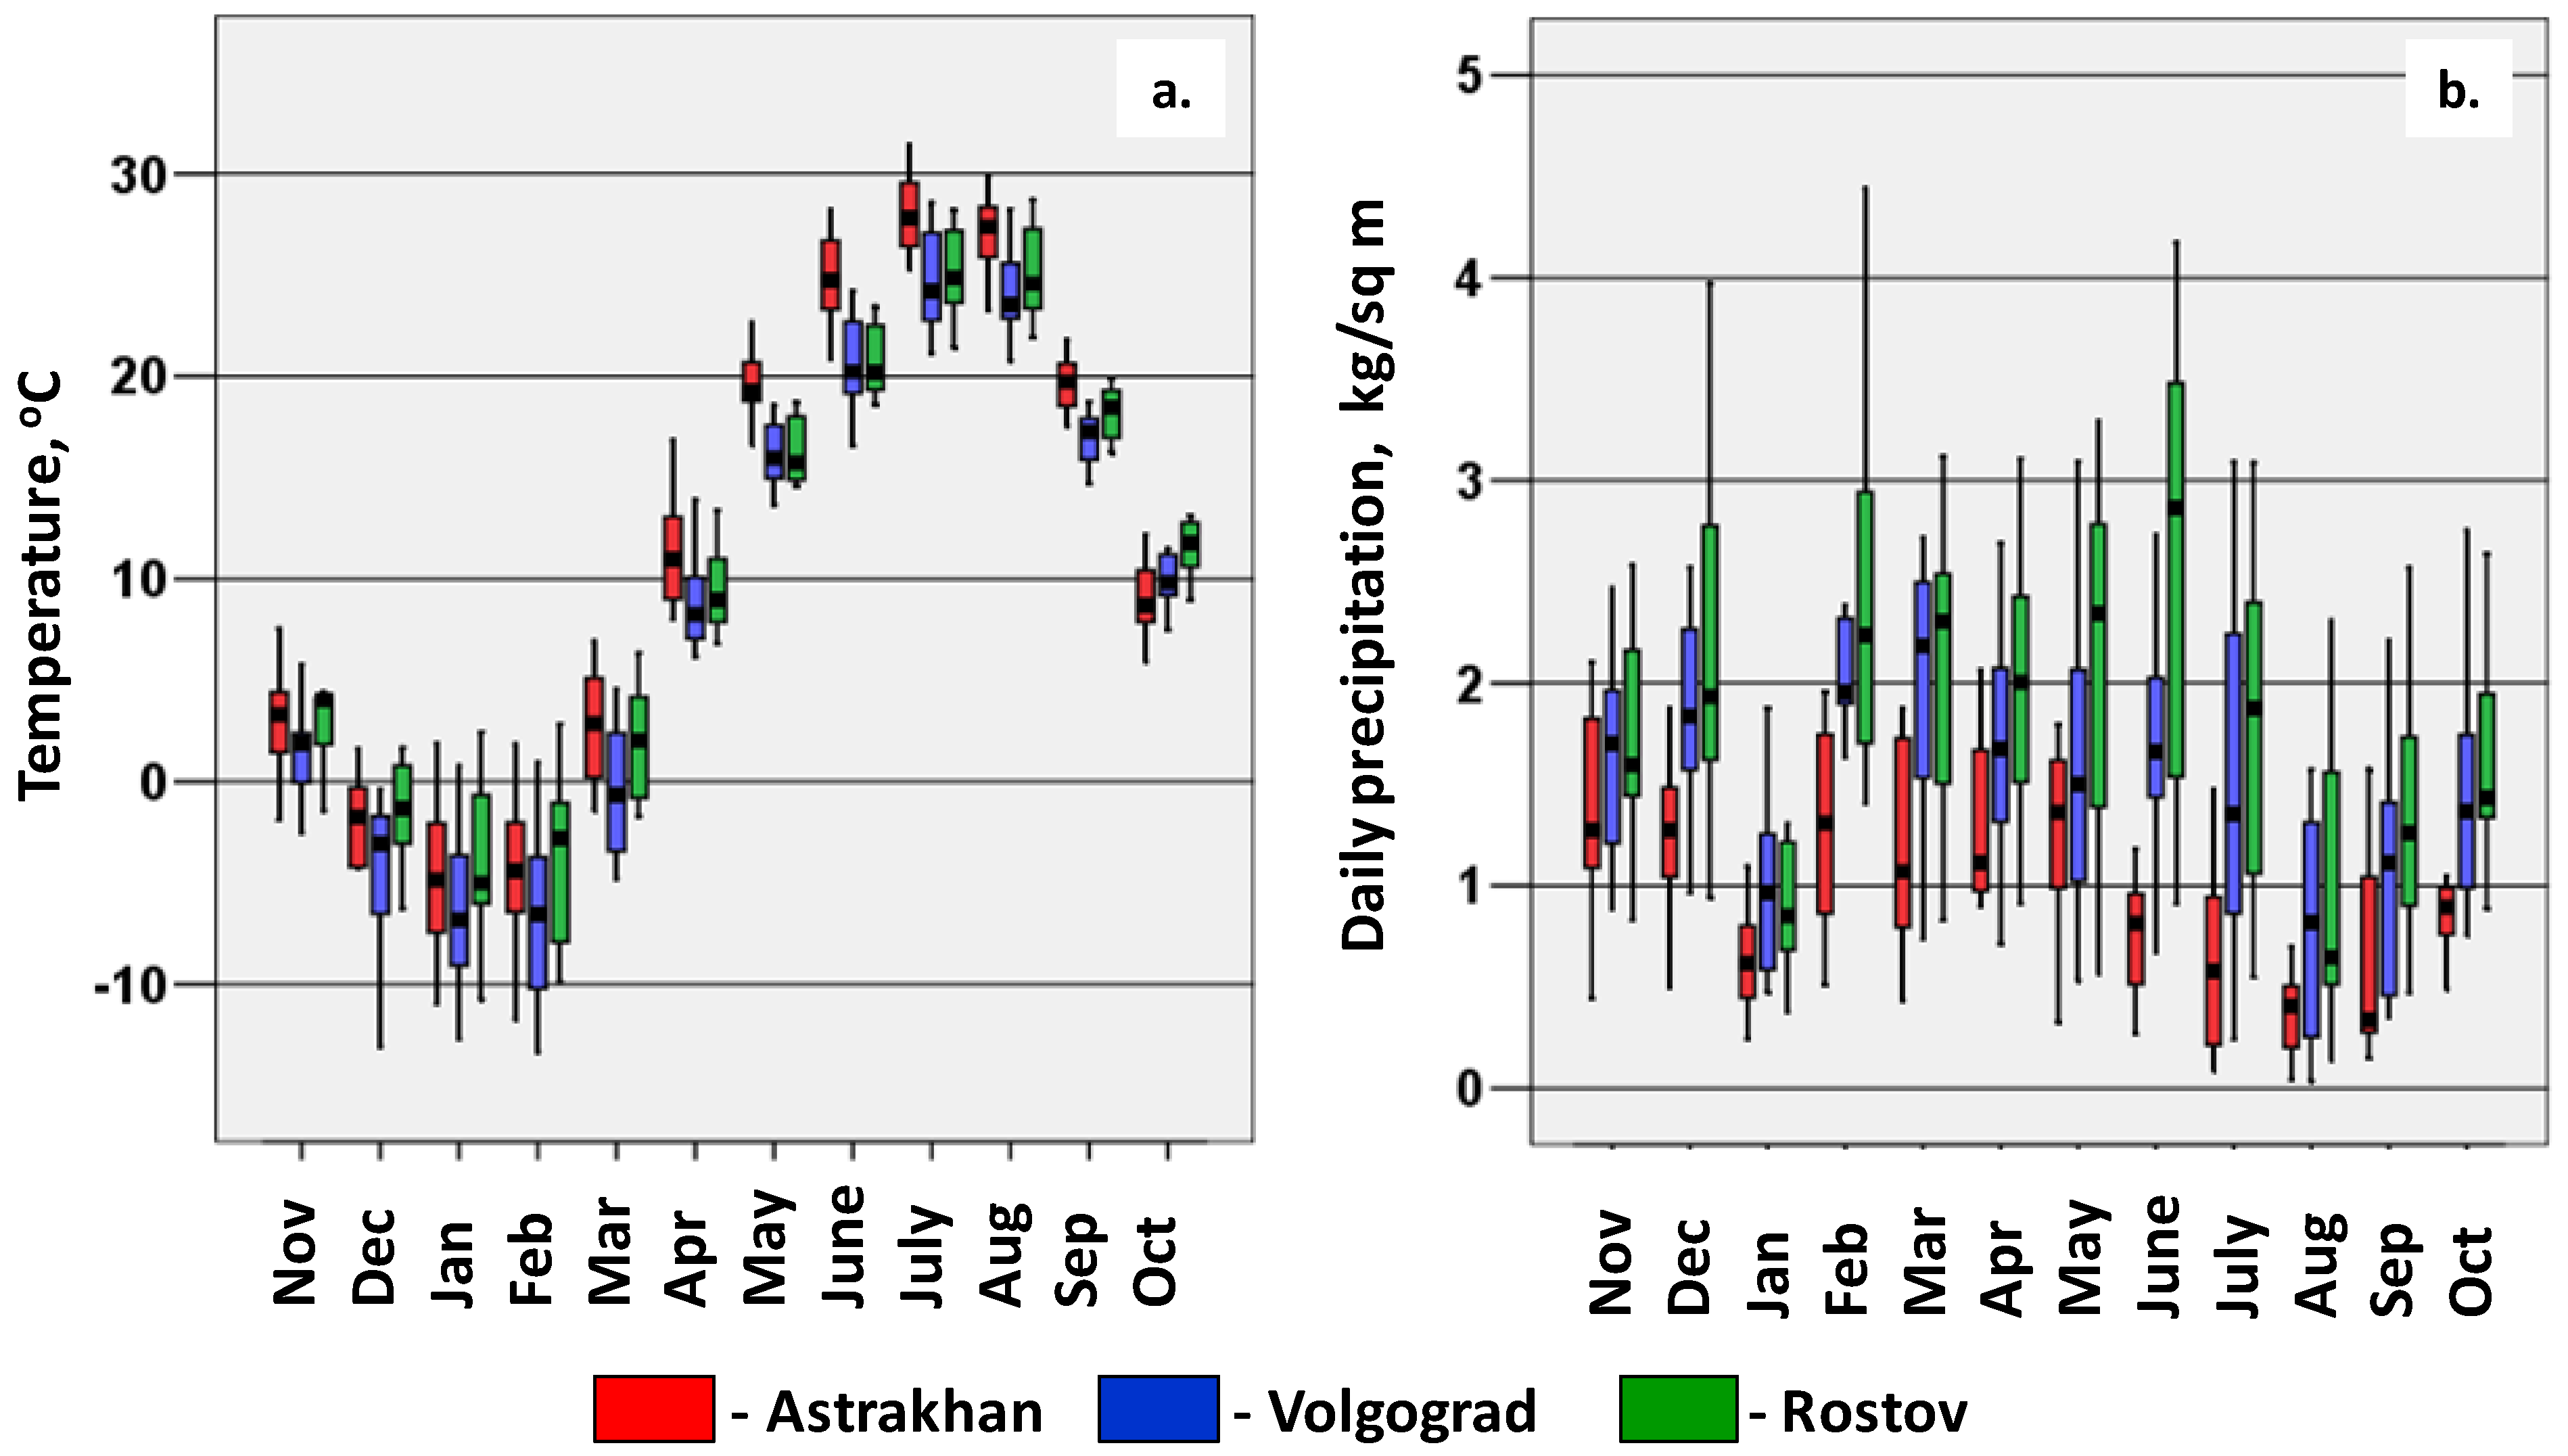
| Province: | Astrakhan | Volgograd | Rostov |
|---|---|---|---|
| Mean temperature in one or several months | Spearman’s correlation coefficient and significance level (p value) | ||
| December | 0.31 (0.32) | 0.47 (0.12) | 0.64 (0.026) 1 |
| January | 0.66 (0.020) | −0.014 (0.96) | 0.23 (0.47) |
| May | 0.38 (0.23) | 0.44 (0.15) | 0.71 (0.010) |
| June | −0.18 (0.57) | 0.64 (0.024) | 0.50 (0.095) |
| July | −0.042 (0.90) | 0.65 (0.023) | −0.007 (0.98) |
| August | −0.007 (0.98) | 0.43 (0.16) | 0.46 (0.13) |
| September | 0.40 (0.20) | 0.31 (0.33) | 0.32 (0.32) |
| December—January | 0.70 (0.011) | 0.24 (0.46) | 0.47 (0.12) |
| May—June | 0.084 (0.80) | 0.62 (0.031) | 0.69 (0.014) |
| May—July | 0.18 (0.59) | 0.89 (<0.001) | 0.48 (0.12) |
| August—September | 0.25 (0.44) | 0.42 (0.17) | 0.41 (0.18) |

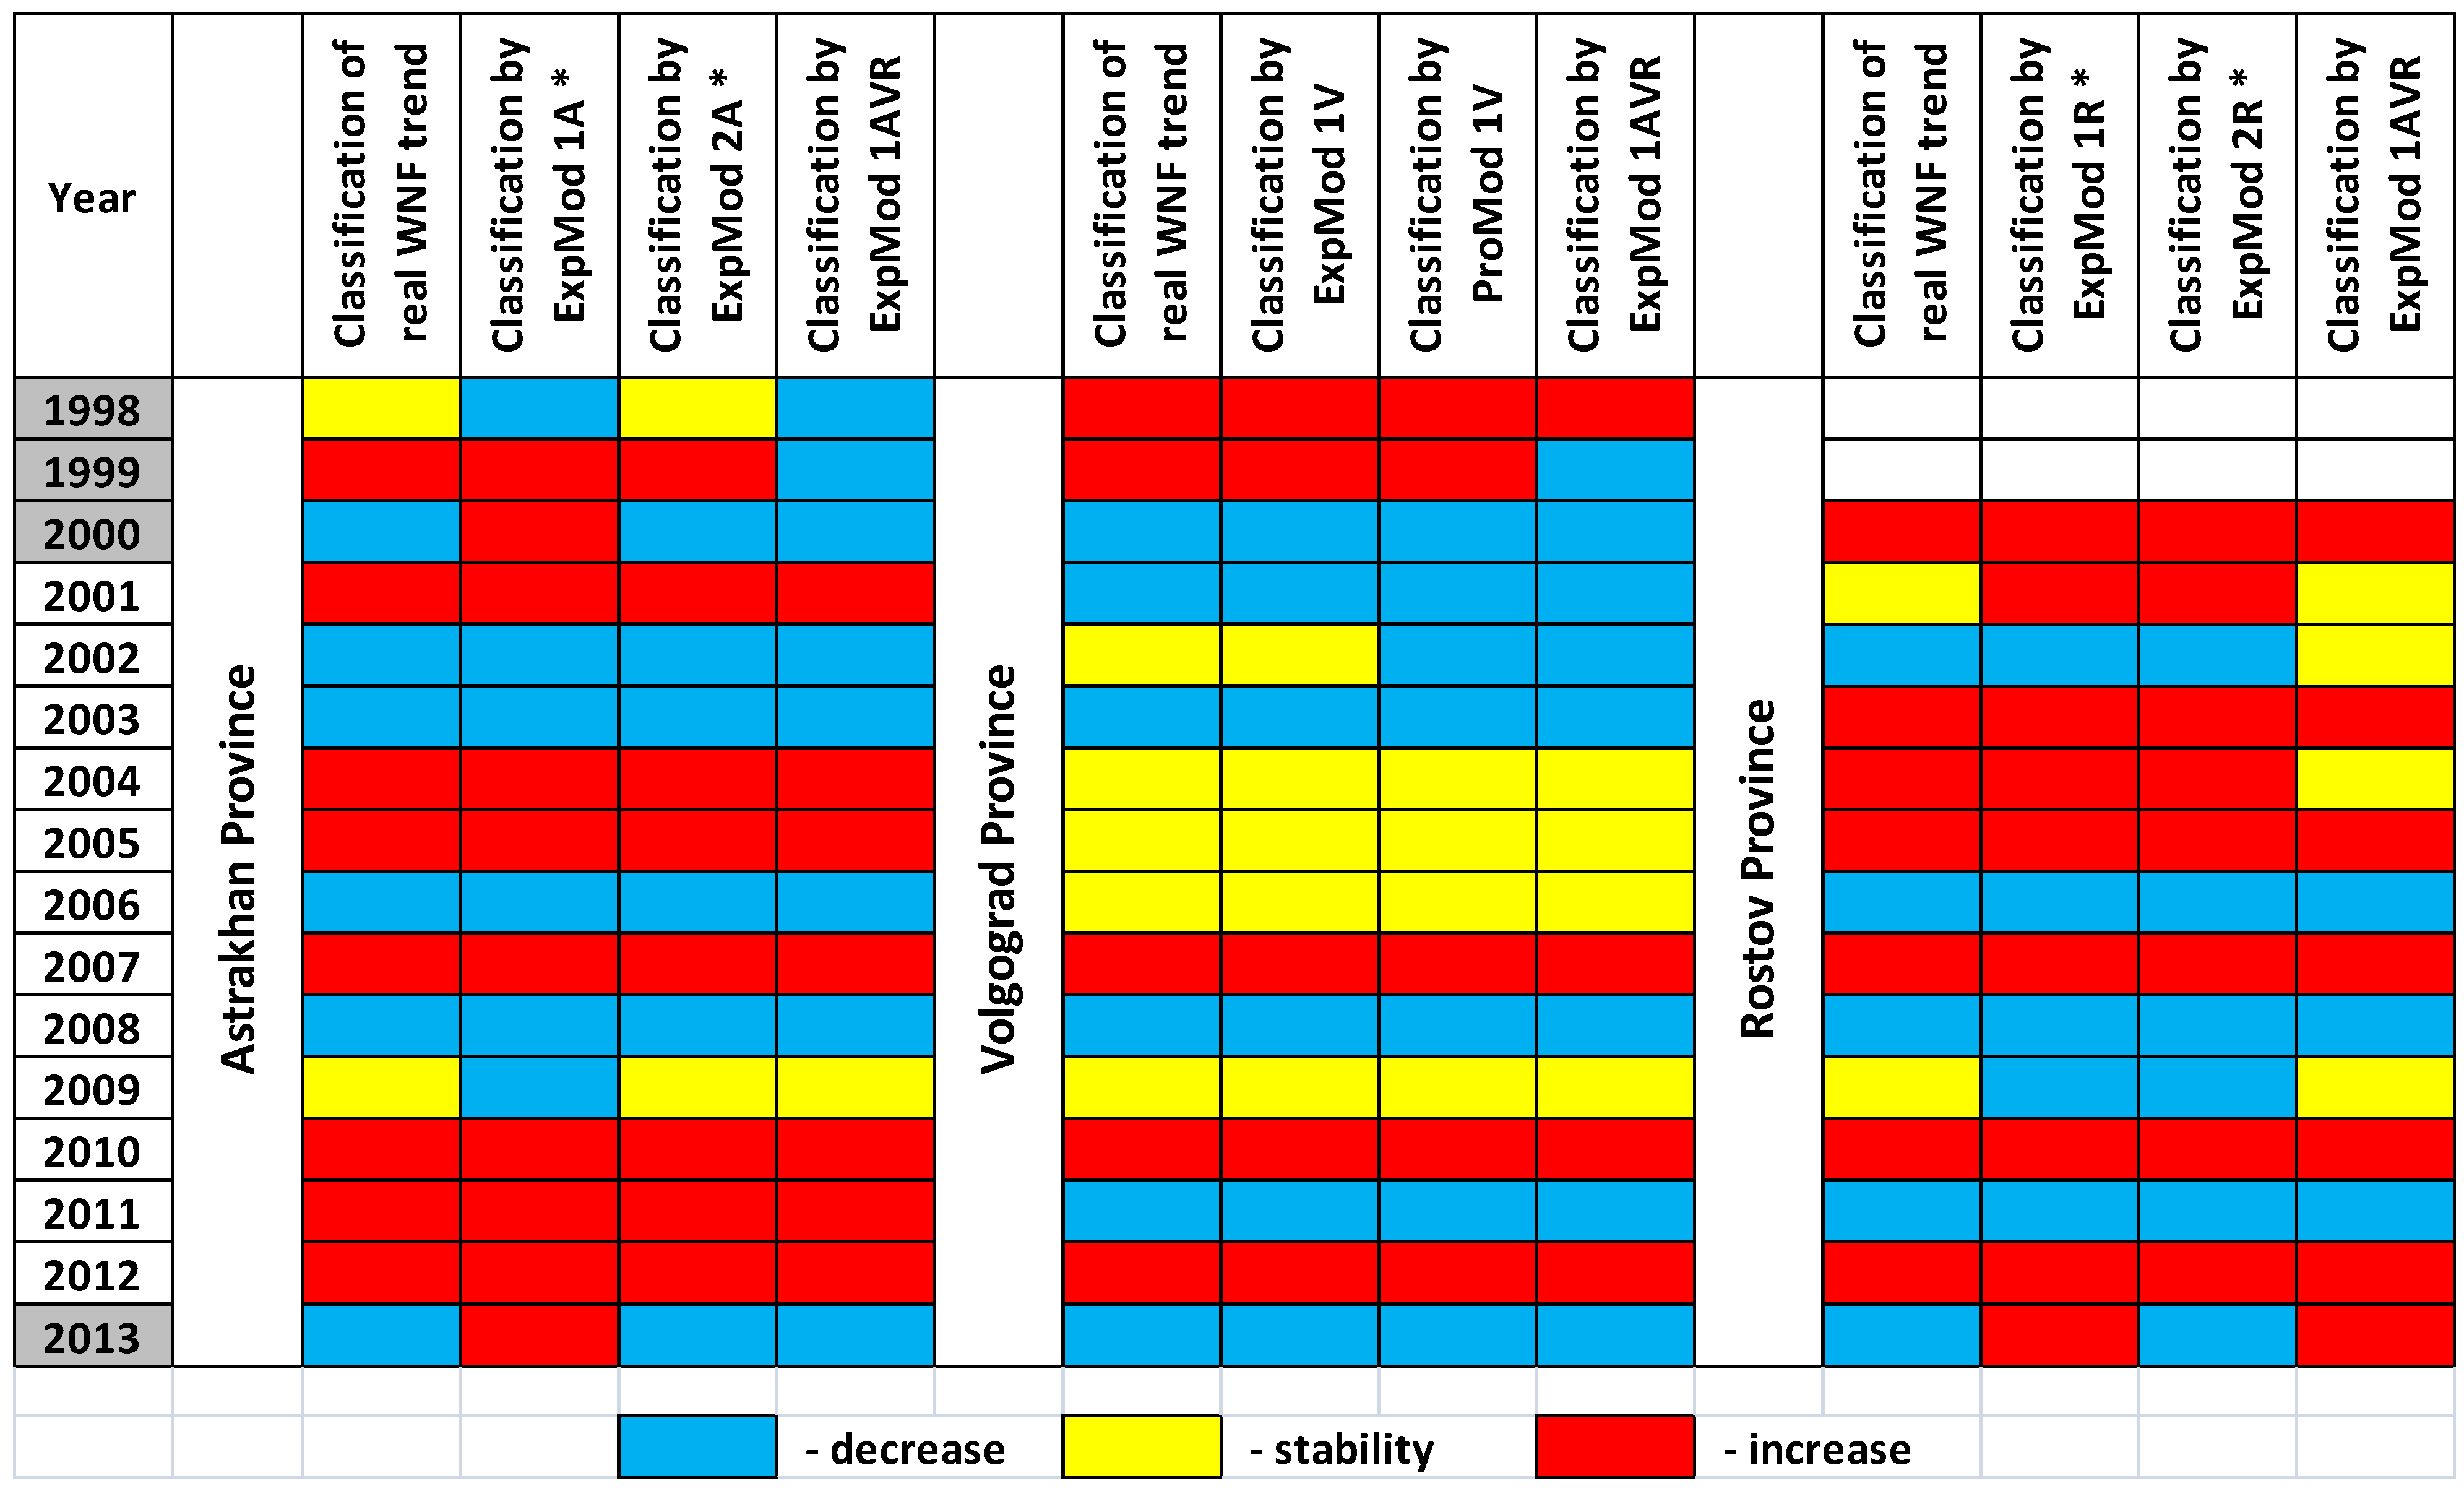
| Province | Type of model | Value of parameters and/or their combinations | Prediction of model and number of years | Real events in these years | % of correct classifi-cations |
|---|---|---|---|---|---|
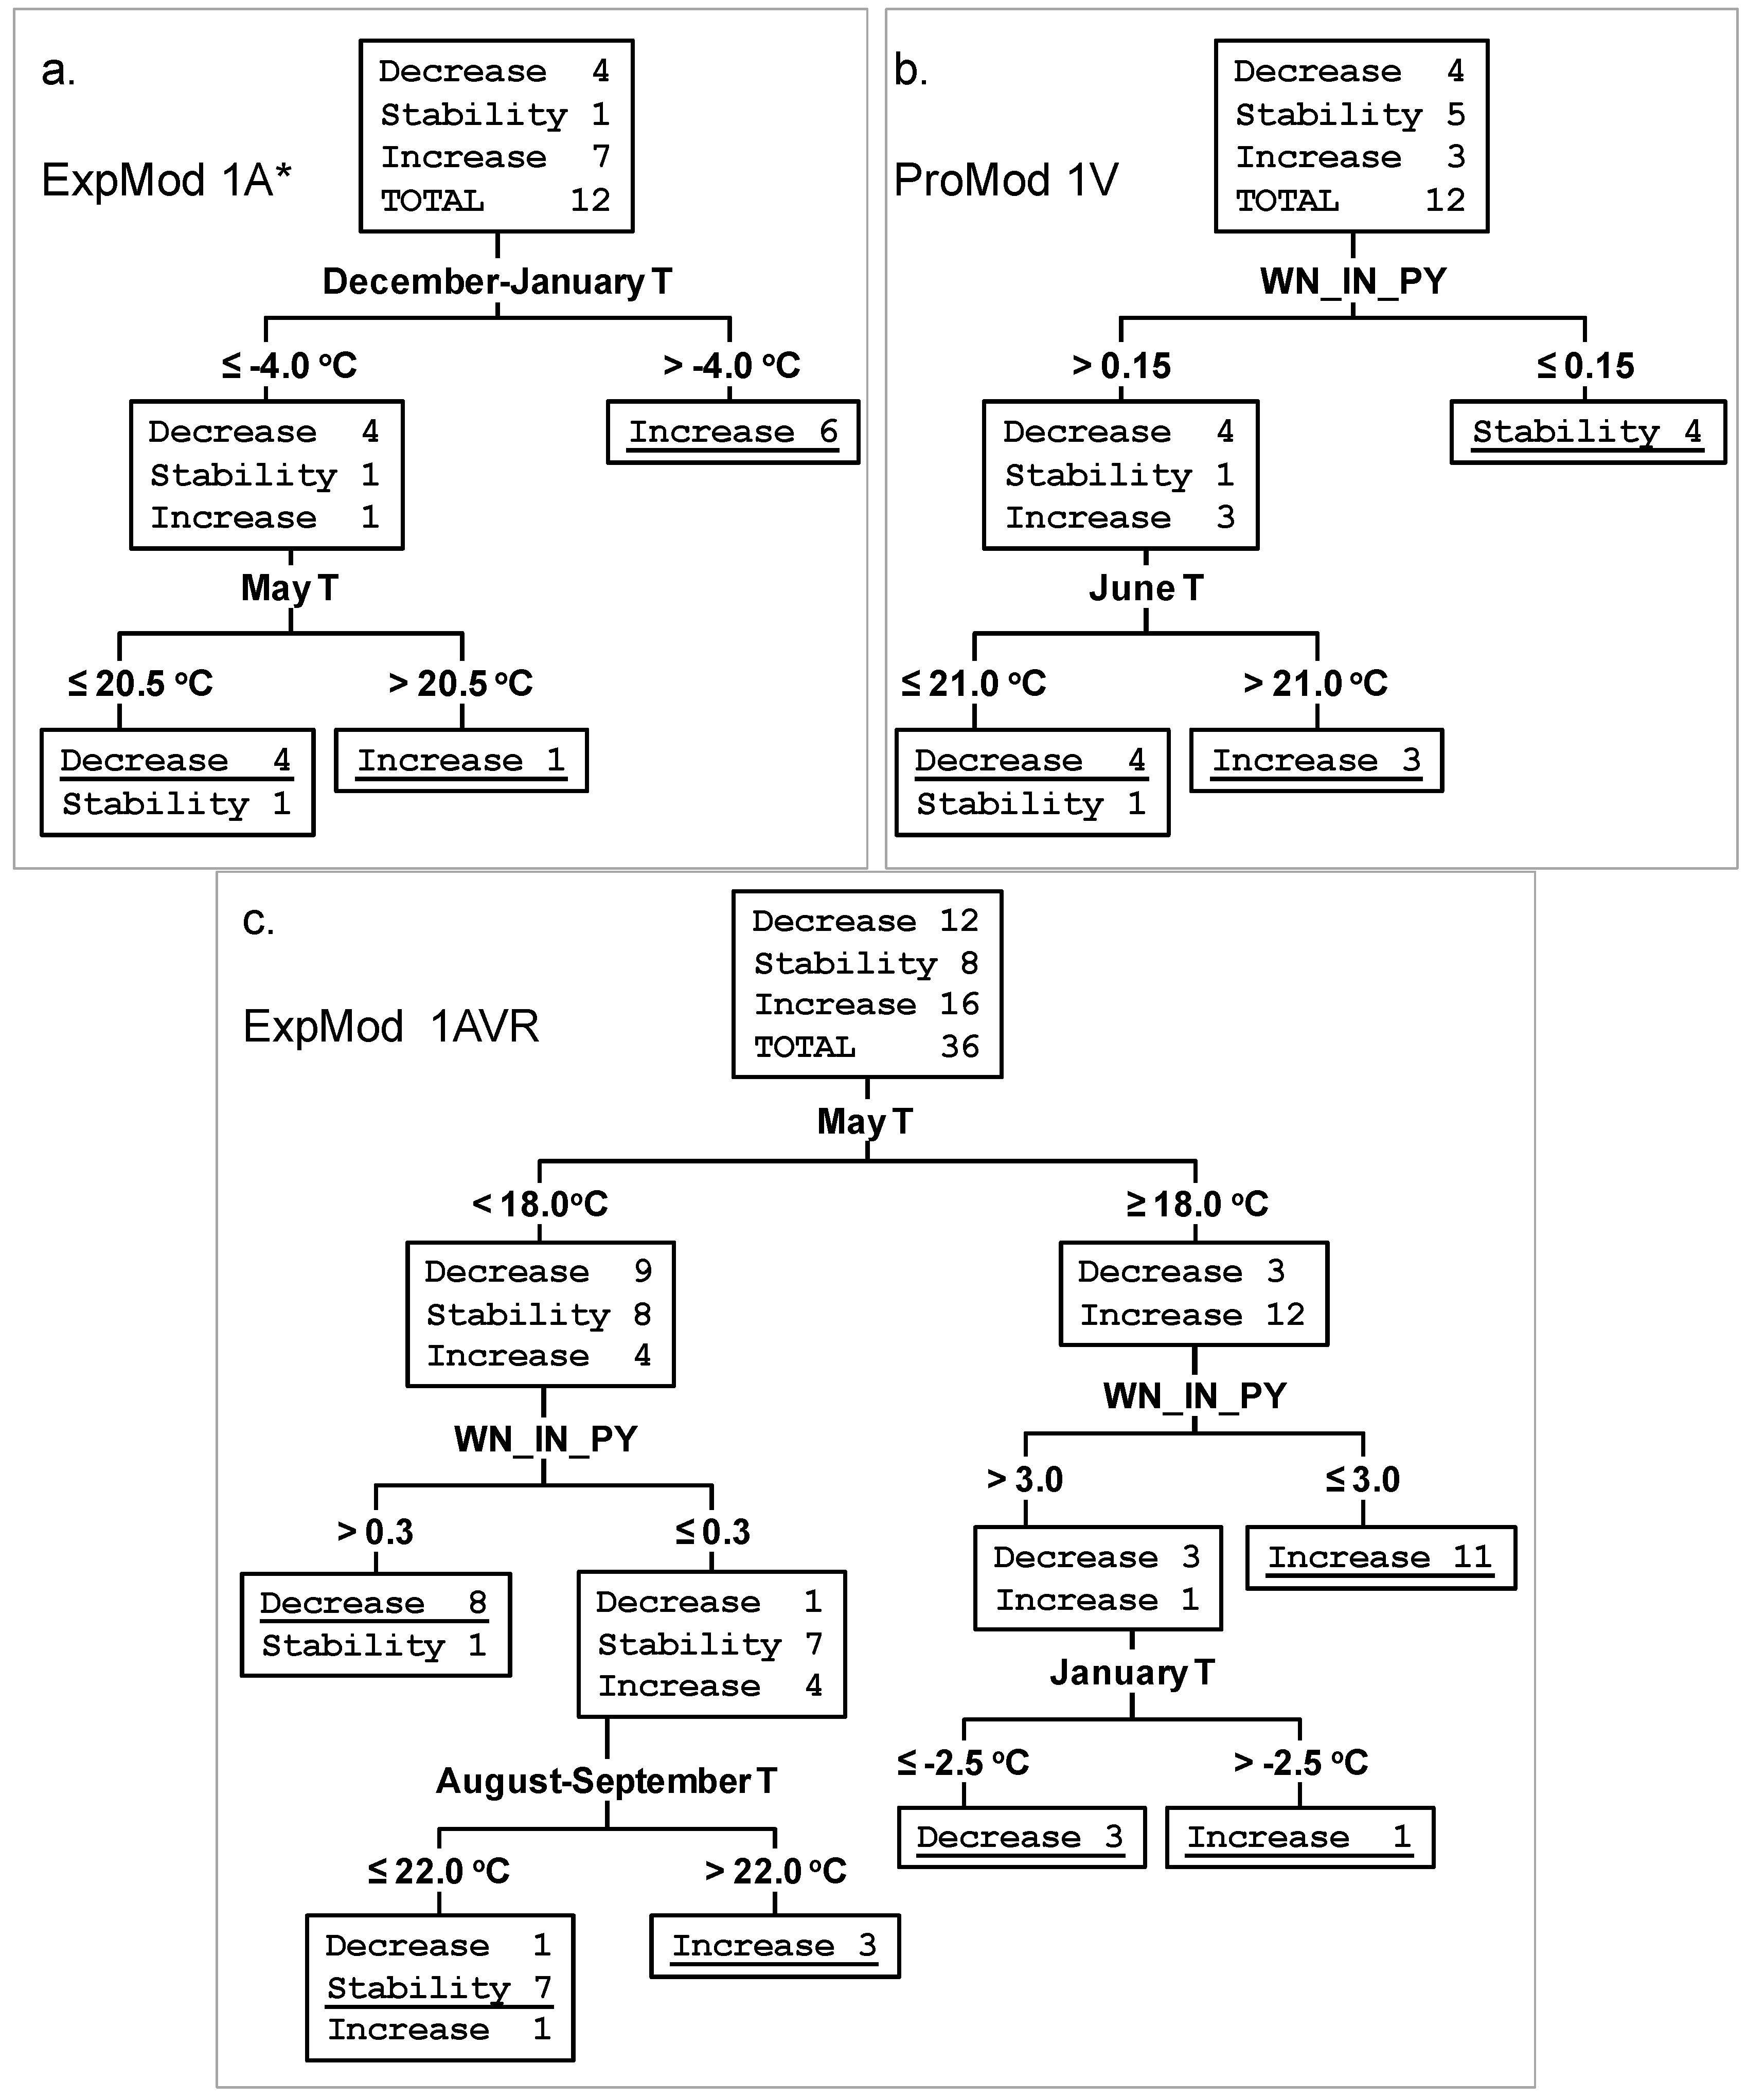
| Astrakhan | ExpMod 1A * | December—January T > −4.0 °C | Increase for 6 years | Increase in 6 years | 100% |
| December-January T ≤ −4.0 °C and May T ≥ 20.5 °C | Increase for 1 year | Increase in 1 year | 100% | ||
| December-January T ≤ −4.0 °C and May T < 20.5 °C | Decrease for 5 years | Decrease in 4 years, stability in 1 year ** | 80% | ||
| Total % of correct classifications for ExpMod 1A | 92% | ||||
| Astrakhan | ExpMod 2A * | WN_IN_PY *** < 3.0 and December T > −4.0 °C | Increase for 6 years | Increase in 6 years | 100% |
| WN_IN_PY < 3.0 and December T < −4.0 °C | Stability for 1 year | Stability in 1 year | 100% | ||
| WN_IN_PY > 3.0 and January T > −2.0 °C | Increase for 1 year | Increase in 1 year | 100% | ||
| WN_IN_PY > 3.0 and January T < −2.0 °C | Decrease for 4 years | Decrease in 4 years | 100% | ||
| Total % of correct classifications for ExpMod 2A | 100% | ||||
| Volgograd | ExpMod 1V | May—June T > 19.5 °C | Increase for 3 years | Increase for 3 years | 100% |
| May—June T ≤ 19.5 °C and September T > 16.5 °C | Stability for 5 year | Stability in 5 year | 100% | ||
| May—June T ≤ 19.5 °C and September T ≤ 16.5 °C | Decrease for 4 years | Decrease in 4 years | 100% | ||
| Total % of correct classifications for ExpMod 1V | 100% | ||||
| Volgograd | ProMod 1V | WN_IN_PY > 0.15 and June T > 21.0 °C | Increase for 3 years | Increase in 3 years | 100% |
| WN_IN_PY < 0.15 | Stability for 4 year | Stability in 4 year | 100% | ||
| WN_IN_PY > 0.15 and June T < 21.0 °C | Decrease for 5 years | Decrease in 4 years, stability in 1 year ** | 80% | ||
| Total % of correct classifications ProMod 1V | 92% | ||||
| Rostov | ExpMod 1R * | May T > 16.5 °C | Increase for 5 years | Increase in 5 years | 100% |
| May T < 16.5 °C and January T > −3.0 °C | Increase for 2 years | Increase in 1 years, stability in 1 year ** | 50% | ||
| May T < 16.5 °C and January T ≤ −3.0 °C | Decrease for 5 years | Decrease in 4 years, stability in 1 year ** | 80% | ||
| Total % of correct classifications ExpMod 1R | 83% | ||||
| Rostov | ExpMod 2R * | WN_IN_PY < 0.40 and May T > 16.5 °C | Increase for 5 years | Increase in 5 years | 100% |
| WN_IN_PY < 0.40 and May T < 16.5 °C and December—January T > −2.0 °C | Increase for 2 years | Increase in 1 years, stability in 1 year ** | 50% | ||
| WN_IN_PY < 0.40 and May T < 16.5 °C and December—January T < −2.0 °C | Decrease for 3 years | Decrease in 2 years, stability in 1 year ** | 67% | ||
| WN_IN_PY > 0.40 | Decrease for 2 years | Decrease in 2 years | 100% | ||
| Total % of correct classifications ExpMod 2R | 83% | ||||
| Astrakhan Volgograd Rostov | ExpMod 1AVR | May T ≥ 18.0 °C and WN_IN_PY ≤ 2.5 | Increase for 11 years | Increase in 11 years | 100% |
| May T ≥ 18.0 °C and WN_IN_PY > 3.0 and January T > −2.5 °C | Increase for 1 year | Increase in 1 year | 100% | ||
| May T ≥ 18.0 °C and WN_IN_PY > 3.0 and January T < −2.5 °C | Decrease for 2 years | Decrease in 2 years | 100% | ||
| May T < 18.0 °C and WN_IN_PY ≤ 0.3 and August-September T > 22 °C | Increase for 3 years | Increase in 3 years | 100% | ||
| May T < 18.0 °C and WN_IN_PY ≤ 0.3 and August-September T < 22 °C | Stability for 9 years | Stability in 7 years, increase in 1 year, decrease in 1 year | 78% | ||
| May T < 18.0 °C and WN_IN_PY > 0.3 | Decrease for 9 years | Decrease in 8 years, stability in 1 year | 89% | ||
| Total % of correct classifications ExpMod 1AVR | 92% | ||||

4. Conclusions
Acknowledgments
Conflicts of Interest
References
- Hayes, E.B.; Sejvar, J.J.; Zaki, S.R.; Lanciotti, R.S.; Bode, A.V.; Campbell, G.L. Virology, pathology, and clinical manifestations of West Nile virus disease. Emerg. Infect. Dis. 2005, 11, 1174–1179. [Google Scholar] [CrossRef]
- Platonov, A.E. The influence of weather conditions on the epidemiology of vector-borne diseases by the example of West Nile fever in Russia. (in Russian). Vestn. Ross. Akad. Med. Nauk. 2006, 2, 25–29. [Google Scholar]
- Platonov, A.E.; Fedorova, M.V.; Karan, L.S.; Shopenskaya, T.A.; Platonova, O.V.; Zhuravlev, V.I. Epidemiology of West Nile infection in Volgograd, Russia, in relation to climate change and mosquito (Diptera: Culicidae) bionomics. Parasitol. Res. 2008, 103, S45–S53. [Google Scholar] [CrossRef]
- Gubler, D.J. The continuing spread of West Nile virus in the western hemisphere. Clin. Infect. Dis. 2007, 45, 1039–1046. [Google Scholar] [CrossRef]
- Paz, S.; Malkinson, D.; Green, M.S.; Tsioni, G.; Papa, A.; Danis, K.; Sirbu, A.; Ceianu, C.; Katalin, K.; Ferenczi, E.; et al. Permissive summer temperatures of the 2010 European West Nile fever upsurge. PLoS One 2013, 8. [Google Scholar] [CrossRef]
- European Centre for Disease Prevention and Control. Available online: http://ecdc.europa.eu/en/healthtopics/west_nile_fever/West-Nile-fever-maps/Pages/index.aspx (accessed on 20 September 2013).
- Zeller, H.G.; Schuffenecker, I. West Nile virus: An overview of its spread in Europe and the Mediterranean basin in contrast to its spread in the Americas. Eur. J. Clin. Microbiol. Infect. Dis. 2004, 23, 147–156. [Google Scholar] [CrossRef]
- Artsob, H.; Gubler, D.J.; Enria, D.A.; Morales, M.A.; Pupo, M.; Bunning, M.L.; Dudley, J.P. West Nile Virus in the New World: Trends in the spread and proliferation of West Nile Virus in the Western Hemisphere. Zoonoses Public Health 2009, 56, 357–369. [Google Scholar] [CrossRef]
- May, F.J.; Davis, C.T.; Tesh, R.B.; Barrett, A.D. Phylogeography of West Nile virus: From the cradle of evolution in Africa to Eurasia, Australia, and the Americas. J. Virol. 2011, 85, 2964–2974. [Google Scholar] [CrossRef]
- Bakonyi, T.; Ivanics, E.; Erdelyi, K.; Ursu, K.; Ferenczi, E.; Weissenbock, H.; Nowotny, N. Lineage 1 and 2 strains of encephalitic West Nile virus, central Europe. Emerg. Infect. Dis. 2006, 12, 618–623. [Google Scholar] [CrossRef]
- Shopenskaya, T.A.; Fedorova, M.V.; Karan, L.S.; Frolov, A.Y.; Malenko, G.V.; Levina, L.S.; Pogodina, V.V.; Platonov, A.E. New variant of West Nile virus and its potential epizootic and epidemic importance. (in Russian). Epidemiol. Infect. Dis. 2008, 5, 38–44. [Google Scholar]
- Platonov, A.E.; Karan, L.S.; Shopenskaia, T.A.; Fedorova, M.V.; Koliasnikova, N.M.; Rusakova, N.M.; Shishkina, L.V.; Arshba, T.E.; Zhuravlev, V.I.; Govorukhina, M.V.; et al. Genotyping of West Nile fever virus strains circulating in Southern Russia as an epidemiological investigation method: Principles and results. (in Russian). Zh. Mikrobiol. Epidemiol. Immunobiol. 2011, 5, 29–37. [Google Scholar]
- Danis, K.; Papa, A.; Theocharopoulos, G.; Dougas, G.; Athanasiou, M.; Detsis, M.; Baka, A.; Lytras, T.; Mellou, K.; Bonovas, S.; Panagiotopoulos, T. Outbreak of West Nile virus infection in Greece, 2010. Emerg. Infect. Dis. 2011, 17, 1868–1872. [Google Scholar] [CrossRef]
- Kalaycioglu, H.; Korukluoglu, G.; Ozkul, A.; Oncul, O.; Tosun, S.; Karabay, O.; Gozalan, A.; Uyar, Y.; Caglayık, D.Y.; Atasoylu, G.; et al. Emergence of West Nile virus infections in humans in Turkey, 2010 to 2011. Euro Surveill. 2012, 17. Available online: http://www.eurosurveillance.org/ViewArticle.aspx?ArticleId=20182 (accessed on 8 November 2013).
- Neghina, A.M.; Neghina, R. Reemergence of human infections with West Nile virus in Romania, 2010: An epidemiological study and brief review of the past situation. Vector Borne Zoonotic Dis. 2011, 11, 1289–1292. [Google Scholar] [CrossRef]
- Ciccozzi, M.; Peletto, S.; Cella, E.; Giovanetti, M.; Lai, A.; Gabanelli, E.; Acutis, P.L.; Modesto, P.; Rezza, G.; Platonov, A.E.; Lo Presti, A.; Zehender, G. Epidemiological history and phylogeography of West Nile virus lineage 2. Infect. Genet. Evol. 2013, 17, 46–50. [Google Scholar] [CrossRef]
- Hayes, E.B.; Komar, N.; Nasci, R.S.; Montgomery, S.P.; O’Leary, D.R.; Campbell, G.L. Epidemiology and transmission dynamics of West Nile virus disease. Emerg. Infect. Dis. 2005, 11, 1167–1173. [Google Scholar] [CrossRef]
- Hamer, G.L.; Kitron, U.D.; Brawn, J.D.; Loss, S.R.; Ruiz, M.O.; Goldberg, T.L.; Walker, E.D. Culex pipiens (Diptera: Culicidae): A bridge vector of West Nile virus to humans. J. Med. Entomol. 2008, 45, 125–128. [Google Scholar] [CrossRef]
- Platonov, A.E. West Nile encephalitis in Russia 1999–2001: Were we ready? Are we ready? Ann. N. Y. Acad. Sci. 2001, 951, 102–116. [Google Scholar] [CrossRef]
- Murgue, B.; Zeller, H.; Deubel, V. The ecology and epidemiology of West Nile virus in Africa, Europe and Asia. Curr. Top. Microbiol. Immunol. 2002, 267, 195–221. [Google Scholar]
- Fyodorova, M.V.; Savage, H.M.; Lopatina, J.V.; Bulgakova, T.A.; Ivanitsky, A.V.; Platonova, O.V.; Platonov, A.E. Evaluation of potential West Nile virus vectors in Volgograd region, Russia, 2003 (Diptera: Culicidae): Species composition, bloodmeal host utilization, and virus infection rates of mosquitoes. J. Med. Entomol. 2006, 43, 552–563. [Google Scholar] [CrossRef]
- Turell, M.J.; Mores, C.N.; Dohm, D.J.; Komilov, N.; Paragas, J.; Lee, J.S.; Shermuhemedova, D.; Endy, T.P.; Kodirov, A.; Khodjaev, S. Laboratory transmission of Japanese encephalitis and West Nile viruses by molestus form of Culex pipiens (Diptera: Culicidae) collected in Uzbekistan in 2004. J. Med. Entomol. 2006, 43, 296–300. [Google Scholar] [CrossRef]
- Andreadis, T.G.; Armstrong, P.M.; Bajwa, W.I. Studies on hibernating populations of Culex pipiens from a West Nile virus endemic focus in New York City: parity rates and isolation of West Nile virus. J. Amer. Mosquito Contr. Assn. 2010, 26, 257–264. [Google Scholar] [CrossRef]
- Gubler, D.J.; Reiter, P.; Ebi, K.L.; Yap, W.; Nasci, R.; Patz, J.A. Climate variability and change in the United States: Potential impacts on vector- and rodent-borne diseases. Environ. Health Perspect. 2001, 109, S223–S233. [Google Scholar] [CrossRef]
- Paz, S.; Albersheim, I. Influence of warming tendency on Culex pipiens population abundance and on the probability of West Nile fever outbreaks (Israeli Case Study: 2001–2005). Ecohealth 2008, 5, 40–48. [Google Scholar] [CrossRef]
- Semenza, J.C.; Suk, J.E.; Estevez, V.; Ebi, K.L.; Lindgren, E. Mapping climate change vulnerabilities to infectious diseases in Europe. Environ. Health Perspect. 2012, 120, 385–392. [Google Scholar]
- Kwan, J.L.; Kluh, S.; Reisen, W.K. Antecedent avian immunity limits tangential transmission of West Nile virus to humans. PLoS One 2012, 7. [Google Scholar] [CrossRef]
- Epp, T.Y.; Waldner, C.L.; Berke, O. Predicting geographical human risk of West Nile virus—Saskatchewan, 2003 and 2007. Can. J. Public Health 2009, 100, 344–348. [Google Scholar]
- Ruiz, M.O.; Chaves, L.F.; Hamer, G.L.; Sun, T.; Brown, W.M.; Walker, E.D.; Haramis, L.; Goldberg, T.L.; Kitron, U.D. Local impact of temperature and precipitation on West Nile virus infection in Culex species mosquitoes in northeast Illinois, USA. Parasit. Vectors. 2010, 3. Available online: http://www.biomedcentral.com/content/pdf/1756-3305-3-19.pdf (accessed on 8 November 2013).
- Kilpatrick, A.M.; Pape, W.J. Predicting human West Nile virus infections with mosquito surveillance data. Amer. J. Epidemiol. 2013, 178, 829–835. [Google Scholar] [CrossRef]
- Wang, J.; Ogden, N.H.; Zhu, H. The impact of weather conditions on Culex pipiens and Culex restuans (Diptera: Culicidae) abundance: A case study in Peel Region. J. Med. Entomol. 2011, 48, 468–475. [Google Scholar] [CrossRef]
- de Groote, J.P.; Sugumaran, R.; Brend, S.M.; Tucker, B.J.; Bartholomay, L.C. Landscape, demographic, entomological, and climatic associations with human disease incidence of West Nile virus in the state of Iowa, USA. Int. J. Health Geogr. 2008, 7. [Google Scholar] [CrossRef]
- Soverow, J.E.; Wellenius, G.A.; Fisman, D.N.; Mittleman, M.A. Infectious disease in a warming world: how weather influenced West Nile virus in the United States (2001–2005). Environ. Health Perspect. 2009, 117, 1049–1052. [Google Scholar]
- Kilpatrick, A.M.; Meola, M.A.; Moudy, R.M.; Kramer, L.D. Temperature, viral genetics, and the transmission of West Nile virus by Culex pipiens mosquitoes. PLoS Pathog. 2008, 4. [Google Scholar] [CrossRef]
- Richards, S.L.; Lord, C.C.; Pesko, K.N.; Tabachnick, W.J. Environmental and biological factors influencing Culex pipiens quinquefasciatus (Diptera: Culicidae) vector competence for West Nile Virus. Amer. J. Trop. Med. Hyg. 2010, 83, 126–134. [Google Scholar] [CrossRef]
- Reisen, W.K.; Fang, Y.; Martinez, V.M. Effects of temperature on the transmission of West Nile virus by Culex tarsalis (Diptera: Culicidae). J. Med. Entomol. 2006, 43, 309–317. [Google Scholar] [CrossRef]
- Hartley, D.M.; Barker, C.M.; Le Menach, A.; Niu, T.; Gaff, H.D.; Reisen, W.K. Effects of temperature on emergence and seasonality of West Nile virus in California. Amer. J. Trop. Med. Hyg. 2012, 86, 884–894. [Google Scholar] [CrossRef]
- Brown, H.E.; Childs, J.E.; Diuk-Wasser, M.A.; Fish, D. Ecological factors associated with West Nile virus transmission, northeastern United States. Emerg. Infect. Dis. 2008, 14, 1539–1545. [Google Scholar] [CrossRef]
- Chuang, T.W.; Wimberly, M.C. Remote sensing of climatic anomalies and West Nile virus incidence in the Northern Great Plains of the United States. PLoS One 2012, 7. [Google Scholar] [CrossRef]
- Chuang, T.W.; Henebry, G.M.; Kimball, J.S.; Vanroekel-Patton, D.L.; Hildreth, M.B.; Wimberly, M.C. Satellite microwave remote sensing for environmental modeling of mosquito population dynamics. Remote Sens. Environ. 2012, 125, 147–156. [Google Scholar] [CrossRef]
- Onishchenko, G.G.; Lipnitskii, A.V.; Alekseev, V.V.; Antonov, V.A.; Kriuchkova, T.P.; Krutogolovova, T.A. Epidemiological situation of West Nile fever in Russia in 2010. (in Russian). Zh. Mikrobiol. Epidemiol. Immunobiol. 2011, 3, 115–120. [Google Scholar]
- Manankov, V.V.; Alekseev, V.V.; Smelianskii, V.P.; Pashanina, T.T.; Pogasii, N.I.; Putintseva, E.V.; Britanova, A.L.; Antonov, V.A.; Alekseeva, V.V.; Tkachenko, G.A.; et al. Study of a trend in the epidemic process of West Nile fever in the Volgograd region over the period 2000–2009. (in Russian). Epidemiol. Infect. Dis. 2011, 4, 45–49. [Google Scholar]
- Antonov, V.A.; Smolenskii, V.Iu.; Putintseva, E.V.; Lipnitskii, A.V.; Smelianskii, V.P.; Iakovlev, A.T.; Manankov, V.V.; Pogasii, N.I.; Krasovskaia, T.I. West Nile fever epidemic situation in the Russian Federation territory in 2011 and the prognosis of its development. (in Russian). Prob. Especially Dangerous Infect. 2012, 1, 17–21. [Google Scholar]
- Putintseva, E.V.; Antonov, V.A.; Viktorov, D.V.; Smelianskii, V.P.; Zhukov, K.V.; Manankov, V.V.; Pogasii, N.I.; Tkachenko, G.A.; Shpak, I.M.; Snatenkov, E.A. Peculiarities of epidemiological situation on the West Nile fever in 2012 in the territory of the Russian Federation. (in Russian). Prob. Especially Dangerous Infect. 2013, 1, 25–29. [Google Scholar]
- The Collection of Materials on the West Nile Fever Outbreak in Russian Federation in 2010; (in Russian). Onishchenko, G.G. (Ed.) Rospotrebnadzor: Volgograd, Russia, 2011.
- Measures against West Nile Fever on the Territory of the Russian Federation. Methodical Guidelines MUK 3.1.3.2600-10; (in Russian). Rospotrebnadzor: Moscow, Russia, 2010. Available online: http://bestpravo.ru/rossijskoje/xi-dokumenty/m1p.htm (accessed on 20 September 2013).
- The Organization and Execution of West Nile Fever Laboratory Diagnostics in Laboratories at Territorial, Regional and Federal Levels. Methodical Guidelines MUK 4.2.3009-12; (in Russian). Rospotrebnadzor: Moscow, Russia, 2012. Available online: http://75.rospotrebnadzor.ru/sites/default/files/muk42300912.doc (accessed on 20 September 2013).
- McNamara, T.; Platonov, A.; Elleman, T.; Gresham, L. The human-animal interface and zoonotic threats: The Russian Federation approach. Biosecur. Bioterror. 2013, 11, 185–195. [Google Scholar] [CrossRef]
- CISL Research Data Archive. Available online: http://rda.ucar.edu (accessed on 8 November 2013).
- MOD 09—Surface Reflectance. Atmospheric Correction Algorithm Products. Available online: http://modis.gsfc.nasa.gov/data/dataprod/dataproducts.php?MOD_NUMBER=09 (accessed on 20 September 2013).
- Loupian, E.; Savin, I.; Bartalev, S.; Tolpin, V.; Balashov, I.; Plotnikov, D. Satellite service for vegetation monitoring VEGA. (in Russian). Cur. Prob. Remote Sens. Earth Space 2011, 8, 190–198. [Google Scholar]
- Bartalev, S.A.; Isaev, A.S.; Lupyan, E.A. Priorities of satellite monitoring of boreal ecosystems. Contemp. Probl. Ecology 2008, 1, 1–13. [Google Scholar]
- Bartalev, S.A.; Belward, A.S.; Erchov, D.V.; Isaev, A.S. A new SPOT4-VEGETATION derived land cover map of Northern Eurasia. Int. J. Remote Sens. 2003, 24, 1977–1982. [Google Scholar] [CrossRef]
- SPSS Software. Available online: http://www-01.ibm.com/software/analytics/spss (accessed on 8 November 2013).
- IBM SPSS Decision Trees 19. Available online: http://www.csun.edu/sites/default/files/decision-trees19.pdf (accessed on 8 November 2013).
- Zehender, G.; Ebranati, E.; Bernini, F.; Lo Presti, A.; Rezza, G.; Delogu, M.; Galli, M.; Ciccozzi, M. logeography and epidemiological history of West Nile virus genotype 1a in Europe and the Mediterranean basin. Infect. Genet. Evol. 2011, 11, 646–653. [Google Scholar] [CrossRef]
- Lvov, D.K.; Butenko, A.M.; Gromashevsky, V.L.; Kovtunov, A.I.; Prilipov, A.G.; Kinney, R.; Aristova, V.A.; Dzharkenov, A.F.; Samokhvalov, E.I.; Savage, H.M.; et al. West Nile virus and other zoonotic viruses in Russia: Examples of emerging—Reemerging situations. Arch. Virol. 2004, 18, S85–S96. [Google Scholar]
- Uejio, C.K.; Kemp, A.; Comrie, A.C. Climatic controls on West Nile virus and Sindbis virus transmission and outbreaks in South Africa. Vector Borne Zoonotic Dis. 2012, 12, 117–125. [Google Scholar] [CrossRef]
© 2014 by the authors; licensee MDPI, Basel, Switzerland. This article is an open access article distributed under the terms and conditions of the Creative Commons Attribution license (http://creativecommons.org/licenses/by/3.0/).
Share and Cite
Platonov, A.E.; Tolpin, V.A.; Gridneva, K.A.; Titkov, A.V.; Platonova, O.V.; Kolyasnikova, N.M.; Busani, L.; Rezza, G. The Incidence of West Nile Disease in Russia in Relation to Climatic and Environmental Factors. Int. J. Environ. Res. Public Health 2014, 11, 1211-1232. https://doi.org/10.3390/ijerph110201211
Platonov AE, Tolpin VA, Gridneva KA, Titkov AV, Platonova OV, Kolyasnikova NM, Busani L, Rezza G. The Incidence of West Nile Disease in Russia in Relation to Climatic and Environmental Factors. International Journal of Environmental Research and Public Health. 2014; 11(2):1211-1232. https://doi.org/10.3390/ijerph110201211
Chicago/Turabian StylePlatonov, Alexander E., Vladimir A. Tolpin, Kristina A. Gridneva, Anton V. Titkov, Olga V. Platonova, Nadezhda M. Kolyasnikova, Luca Busani, and Giovanni Rezza. 2014. "The Incidence of West Nile Disease in Russia in Relation to Climatic and Environmental Factors" International Journal of Environmental Research and Public Health 11, no. 2: 1211-1232. https://doi.org/10.3390/ijerph110201211