Stress, Health and Well-Being: The Mediating Role of Employee and Organizational Commitment


Abstract
:1. Introduction
1.1. Work and Stress
1.2. Dimensions of Organizational Stress
1.2.1. Perceptions of Your Job
1.2.2. Attitudes towards Your Organization
1.2.3. Your Health
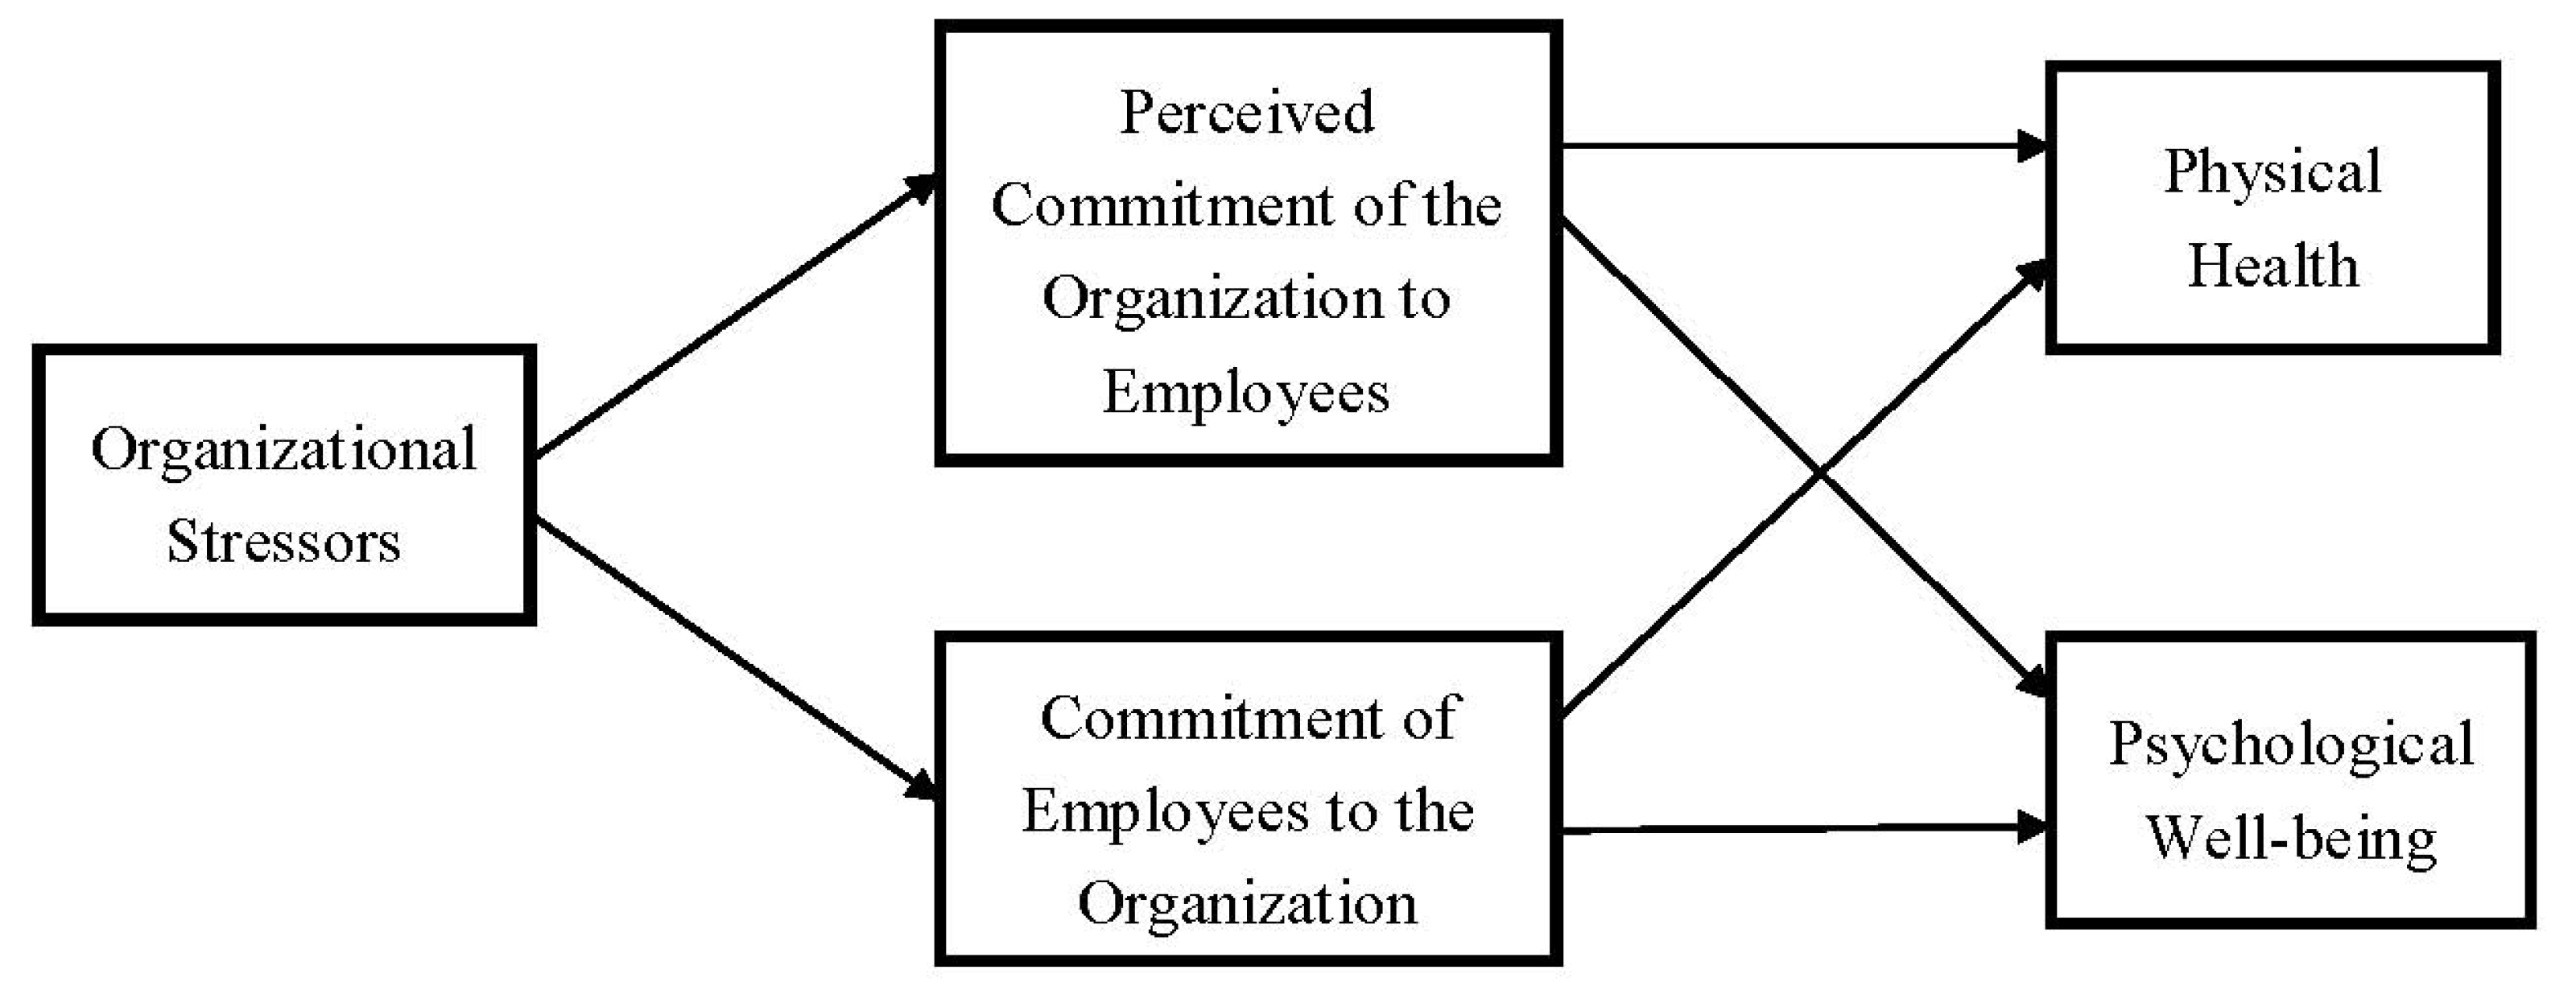
1.3. The Proposed Model: Exploring the Mediating Role of Commitment
- H1: Organizational stressors will have a negative impact on employee perceptions of their organizations commitment to them as well as the employee’s commitment to the organization.
- H2: Organizational stressors will have a negative impact on the physical health and psychological well-being of employees.
- H3: Perceived commitment of the organization and employee commitment to the organization will have a negative impact on the physical health and psychological well-being of employees.
- H4: Perceived commitment of the organization and employee commitment to the organization will mediate the effect of organizational stressors on the physical health and psychological well-being of employees.
2. Methods
2.1. Participants and Procedure
2.2. Measures
2.3. Analytic Procedure

| Scales | Factors/Abbreviations | No. of Items | Cronbach’s Alpha |
|---|---|---|---|
| Perception of your job | 1. Work relationships WR | 8 | 0.85 |
| 2. Aspects of your job YJ | 8 | 0.72 | |
| 3. Overload OL | 4 | 0.81 | |
| 4. Control CL | 4 | 0.75 | |
| 5. Job security JS | 4 | 0.72 | |
| 6. Resource and communication RC | 4 | 0.76 | |
| 7. Work-life balance WLB | 4 | 0.61 | |
| 8. Pay and Benefits PB | 1 | ||
| Attitude towards your organization | Perceived commitment of organization to employee PCOE | 5 | 0.86 |
| Commitment of employees to organization PCEO | 4 | 0.73 | |
| Your health | Physical Health PH | 6 | 0.82 |
| Psychological Well-Being PWB | 11 | 0.92 |
3. Results and Discussion
3.1. Confirmatory Factor Analysis (CFA)
| Goodness of Fit Statistics | Model Fit |
|---|---|
| Minimum Fit Function Chi-Square | 75.885 < 0.001 |
| Root Mean Square Error of Approximation (RMSEA) | 0.046 |
| Normed Fit Index (NFI) | 0.968 |
| Tucker-Lewis fit Index (TLI) | 0.975 |
| Comparative Fit Index (CFI) | 0.985 |
| Standardized RMR (SRMR) | 0.030 |
| Goodness of Fit Index (GFI) | 0.970 |
| Adjusted Goodness of Fit Index (AGFI) | 0.943 |
3.2. Descriptive Statistics and Correlations
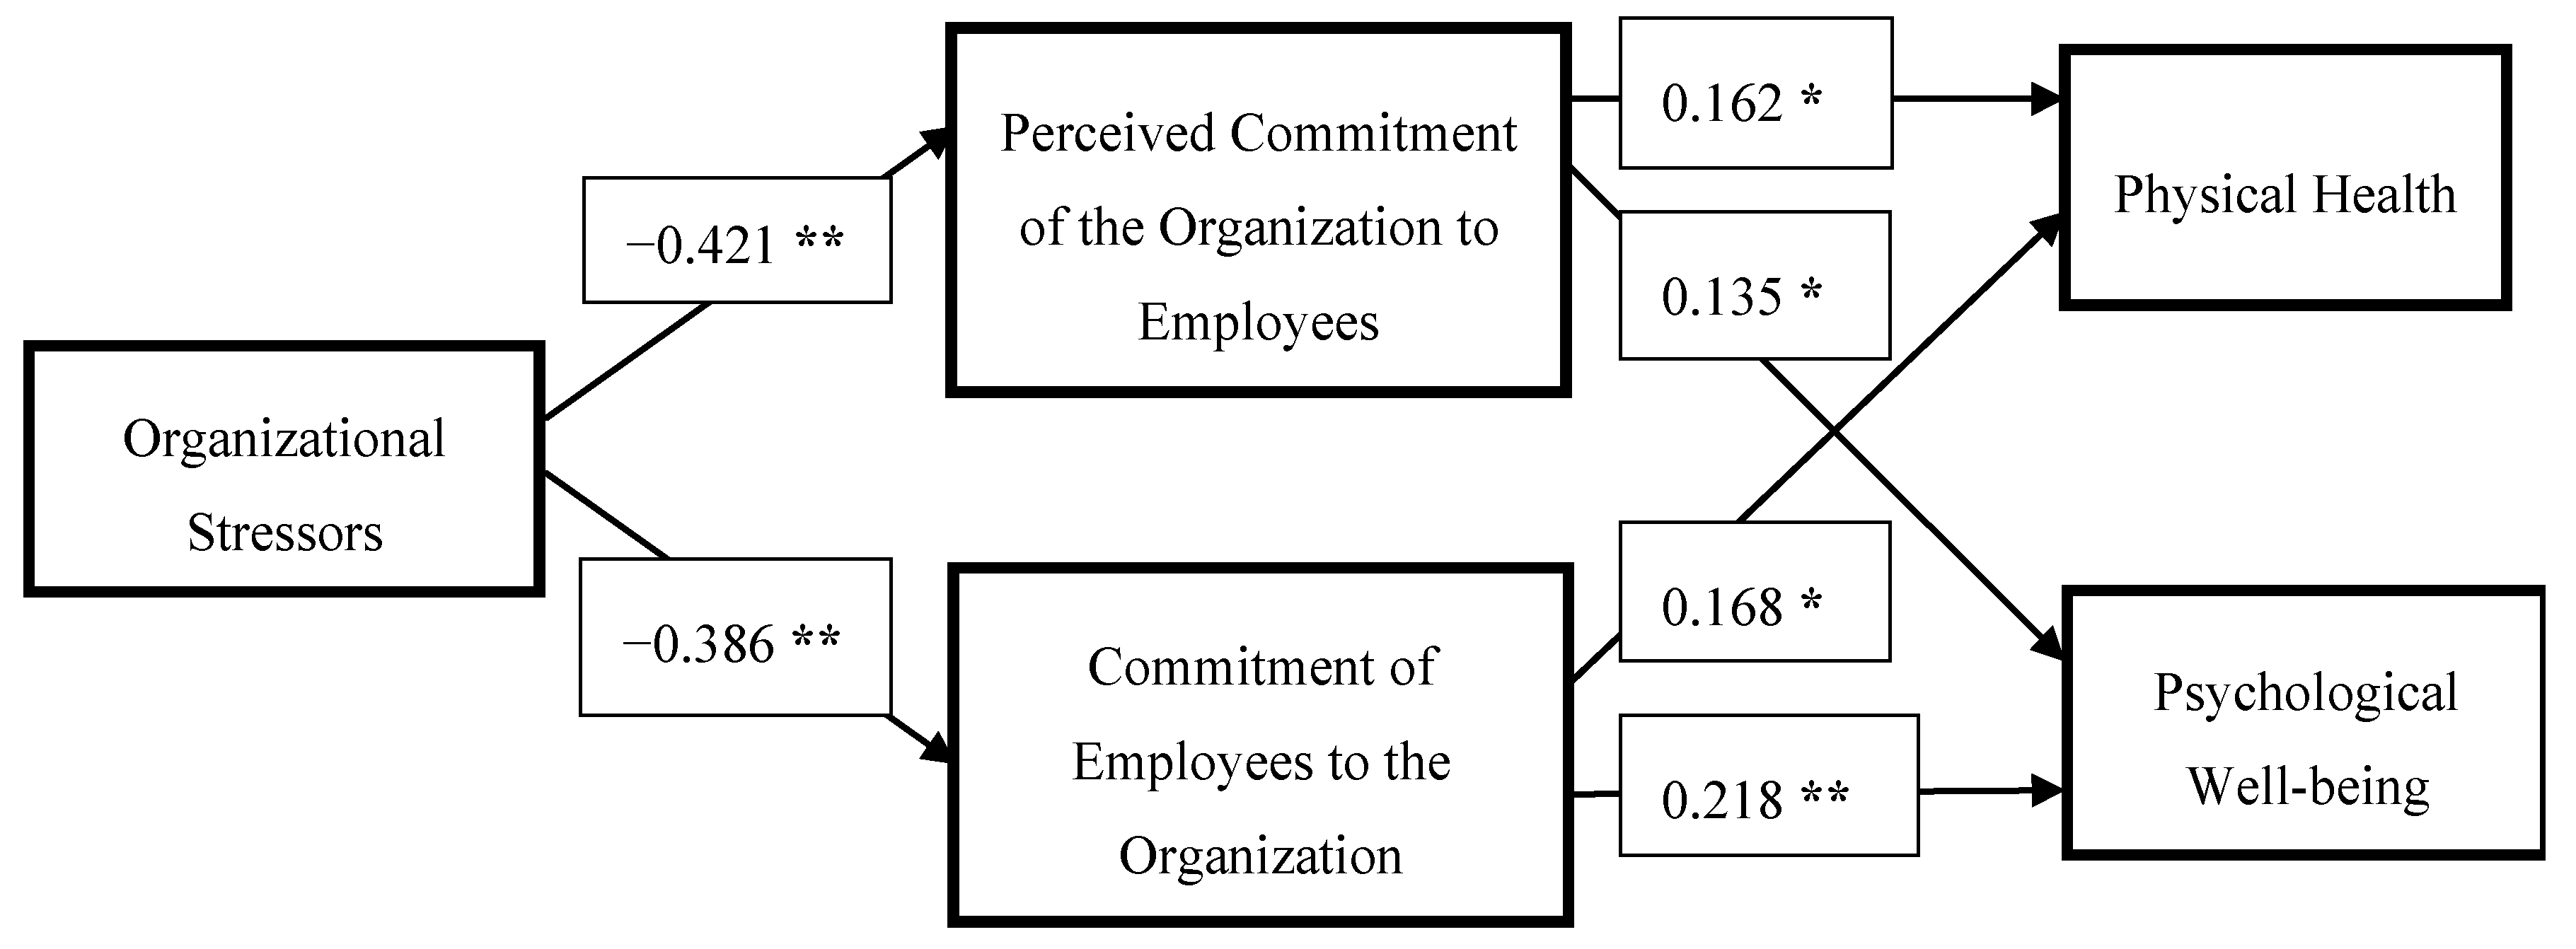
3.3. Mediator Analysis

| Variables | Mean | SD | 1 | 2 | 3 | 4 | 5 | 6 | 7 | 8 | 9 | 10 | 11 |
|---|---|---|---|---|---|---|---|---|---|---|---|---|---|
| 1. Work Relationships | 18.47 | 6.34 | 1 | ||||||||||
| 2. Work life balence | 13.98 | 4.18 | 0.432 ** | 1 | |||||||||
| 3. Overload | 10.67 | 4.27 | 0.639 ** | 0.483 ** | 1 | ||||||||
| 4. Job security | 12.94 | 4.16 | 0.488 ** | 0.370 ** | 0.504 ** | 1 | |||||||
| 5. Control | 12.01 | 4.08 | 0.596 ** | 0.451 ** | 0.529 ** | 0.495 ** | 1 | ||||||
| 6. Resources and communication | 10.54 | 4.19 | 0.685 ** | 0.443 ** | 0.647 ** | 0.497 ** | 0.644 ** | 1 | |||||
| 7. Aspects of the job | 23.28 | 5.67 | 0.544 ** | 0.502 ** | 0.563 ** | 0.507 ** | 0.498 ** | 0.506 ** | 1 | ||||
| 8. Pay and benefits | 3.67 | 1.59 | 0.336 ** | 0.334 ** | 0.381 ** | 0.386 ** | 0.337 ** | 0.405 ** | 0.362 ** | 1 | |||
| 9. Commitment of organization | 9.65 | 2.10 | −0.372 ** | −0.293 ** | −0.344 ** | −0.331 ** | −0.339 ** | −0.390 ** | −0.261 ** | −0.232 ** | 1 | ||
| 10. Commitment of employees | 9.4 | 1.81 | −0.367 ** | −0.257 ** | −0.350 ** | −0.282 ** | −0.331 ** | −0.337 ** | −0.213 ** | −0.214 ** | 0.724 ** | 1 | |
| 11. Physical health | 14.99 | 4.44 | −0.336 ** | −0.457 ** | −0.432 ** | −0.277 ** | −0.344 ** | −0.369 ** | −0.375 ** | −0.184 ** | 0.239 ** | 0.225 ** | 1 |
| 12. Psychological well being | 32.73 | 7.72 | −0.446 ** | −0.388 ** | −0.473 ** | −0.408 ** | −0.379 ** | −0.403 ** | −0.385 ** | −0.193 ** | 0.334 ** | 0.319 ** | 0.673 ** |
| Goodness of Fit Statistics | Model Fit |
|---|---|
| Chi-Square | 8.64 < 0.013 |
| Root Mean Square Error of Approximation (RMSEA) | 0.081 |
| Normed Fit Index (NFI) | 0.986 |
| Relative Fit Index (RFI) | 0.931 |
| Incremental Fit Index (IFI) | 0.989 |
| Tucker-Lewis Index | 0.946 |
| Comparative Fit Index (CFI) | 0.989 |
| Standardized RMR | 0.043 |
| Goodness of Fit Index (GFI) | 0.992 |
| Adjusted Goodness of Fit Index (AGFI) | 0.936 |
4. Limitations and Conclusions
Conflicts of Interest
References
- Cartwright, S.; Cooper, C.L. ASSET: An Organisational Stress Screening Tool, the Management Guide; RCL Ltd.: Manchester, UK, 2002. [Google Scholar]
- Johnson, S.; Cooper, C.L. The construct validity of the ASSET stress measure. Stress Health 2003, 19, 181–185. [Google Scholar] [CrossRef]
- Faragher, E.B.; Cooper, C.L.; Cartwright, S. A shortened stress evaluation tool (ASSET). Stress Health 2004, 20, 189–201. [Google Scholar] [CrossRef]
- Jain, A.K.; Giga, S.I.; Cooper, C.L. Organizational support as a moderator of the relationship between stressors and organizational citizenship behavior. Int. J. Organ. Anal. 2013, 21, 313–334. [Google Scholar] [CrossRef]
- Dataquest, Stress: BPO Industry Stress Factors. 2004. Available online: http://dqindia.ciol.com/content/dqtop202k4/empSurvey2004/2004/204110816.asp (accessed on 4 September 2013).
- Jain, A.K.; Saini, D. Human Resource Outsourcing and Shared Services: An Asian-Pacific Perspective. In Strategic HRM: Contemporary Issues in the Asia Pacific Region; Connell, J., Teo, S., Eds.; Tilde University Press: Melbourne, Australia, 2009. [Google Scholar]
- Selye, H. A syndrome produced by diverse nocuous agents. Nature 1936, 138, 32–36. [Google Scholar] [CrossRef]
- Cooper, C.L.; Dewe, P.J.; O’Driscoll, M.P. Organisational Stress: A Review and Critique of Theory, Research and Application; Sage: Newbury Park, CA, USA, 2001. [Google Scholar]
- Wright, J. Stress in the workplace: A coaching approach. Work 2007, 28, 279–284. [Google Scholar]
- Sackey, J.; Sanda, M.A. Influence of occupational stress on the mental health of ghanaian professional women. Int. J. Ind. Ergon. 2009, 39, 867–887. [Google Scholar]
- Ongori, H.; Agolla, J.E. Occupational stress in organizations and its effects on organizational performance. J. Manag. Res. 2008, 8, 123–135. [Google Scholar]
- Maslach, C.; Schaufeli, W.B.; Leiter, M.P. Job burnout. Annu. Rev. Psychol. 2001, 52, 397–422. [Google Scholar] [CrossRef]
- Beehr, T.A. Stress and Coping Research: Methodological Issues. In Handbook of Organizational Stress Coping Strategies; Sethi, A.S., Schuler, R.S., Eds.; Ballinger Publishing Company: Cambridge, MA, USA, 1984. [Google Scholar]
- Caplan, R.D.; Cobb, S.; French, J.R.P., Jr. Relationships of cessation of smoking with job stress, personality and social support. J. Appl. Psychol. 1975, 60, 211–219. [Google Scholar] [CrossRef]
- Stahl, S.; Grim, C.; Donald, C.; Neikirk, A. A model for the social sciences: The case of hypertension. Soc. Sci. Med. 1975, 9, 31–38. [Google Scholar] [CrossRef]
- Dewe, P.; Cox, T.; Ferguson, E. Individual strategies for coping with stress and work: A review. Work Stress 1993, 7, 5–15. [Google Scholar] [CrossRef]
- Lazarus, R.S.; Folkman, S. Stress, Appraisal, and Coping; Springer: New York, NY, USA, 1984. [Google Scholar]
- Long, B.C.; Kahn, S.E.; Schutz, R.W. Causal model of stress and coping: Women in management. J. Couns. Psychol. 1992, 39, 227–239. [Google Scholar] [CrossRef]
- Fleming, R.; Baum, A.; Singer, J.E. Toward an integrative approach to the study of stress. J. Personal. Soc. Psychol. 1984, 46, 939–949. [Google Scholar] [CrossRef]
- Vegchel, N.V.; Jonge, J.D.; Landsbergis, P.A. Occupational stress in (Inter) action: The interplay between job demands and job resources. J. Organ. Behav. 2005, 26, 535–560. [Google Scholar] [CrossRef]
- Coetzee, S.E.; Rothmann, S. Occupational stress, organizational commitment and ill health of employees at higher education institution in South Africa. J. Industr. Psychol. 2005, 31, 47–54. [Google Scholar]
- Luthans, F.; Youssef, C.M.; Avolio, B.J. Psychological Capital: Developing the Human Competitive Edge; Oxford University Press: Oxford, UK, 2007. [Google Scholar]
- Avey, J.B.; Patera, J.L.; West, B.J. The implications of positive psychological capital on employee absenteeism. J. Leadersh. Organ. Stud. 2000, 13, 42–60. [Google Scholar] [CrossRef]
- Griffith, R.W.; Hom, P.W.; Gaertner, S. A meta-analysis of antecedents and correlates of employee turnover: Update, moderator tests, and research: Implications for the next millennium. J. Manag. 2000, 26, 463–488. [Google Scholar]
- Cuhadar, M.T. The sectoral analyses of role conflict and role ambiguity with job satisfaction and organisational commitment: A study in the east mediterranean region. J. Glob. Strat. Manag. 2008, 2, 108–119. [Google Scholar]
- Begley, T.M.; Czajka, J.M. Panel analysis of moderating effects of commitment on job satisfaction, intent to quit, and health following organizational change. J. Appl. Psychol. 1993, 78, 552–556. [Google Scholar] [CrossRef]
- Siu, O.L. Occupational stressors and well-being among chinese employees: The role of organizational commitment. Appl. Psychol. 2002, 5, 527–544. [Google Scholar] [CrossRef]
- Eisenberger, R.; Huntington, R.; Hutchinson, S.; Sowa, D. Perceived organizational support. J. Appl. Psychol. 1986, 71, 500–507. [Google Scholar] [CrossRef]
- Randall, M.L.; Cropanzano, R.; Borman, C.A.; Birjulin, A. Organizational politics and organizational support as predictors of work attitudes, job performance, and organizational citizenship behaviors. J. Organ. Behav. 1999, 20, 159–174. [Google Scholar] [CrossRef]
- Van Schlkwyk, L.; EIs, C.; Rothmann, S., Jr. The moderating role of perceived organisational support in the relationship between workplace bullying and turnover intention across sectors in South Africa. S. Afr. J. Human Resour. Manag. 2011, 9, 13–27. [Google Scholar]
- Wayne, S.J.; Shore, L.M.; Liden, R.C. Perceived organizational support and leader member exchange: A social exchange perspective. Acad. Manag. J. 1997, 40, 82–111. [Google Scholar] [CrossRef]
- Cohen, S.; McKay, G. Social Support, Stress and the Buffering Hypothesis: A Theoretical Analysis. In Handbook of Psychology and Health; Baum, A., Singer, J.E., Taylor, S.E., Eds.; Erlbaum: Hillsdale, NJ, USA, 1984; Volume 4, pp. 253–267. [Google Scholar]
- Cohen, S.; Wills, T.A. Stress, social support and the buffering hypothesis. Psychol. Bull. 1985, 98, 310–357. [Google Scholar] [CrossRef]
- Meyer, J.P.; Stanley, D.J.; Herscovitch, L.; Topolnytsky, L. Affective, continuance and normative commitment to the organization: A meta-analysis of antecedents, correlates and consequences. J. Vocat. Behav. 2002, 61, 20–52. [Google Scholar] [CrossRef]
- Andolsek, D.M.; Stebe, J. Multinational perspective on work values and commitment. Int. J. Cross Cult. Manag. 2004, 4, 181–209. [Google Scholar] [CrossRef]
- LeBreton, J.M.; Ployhart, R.E.; Ladd, R.T. A monte carlo comparison of relative importance methodologies. Organ. Res. Methods 2004, 7, 258–282. [Google Scholar] [CrossRef]
- Baron, R.M.; Kenny, D.A. The moderator-mediator variables distinction in social psychological research. conceptual, strategic, and statistical consideration. J. Personal. Soc. Psychol. 1986, 51, 1173–1182. [Google Scholar] [CrossRef]
- Sobel, M.E. Asymptotic Intervals for Indirect Effects in Structural Equation Models. In Sociological Methodology; Leinhart, S., Ed.; Jossey-Bass: San Francisco, CA, USA, 1982; pp. 290–312. [Google Scholar]
- Bentler, P.M.; Bonett, D.G. Significance tests and goodness-of-fit in the analysis of covariance structures. Psychol. Bull. 1980, 88, 588–600. [Google Scholar] [CrossRef]
- Anderson, J.C.; Gerbing, D.W. Structural equation modeling in practice: A review and recommended two-step approach. Psychol. Bull. 1988, 103, 411–423. [Google Scholar] [CrossRef]
- Hu, L.; Bentler, P.M. Cutoff criteria for fit indexes in covariance structure analysis: Conventional criteria versus new alternatives. Struct. Equ. Model. 1999, 6, 1–55. [Google Scholar] [CrossRef]
- Jordan, P.; Ashkanasy, N.M.; Hartel, C.E. Emotional intelligence as a moderator of emotional and behavioral reactions to job insecurity. Acad. Manag. Rev. 2002, 27, 361–372. [Google Scholar]
- Mayer, R.C.; Schoorman, D.F. Predicting participant and production outcomes through a two-dimensional model of organisational commitment. Acad. Manag. J. 1992, 35, 671–684. [Google Scholar] [CrossRef]
Appendix. Current Indian BPO Sample (n = 401) Comparisons with ASSET Norms
A1. Perception of Your Job
A1.1. Work Relationships
| Item Number | General Population Norms (n = 25,352) | Managerial and Professional Norms (n = 5,947) | Indian Call Center (n = 401) | |||
|---|---|---|---|---|---|---|
| 9 | 2.44 | 0.66 | 2.18 | 1.44 | 2.05 | 1.23 |
| 11 | 3.14 | 0.68 | 3.09 | 1.56 | 2.38 | 1.24 |
| 18 | 2.94 | 0.56 | 2.56 | 1.39 | 2.47 | 1.25 |
| 19 | 2.69 | 0.33 | 2.56 | 1.36 | 2.42 | 1.30 |
| 20 | 3.36 | 0.33 | 3.47 | 1.59 | 2.82 | 1.34 |
| 23 | 2.79 | 1.04 | 1.97 | 1.10 | 2.78 | 1.14 |
| 24 | 2.37 | 0.38 | 2.59 | 1.37 | 2.43 | 1.21 |
| 26 | 2.57 | 0.92 | 1.83 | 0.92 | 1.78 | 1.02 |
| Total Score | 21.85 | 2.85 | 20.26 | 7.13 | ||
A1.2. Work-Life Balance
| Item Number | General Population Norms (n = 25,352) | Managerial and Professional Norms
(n = 5,947) | Indian Call Center
(n = 401) | |||
|---|---|---|---|---|---|---|
| 1 | 3.34 | 0.33 | 3.59 | 1.69 | 3.63 | 1.52 |
| 2 | 3.13 | 0.65 | 3.31 | 1.87 | 3.59 | 1.64 |
| 3 | 2.45 | 0.37 | 2.30 | 1.39 | 3.54 | 1.76 |
| 5 | 3.53 | 0.37 | 3.67 | 1.61 | 3.25 | 1.58 |
| Total Score | 12.43 | 1.24 | 12.87 | 4.60 | ||
A1.3. Overload
| Item Number | General Population Norms (n = 25,352) | Managerial and Professional Norms
(n = 5,947) | Indian Call Center
(n = 401) | |||
|---|---|---|---|---|---|---|
| 15 | 2.59 | 0.43 | 2.52 | 1.34 | 2.59 | 1.41 |
| 21 | 2.58 | 0.40 | 2.82 | 1.39 | 2.84 | 1.64 |
| 22 | 2.92 | 0.27 | 3.19 | 1.52 | 2.70 | 1.76 |
| 32 | 3.24 | 0.69 | 4.06 | 1.62 | 2.58 | 1.58 |
| Total Score | 11.33 | 1.27 | 12.59 | 4.55 | ||
A1.4. Job Security
| Item Number | General Population Norms (n = 25,352) | Managerial and Professional Norms
(n = 5,947) | Indian Call Center
(n = 401) | |||
|---|---|---|---|---|---|---|
| 12 | 3.00 | 0.62 | 2.44 | 1.48 | 3.13 | 1.53 |
| 13 | 2.38 | 0.35 | 2.14 | 1.58 | 3.24 | 1.54 |
| 33 | 3.58 | 0.56 | 4.09 | 1.44 | 3.51 | 1.43 |
| 34 | 2.70 | 0.34 | 2.37 | 1.28 | 3.02 | 1.37 |
| Total Score | 11.66 | 0.81 | 11.04 | 3.87 | ||
A1.5. Control
| Item Number | General Population Norms (n = 25,352) | Managerial and Professional Norms (n = 5,947) | Indian Call Center (n = 401) | |||
|---|---|---|---|---|---|---|
| 4 | 3.68 | 0.39 | 3.67 | 1.53 | 3.39 | 1.53 |
| 29 | 3.17 | 0.46 | 3.59 | 1.54 | 3.19 | 1.49 |
| 35 | 2.90 | 0.44 | 2.99 | 1.41 | 2.82 | 1.36 |
| 36 | 3.27 | 0.48 | 3.04 | 1.46 | 2.65 | 1.34 |
| Total Score | 13.02 | 0.98 | 13.3 | 4.73 | ||
A1.6. Resources and Communication
| Item Number | General Population Norms (n = 25,352) | Managerial and Professional Norms (n = 5,947) | Indian Call Center (n = 401) | |||
|---|---|---|---|---|---|---|
| 27 | 3.53 | 0.42 | 3.57 | 1.56 | 2.84 | 1.54 |
| 28 | 3.32 | 0.56 | 3.72 | 1.61 | 2.77 | 1.42 |
| 30 | 2.94 | 0.42 | 2.78 | 1.43 | 2.60 | 1.39 |
| 31 | 3.02 | 0.54 | 3.05 | 1.52 | 2.35 | 1.26 |
| Total Score | 12.82 | 0.94 | 13.12 | 4.40 | ||
A1.7. Aspects of the Job
| Item Number | General Population Norms (n = 25,352) | Managerial and Professional Norms (n = 5,947) | Indian Call Center (n = 401) | |||
|---|---|---|---|---|---|---|
| 6 | 3.75 | 0.45 | 3.99 | 1.67 | 2.83 | 1.70 |
| 7 | 2.93 | 0.53 | 3.05 | 1.69 | 2.04 | 1.32 |
| 8 | 3.04 | 0.94 | 2.83 | 1.71 | 1.76 | 1.13 |
| 10 | 3.14 | 0.68 | 3.28 | 1.44 | 4.58 | 1.40 |
| 16 | 3.06 | 0.59 | 3.23 | 1.58 | 3.10 | 1.47 |
| 17 | 2.60 | 0.44 | 2.25 | 1.24 | 3.22 | 1.52 |
| 25 | 3.64 | 0.45 | 3.80 | 1.59 | 3.32 | 1.52 |
| 37 | 3.29 | 1.02 | 2.34 | 1.35 | 2.50 | 1.40 |
| Total Score | 25.46 | 2.77 | 24.76 | 6.64 | ||
A1.8. Pay and Benefits
| Item Number | General Population Norms (n = 25,352) | Managerial and Professional Norms (n = 5,947) | Indian Call Center (n = 401) | |||
|---|---|---|---|---|---|---|
| 14 | 3.44 | 0.33 | 3.31 | 1.75 | 3.67 | 1.61 |
A2. Attitude towards Your Organization
A2.1. Employee Perceptions of Their Organizations Commitment to Them
| Item Number | General Population Norms (n = 25,352) | Managerial and Professional Norms (n = 5,947) | Indian Call Center (n = 404) | |||
|---|---|---|---|---|---|---|
| 1 | 3.94 | 0.53 | 3.49 | 1.53 | 4.29 | 1.29 |
| 4 | 3.99 | 0.40 | 4.18 | 1.48 | 4.41 | 1.39 |
| 5 | 4.18 | 0.22 | 3.89 | 1.38 | 4.71 | 1.24 |
| 6 | 3.98 | 0.47 | 3.62 | 1.45 | 4.35 | 1.28 |
| 7 | 4.03 | 0.29 | 3.93 | 1.41 | 4.46 | 1.25 |
| Total Score | 20.11 | 1.24 | 19.12 | 5.34 | ||
A2.2. Employee Commitment to Their Organization
| Item Number | General Population Norms (n = 25,352) | Managerial and Professional Norms (n = 5,947) | Indian Call Center (n = 401) | |||
|---|---|---|---|---|---|---|
| 2 | 4.36 | 0.34 | 4.42 | 1.34 | 4.40 | 1.20 |
| 3 | 4.34 | 0.41 | 4.35 | 1.34 | 4.84 | 1.05 |
| 8 | 3.41 | 0.94 | 4.23 | 1.34 | 4.46 | 1.29 |
| 9 | 3.47 | 1.11 | 4.08 | 1.37 | 4.83 | 1.15 |
| Total Score | 15.58 | 2.53 | 17.08 | 3.92 | ||
A3. Your Health
A3.1. Physical Health
| Item Number | General Population Norms (n = 25,352) | Managerial and Professional Norms (n = 5,947) | Indian Call Center (n = 401) | |||
|---|---|---|---|---|---|---|
| 1 | 2.42 | 0.26 | 2.15 | 1.02 | 2.66 | 1.00 |
| 2 | 2.33 | 0.31 | 2.06 | 1.04 | 2.58 | 1.06 |
| 3 | 2.21 | 0.44 | 2.50 | 1.04 | 2.62 | 1.09 |
| 4 | 2.59 | 0.21 | 2.43 | 0.99 | 2.55 | 1.03 |
| 6 | 2.44 | 0.21 | 2.55 | 1.04 | 2.43 | 1.07 |
| 7 | 1.83 | 0.27 | 1.62 | 0.82 | 2.22 | 1.02 |
| Total Score | 13.82 | 0.77 | 13.32 | 4.08 | ||
A3.2. Psychological Well-Being
| Item Number | General Population Norms (n = 25,352) | Managerial and Professional Norms (n = 5,947) | Indian Call Center (n = 401) | |||
|---|---|---|---|---|---|---|
| 5 | 1.68 | 0.16 | 1.63 | 0.87 | 1.89 | 1.04 |
| 8 | 2.15 | 0.14 | 2.21 | 0.91 | 2.06 | 0.98 |
| 9 | 2.16 | 0.26 | 2.09 | 0.87 | 1.92 | 0.90 |
| 10 | 2.37 | 0.48 | 2.12 | 0.89 | 1.84 | 0.99 |
| 11 | 2.25 | 0.16 | 2.35 | 0.89 | 2.00 | 1.02 |
| 12 | 2.43 | 0.46 | 2.83 | 0.98 | 2.37 | 1.02 |
| 13 | 2.09 | 0.17 | 2.14 | 0.90 | 1.95 | 0.91 |
| 14 | 1.86 | 0.16 | 1.91 | 0.90 | 1.94 | 1.06 |
| 15 | 2.00 | 0.19 | 2.03 | 0.89 | 2.32 | 1.00 |
| 16 | 1.86 | 0.14 | 1.83 | 0.80 | 1.87 | 0.93 |
| 17 | 2.00 | 0.33 | 2.27 | 0.87 | 2.06 | 0.95 |
| Total Score | 23.15 | 1.38 | 23.07 | 2.30 | ||
© 2013 by the authors; licensee MDPI, Basel, Switzerland. This article is an open access article distributed under the terms and conditions of the Creative Commons Attribution license (http://creativecommons.org/licenses/by/3.0/).
Share and Cite
Jain, A.K.; Giga, S.I.; Cooper, C.L. Stress, Health and Well-Being: The Mediating Role of Employee and Organizational Commitment. Int. J. Environ. Res. Public Health 2013, 10, 4907-4924. https://doi.org/10.3390/ijerph10104907
Jain AK, Giga SI, Cooper CL. Stress, Health and Well-Being: The Mediating Role of Employee and Organizational Commitment. International Journal of Environmental Research and Public Health. 2013; 10(10):4907-4924. https://doi.org/10.3390/ijerph10104907
Chicago/Turabian StyleJain, Ajay K., Sabir I. Giga, and Cary L. Cooper. 2013. "Stress, Health and Well-Being: The Mediating Role of Employee and Organizational Commitment" International Journal of Environmental Research and Public Health 10, no. 10: 4907-4924. https://doi.org/10.3390/ijerph10104907