Potential Polyunsaturated Aldehydes in the Strait of Gibraltar under Two Tidal Regimes


 , and
, and
Abstract
:
1. Introduction
2. Results and Discussion
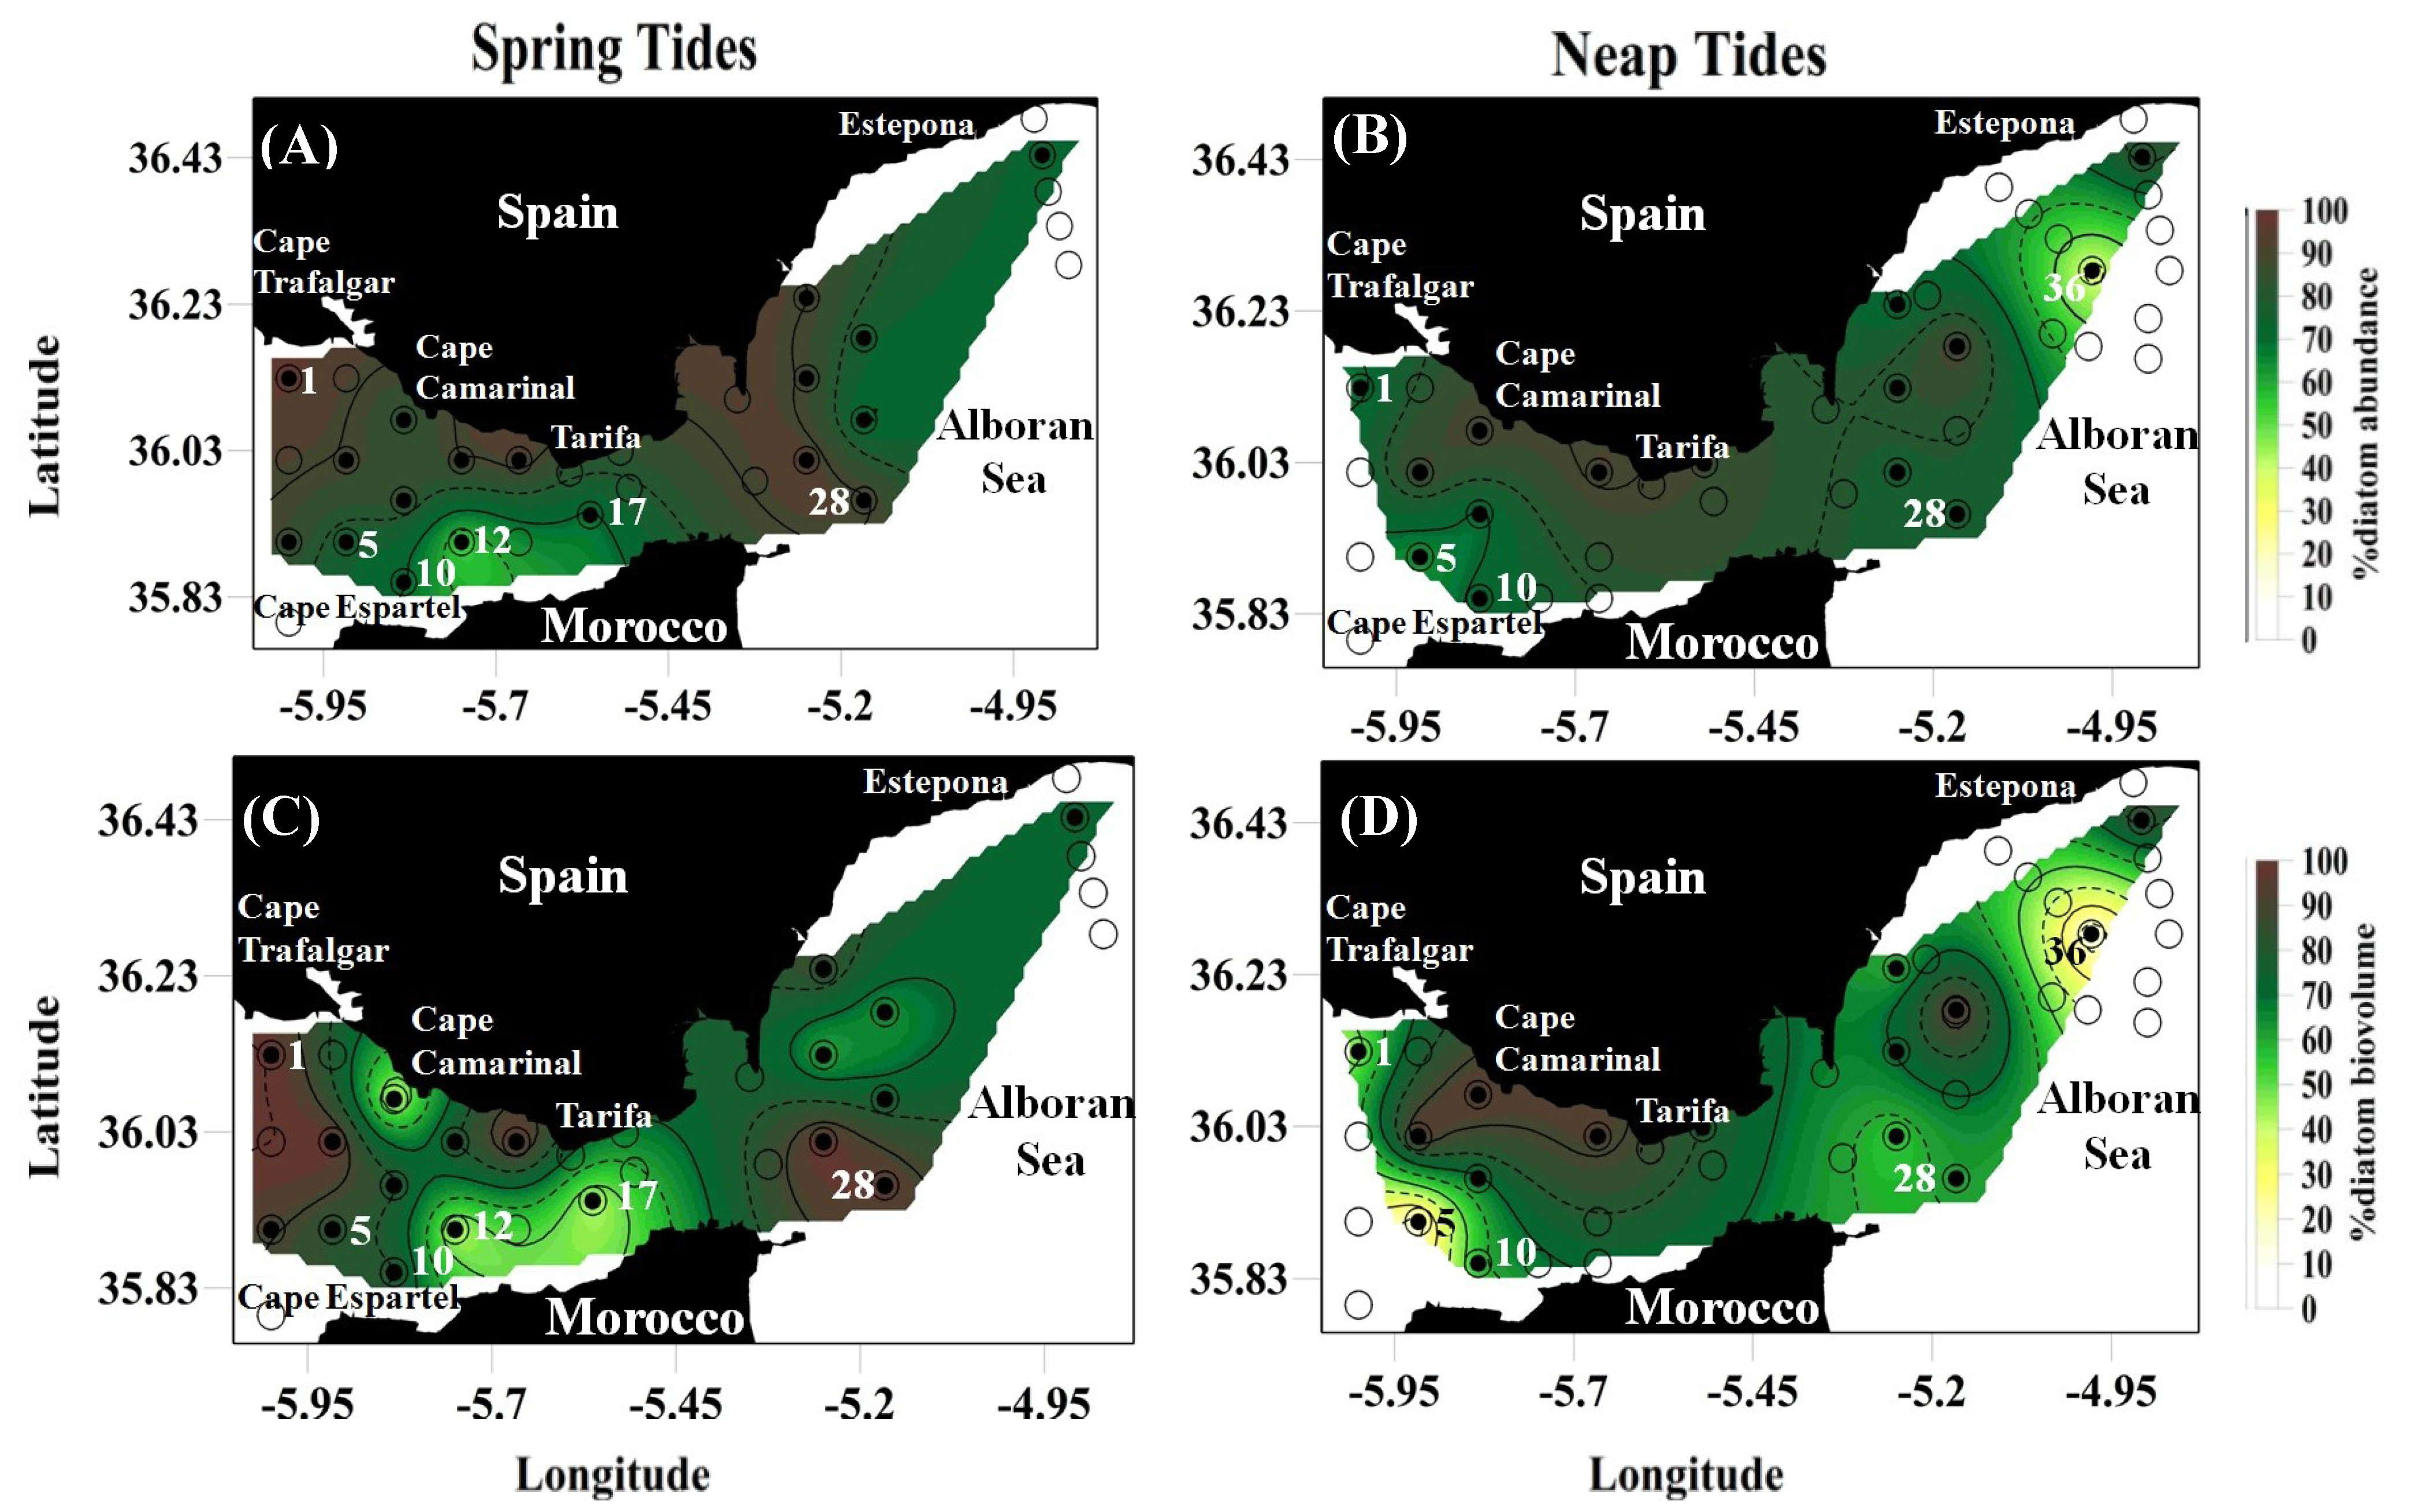
2.1. Plankton Distribution: Abundance, Biovolume and General Characterization

| % Abundance of the total large-sized plankton | % Biovolume of the total large-sized plankton | ||||
|---|---|---|---|---|---|
| mean ± SD | range | mean ± SD | range | ||
| Spring Tides | Diatoms | 75.0 ± 14.5 | 51.1–95.9 | 63.4 ± 27.7 | 19.5–99.9 |
| Dinoflagellates | 13.9 ± 8.5 | 2.0–34.4 | 13.4 ± 11.9 | 0–42.8 | |
| Copepods + Tintinnids | 1.5 ± 1.3 | 0–4.7 | 16.1 ± 15.5 | 0–46.9 | |
| Neap Tides | Diatoms | 69.9 ± 17.4 | 34.6–90.8 | 44.8 ± 29.3 | 1.3–93.0 |
| Dinoflagellates | 21.5 ± 13.0 | 7.7–59.7 | 18.9 ± 13.6 | 1.9–49.9 | |
| Copepods + Tintinnids | 2.7 ± 3.0 | 0.3–13.4 | 25.6 ± 9.0 | 1.4–52.5 | |
| % Abundance of the total large-sized plankton | % Biovolume of the total large-sized plankton | ||
|---|---|---|---|
| mean ± SD | mean ± SD | ||
| Spring Tides | Diatoms | 80.9 ± 12.2 | 77.4 ± 19.9 |
| Centric singles diatoms | 5.5 ± 6.0 | 2.3 ± 4.4 | |
| Pennate diatoms | 1.4 ± 2.7 | 1.8 ± 4.1 | |
| Lineal small cells chains | 11.1 ± 16.0 | 2.3 ± 6.4 | |
| Lineal big cells chains | 15.4 ± 6.2 | 11.6 ± 10.7 | |
| Helical chains | 62.0 ± 23.7 | 77.0 ± 22.4 | |
| Other diatoms | 4.4 ± 3.4 | 4.7 ± 6.7 | |
| Neap Tides | Diatoms | 74.3 ± 15.5 | 62.3 ± 29.3 |
| Centric singles diatoms | 4.7 ± 5.8 | 7.6 ± 12.6 | |
| Pennate diatoms | 4.8 ± 15.9 | 8.5 ± 23.2 | |
| Lineal small cells chains | 9.9 ± 10.5 | 1.1 ± 1.6 | |
| Lineal big cells chains | 8.3 ± 15.3 | 5.8 ± 7.6 | |
| Helical chains | 68.7 ± 27.8 | 68.0 ± 31.3 | |
| Other diatoms | 3.3 ± 3.9 | 8.7 ± 11.8 |
2.2. Total Chlorophyll, Fractionated Chlorophyll and Active Chlorophyll
| Spring Tides | Neap Tides | |||
|---|---|---|---|---|
| mean ± SD | range | mean ± SD | range | |
| TChla | 1.3 ± 1.2 | 0.1–4.2 | 0.7 ± 0.4 | 0.2–1.8 |
| FChla | 0.1 ± 0.1 | 0.3–2.0 | 0.1 ± 0.09 | 0–0.2 |
| AChla | 26.4 ± 18.9 | 0–65.0 | 8.6 ± 13.5 | 0–36.3 |
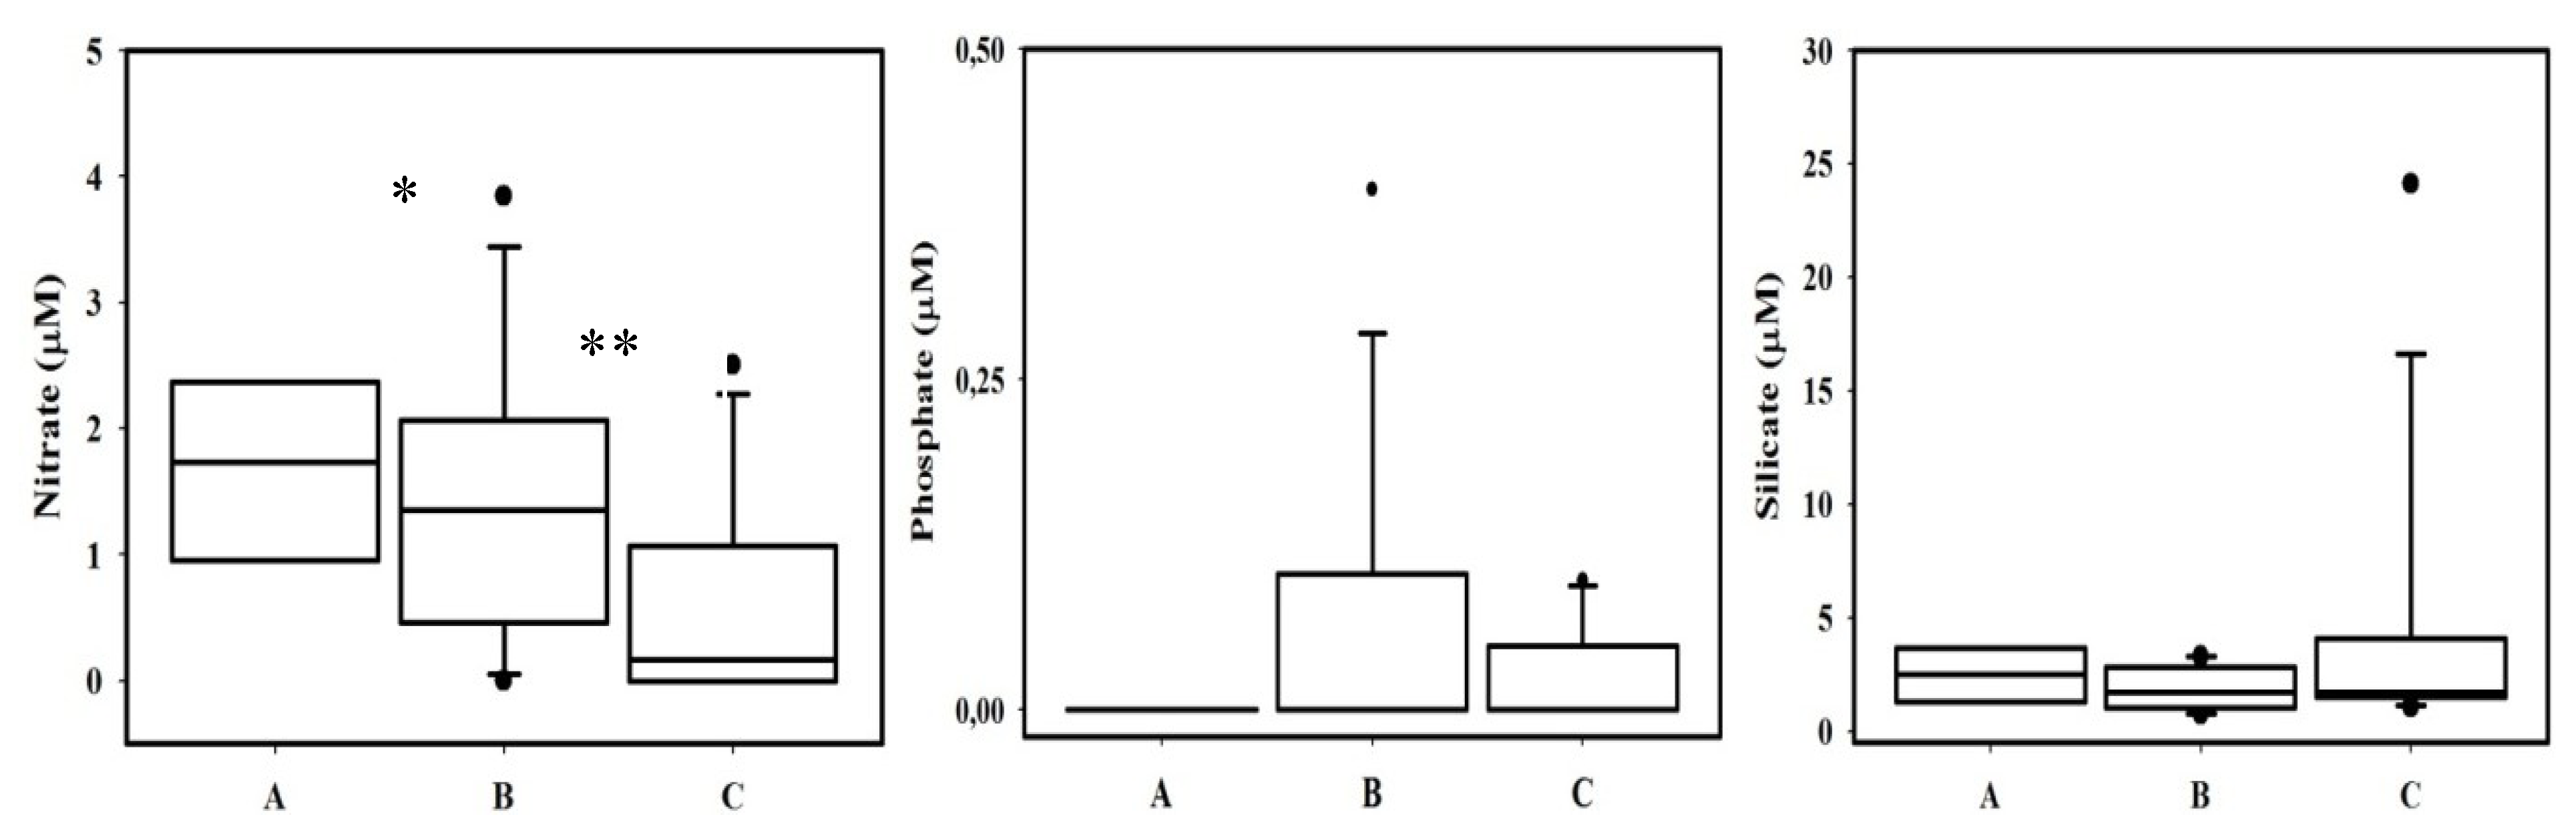
2.3. Nutrients
| Mean ± SD | Range | Atlantic (−6,−5.6) | Mediterranean (−5.59,−5.16) | Estepona (−5.20,−4.87) | ||
|---|---|---|---|---|---|---|
| Spring Tides | Silicate | 2.2 ± 1.8 | 0.6–9.9 | 3.0 ± 2.2 | 1.3 ± 0.6 | 1.6 ± 1.1 |
| Nitrate | 1.8 ± 1.6 | 0–8.4 | 2.4 ± 2.0 | 1.4 ± 0.9 | 0.6 ± 0.7 | |
| Phosphate | 0.05 ± 0.1 | n.d.–0.04 | 0.06 ± 0.1 | 0.06 ± 0.1 | n.d. | |
| Neap Tides | Silicate | 4.0 ± 6.1 | 0.5–27.1 | 1.3 ± 0.3 | 2.2 ± 1.0 | 7.6 ± 8.9 |
| Nitrate | 0.72 ± 0.9 | n.d.–3.3 | 0.2 ± 0.3 | 1.1 ± 1.1 | 0.1 ± 0.2 | |
| Phosphate | 0.03 ± 0.05 | n.d.–0.21 | 0.03 ± 0.06 | 0.03 ± 0.05 | 0.008 ± 0.02 |
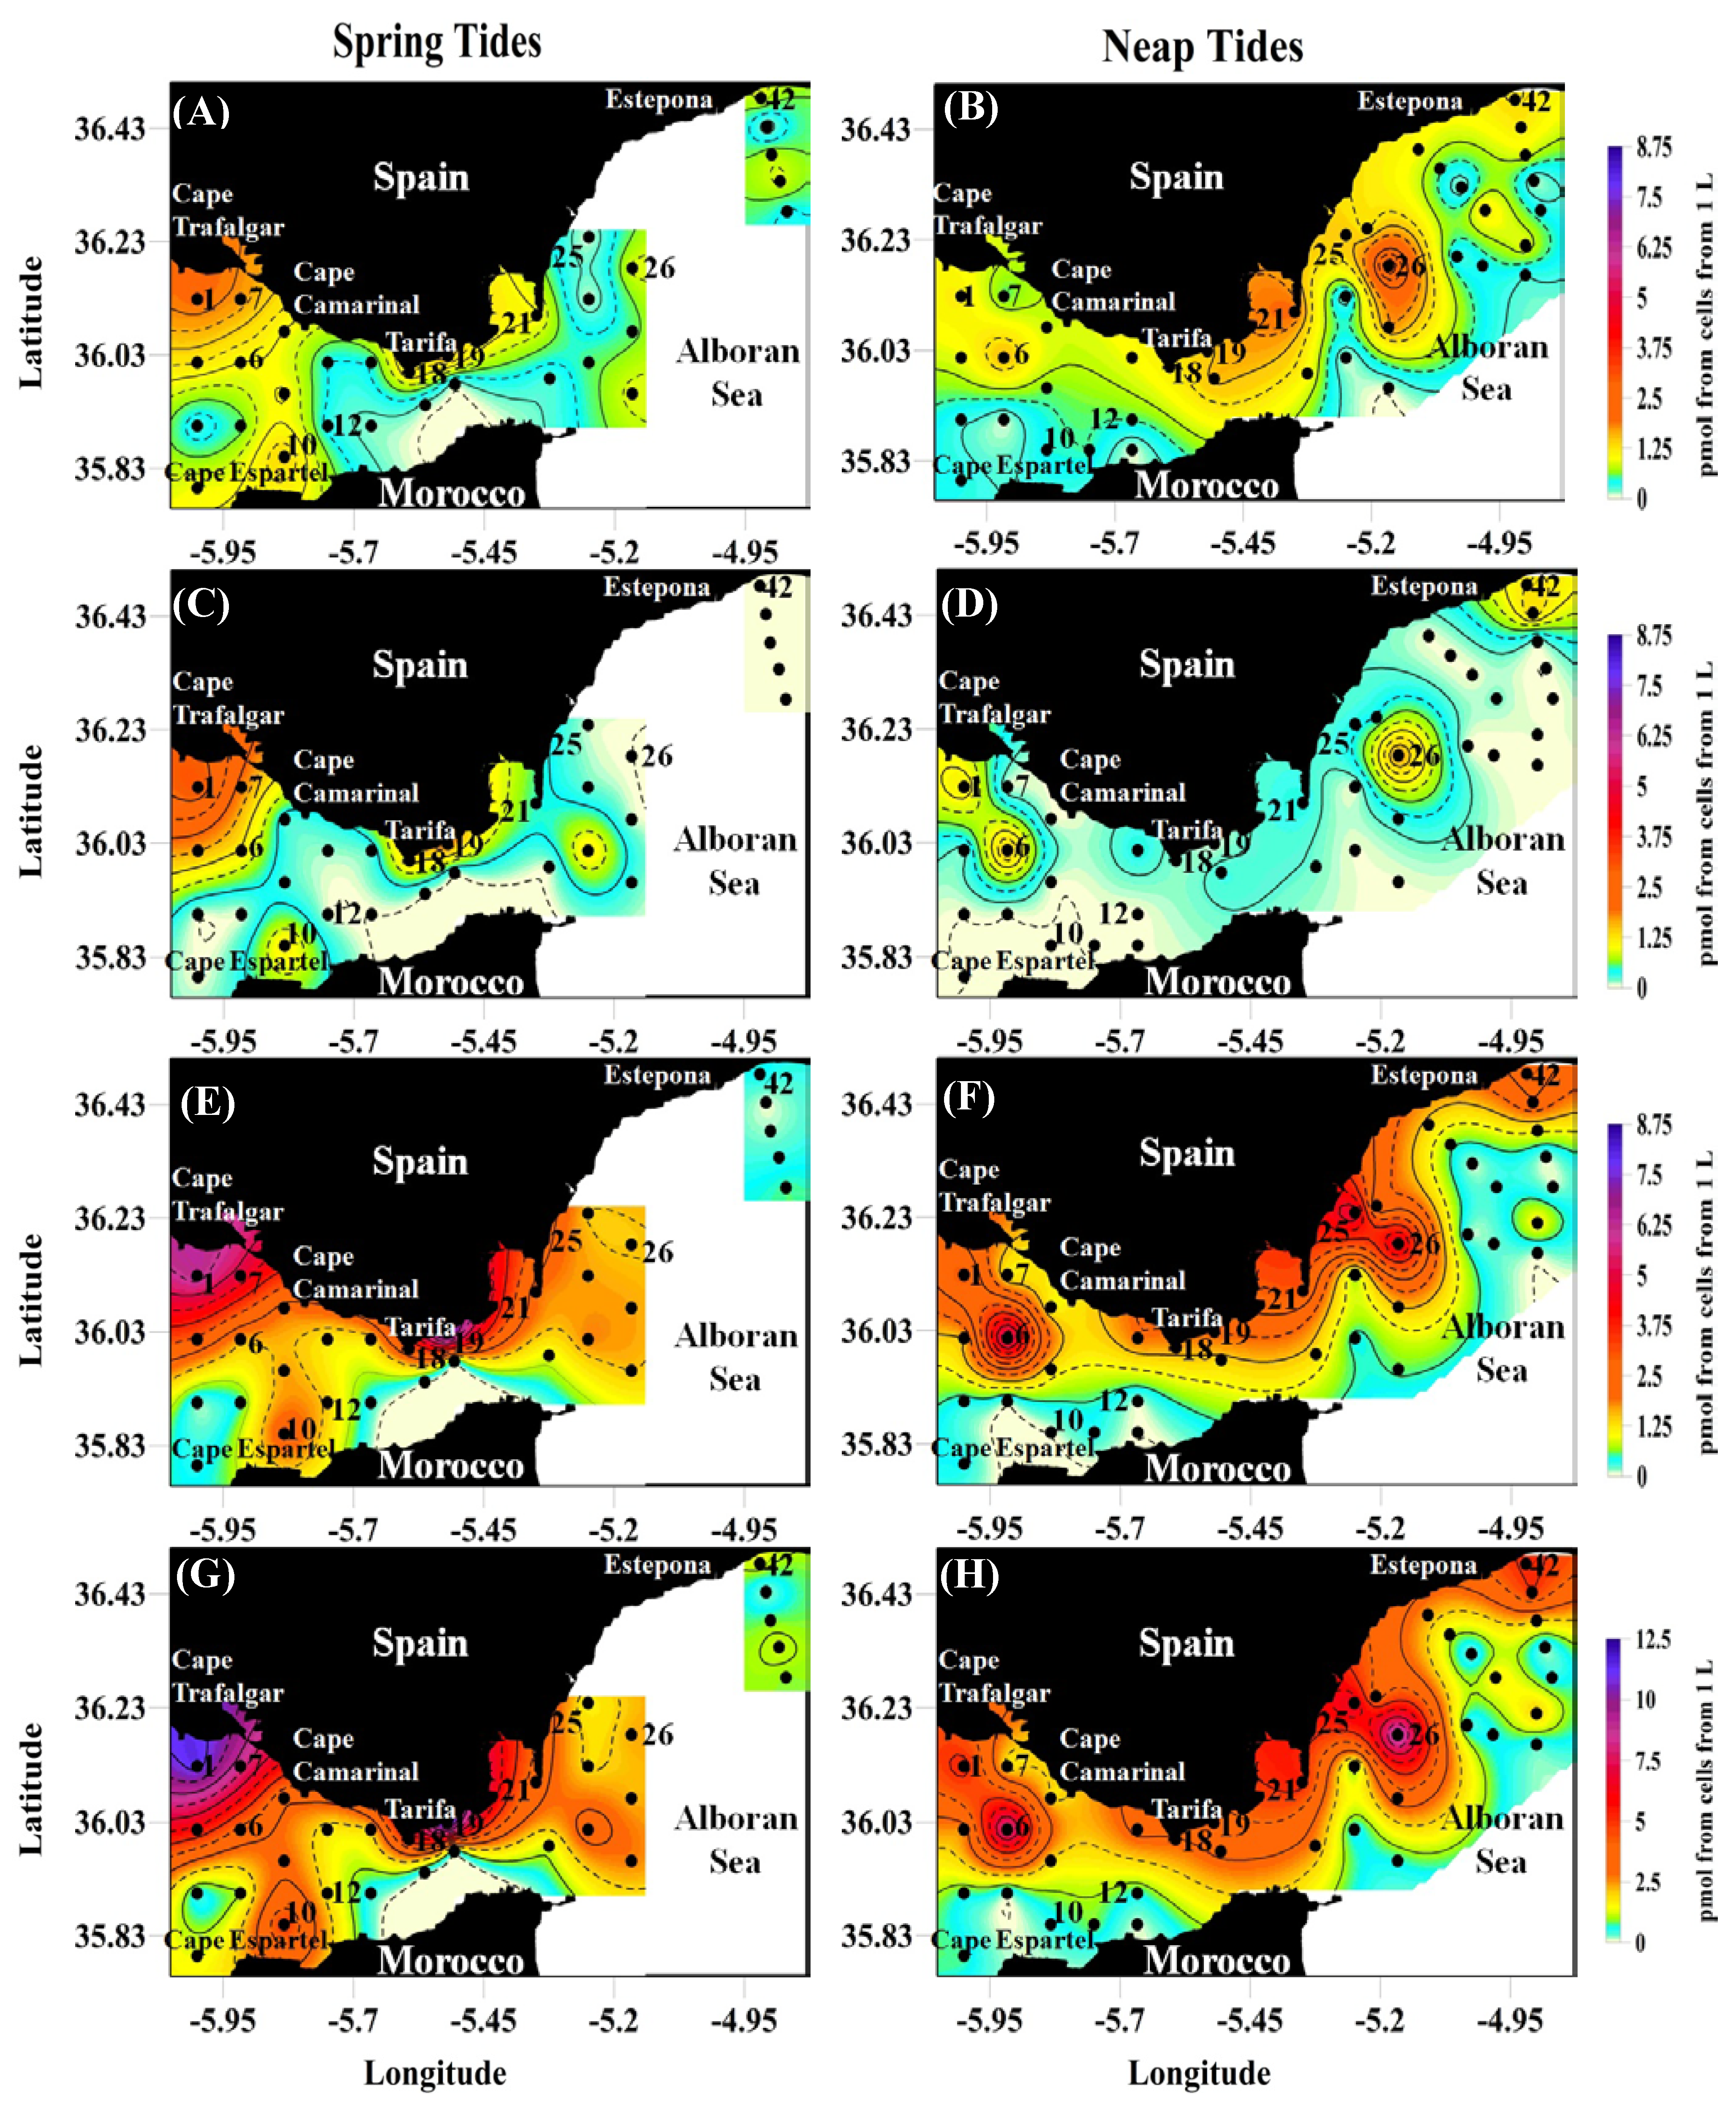
2.4. pPUA Ranges and Spatial Distribution
| pmol from cells from 1 L | fmol cell−1 | ||||
|---|---|---|---|---|---|
| mean ± SD | range | mean ± SD | range | ||
| Spring Tides | HEPTA | 0.7 ± 0.5 | 0.02–1.98 | 0.3 ± 0.6 | 0–2.7 |
| OCTA | 0.5 ± 0.7 | 0–3.10 | 0.2 ± 0.5 | 0–2.3 | |
| DECA | 1.6 ± 1.9 | 0.01–8.74 | 0.8 ± 1.1 | 0–4.7 | |
| Total PUAs | 2.9 ± 3.0 | 0.05–12.3 | 1.4 ± 2.3 | 0–9.8 | |
| Neap Tides | HEPTA | 0.8 ± 0.6 | 0–3.10 | 0.7 ± 1.3 | 0–5.3 |
| OCTA | 0.2 ± 0.4 | 0-1.76 | 0.2 ± 0.4 | 0-1.3 | |
| DECA | 1.3 ± 1.4 | 0.01–5.7 | 0.9 ± 0.9 | 0–2.6 | |
| Total PUAs | 2.3 ± 2.4 | 0.04–9.81 | 1.9 ± 2.1 | 0.1–7.3 | |

| Spring Tides | Neap Tides | |||
|---|---|---|---|---|
| PC1 (75.0%) | PC2 (17%) | PC1 (84.0%) | PC2 (8%) | |
| AChla | 0.40 | 0.88 | 0.24 | −0.94 |
| DTB | 0.80 | −0.35 | 0.83 | 0.24 |
| DNB | −0.27 | <0.01 | −0.37 | −0.18 |
| GZB | −0.32 | 0.29 | −0.32 | 0.11 |
| FChla | <0.01 | <0.01 | <0.01 | <0.01 |
| Spring Tides | Neap Tides | ||
|---|---|---|---|
| GROUP 1: Stations with High Percentage of Diatom Biovolume (Large Size Cells) | |||
| Group 1A No Physiological Stress (AChla 40%–70%) Stations: 1,6,14,23 | Group 1B Strong and Moderate Physiological Stress (AChla 0%–40%) Stations: 3,5,9,13,25,28 | Group 1A No Physiological Stress (AChla 40%–70%) | Group 1B Strong and Moderate Physiological Stress (AChla 0%–40%) Stations: 6,8,14,19,26,41 |
 | | No Stations | |
| pPUA: 1.8–11.4 PUA per cell: 0.1–0.6 | pPUA: 0.3–3.0 PUA per cell: 0.16–1.43 | pPUA: 0.05–9.81 PUA per cell: 0.059–4.89 | |
| GROUP 2: Stations with Low percentage of diatom biovolume (small size cells) | |||
| Group 2A No Physiological Stress (AChla 40%–70%) | Group 2B Strong and Moderate Physiological Stress (20% < AChla < 40%) Stations: 8,10,12,24,26,27,41 | Group 2A No Physiological Stress (AChla 40%–70%) | Group 2B Strong Physiological Stress (AChla 0%–40%) Stations: 1,5,9,10,23,24,25,36 |
| No Stations | | No Stations | |
| pPUA: 0.05–5.06 PUA per cell: 0.05–9.89 | pPUA: 0.3–6.8 PUA per cell: 0.34–7.3 | ||


3. Experimental Section
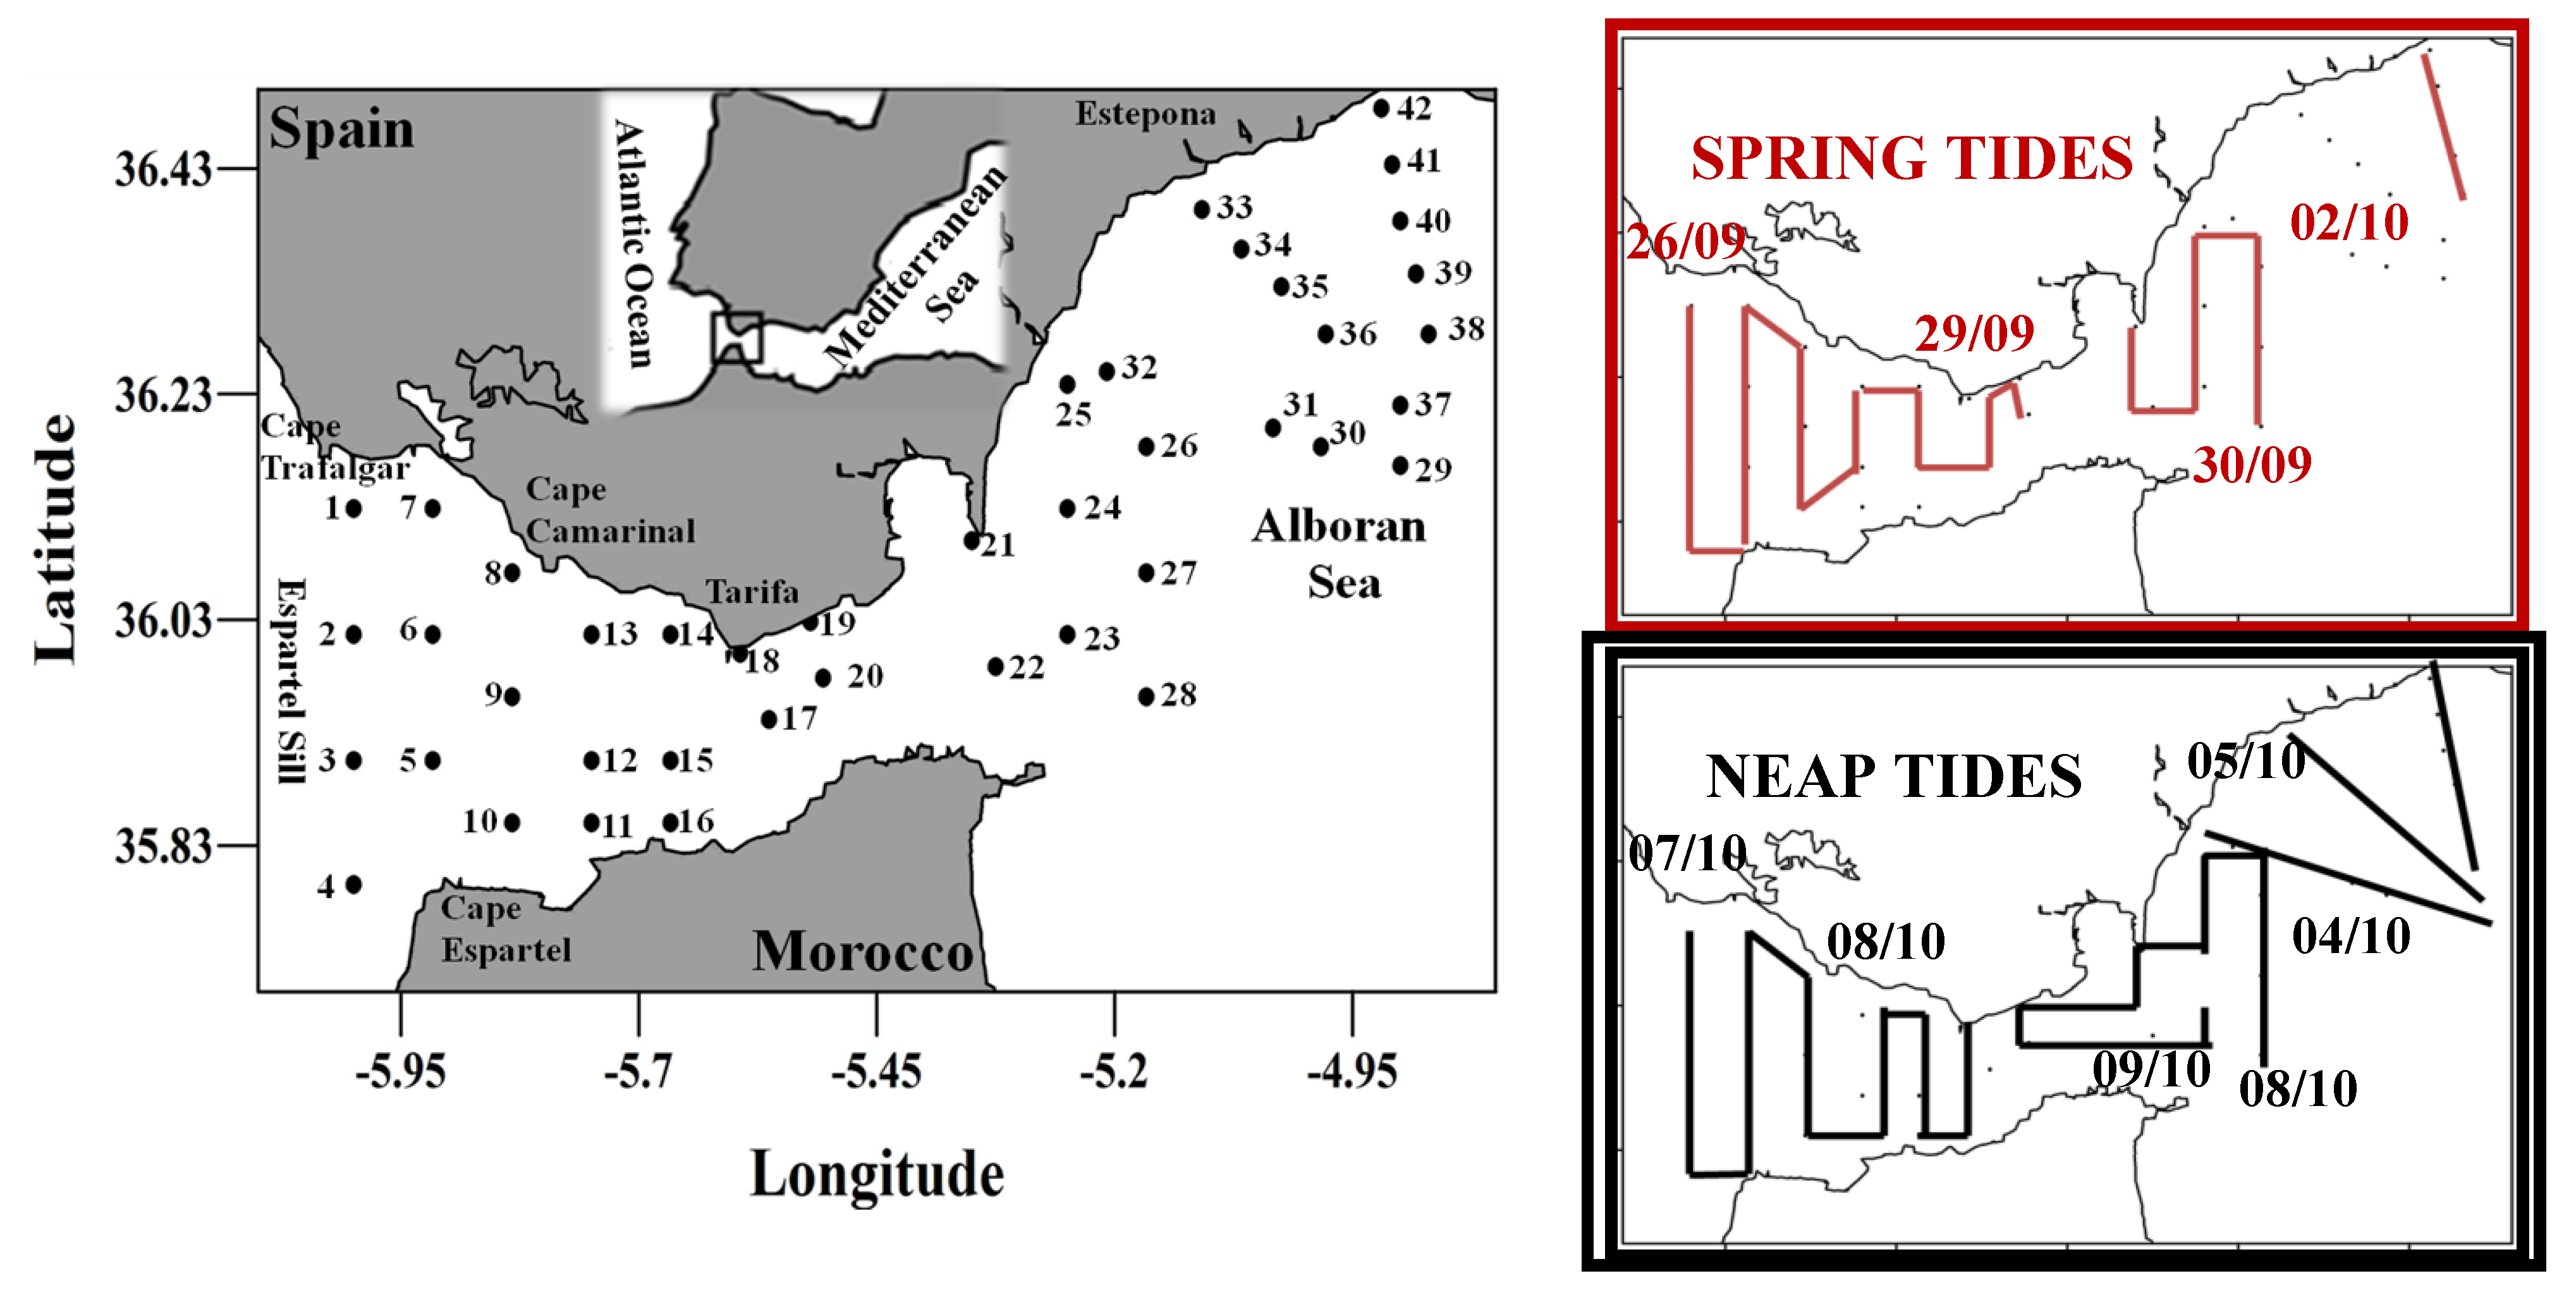
3.1. Field Sampling
3.2. Extraction of pPUA
3.3. Analysis and Quantification of PUA
3.4. Plankton Analysis by Flow-Cytometer and Microscope (FlowCAM)
| Group | Shape | Colours | Description and examples |
|---|---|---|---|
| Centric single diatoms | Round | Green/Brown | Centric single diatom cells round in their valvar view. Mainly Thalassiosira and Coscinodiscus species. |
| Pennate diatoms | Oval | Green/Brown | e.g., Pleurosigma sp. |
| Linear chains of small cells | Straight | Green/Brown | Small cells making lineal chains. e.g.,: Some species of Chaetoceros, Skeletonema, etc. |
| Large individuals and linear chains of large cells | Straight | Light green | Long straight single cells or chains. e.g.,: Rhizosolenia and Proboscia species. |
| Helical chains | Helical | Light green | Species making helical chains. e.g.,: Guinardia striata, Chaetoceros debilis. |
| Other diatoms | − | − | Those diatoms not fitting in previous described groups. Always representing less than 8% in abundance. e.g., Thalassionema nitzschioides, Guinardia flaccida, Odontella sp. |
3.5. Biological Variables
3.6. Nutrients
3.7. Statistics
4. Conclusions
Supplementary Files
Acknowledgments
Author Contributions
Conflicts of Interest
References
- Smetacek, V. A watery arms race. Nature 2001, 411, 745. [Google Scholar] [CrossRef]
- Wilhelm, C.; Büchel, C.; Fisahn, J.; Goss, R.; Jakob, T.; LaRoche, J.; Lavaud, J.; Lohr, M.; Riebesell, U.; Stehfest, K.; et al. The regulation of carbon and nutrient assimilation in diatoms is significantly different from green algae. Protist 2006, 157, 91–124. [Google Scholar] [CrossRef]
- Hamm, C.E.; Merkel, R.; Springer, O.; Jurkojc, P.; Maier, C.; Prechtel, K.; Smetacek, V. Architecture and material properties of diatom shells provide effective mechanical protection. Nature 2003, 421, 841–843. [Google Scholar] [CrossRef]
- Miralto, A.; Barone, G.; Romano, G.; Poulet, S.A.; Ianora, A.; Russo, G.L.; Buttino, I.; Mazzarella, G.; Laabir, M.; Cabrini, M.; et al. The insidious effect of diatoms on copepod reproduction. Nature 1999, 402, 173–176. [Google Scholar] [CrossRef]
- Pohnert, G. Diatom/Copepod interactions in plankton: The indirect chemical defense of unicellular algae. ChemBioChem 2005, 6, 946–959. [Google Scholar] [CrossRef]
- Pohnert, G. Chemical Defense Strategies of Marine Organisms. In Chemistry of Pheromones and Other Semiochemicals I; Schulz, S., Ed.; Springer: Berlin, Germany, 2004; Volume 239, pp. 179–219. [Google Scholar]
- Vardi, A.; Formiggini, F.; Casotti, R.; de Martino, A.; Ribalet, F.; Miralto, A.; Bowler, C. A stress surveillance system based on calcium and nitric oxide in marine diatoms. PLoS Biol. 2006, 4, 411–419. [Google Scholar] [CrossRef]
- Fontana, A.; d’Ippolito, G.; Cutignano, A.; Miralto, A.; Ianora, A.; Romano, G.; Cimino, G. Chemistry of oxylipin pathways in marine diatoms. Pure Appl. Chem. 2007, 79, 481–490. [Google Scholar]
- D’Ippolito, G.; Tucci, S.; Cutignano, A.; Romano, G.; Cimino, G.; Miralto, A.; Fontana, A. The role of complex lipids in the synthesis of bioactive aldehydes of the marine diatom Skeletonema costatum. Biochim. Biophys. Acta 2004, 1686, 100–107. [Google Scholar] [CrossRef]
- D’Ippolito, G.; Iadicicco, I.; Romano, G.; Fontana, A. Detection of short-chain aldehydes in marine organism: The diatom Thalassiosira rotula. Tetrahedron Lett. 2002, 43, 6137–6140. [Google Scholar] [CrossRef]
- Pohnert, G. Phospholipase A2 activity triggers the wound-activated chemical defense in the diatom Thalassiosira rotula. Plant Physiol. 2002, 129, 103–111. [Google Scholar] [CrossRef]
- Ribalet, F.; Wichard, T.; Pohnert, G.; Ianora, A.; Miralto, A.; Casotti, R. Age and nutrient limitation enhance polyunsaturated aldehyde production in marine diatoms. Phytochemistry 2007, 68, 2059–2067. [Google Scholar] [CrossRef]
- Ribalet, F.; Vidoudez, C.; Cassin, D.; Pohnert, G.; Ianora, A.; Miralto, A.; Casotti, R. High plasticity in the production of diatom-derived polyunsaturated aldehydes under nutrient limitation: Physiological and ecological implications. Protist 2009, 160, 444–451. [Google Scholar] [CrossRef]
- Vidoudez, C.; Pohnert, G. Growth phase-specific release of polyunsaturated aldehydes by the diatom Skeletonema marinoi. J. Plankton Res. 2008, 30, 1305–1313. [Google Scholar] [CrossRef]
- Vidoudez, C.; Casotti, R.; Bastianini, M.; Pohnert, G. Quantification of dissolved and particulate polyunsaturated aldehydes in the Adriatic Sea. Mar. Drugs 2011, 9, 500–513. [Google Scholar] [CrossRef] [Green Version]
- Gómez, F.; Echevarría, F.; García, C.M.; Prieto, L.; Ruiz, J.; Reul, A.; Jiménez-Gómez, F.; Varela, M. Microplankton distribution in the Strait of Gibraltar: Coupling between organisms and hydrodynamic structures. J. Plankton Res. 2000, 22, 603–617. [Google Scholar] [CrossRef]
- Lacombe, H.; Richez, C. The Regime of the Strait of Gibraltar. In Hydrodynamics of Semi-Enclosed Seas; Nihoul, J.C.J., Ed.; Elsevier Scientific: Amsterdam, The Netherlands, 1982; pp. 13–73. [Google Scholar]
- Gascard, J.C.; Richez, C. Water masses and circulation in the Western Alboran Sea and in the Straits of Gibraltar. Prog. Oceanogr. 1985, 15, 157–216. [Google Scholar] [CrossRef]
- Macías, D.; Martin, A.P.; García-Lafuente, J.; García, C.M.; Yool, A.; Bruno, M.; Vázquez-Escobar, A.; Izquierdo, A.; Sein, D.V.; Echevarría, F. Analysis of mixing and biogeochemical effects induced by tides on the Atlantic-Mediterranean flow in the Strait of Gibraltar through a physical-biological coupled model. Prog. Oceanogr. 2007, 74, 252–272. [Google Scholar] [CrossRef]
- Ramírez-Romero, E.; Macías, D.; Bruno, M.; Reyes, E.; Navarro, G.; García, C.M. Submesoscale, tidally-induced biogeochemical patterns in the Strait of Gibraltar. Estuar. Coast. Shelf Sci. 2012, 101, 24–32. [Google Scholar] [CrossRef] [Green Version]
- Macías, D.; García, C.M.; Echevarría, F.; Vázquez-López, A.; Bruno, M. Tidal induced variability of mixing processes on Camarinal Sill (Strait of Gibraltar): A pulsating event. J. Mar. Syst. 2006, 60, 177–192. [Google Scholar] [CrossRef]
- Macías, D.; Lubían, L.M.; Echevarría, F.; Huertas, I.E.; García, C.M. Chlorophyll maxima and water mass interfaces: Tidally induced dynamics in the Strait of Gibraltar. Deep-Sea Res. Part I: Oceanogr. Res. 2008, 832–846. [Google Scholar]
- Vidoudez, C.; Nejstgaard, J.C.; Jakobsen, H.H.; Pohnert, G. Dynamics of dissolved and particulate polyunsaturated aldehydes in mesocosms inoculated with different densities of the diatom Skeletonema marinoi. Mar. Drugs 2011, 9, 345–358. [Google Scholar] [CrossRef]
- Gómez, F.; González, N.; Echevarría, F.; García, C.M. Distribution and fluxes of dissolved nutrients in the strait of Gibraltar and its relationships to microplankton biomass. Estuar. Coast. Shelf Sci. 2000, 51, 439–449. [Google Scholar] [CrossRef]
- Redfield, A.C.; Ketchum, B.H.; Richards, F.A. The Influence of Organisms on the Composition of Seawater. In The Composition of Sea-Water Comparative and Descriptive Oceanography; Hill, M.N., Ed.; Harvard University Press: New York, NY, USA, 1963; Volume 2, p. 572. [Google Scholar]
- Smayda, T.J. Harmful algal bloom: Their ecophysiology and general relevance to phytoplankton blooms in the sea. Limnol. Oceanogr. 1997, 42, 1137–1153. [Google Scholar] [CrossRef]
- Goering, J.J.; Nelson, D.M.; Carter, J.A. Silicic acid uptake by natural populations of marine phytoplankton. Deep-Sea Res. 1973, 20, 777–789. [Google Scholar]
- Paasche, E. Silicon content of five marine plankton diatom species measured with a rapid filter method. Limnol. Oceanogr. 1980, 25, 474–480. [Google Scholar] [CrossRef]
- Wichard, T.; Poulet, S.A.; Halsband-Lenk, C.; Albaina, A.; Harris, R.; Liu, D.; Pohnert, G. Survey of the chemical defense potential of diatoms: Screening of 51 species for α,β,λ,δ-unsaturated aldehydes. J. Chem. Ecol. 2005, 31, 949–958. [Google Scholar] [CrossRef]
- Wichard, T.; Poulet, S.A.; Boulesteix, A.L.; Ledoux, J.B.; Lebreton, B.; Marchetti, J.; Pohnert, G. Influence of diatoms on copepod reproduction. II. Uncorrelated effects of diatom-derived α,β,λ,δ-unsaturated aldehydes and polyunsaturated fatty acids on Calanus helgolandicus in the field. Prog. Oceanogr. 2008, 77, 30–44. [Google Scholar] [CrossRef]
- Hansen, E.; Ernstsen, A.; Eilertsen, H.C. Isolation and characterisation of a cytotoxic polyunsaturated aldehyde from the marine phytoplankter Phaeocystis pouchetii (Hariot) Lagerheim. Toxycology 2004, 199, 207–217. [Google Scholar] [CrossRef]
- Bartual, A.; Arandia-Gorostidi, N.; Cózar, A.; Morillo-García, S.; Ortega, M.J.; Vidal, M.; Cabello, A.M.; González-Gordillo, J.I.; Echevarría, F. Polyunsaturated aldehydes from large phytoplankton of the Atlantic Ocean (42°N to 33°S). Mar. Drugs 2014, 12, 682–699. [Google Scholar] [CrossRef]
- Vargas-Yáñez, M.; Viola, T.S.; Jorge, F.P.; Rubin, J.P.; García-Martínez, M.C. The influence of tide-topography interaction on low-frequency heat and nutrient fluxes. Application to Cape Trafalgar. Cont. Shelf Res. 2002, 22, 115–139. [Google Scholar] [CrossRef]
- Navarro, G.; Ruiz, J. Spatial and temporal variability of phytoplankton in the Gulf of Cádiz through remote sensing images. Deep Sea Res. Part II: Top. Stud. Oceanogr. 2006, 53, 1241–1260. [Google Scholar] [CrossRef]
- Groth-Nard, C.; Robert, J.M. Les lipids des diatomees. Diatom Res. 1993, 8, 281–308. [Google Scholar]
- Legrand, C.; Rengefors, K.; Fistarol, G.O.; Granéli, E. llelopathy in phytoplankton-biochemical, ecological and evolutionary aspects. Phycologia 2003, 42, 406–419. [Google Scholar] [CrossRef]
- Vidoudez, C.; Pohnert, G. Comparative metabolomics of the diatom Skeletonema marinoi in different growth phases. Metabolomics 2012, 8, 654–669. [Google Scholar] [CrossRef]
- R Development Core Team. R: A Language and Environment for Statistical Computing. R Foundation for Statistical Computing, Vienna, Austria. ISBN 3-900051-07-0. 2008. Available online: http://www.R-project.org (accessed on 7 July 2013).
- Wichard, T.; Poulet, S.A.; Pohnert, G. Determination and quantification of α,β,λ,δ-unsaturated aldehydes as pentafluorobenzyl-oxime derivates in diatom cultures and natural phytoplankton populations: Application in marine field studies. J. Chromatogr. B 2005, 814, 155–161. [Google Scholar] [CrossRef]
- Sieracki, C.K.; Sieracki, M.E.; Yentsch, C.S. An imaging-in-flow system for automated analysis of marine microplankton. Mar. Ecol. Prog. Ser. 1998, 168, 285–296. [Google Scholar] [CrossRef]
- Lund, J.W.G.; Kipling, C.; Le Cren, E.D. The inverted microscope method of estimating algal numbers and the statistical basis of estimations by counting. Hydrobiologia 1958, 11, 143–170. [Google Scholar] [CrossRef]
- Álvarez, E.; López-Urrutia, A.; Nogueira, E. Improvement of plankton biovolume estimates derived from image-based automatic sampling devices: Application to FlowCAM. J. Plankton Res. 2012, 34, 454. [Google Scholar] [CrossRef]
- Herman, A. LOPC Data Analyses-Standard LOPC. 2009. Available online: http://www.alexherman.com/lopc_post.php (accessed on 19 July 2011).
- Yentsch, C.S.; Menzel, D.W. A method for the determination of phytoplankton chlorophyll and Phaeophytin by fluorescence. Deep-Sea Res. 1963, 10, 221–231. [Google Scholar]
- Holm-Hassen, O.; Lorenzen, C.J.; Homes, R.W.; Strickland, J.D.H. Fluorometric determination of chlorophyll. J. Cons. Perm. Int. Explor. Mer 1965, 187, 9–18. [Google Scholar]
- Kolbowski, J.; Schreiber, U. Computer-Controlled Phytoplankton Analyzer Based on a 4-Wavelengths PAM Chlorophyll Fluorometer. In Photosynthesis, from Light to Biosphere; Mathis, V.P., Ed.; Kluwer Academic Publisher: Dordrecht, The Netherlands, 1995; pp. 825–828. [Google Scholar]
- Kolberg, Z.; Falkowski, P.G. Use of active fluorescence to estimate phytoplankton photosynthesis in situ. Limnol. Oceanogr. 1993, 38, 1646–1665. [Google Scholar] [CrossRef]
- Macías, D.; Navarro, G.; Bartual, A.; Echevarría, F.; Huertas, I.E. Primary production in the Strait of Gibraltar: Carbon fixation rates in relation to hydrodynamic and phytoplankton dynamics. Estuar. Coast. Shelf Sci. 2009, 83, 197–210. [Google Scholar] [CrossRef]
- Strickland, J.D.H.; Parsons, T.R. A Practical Handbook of Seawater Analysis, 2nd ed.; Fisheries Research Board of Canada: Ottawa, Canada, 1972; pp. 1–310. [Google Scholar]
© 2014 by the authors; licensee MDPI, Basel, Switzerland. This article is an open access article distributed under the terms and conditions of the Creative Commons Attribution license (http://creativecommons.org/licenses/by/3.0/).
Share and Cite
Morillo-García, S.; Valcárcel-Pérez, N.; Cózar, A.; Ortega, M.J.; Macías, D.; Ramírez-Romero, E.; García, C.M.; Echevarría, F.; Bartual, A. Potential Polyunsaturated Aldehydes in the Strait of Gibraltar under Two Tidal Regimes. Mar. Drugs 2014, 12, 1438-1459. https://doi.org/10.3390/md12031438
Morillo-García S, Valcárcel-Pérez N, Cózar A, Ortega MJ, Macías D, Ramírez-Romero E, García CM, Echevarría F, Bartual A. Potential Polyunsaturated Aldehydes in the Strait of Gibraltar under Two Tidal Regimes. Marine Drugs. 2014; 12(3):1438-1459. https://doi.org/10.3390/md12031438
Chicago/Turabian StyleMorillo-García, Soledad, Nerea Valcárcel-Pérez, Andrés Cózar, María J. Ortega, Diego Macías, Eduardo Ramírez-Romero, Carlos M. García, Fidel Echevarría, and Ana Bartual. 2014. "Potential Polyunsaturated Aldehydes in the Strait of Gibraltar under Two Tidal Regimes" Marine Drugs 12, no. 3: 1438-1459. https://doi.org/10.3390/md12031438