Study of Alternative GPS Network Meteorological Sensors in Taiwan: Case Studies of the Plum Rains and Typhoon Sinlaku


Abstract
:1. Introduction
2. Problem Statements
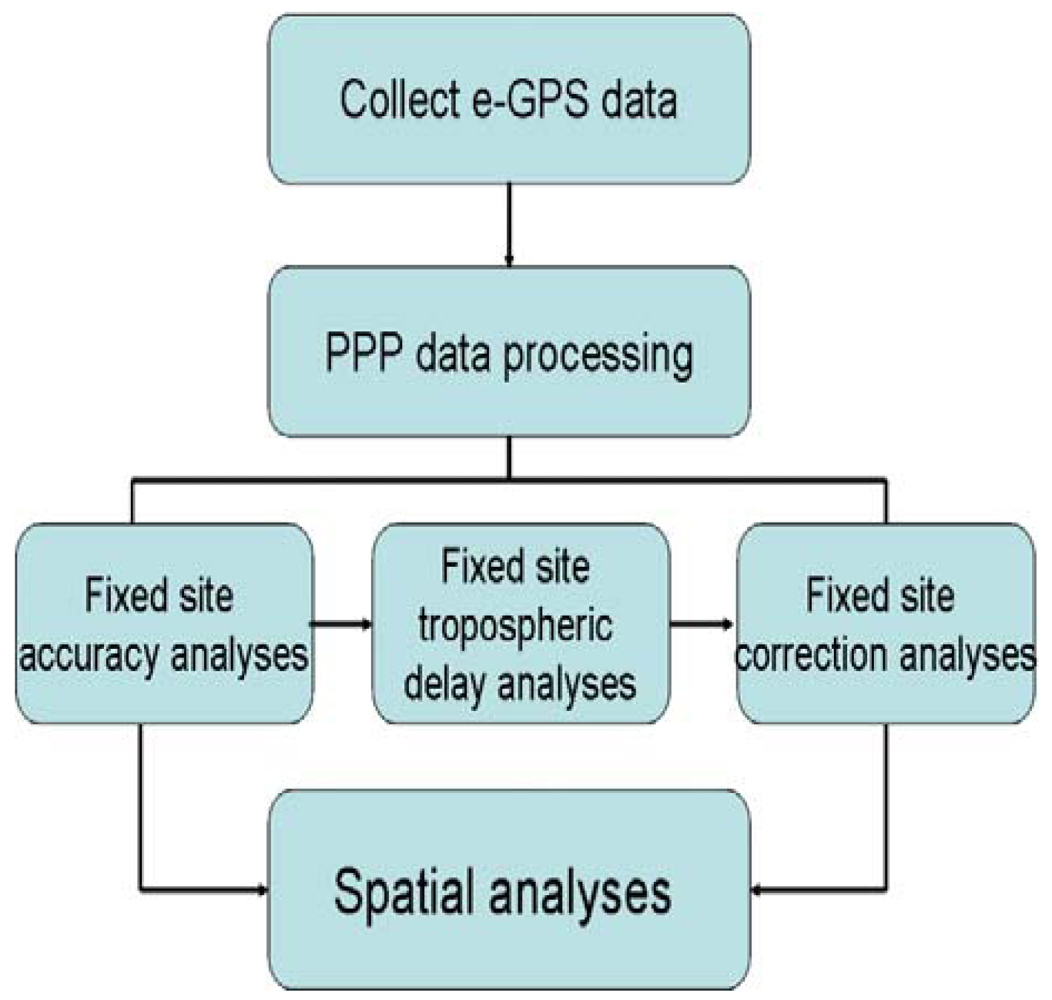
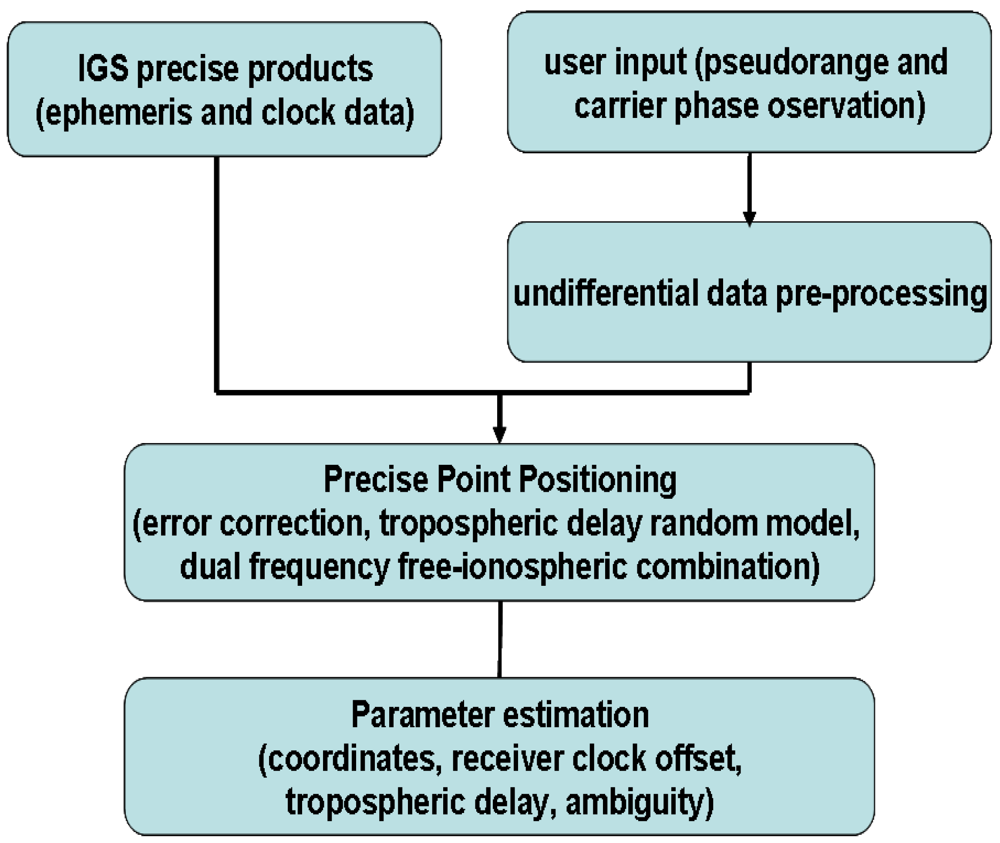
3. PPP Based Tropospheric Delay Estimation
- Dhz the zenith hydrostatic delay
- Dwz the zenith wet delay
- GN GE the horizontal delay gradient in the north and east directions
- mh(e) the hydrostatic mapping function
- mw(e) the wet mapping function
- mg(e) the gradient mapping function
- a e the azimuth and elevation angles
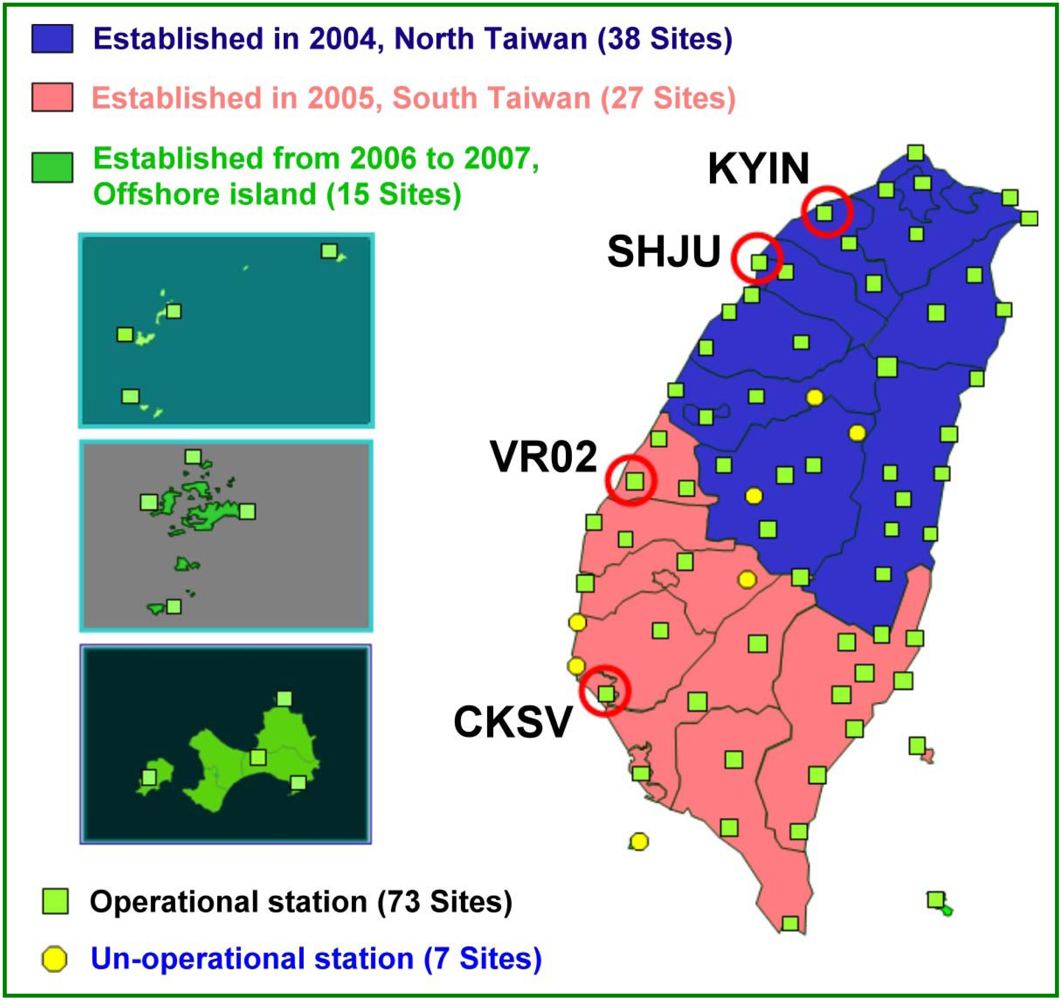
4. The e-GPS Network
5. Results and Discussions
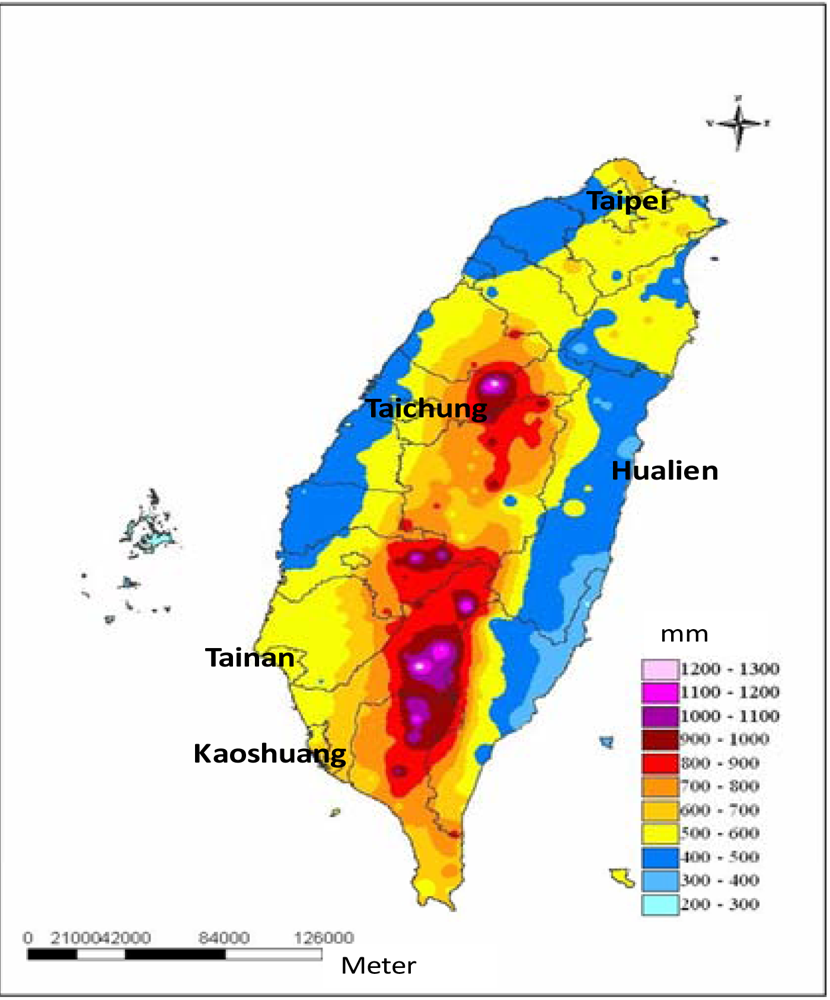
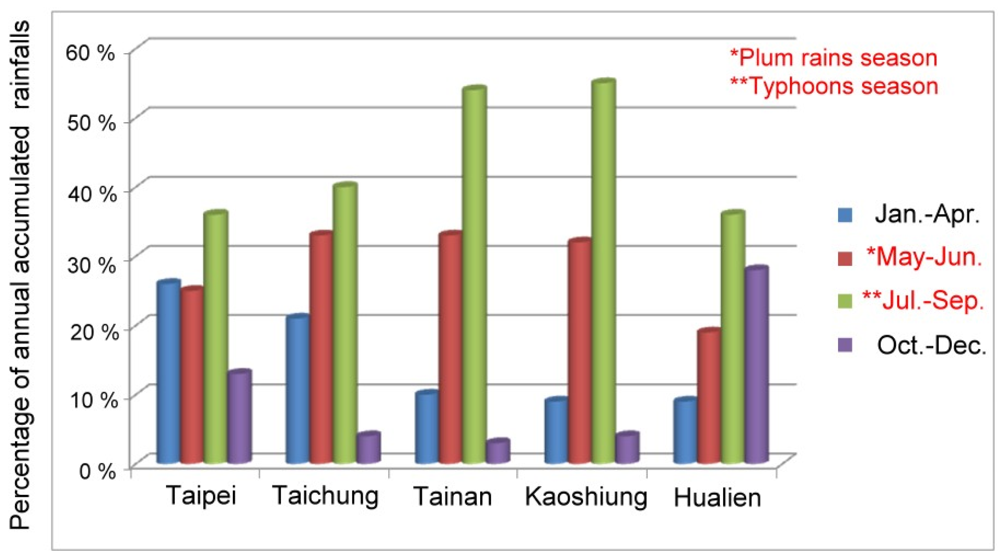
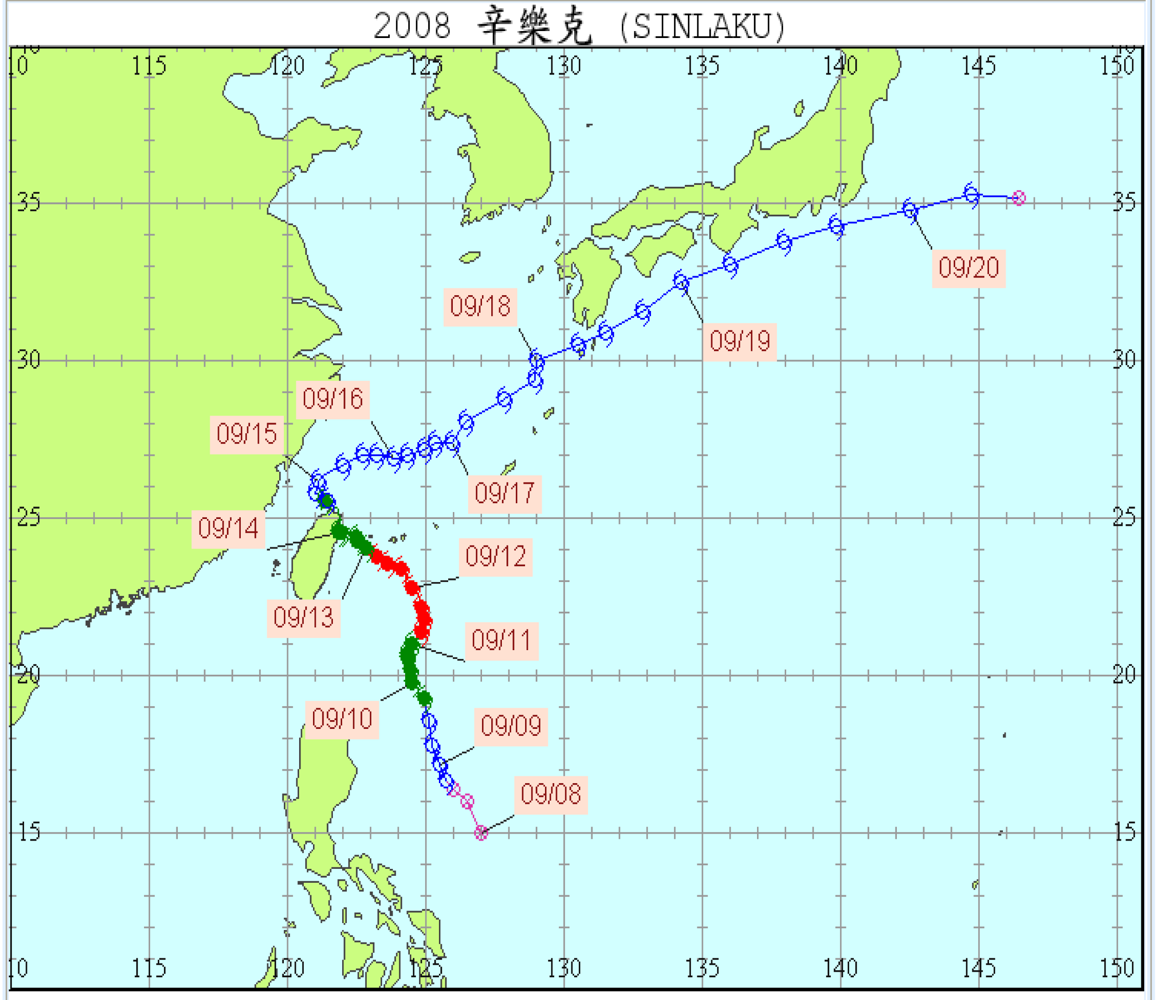
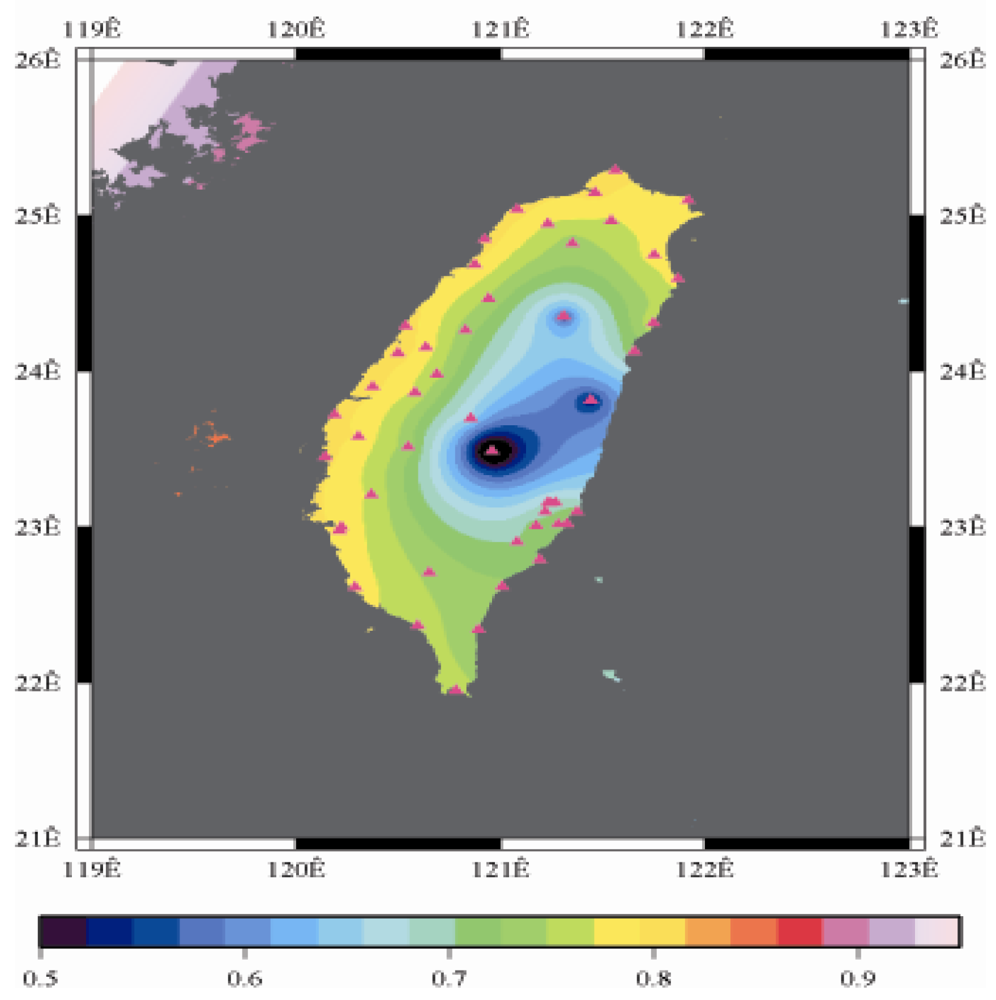
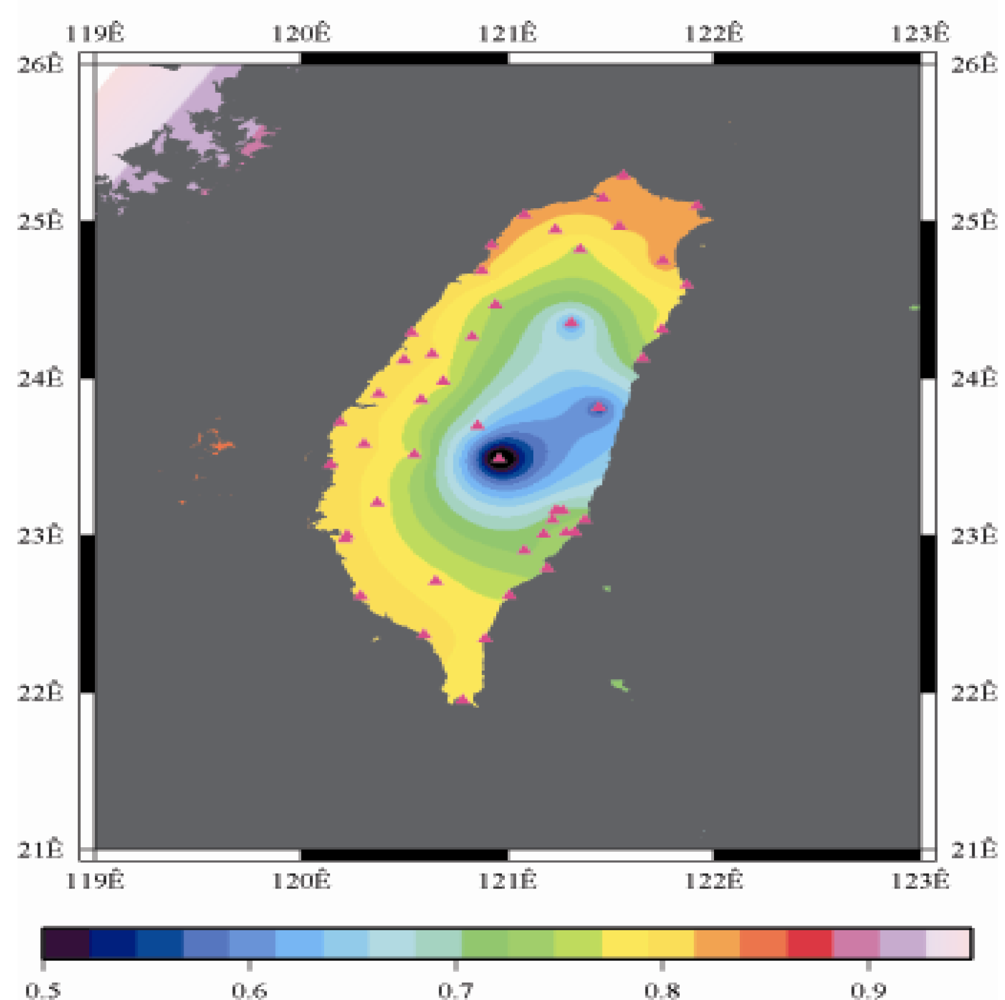
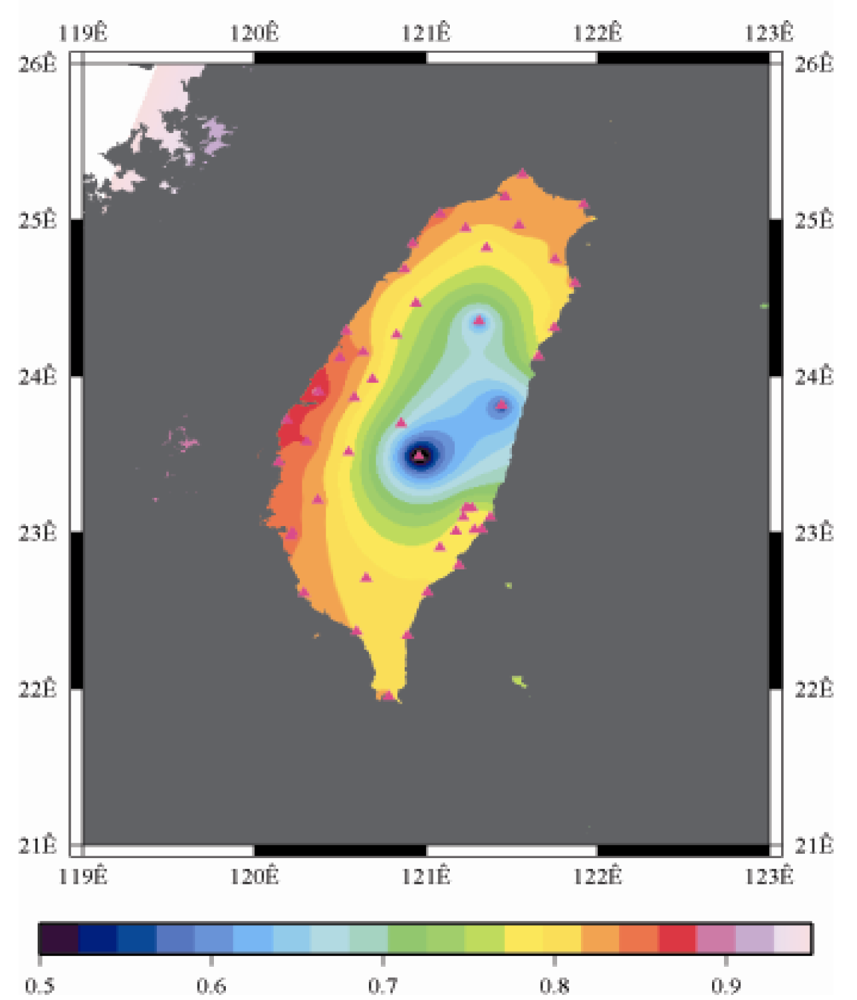
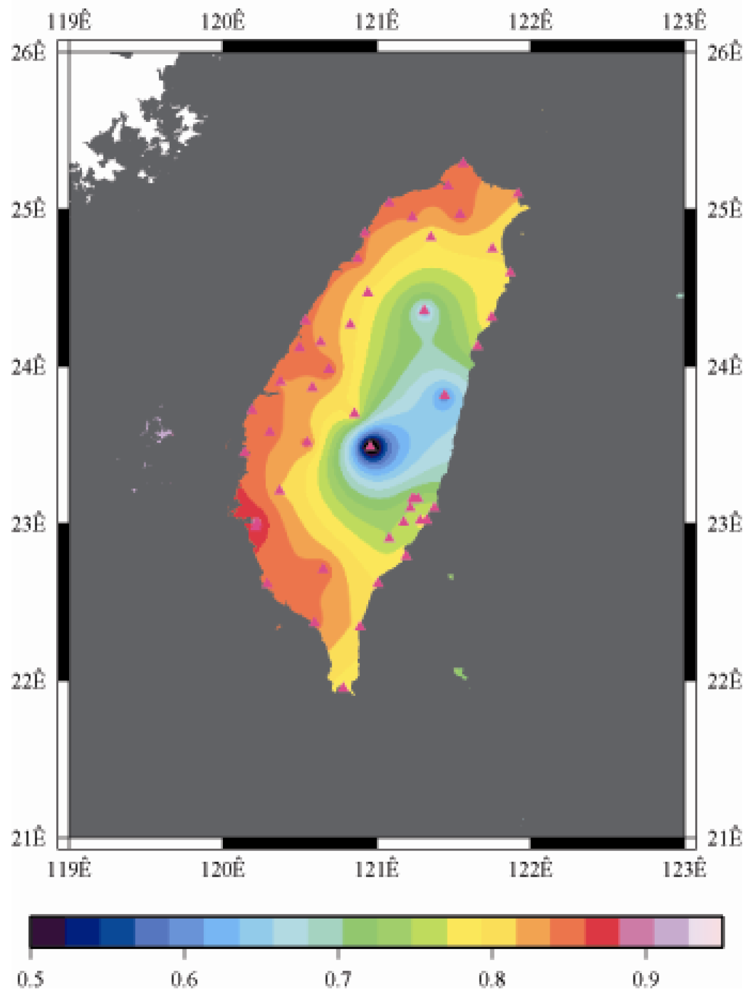
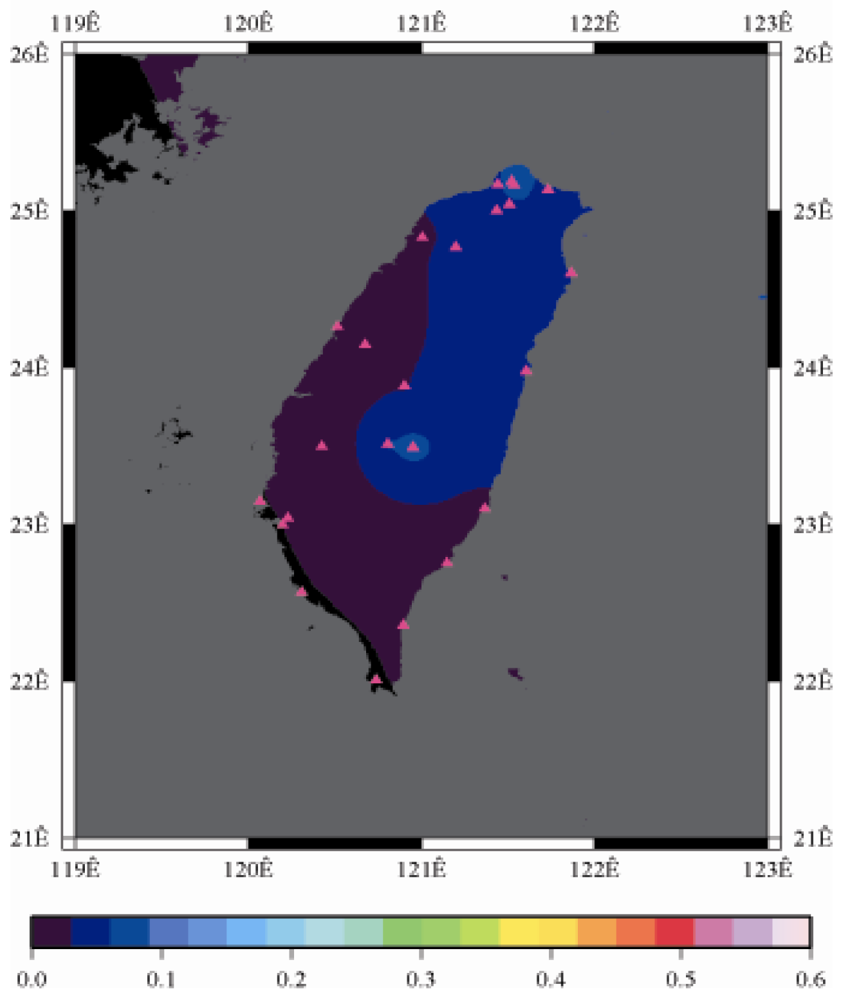
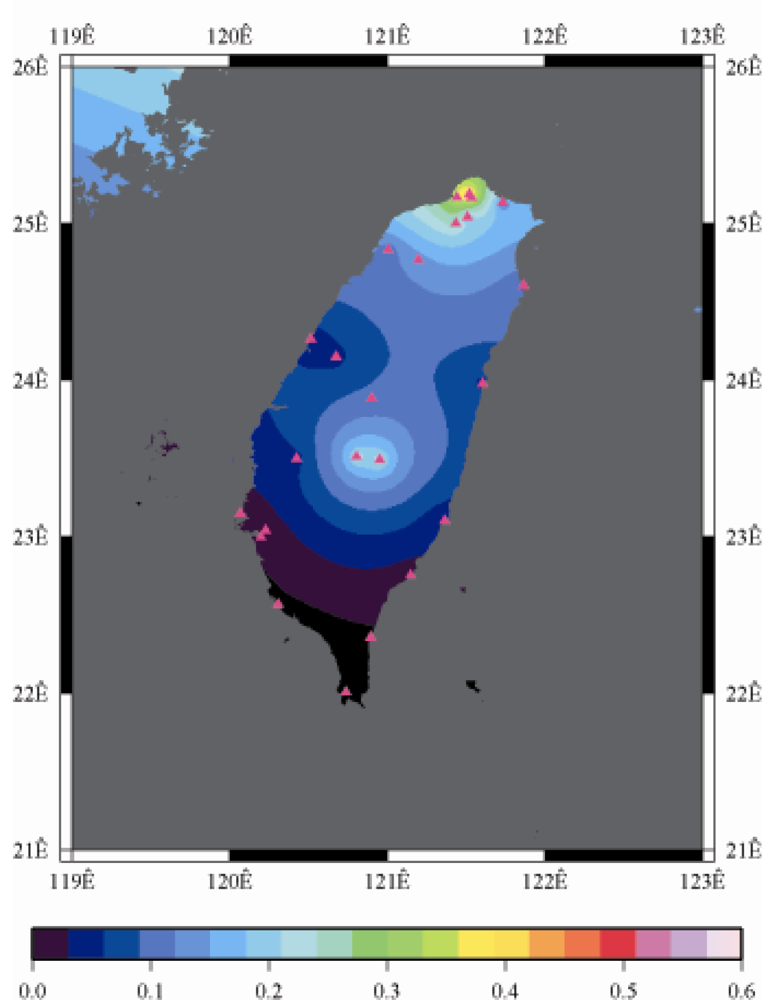
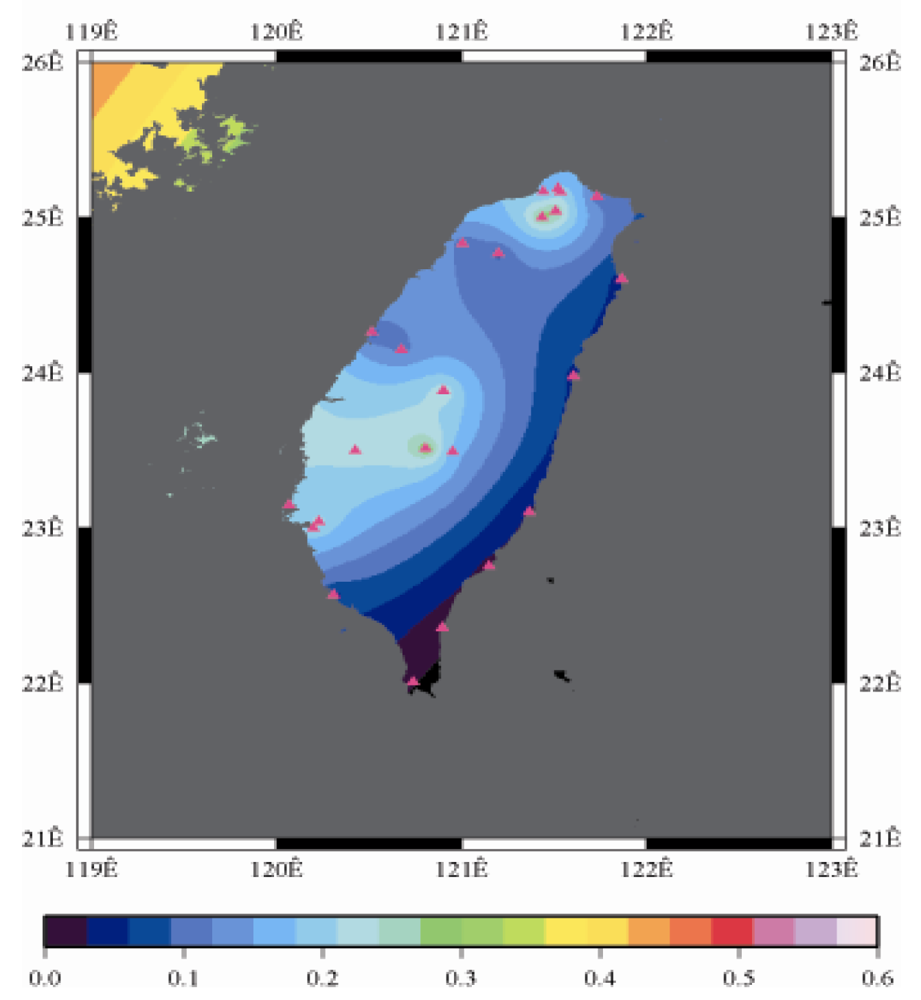
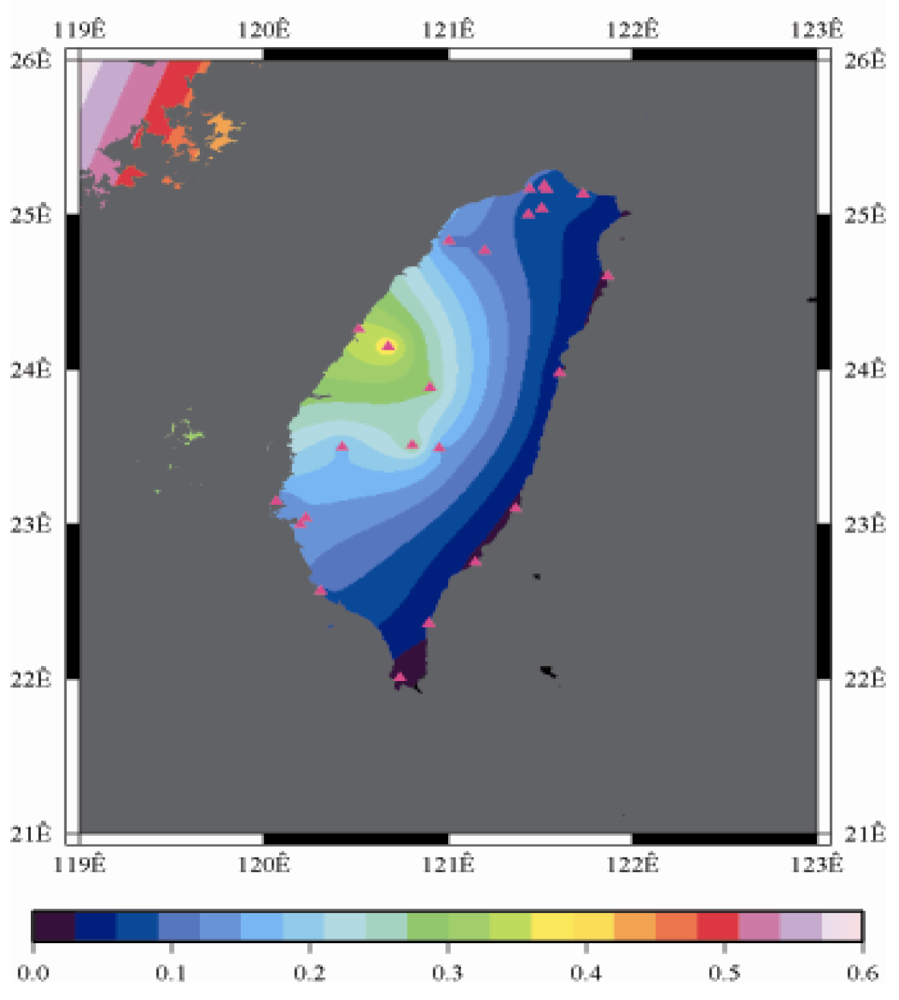
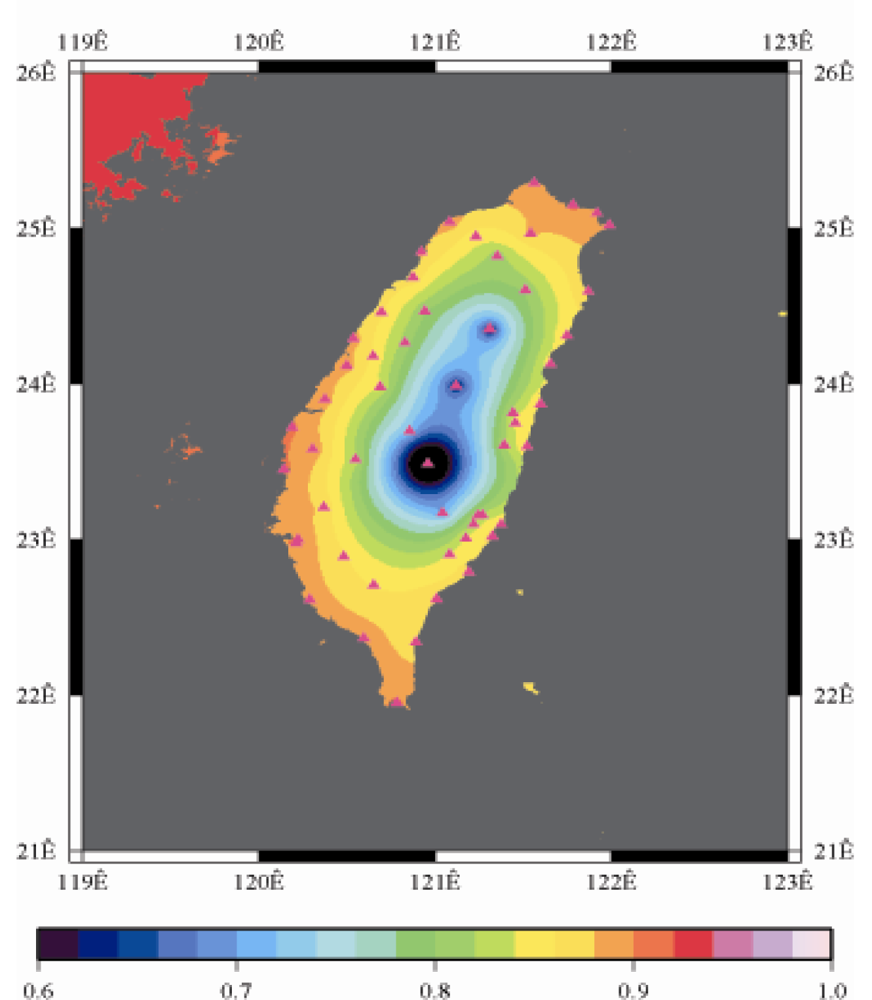
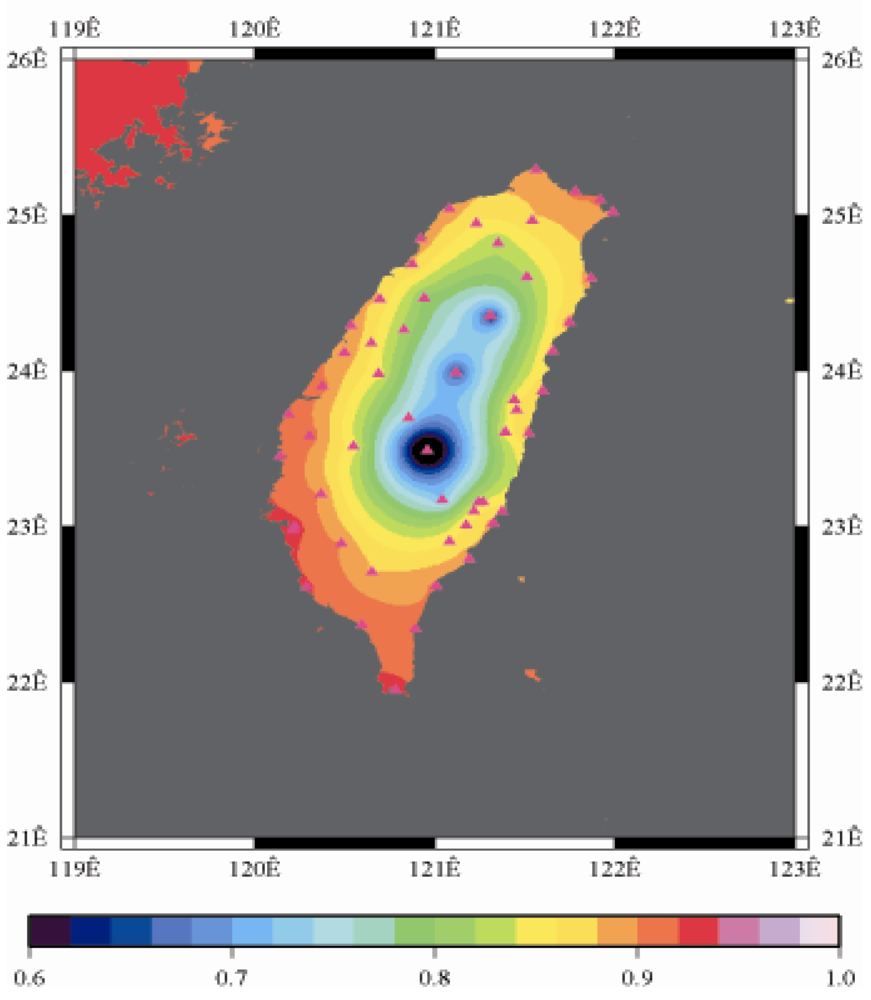
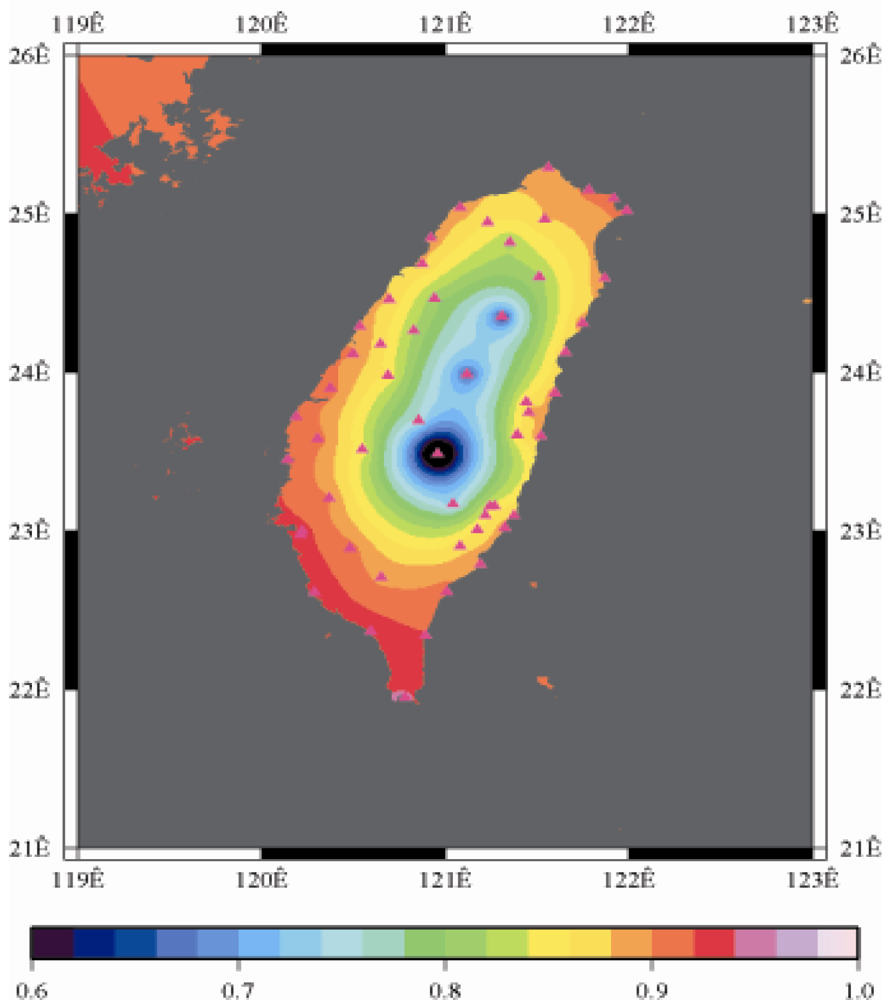
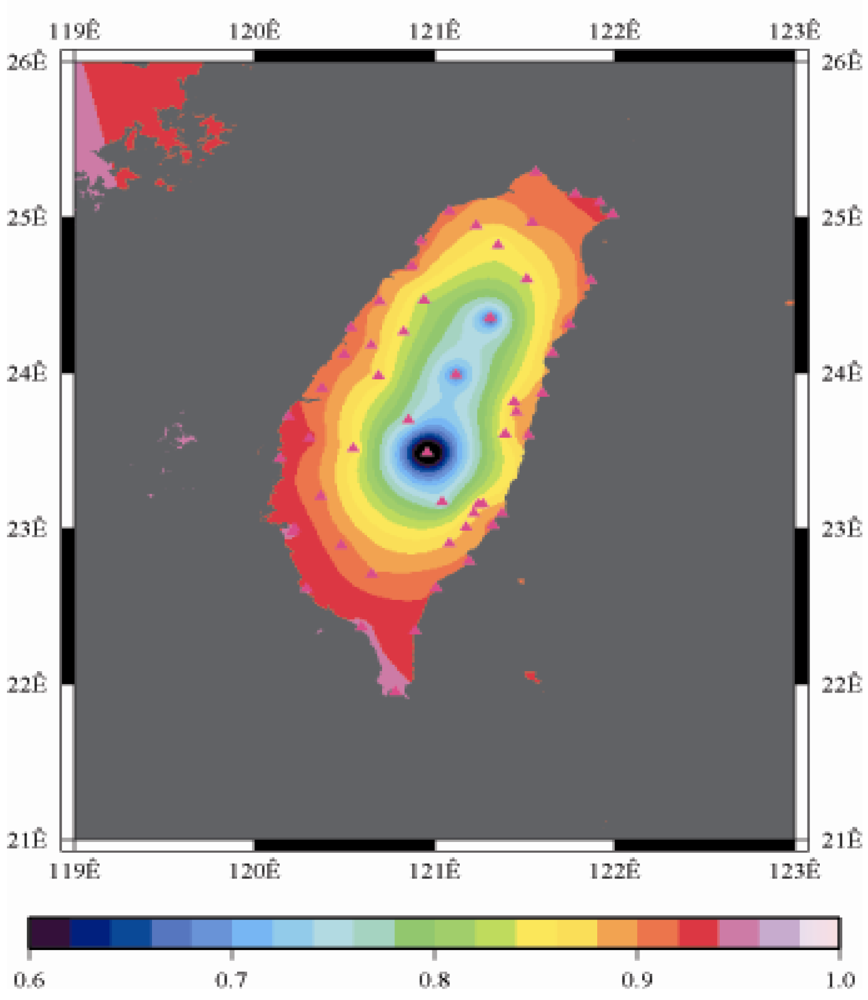
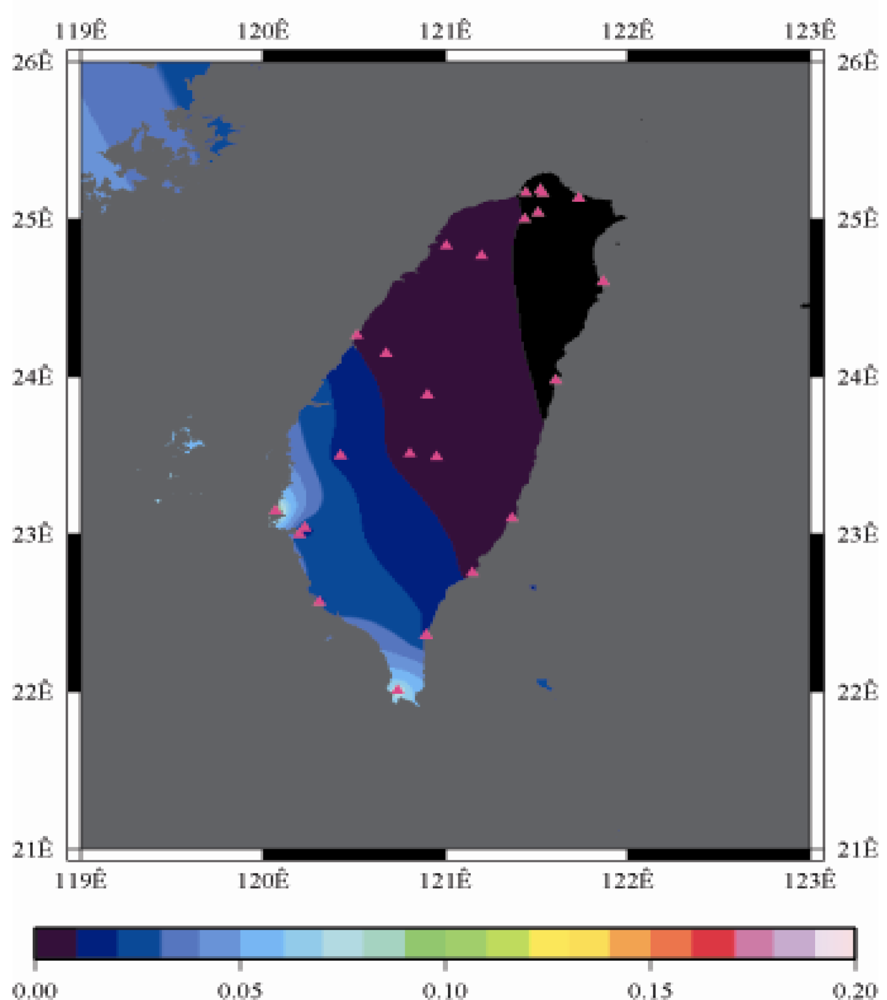
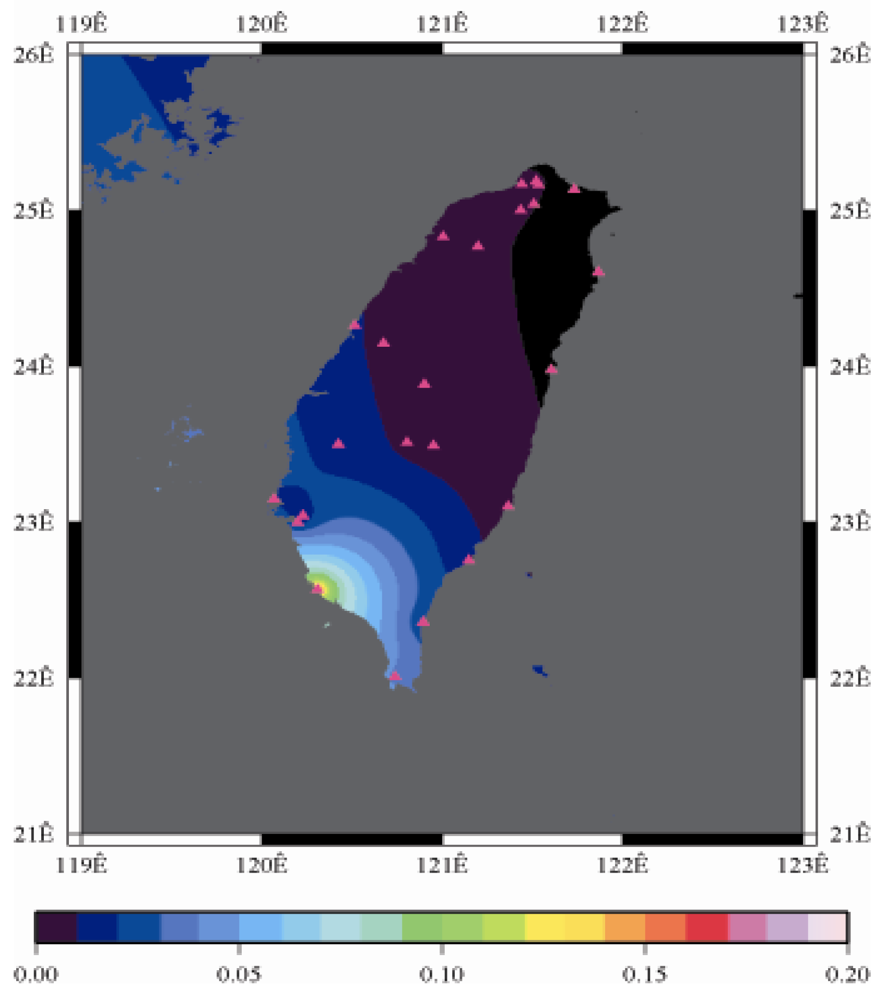
5.1. Spatial Correspondence between ZTDs and Rainfalls during Typhoon Sinlaku Influencing Period
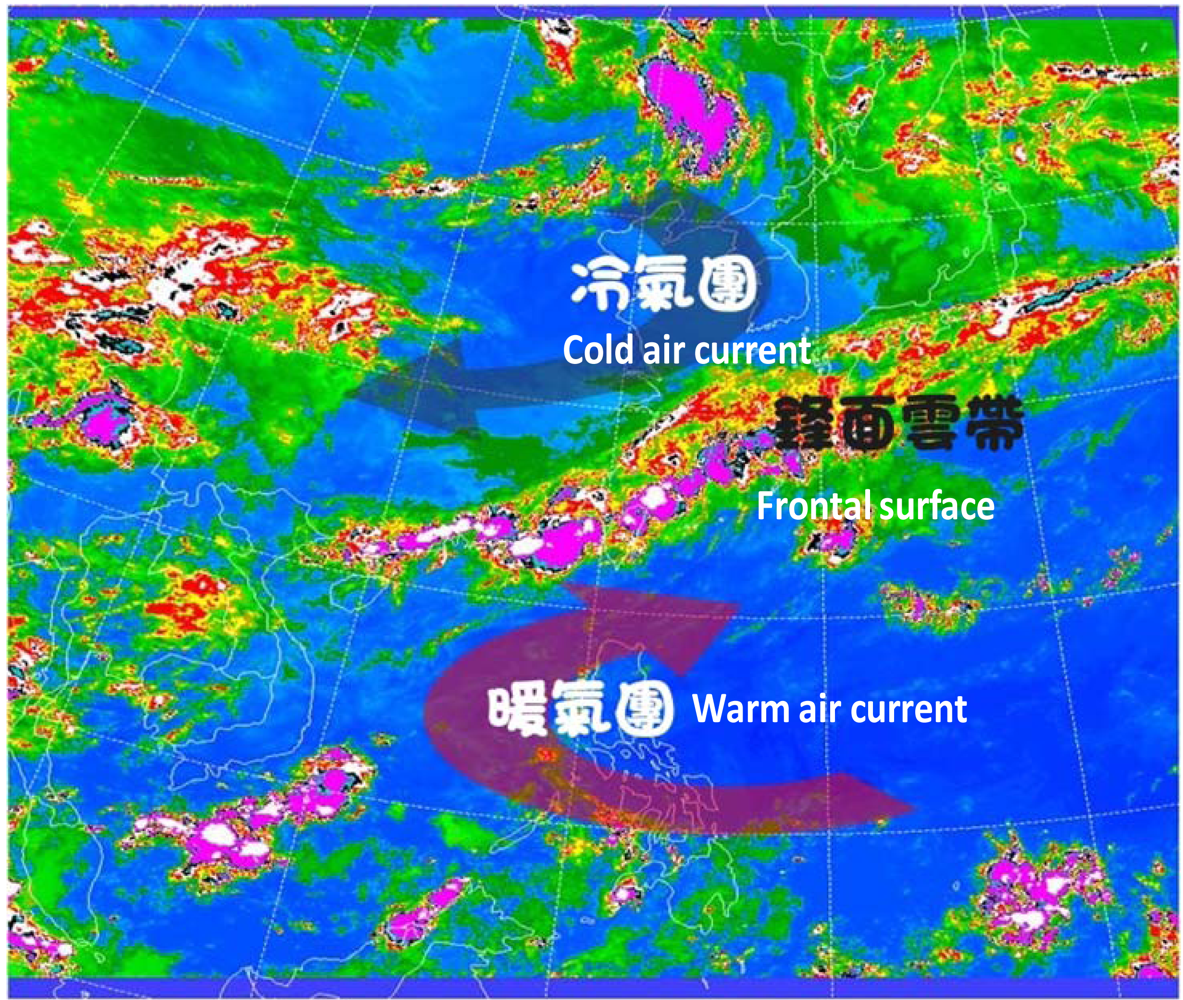
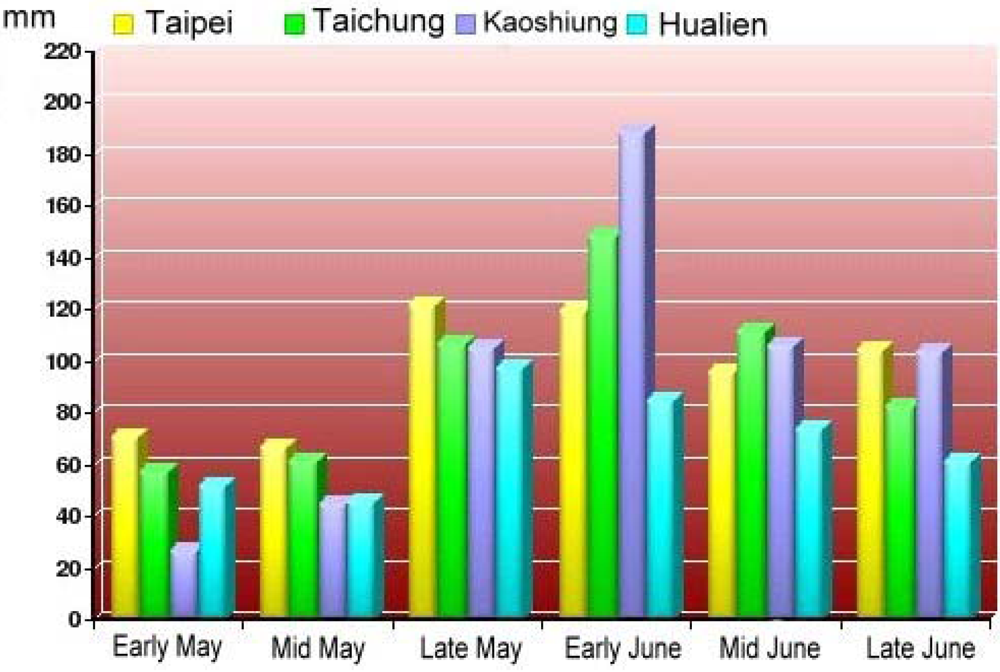
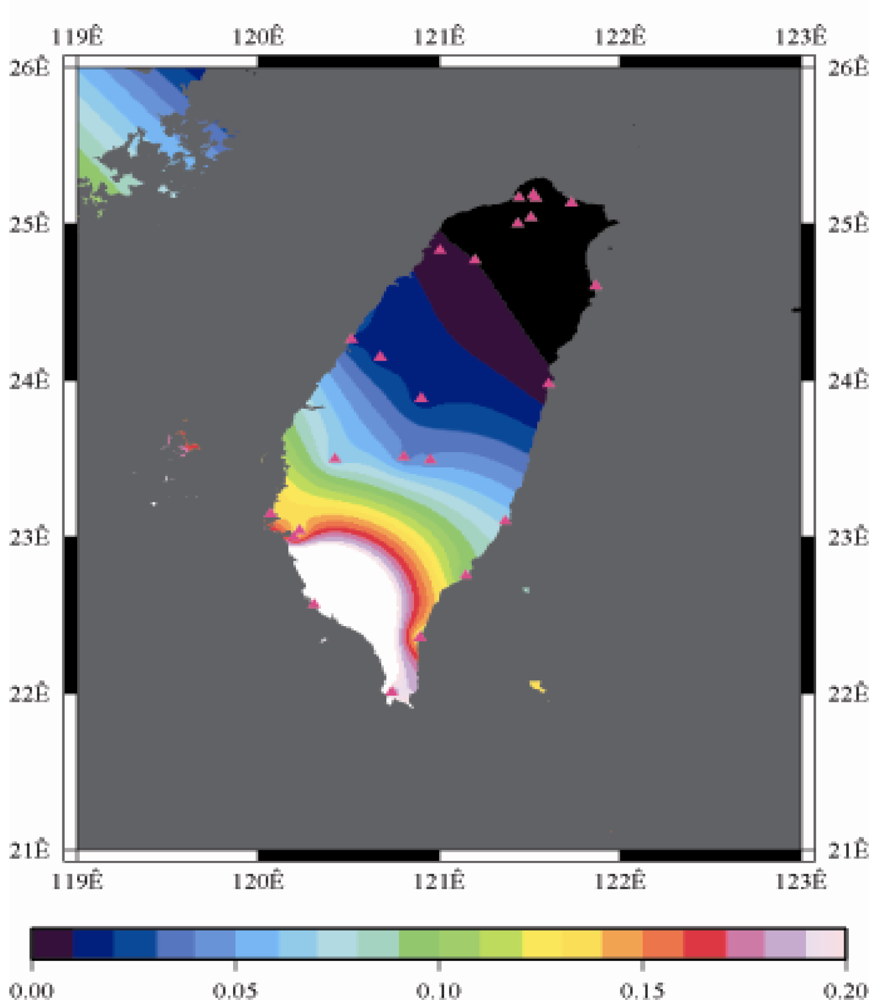
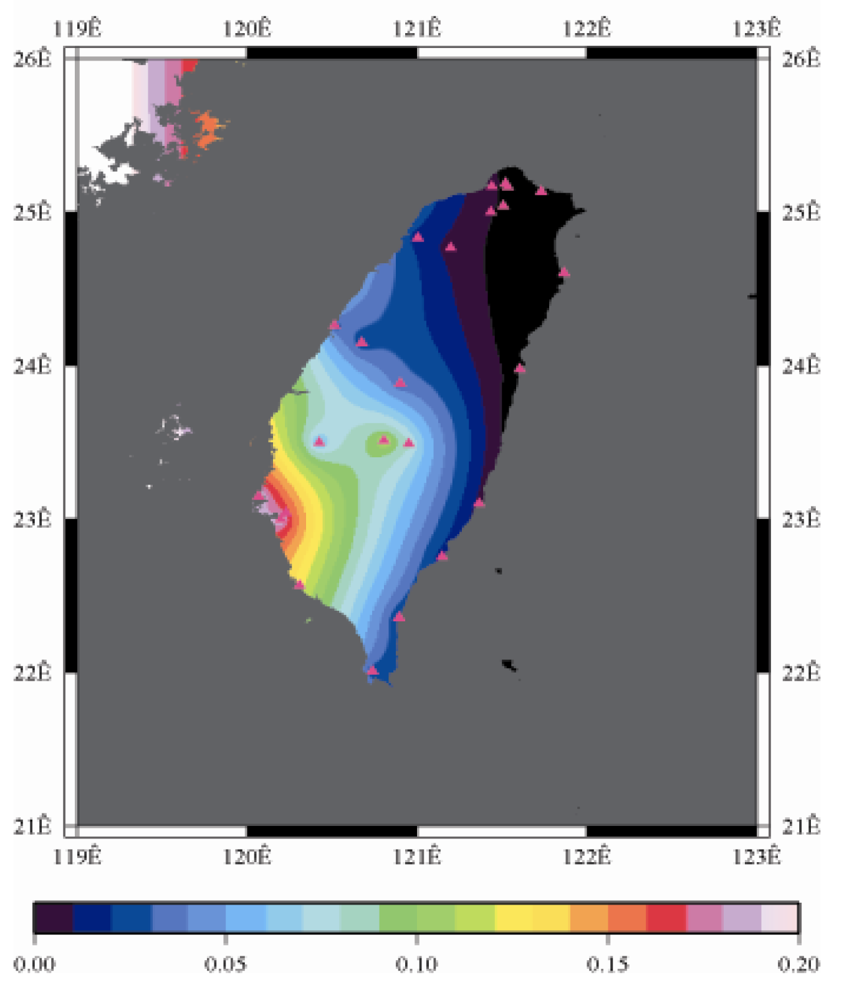
5.2. Spatial Correspondence between ZTDs and Rainfalls during Plum Rains Period
6. Conclusions
Acknowledgments
References and Notes
- Peng, W.C.; Li, Y.H.; Chiang, K.W.; Yang, M. The Study of Typhoon Path in Taiwan Region using Precise Point Positioning Technique. In ION GNSS 2008; Savannah, GA, 2008; pp. 244–252. [Google Scholar]
- Parkinson, B.W.; Spilker, J.J., Jr.; Axelrad, P.; Enge, P. Global Positioning System: Theory & Applications 2 Volume Set (Progress in Astronautics and Aeronautics); American Institute of Aeronautics and Astronautics: Washington, DC, USA, 1996. [Google Scholar]
- Bevis, M.; Businger, S.; Herring, T.A.; Rocken, C.; Anthes, R.A.; Ware, R.H. GPS meteorology: sensing of atmospheric water vapor using the Global Positioning System. J. Geophys. Res. 1992, 97, 15787–15801. [Google Scholar]
- Ozener, H.; Dogru, A.; Unlutepe, A. An approach for rapid assessment of seismic hazards in Turkey by continuous GPS data. Sensors 2009, 9, 602–615. [Google Scholar]
- Zumberge, J.F.; Heflin, M.B.; Jefferson, D.C.; Watkins, M.M.; Webb, F.H. Precise point positioning for the efficient and robust analysis of GPS data from large networks. J. Geophys. Res. 1997, 102, 5005–5017. [Google Scholar]
- Kouba, J.; Héroux, P. Precise point positioning using igs orbit and clock products. GPS Solutions 2001, 5, 12–28. [Google Scholar]
- Gao, Y.; Shen, X. Improving ambiguity convergence in carrier phase-based precise point positioning. In Proceedings of ION GPS 2001; Salt Lake City, UT, 2001; pp. 1532–1539. [Google Scholar]
- McCarthy, D.D.; Petit, G. IERS Technical Note (32); Verlag des Bundesamtes für Kartographie und Geodäsie: Frankfurt am Main, Germany, 2004. [Google Scholar]
- Chen, G.; Herring, T. Effects of atmospheric azimuthal asymmetry on the analysis of space geodetic data. J. Geophys. Res. 1997, 102, 20489–20502. [Google Scholar]
- Tao, W.; Gao, Y.; Zhang, Y. Real-time water vapor sensing/measurements with precise point positioning algorithm and canadian geodetic (GPS) network. In ION GNSS 20th ITM; 2007; pp. 2890–2897. [Google Scholar]


© 2009 by the authors; licensee Molecular Diversity Preservation International, Basel, Switzerland. This article is an open access article distributed under the terms and conditions of the Creative Commons Attribution license (http://creativecommons.org/licenses/by/3.0/).
Share and Cite
Chiang, K.-W.; Peng, W.-C.; Yeh, Y.-H.; Chen, K.-H. Study of Alternative GPS Network Meteorological Sensors in Taiwan: Case Studies of the Plum Rains and Typhoon Sinlaku. Sensors 2009, 9, 5001-5021. https://doi.org/10.3390/s90605001
Chiang K-W, Peng W-C, Yeh Y-H, Chen K-H. Study of Alternative GPS Network Meteorological Sensors in Taiwan: Case Studies of the Plum Rains and Typhoon Sinlaku. Sensors. 2009; 9(6):5001-5021. https://doi.org/10.3390/s90605001
Chicago/Turabian StyleChiang, Kai-Wei, Wei-Chih Peng, Yen-Hua Yeh, and Kwo-Hwa Chen. 2009. "Study of Alternative GPS Network Meteorological Sensors in Taiwan: Case Studies of the Plum Rains and Typhoon Sinlaku" Sensors 9, no. 6: 5001-5021. https://doi.org/10.3390/s90605001