Quantum Cascade Laser-Based Photoacoustic Sensor for Trace Detection of Formaldehyde Gas

Abstract
:1. Introduction
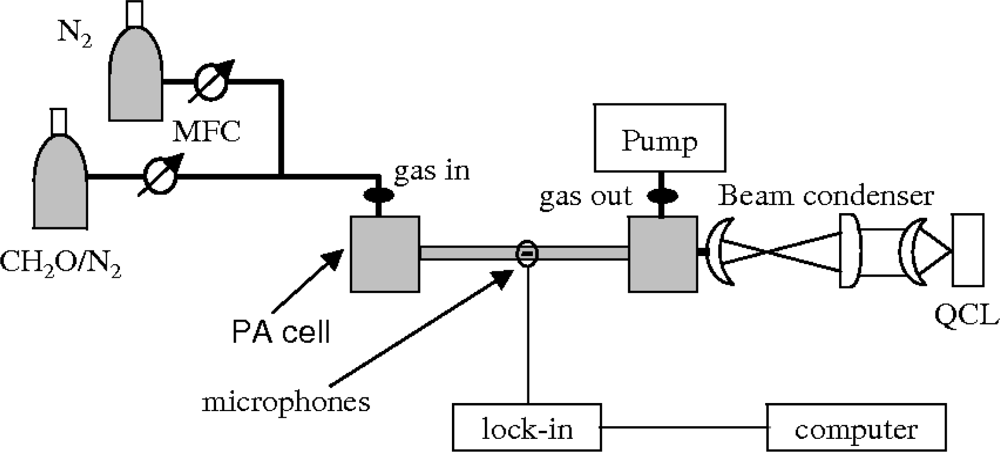
2. Experimental
3. Results and Discussion
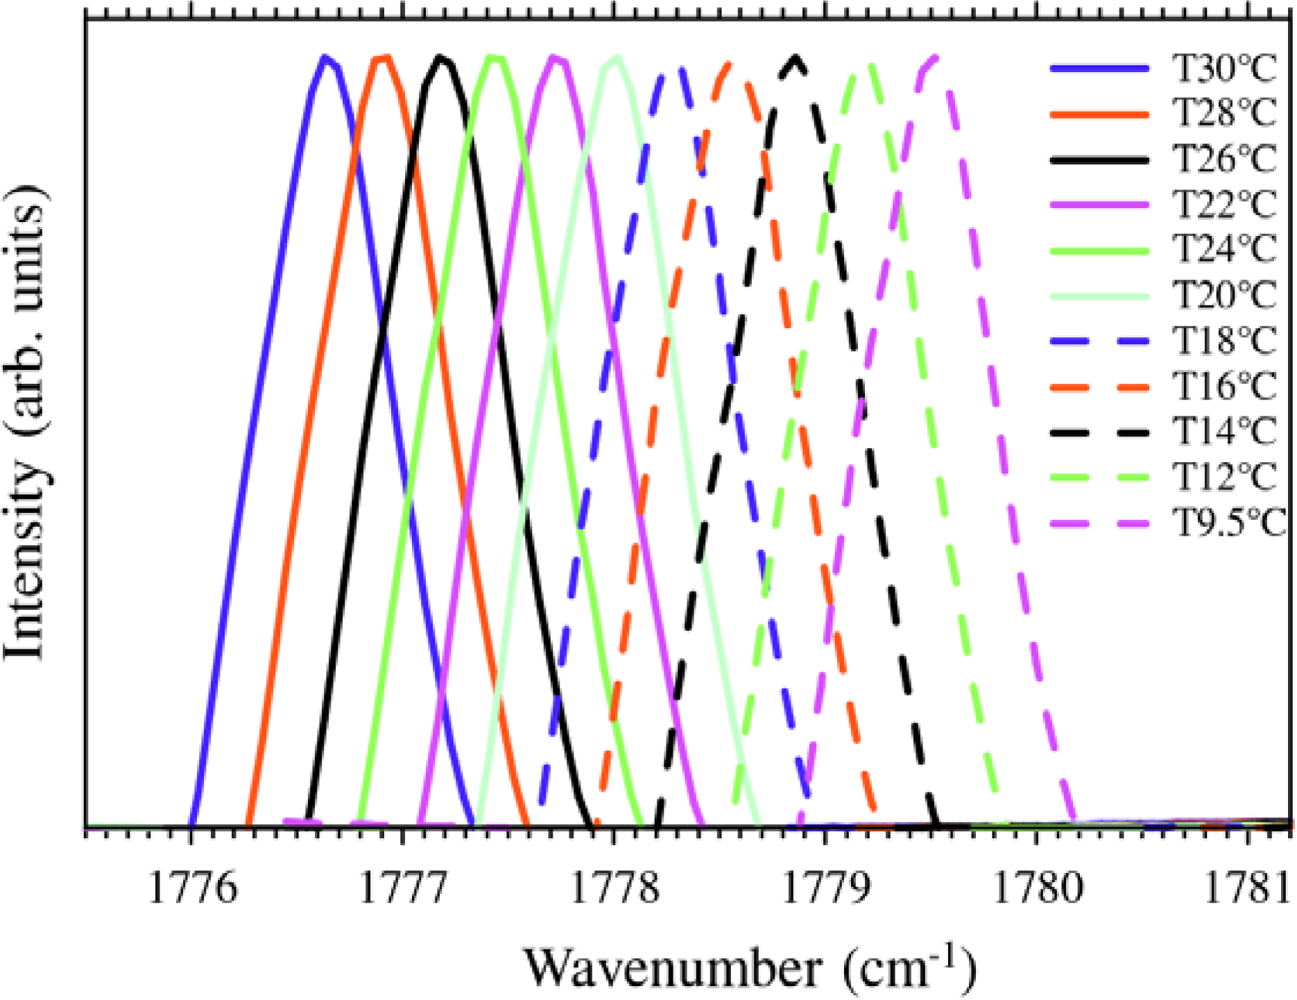
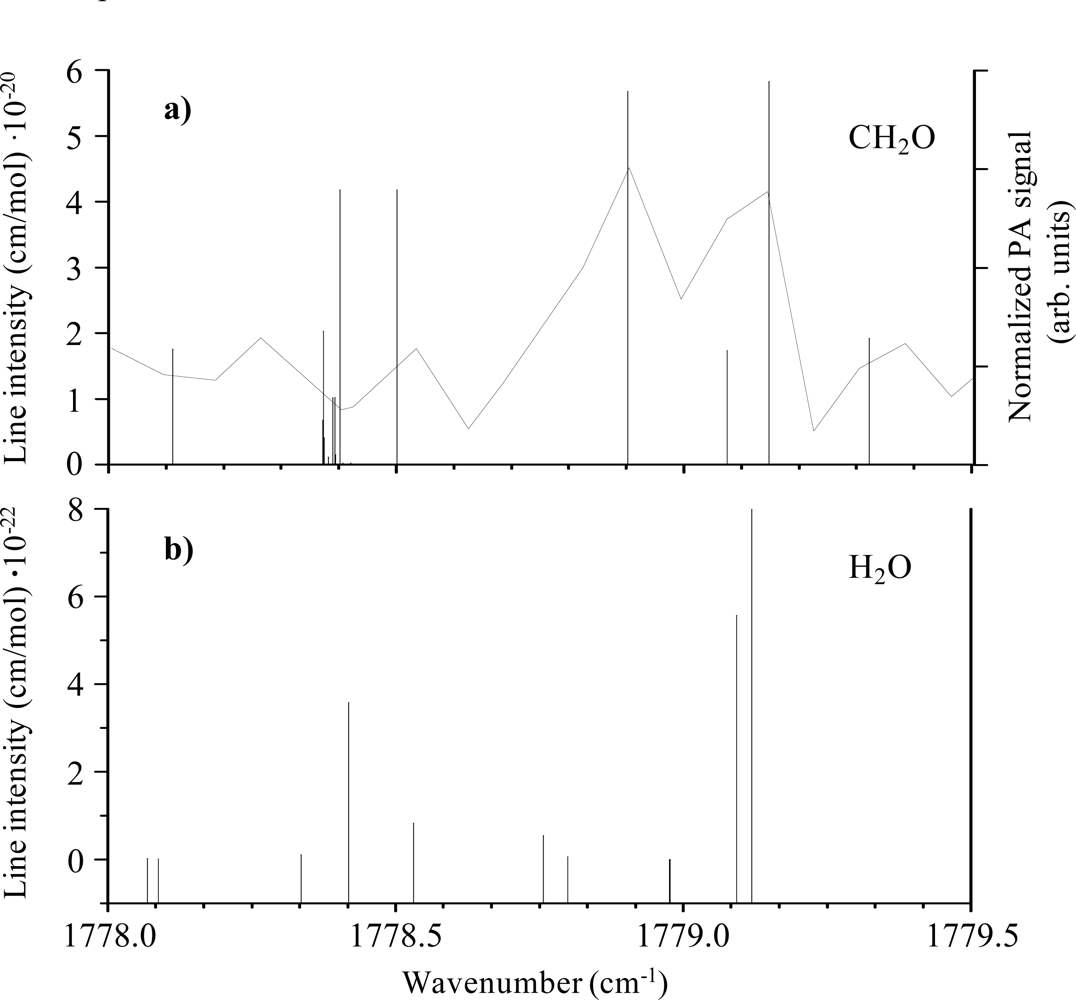
3.1. Analysis of Spectroscopic Data
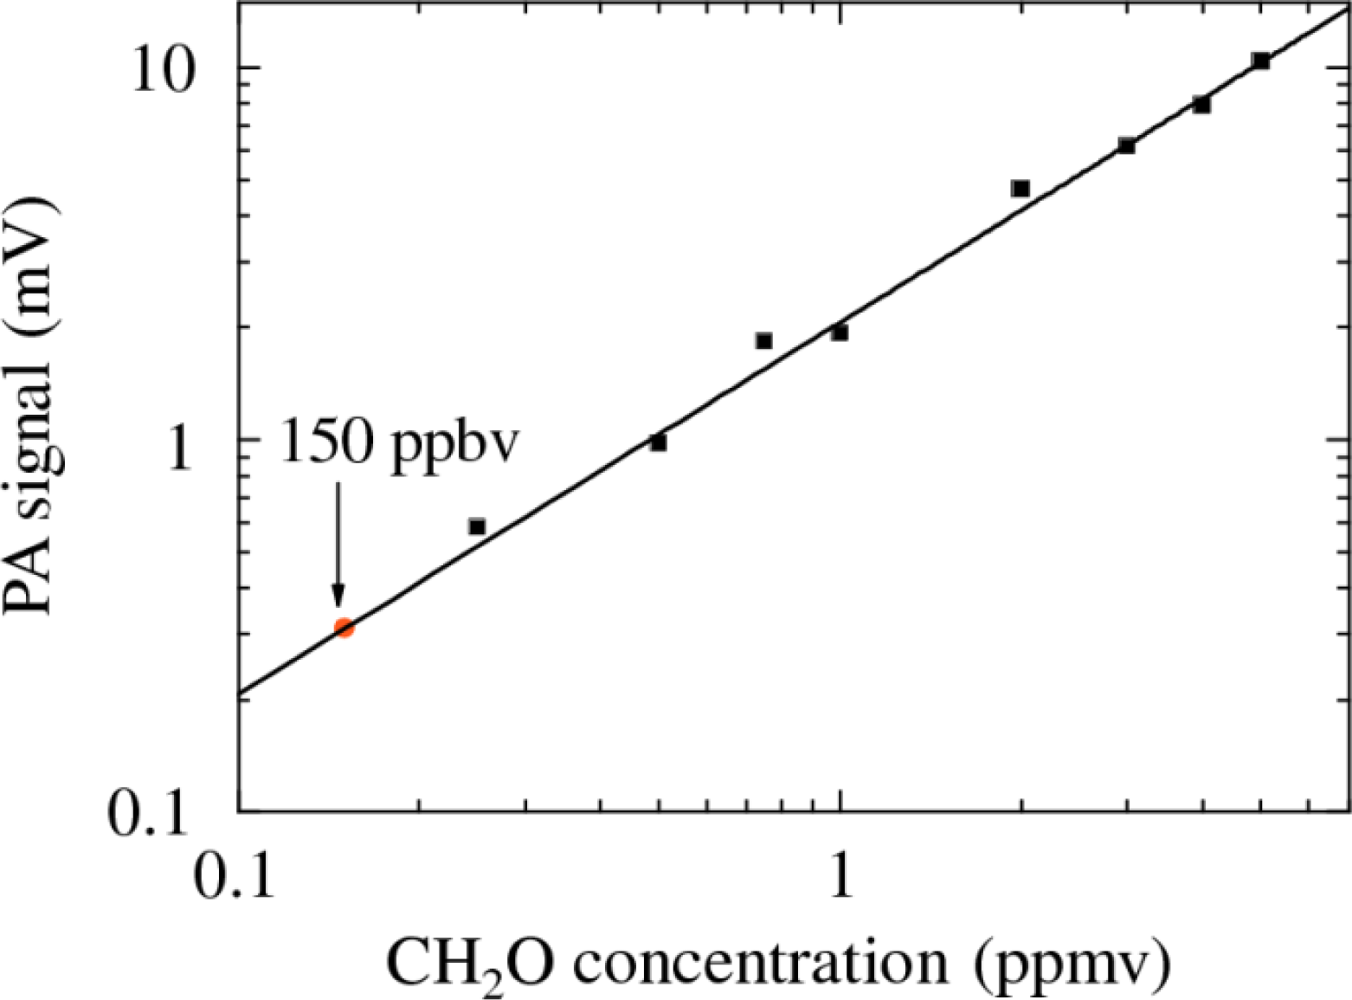
3.2. Calibration of PA sensor
4. Conclusions
Acknowledgments
References
- Adewuyi, Y.G.; Cho, S.Y.; Tsay, R.P.; Carmichael, G.R. Importance of formaldehyde in cloud chemistry. Atmos. Environ 1984, 18, 2413–2420. [Google Scholar]
- Slemr, J. Determination of volatile carbonyl compounds in clean air. Fresenius J. Anal. Chem 1991, 340, 672–677. [Google Scholar]
- Hanst, P.L.; Wong, N.W.; Bragin, J. A long path infrared study of Los Angeles smog. Atmos. Environ 1981, 16, 969–981. [Google Scholar]
- Thomas, W.; Hegels, E.; Slijkhuis, S.; Spurr, R.; Chance, K. Detection of biomass burning combustion products in Southeast Asia from backscatter data taken by the GOME spectrometer. Geophys. Res. Lett 1998, 25, 1317–1320. [Google Scholar]
- Yokelson, R.J.; Goode, J.G; Ward, D.E.; Susott, R.A.; Babbitt, R.E.; Wade, D.D.; Bertschi, I.; Griffith, D.W.T.; Hao, W.M. Emissions of formaldehyde, acetic acid, methanol, and other trace gases from biomass fires in North Carolina measured by airborne Fourier transform infrared spectroscopy. J. Geophys. Res. D 1999, 104, 30109–30125. [Google Scholar]
- Chance, K.; Palmer, P.I.; Spurr, R.J.D.; Martin, R.V.; Kurosu, T.P.; Jacob, D.J. Satellite observations of formaldehyde over North America from GOME. Geophys. Res. Lett 2000, 27, 3461–3464. [Google Scholar]
- Available online: http://www.osha.gov / SLTC/ formaldehyde /, accessed January 2009.
- Available online: http://www.epa.gov/lawsregs/, accessed January 2009.
- Available online: http:/www.epa.gov/osw/hazard/testmethods/sw846, accessed January 2009.
- NIOSH Manual of Analytical methods, 4th Ed; Eller, P.M.; Cassinelli, M.E. (Eds.) U.S. Department of Health and Human Services: Washington, D.C, USA, August 1994; No. 94–113,; pp. 131–155.
- Herndon, S.C.; Zahniser, M.S.; Nelson, D.D., Jr.; Shorter, J.; McManus, J.B.; Jiménez, R.; Warneke, C.; de Gouw, J.A. Airborne measurements of HCHO and HCOOH during the New England Air Quality Study 2004 using a pulsed quantum cascade laser spectrometer. J. Geophys. Res 2007, 112, D10S03–D10115. [Google Scholar]
- Dahnke, K.; Von Basum, G.; Kleinermanns, K.; Hering, P.; Mürtz, M. Rapid formaldehyde monitoring in ambient air by means of mid-infrared cavity leak-out spectroscopy. Appl. Phys. B 2002, 75, 311–316. [Google Scholar]
- Bai, Y.; Darvish, S.R.; Slivken, S.; Zhang, W.; Evans, A.; Nguyen, J.; Razeghi, M. Room temperature continuous wave operation of quantum cascade lasers with watt-level optical power. Appl. Phys. Lett 2008, 92, 1011051–1011053. [Google Scholar]
- Kosterev, A.A.; Tittel, F. Chemical sensors based on quantum cascade lasers. IEEE J. Quantum Electron 2002, 38, 582–591. [Google Scholar]
- Lima, J.P.; Vargas, H.; Miklos, A.; Angelmahr, M.; Hess, P. Photoacoustic detection of NO2 and N2O using quantum cascade lasers. Appl. Phys. B 2006, 85, 279–284. [Google Scholar]
- Elia, A.; Lugarà, P.M.; Giancaspro, C. Photoacoustic detection of nitric oxide by use of a quantum cascade laser. Opt. Lett 2005, 30, 988–990. [Google Scholar]
- Perrin, A.; Keller, F.; Flaud, J.M. New analysis of the v2, v3, v4, and v6 bands of formaldehyde H2CO line positions and intensities in the 5 – 10 μm spectral region. J. Mol. Spectrosc 2003, 221, 192–198. [Google Scholar]
- Perrin, A.; Jacquemart, D.; Tchana, F.K.; Lacome, N. Absolute line intensities measurements and calculations for the 5.7 and 3.6 μm bands of formaldehyde. JQSRT 2009. [Google Scholar] [CrossRef]
- Available online: http://www.hitran.com, accessed January 2009.
- Horstjann, M.; Bakhirkin, Y.A.; Kosterev, A.A.; Curl, R.F.; Tittel, F.K.; Wong, C.M.; Hill, C.J.; Yang, R.Q. Formaldehyde sensor using interband cascade laser based quartz-enhanced photoacoustic spectroscopy. Appl. Phys. B 2004, 79, 799–803. [Google Scholar]
- Angelmahar, M.; Miklos, A.; Hess, P. Photoacoustic spectroscopy of formaldehyde with tunable laser radiation at the parts per billion level. Appl. Phys. B 2006, 85, 285–288. [Google Scholar]

| PA sensor performance | ||
|---|---|---|
| CH2O | NO | |
| P0 (mW) | 4 | 2 |
| Sm (mV/Pa) | 20 | 20 |
| τint (s) | 10 | 10 |
| αmin (cm−1) | 6.6 × 10⁻⁷ | 1.3 × 10⁻⁷ |
| D (W·cm−1Hz−1/2) | 2.0 × 10⁻⁸ | 2.0 × 10⁻⁹ |
| Detection limit (ppbv) | 150 | 150 |
© 2009 by the authors; licensee MDPI, Basel, Switzerland This article is an open access article distributed under the terms and conditions of the Creative Commons Attribution license (http://creativecommons.org/licenses/by/3.0/).
Share and Cite
Elia, A.; Di Franco, C.; Spagnolo, V.; Lugarà, P.M.; Scamarcio, G. Quantum Cascade Laser-Based Photoacoustic Sensor for Trace Detection of Formaldehyde Gas. Sensors 2009, 9, 2697-2705. https://doi.org/10.3390/s90402697
Elia A, Di Franco C, Spagnolo V, Lugarà PM, Scamarcio G. Quantum Cascade Laser-Based Photoacoustic Sensor for Trace Detection of Formaldehyde Gas. Sensors. 2009; 9(4):2697-2705. https://doi.org/10.3390/s90402697
Chicago/Turabian StyleElia, Angela, Cinzia Di Franco, Vincenzo Spagnolo, Pietro Mario Lugarà, and Gaetano Scamarcio. 2009. "Quantum Cascade Laser-Based Photoacoustic Sensor for Trace Detection of Formaldehyde Gas" Sensors 9, no. 4: 2697-2705. https://doi.org/10.3390/s90402697