3.1. Effects of DEM Resolution on Topographic Correction
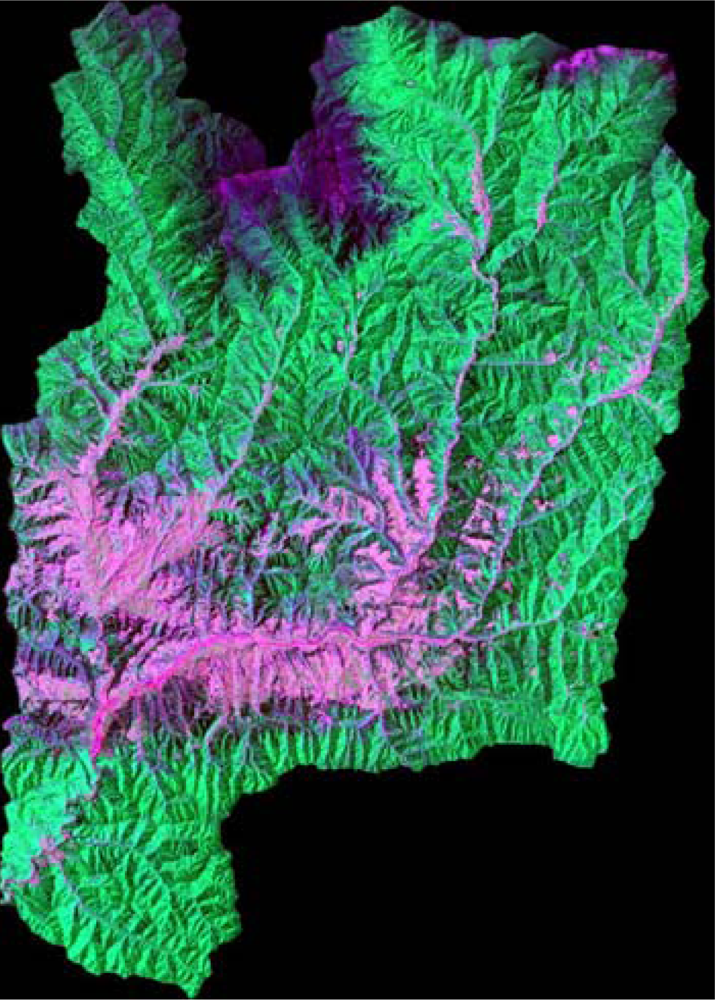
Figure 2 shows the false color composite image (ETM+ 5-4-3) before topographic correction, from which we can find that serious topographic effects appears on the image: the radiance in shaded areas show less than in sunny areas.
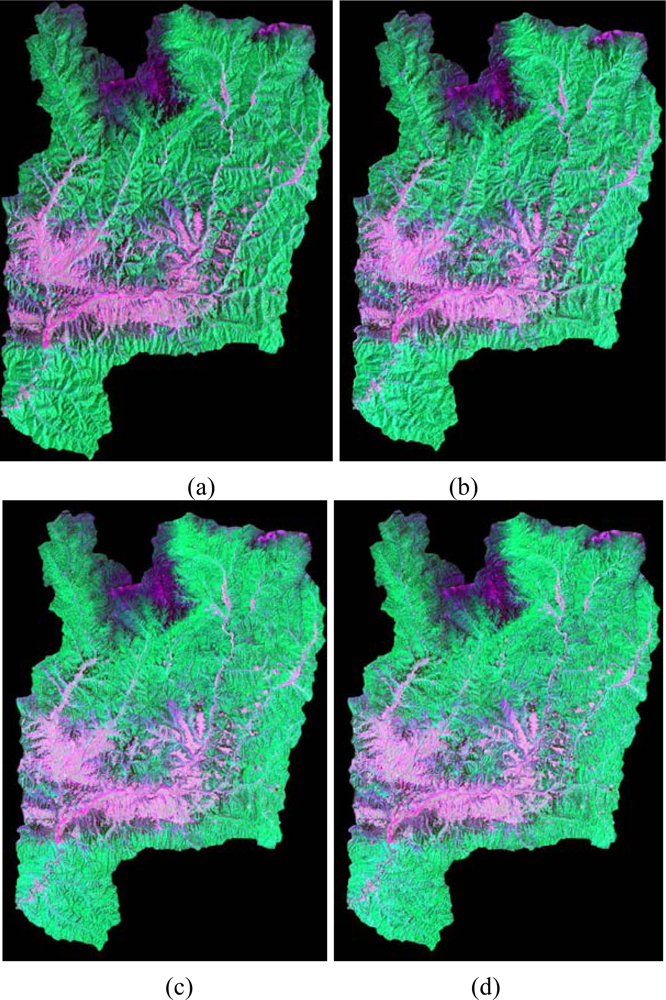
Figures 3 (a)–(d) show the false color composite images (ETM+ 5-4-3) of the Yangjia river watershed after SCS and Minnaert correction under the support of different resolution DEMs, respectively.
Figures 3(a) and (c) are based on SRTM DEM and
Figures 3 (b) and (d) are based on DEM constructed from 1:50,000 scale topographic map.
In order to evaluate the performance of the topographic correction, statistical analyses were applied on the topographically corrected images. According to Reeder [
10], successful topographic correction should remove or greatly reduce significant correlation of surface radiance with topographic variables, especially direct irradiance. We firstly depicted the scatter plots of reflectance
ρ versus cos
i, then the fitting lines were regressed linearly, and the slope
m and correlation coefficient
r of the linear regression equation were calculated and listed in
Table 3.
Strong correlations can be found between the surface reflectance ρ and topographic variable cosi over the rugged terrain before correction. However, after topographic corrections with different resolution DEMs, both the slope m and correlation coefficient r were greatly reduced. It was noted that some of the slope m and correlation coefficients r are negative after SCS correction based on the two different DEMs. It indicates that the SCS algorithm has overcorrected the image. For the Minnaert correction, the m and r reduced dramatically compared with those before correction and they all are positive, which implies that none overcorrection existed for the Minnaert corrected images.
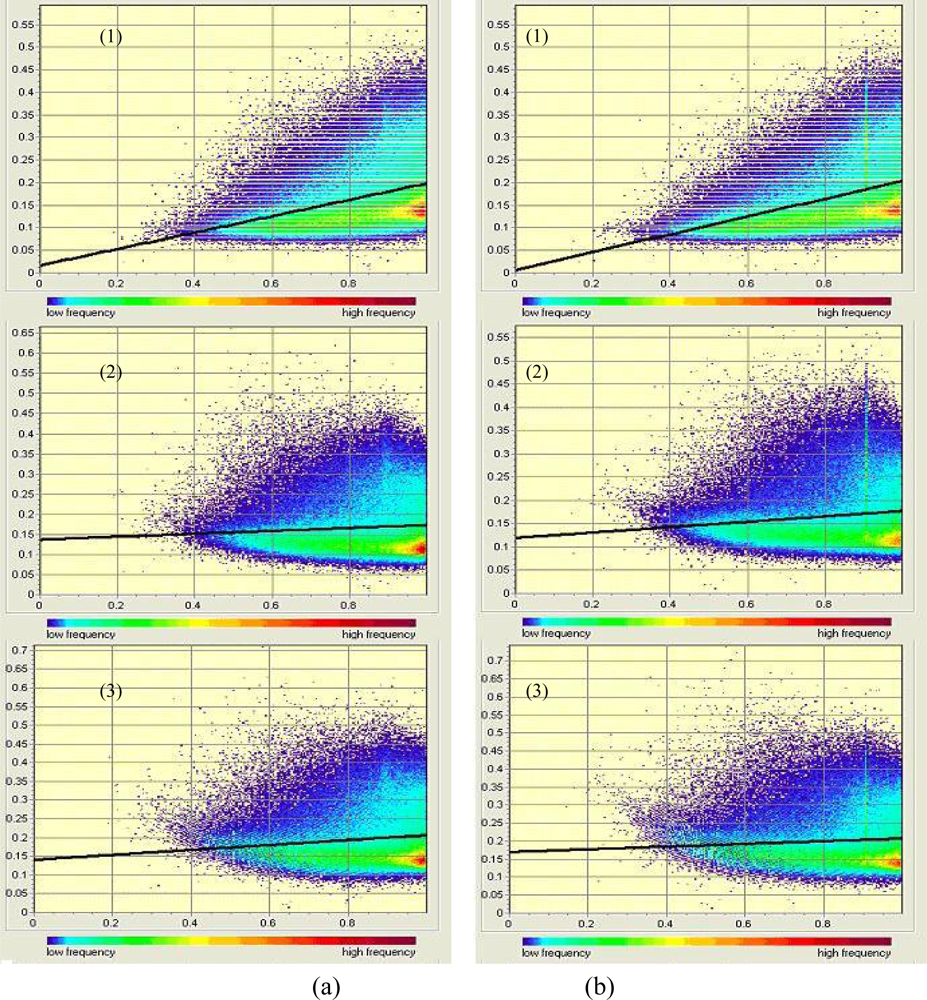
As an example,
Figure 4 exhibits scatter plots and the linear regression fitting lines of reflectance
ρ versus cos
i for ETM+ band 1 before and after correction. It can be found that both the scatter plots and linear fitting lines after correction show almost horizontal distribution, which indicates that both the SCS and the Minnaert corrections yielded satisfactory results. Either based on the SRTM DEM or based the DEM constructed from 1:50,000 scale topographic map, both the SCS and the Minnaert correction model performed excellently in removing significant correlation between reflectance
ρ and cos
i for each band of Landsat-7 ETM+ image of the study site. From this study, we can find that based on these two different resolution DEMs with the same topographic correction method, the similar good performance of topographic correction can be obtained, which is consistent with the visual analysis concluded.
Following
equation (6), the relative correction extent for each band of the Landsat-7 ETM+ image before and after the correction was calculated and listed in
Table 4. It can be found that the absolute values for each band of the image after Minnaert correction based on the DEM constructed from 1:50,000 topographic map are less than those based on the SRTM DEM. It indicates that the Minnaert correction based on the DEM constructed from 1:50,000 topographic map performed more excellently than that based on the SRTM DEM in removing significant correlation between reflectance
ρ and topographic variable cos
i for each band of Landsat-7 ETM+ image. However, for SCS correction based on SRTM DEM, the absolute values for each band of the image, except bands 2 and 7, are bigger than that based on the DEM constructed from1:50,000 scale topographic map in various extent, which suggests that the SCS correction based on the SRTM DEM performed more excellently than that based on the DEM constructed from 1:50,000 topographic map in removing significant correlation between reflectance
ρ and topographic variable cos
i for each band of the Landsat-7 ETM+ image.
In order to further examine the accuracy of the topographic corrections statistically, the DI representing the quotient of standard deviations and mean of the study site for each band of the Landsat-7 ETM+ image before and after the corrections were calculated and listed in
Table 5 for investigating spatial dispersion of spectral response of images before and after correction based on different DEM with different models.
From
Table 5, we can see that the DI for each band of the images before topographic correction is relatively larger than that after topographic correction due to the serious topographic effects, except bands 3, 7 corrected by SCS model based on the SRTM DEM and band 3 corrected by SCS model based on the DEM constructed by 1:50,000 scale topographic map, which implies that based on the two different DEMs both SCS and Minnaert correction models are capable of removing topographic effect while improving overall quality of the image.
It was worthwhile to note that the DI values increase in order as the image after correction based on the DEM constructed from 1:50,000 scale topographic map, after correction based on the SRTM DEM and before correction with the same model, respectively. This implies that based on the DEM constructed from 1:50,000 scale topographic map the same correction model performed better than that based on the SRTM DEM.
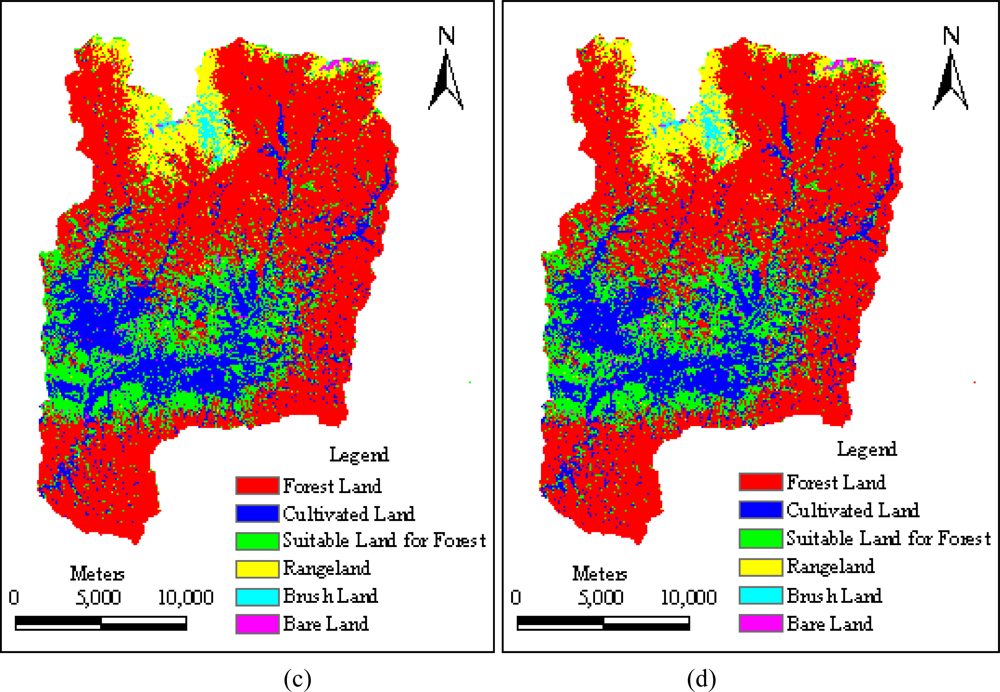
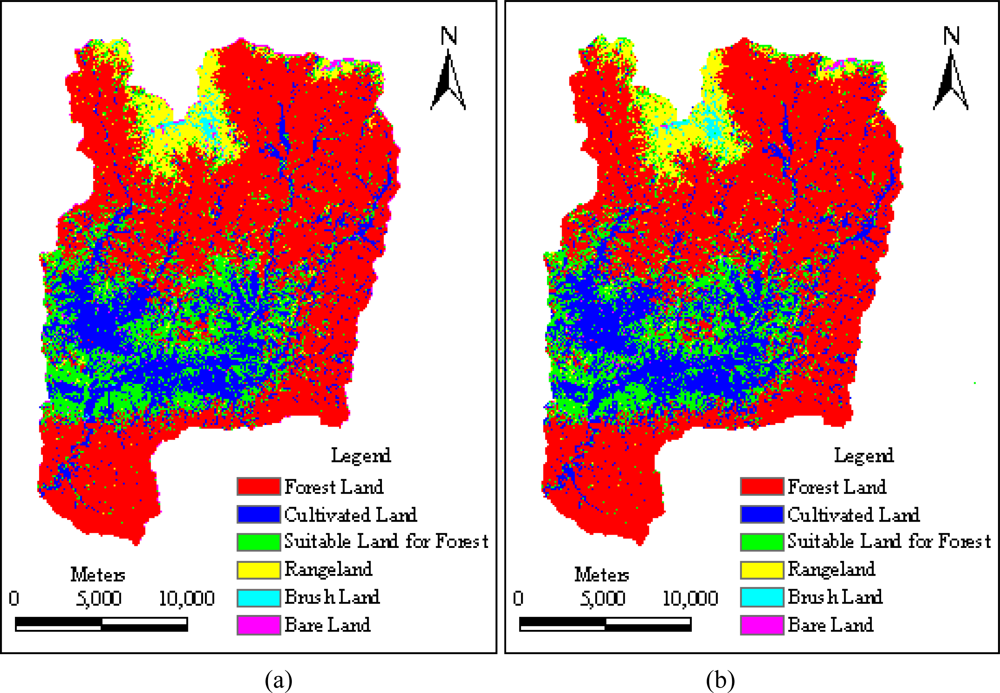
3.2. Resolution Effects on Results of LULC Classification
In order to analyze the difference among the LULC classification results obtained from different correction methods and DEM resolutions, the classified images based only on spectral bands for the four different schemes were compared.
Figure 5 presents the classification results obtained with those previously described four schemes. Visual comparison suggested that the four schemes successfully yielded quite similar classification results as shown in
Figure 5.
Statistical method was adopted to further compare the classification performance of the four schemes. Overall classification accuracy and Kappa value that are widely used in accuracy assessment of LULC classification were computed and listed in
Table 6. Closed overall classification accuracies and Kappa values derived from the four different classification schemes demonstrated that quantitative assessments agree with the visual assessments on classification accuracies of the image. Among four classification results, classification accuracies were found the lowest for the image performed by scheme 1 and highest for the image performed by scheme 3.
From
Table 6, it also can be found that scheme 2 had a better classification performance with an overall accuracy of only 1.09% and Kappa value of only 0.01 higher than that of scheme 1, which implies that based on the DEM constructed from 1:50,000 scale topographic map the SCS correction can only improve the classification result slightly compared with that based on the SRTM DEM. However, it was beyond our expectation that scheme 4 had a worse classification performance with an overall accuracy of only 0.01% lower than that of scheme 3. It indicates that the classified image after Minnaert correction based on the SRTM DEM has better classification performance than that based on the DEM constructed from 1:50,000 scale topographic map.


