Article

An Electrochemical Detection of Metallothioneins at the Zeptomole Level in Nanolitre Volumes

1
Department of Chemistry and Biochemistry Faculty of Agronomy, Mendel University of Agriculture and Forestry, Zemedelska 1, CZ-613 00 Brno, Czech Republic
2
Department of Animal Nutrition and Forage Production, Faculty of Agronomy, Mendel University of Agriculture and Forestry, Zemedelska 1, CZ-613 00 Brno, Czech Republic
3
Department of Chemistry Faculty of Science, Masaryk University, Kotlarska 2, CZ-611 37 Brno, Czech Republic
4
Department of Chemistry, Faculty of Science, Masaryk University, Kotlarska 2, CZ-611 37 Brno, Czech Republic
*
Author to whom correspondence should be addressed.
Sensors 2008, 8(4), 2293-2305; https://doi.org/10.3390/s8042293
Submission received: 15 March 2008 / Accepted: 26 March 2008 / Published: 1 April 2008

Abstract

:
We report on improvement of the adsorptive transfer stripping technique (AdTS) coupled with the differential pulse voltammetry Brdicka reaction to determine a thiol-protein. The current technique has been unable to generate reproducible results when analyzing very low sample volumes (nanolitres). This obstacle can be overcome technically by modifying the current transfer technique including cooling step of the adsorbed analyte. We tested the technique on determination of a promising tumour disease marker protein called metallothionein (MT). The detection limit (3 S/N) of MT was evaluated as 500 zeptomoles per 500 nL (1 pM) and the quantification limit (10 S/N) as 1,500 zeptomoles per 500 nL (3 pM). Further, the improved AdTS technique was utilized to analyze blood serum samples from patients with breast cancer. Based on the results obtained it can be concluded that the improved technique can be used to detect a thiol-protein in very low sample volumes and can also prevent interferences during the washing and transferring step.

1. Introduction

Thiols play a significant role in a number of biological activities; however, many of their functions still remain unclear. Their involvement with regulating reactive oxygen species and metal ions, as well as in transcription and translation have been and continue to be studied extensively. They could also serve as markers for many health problems [1,2]. Metallothioneins (MT) are a group of proteins rich in cysteine with molecular weights ranging from 6 to 10 kDa [3-5]. These proteins' main physiological role is to maintain heavy metal ion homeostasis. MT's biological function is possibly associated with their overexpression in patients with a tumour disease [6-9]. Several papers have discussed and investigated the detection of metallothioneins using different methods [10-18]. These approaches utilized capillary electrophoresis, liquid chromatography mass spectrometry, inductive coupled plasma mass spectrometry, immunoassays and electrochemistry. Electrochemical techniques represent an alternative to hyphenated and high cost techniques due to their sensitivity and low cost [17,18]. The aim of this paper is to improve the current adsorptive transfer stripping technique (AdTS) to analyze MT in volumes down to nanolitres.

2. Experimental

2.1 Chemicals, pH measurements and pipetting

Rabbit liver MT (MW 7143), containing 5.9 % Cd and 0.5 % Zn, were purchased from Sigma Aldrich (St. Louis, USA). Tris(2-carboxyethyl)phosphine (TCEP) was prepared by Molecular Probes (Eugene, Oregon, USA). 10 μg/mL MT stock standard solutions were prepared with ACS grade water (Sigma-Aldrich, USA) and stored in the dark at –20 °C. Working standard solutions were prepared daily by dilution of the stock solutions. The pH value was measured using WTW inoLab Level 3 (Weilheim, Germany), connected to a computer and controlled by MultiLab Pilot software (Weilheim, Germany). The pH-electrode (SenTix-H, pH 0–14/3M KCl) was regularly calibrated by a set of WTW buffers (pH 4.01, 7.00 and 10.00) (Weilheim, Germany). To pipette volumes down to micro and nanolitres, pipettes used were purchased from Eppendorf Research (Eppendorf, Germany) with the highest certified deviation (±12 %).

2.2 Electrochemical measurements

Electrochemical measurements were performed with an AUTOLAB Analyser (EcoChemie, Netherlands) connected to a VA-Stand 663 (Metrohm, Switzerland), using a standard cell and three electrodes. The working electrode was a hanging mercury drop electrode (HMDE). The reference electrode was a Ag/AgCl/3M KCl electrode and a glassy carbon electrode was used as the auxiliary electrode. Smoothing and baseline correction was employed by GPES 4.4 software supplied by EcoChemie.

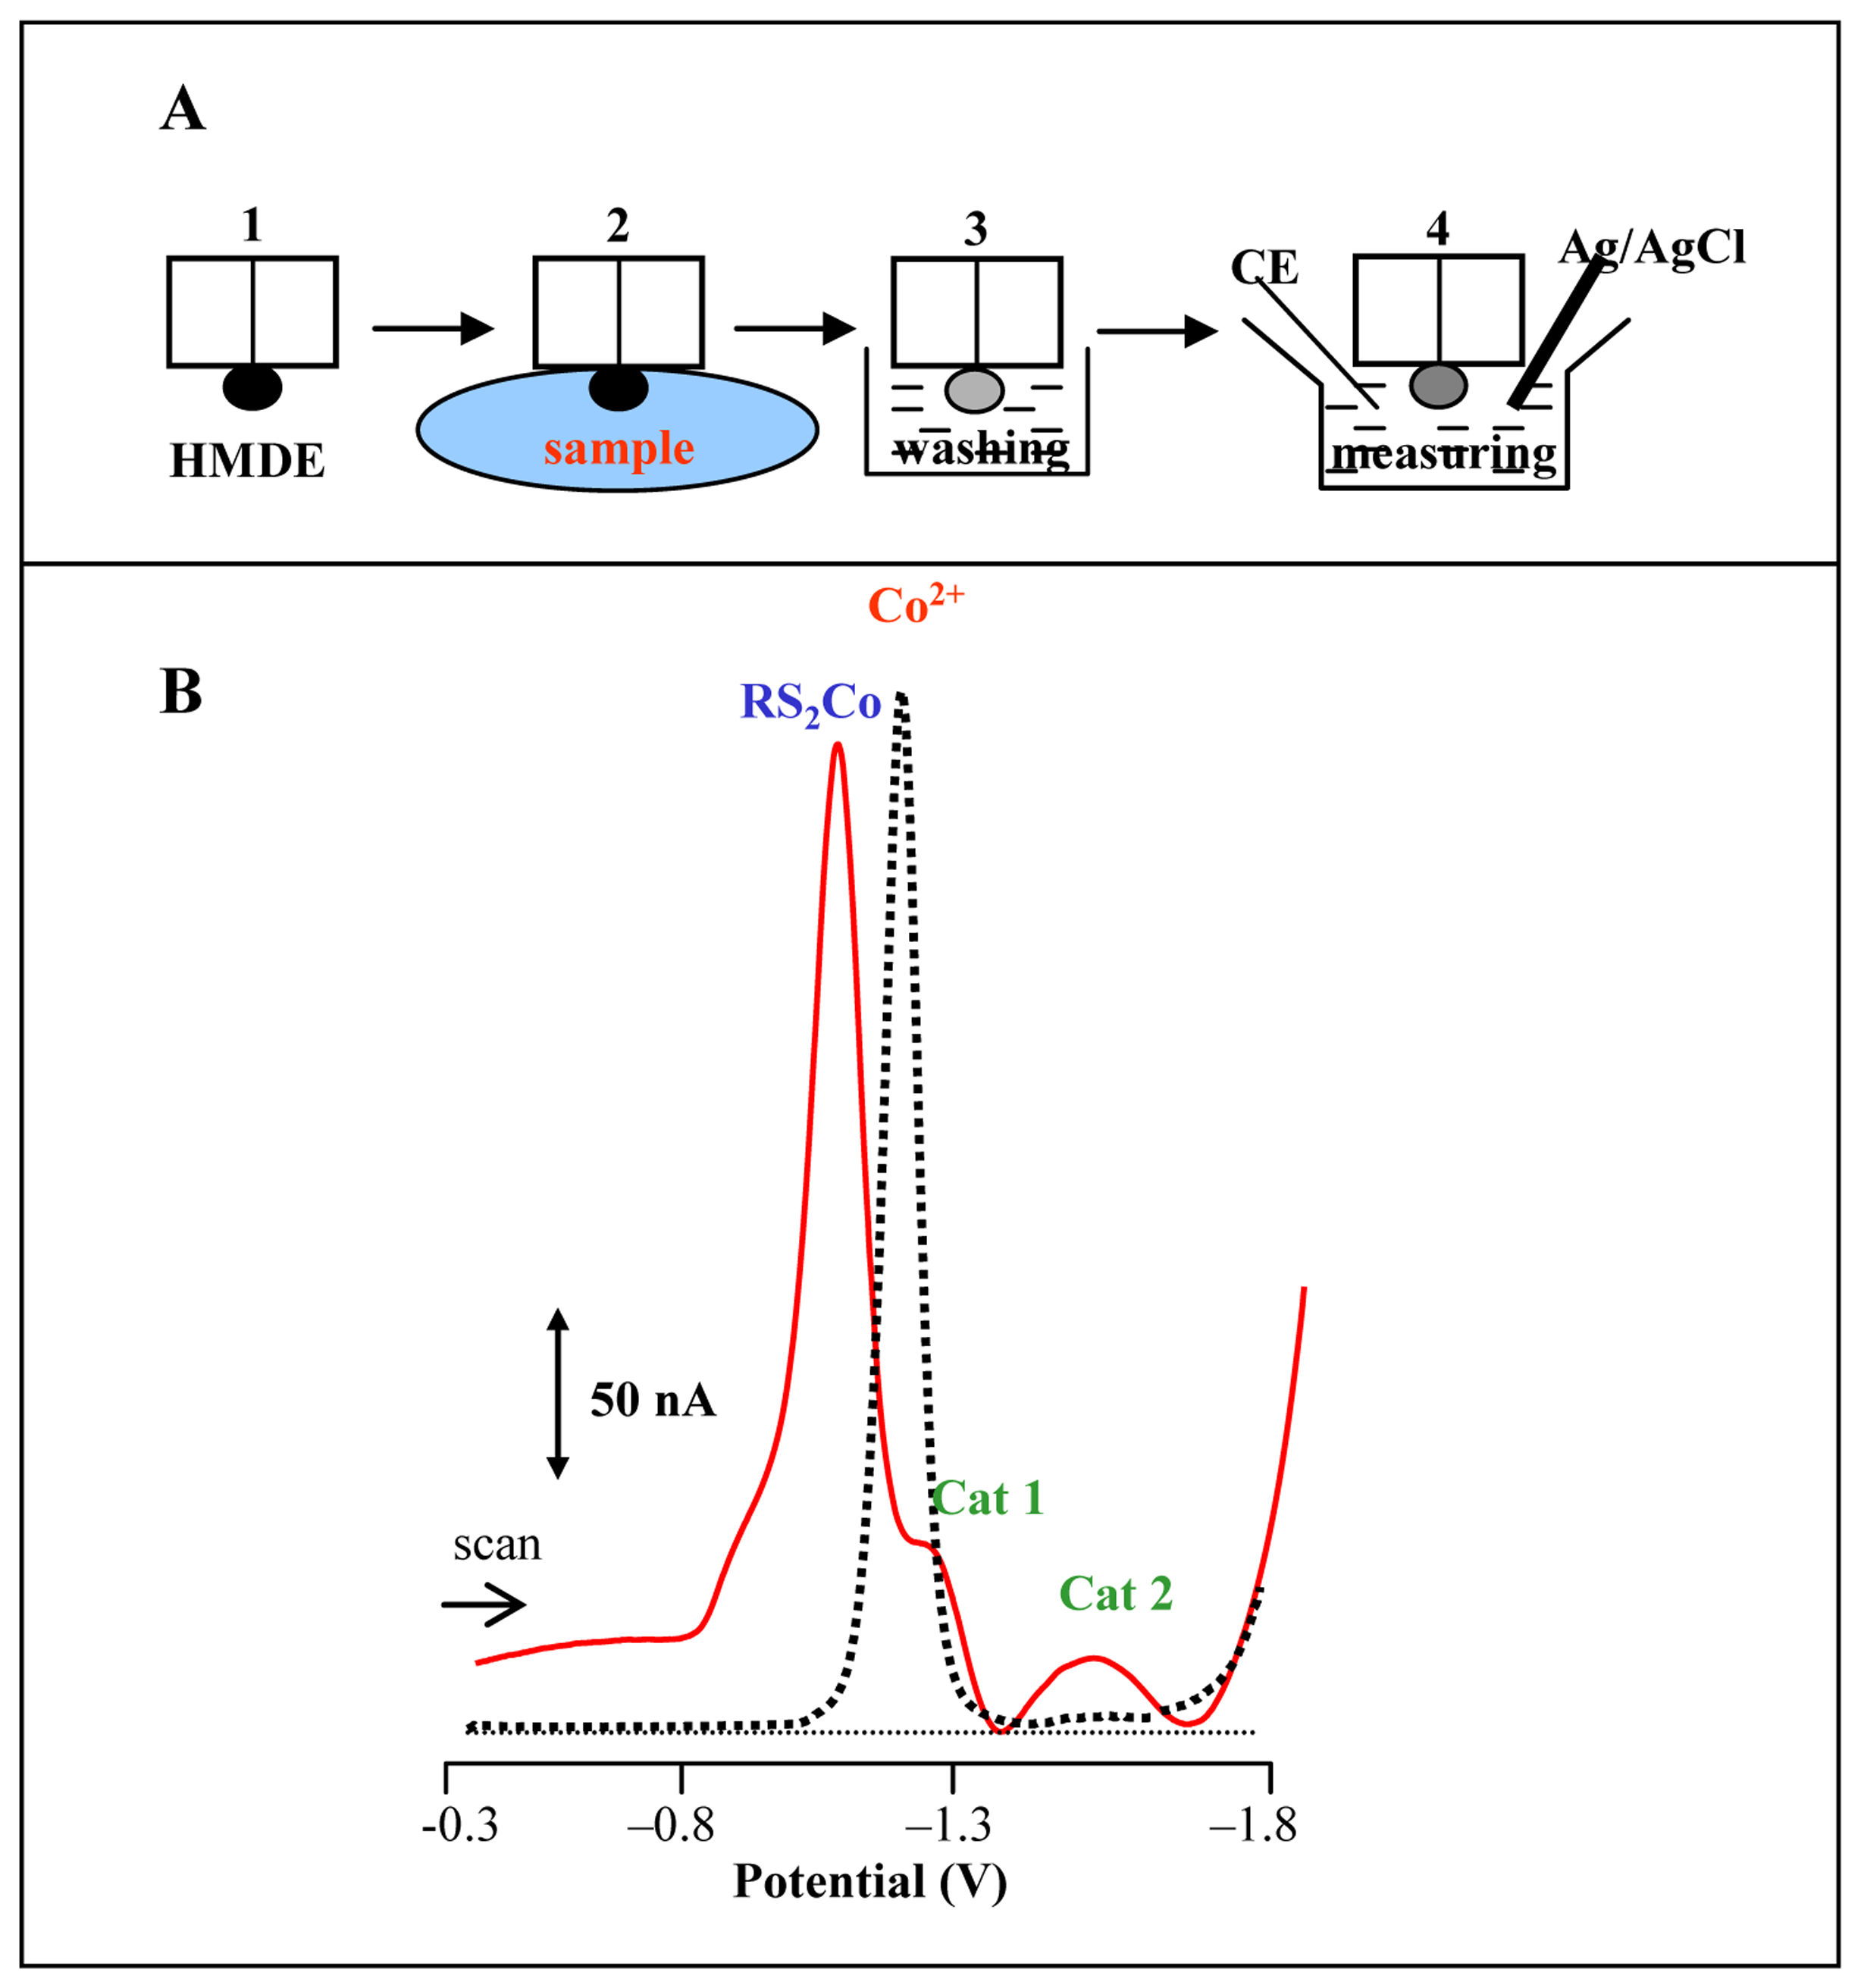
Adsorptive transfer stripping technique

The principle of the adsorptive transfer stripping technique is based on the strong adsorption of the target molecule on the surface of the working electrode at an open circuit (Fig. 1A). The hanging mercury drop electrode is periodically renewed (Figure 1A1). Target molecules are adsorbed on the surface of the renewed working electrode at an open circuit (Figure 1A2). The electrode is washed with a supporting electrolyte (Figure 1A3). The electrode with the adsorbed target molecules is measured in the presence of the supporting electrolyte (Figure 1A4).

Brdicka reaction of MT

MT was measured by AdTS coupled with a differential pulse voltammetry (DPV) Brdicka reaction. Brdicka supporting electrolyte (1 mM Co(NH3)6Cl3 and 1 M ammonia buffer (NH3(aq) + NH4Cl, pH = 9.6) was used without surface-active agent additives. AdTS DPV Brdicka reaction parameters were as follows: an initial potential of –0.35 V, an end potential of –1.8 V, a modulation time of 0.057 s, a time interval of 0.2 s, a step potential of 1.05 mV, a modulation amplitude of 250 mV, Eads = 0 V. Temperature of supporting electrolyte was 4 °C.

2.3 Clinical material

Human blood serum samples from patients with breast cancer were obtained from the Department of Clinical Biochemistry and Pathobiochemistry, FN Motol, Prague, Czech Republic. The sampled sera were immediately frozen at –20 °C prior to their preparation. The sample was prepared by heat treatment followed by solvent precipitation. The samples were kept at 99 °C in a thermomixer (Eppendorf 5430, USA) for 15 min. with occasional stirring, and then cooled to 4 °C. The denatured homogenates were centrifuged at 4 °C, 15,000 g for 30 min. (Eppendorf 5402, USA). Heat treatment and solvent precipitation effectively denatured and removed high molecular weight proteins from the samples [19]. MT levels in the human blood serum samples were measured by AdTS DPV Brdicka reaction.

2.4 Descriptive statistics

Microsoft Excel® (USA) was used for mathematical analyses. Results are expressed as mean ± S.D. unless noted otherwise. The detection limits (3 S/N) were calculated according to Long [20], whereas N was expressed as standard deviation of noise determined in the signal domain.

3. Results and Discussion

Proteomic research demands highly sensitive analytical instruments to detect very low volumes or amounts of a biological sample. Analysis is preferably carried out on the instruments to be low cost and easy to use, and, moreover, there is great demand on miniaturization of the instruments used [21-36]. The impact of these demands is well demonstrated in the field of flow microchips technology [37-52]. Electrochemical devices, methods and approaches have a valuable contribution to this field. In particular, the introduction of adsorptive transfer technique by Prof. Palecek was a great advancement in the electroanalysis of low volume samples [52-58].

3.1 Utilizing of adsorptive transfer technique for analysis of MT

The AdTS technique coupled with the DPV Brdicka reaction can be used to detect metallothionein in low sample volumes and can also prevent interferences during the washing and transferring step (Figure 1A, B). The technique, however, has its limitations. This technique currently is unable to generate reproducible results when analyzing very low sample volumes. We attempted to investigate how changes in drop volume and area of the working electrode influence the repeatability and sensitivity of the measurements. Study of MT (100 μM) drop volumes of 2.5, 5.0, 10 and 15 μL by AdTS DPV Brdicka reaction at HMDE with a drop area of 400 μm2, resulted in well developed and reproducible Brdicka catalytic signals of 1.5, 3.0, 6.2 and 9.2 ng of MT, respectively (Figure 2Aa). The height of the Cat2 signal was nearly proportional to MT content with a R2 value of 0.9816. The measurements were repeated five times and relative standard deviation of Cat2 peak height did not exceed 5 %.
MT measurements (100 nM) with drop volumes of 0.5, 1.0, 1.5, 2.5 and 5.0 μL could be carried out using HMDE with a drop area of 250 μm2. The Brdicka catalytic peaks were well apparent in the measured voltammograms, whereas Cat2 peaks were sufficiently detected even at low MT amounts of 0.3, 0.6, 0.9, 1.5 and 3.0 ng (Figure 2Ba). However, relative standard deviation (R.S.D., %) increased significantly with decreasing drop volume. The R.S.D. measurements of MT in 2.5, 1.5, 1.0 and 0.5 μL were 4 %, 8 %, 15 % and 40 %, respectively. Enhanced Cat2 peak height was observed with increasing R.S.D. The Cat2 peak measured after adsorption of MT from drop of 500 nL was five times higher compared to that measured after adsorption of MT from drop of 2,500 nL. The enhanced Cat2 peak height was almost proportional to the decrease in drop volume (Figure 2Ba). This phenomenon is possibly due to water evaporation from a drop of MT standard solution. Due to this phenomenon, MT concentration increased and a higher peak was observed. Based on the results obtained, this approach cannot be used for quantitative determination of proteins in very low sample volumes at room temperature.

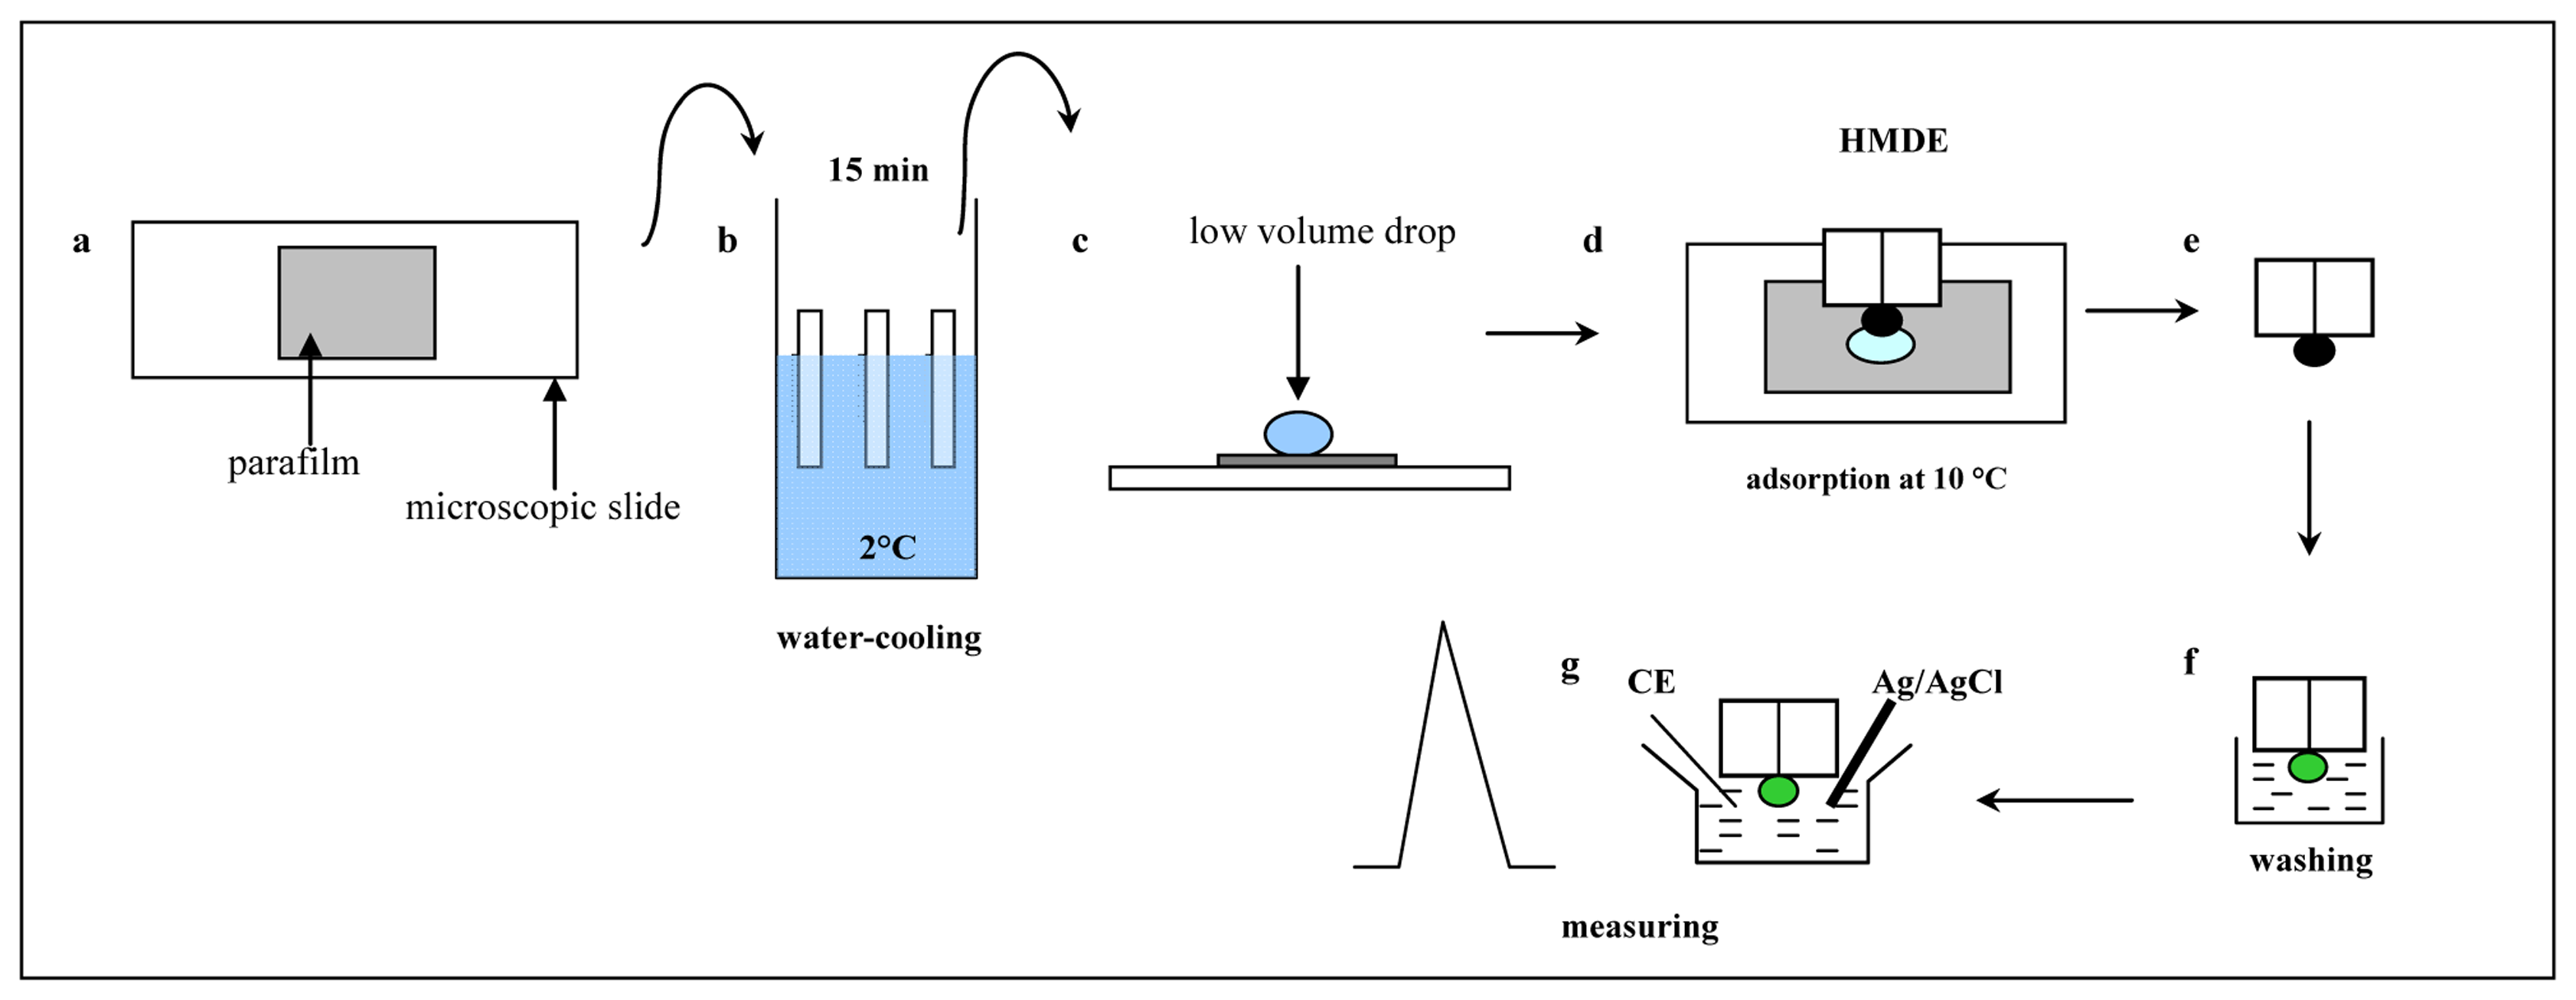
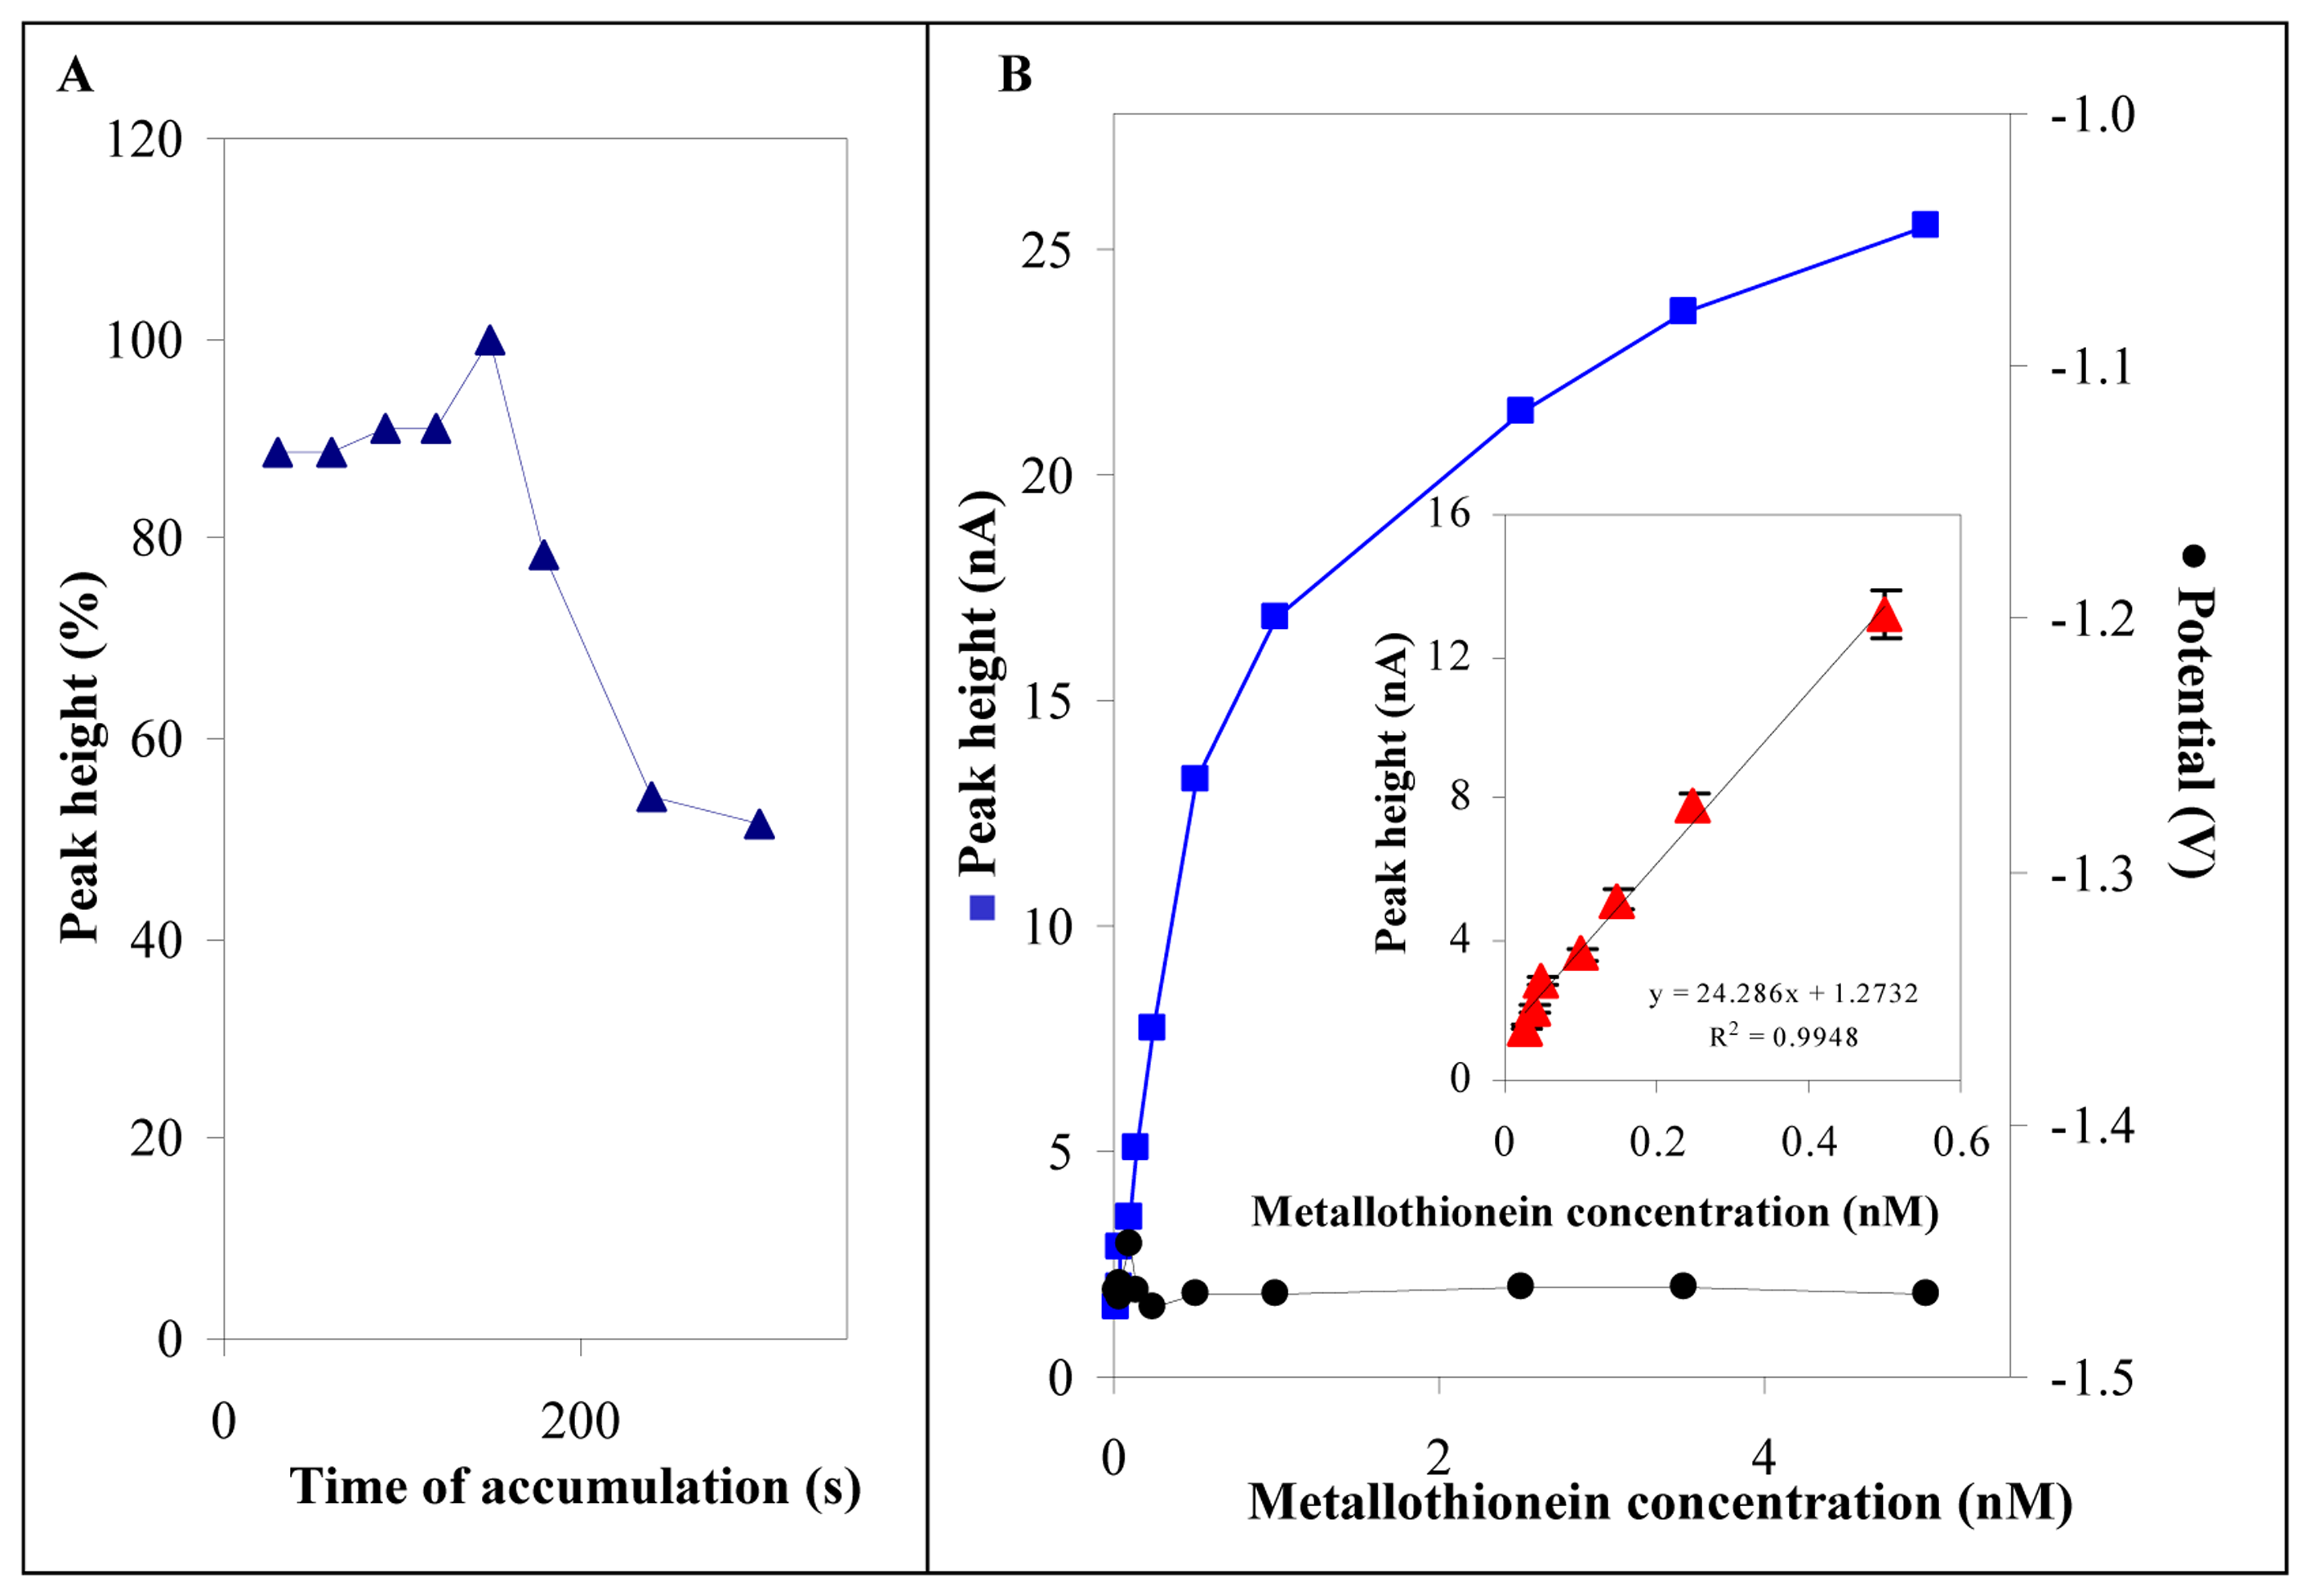
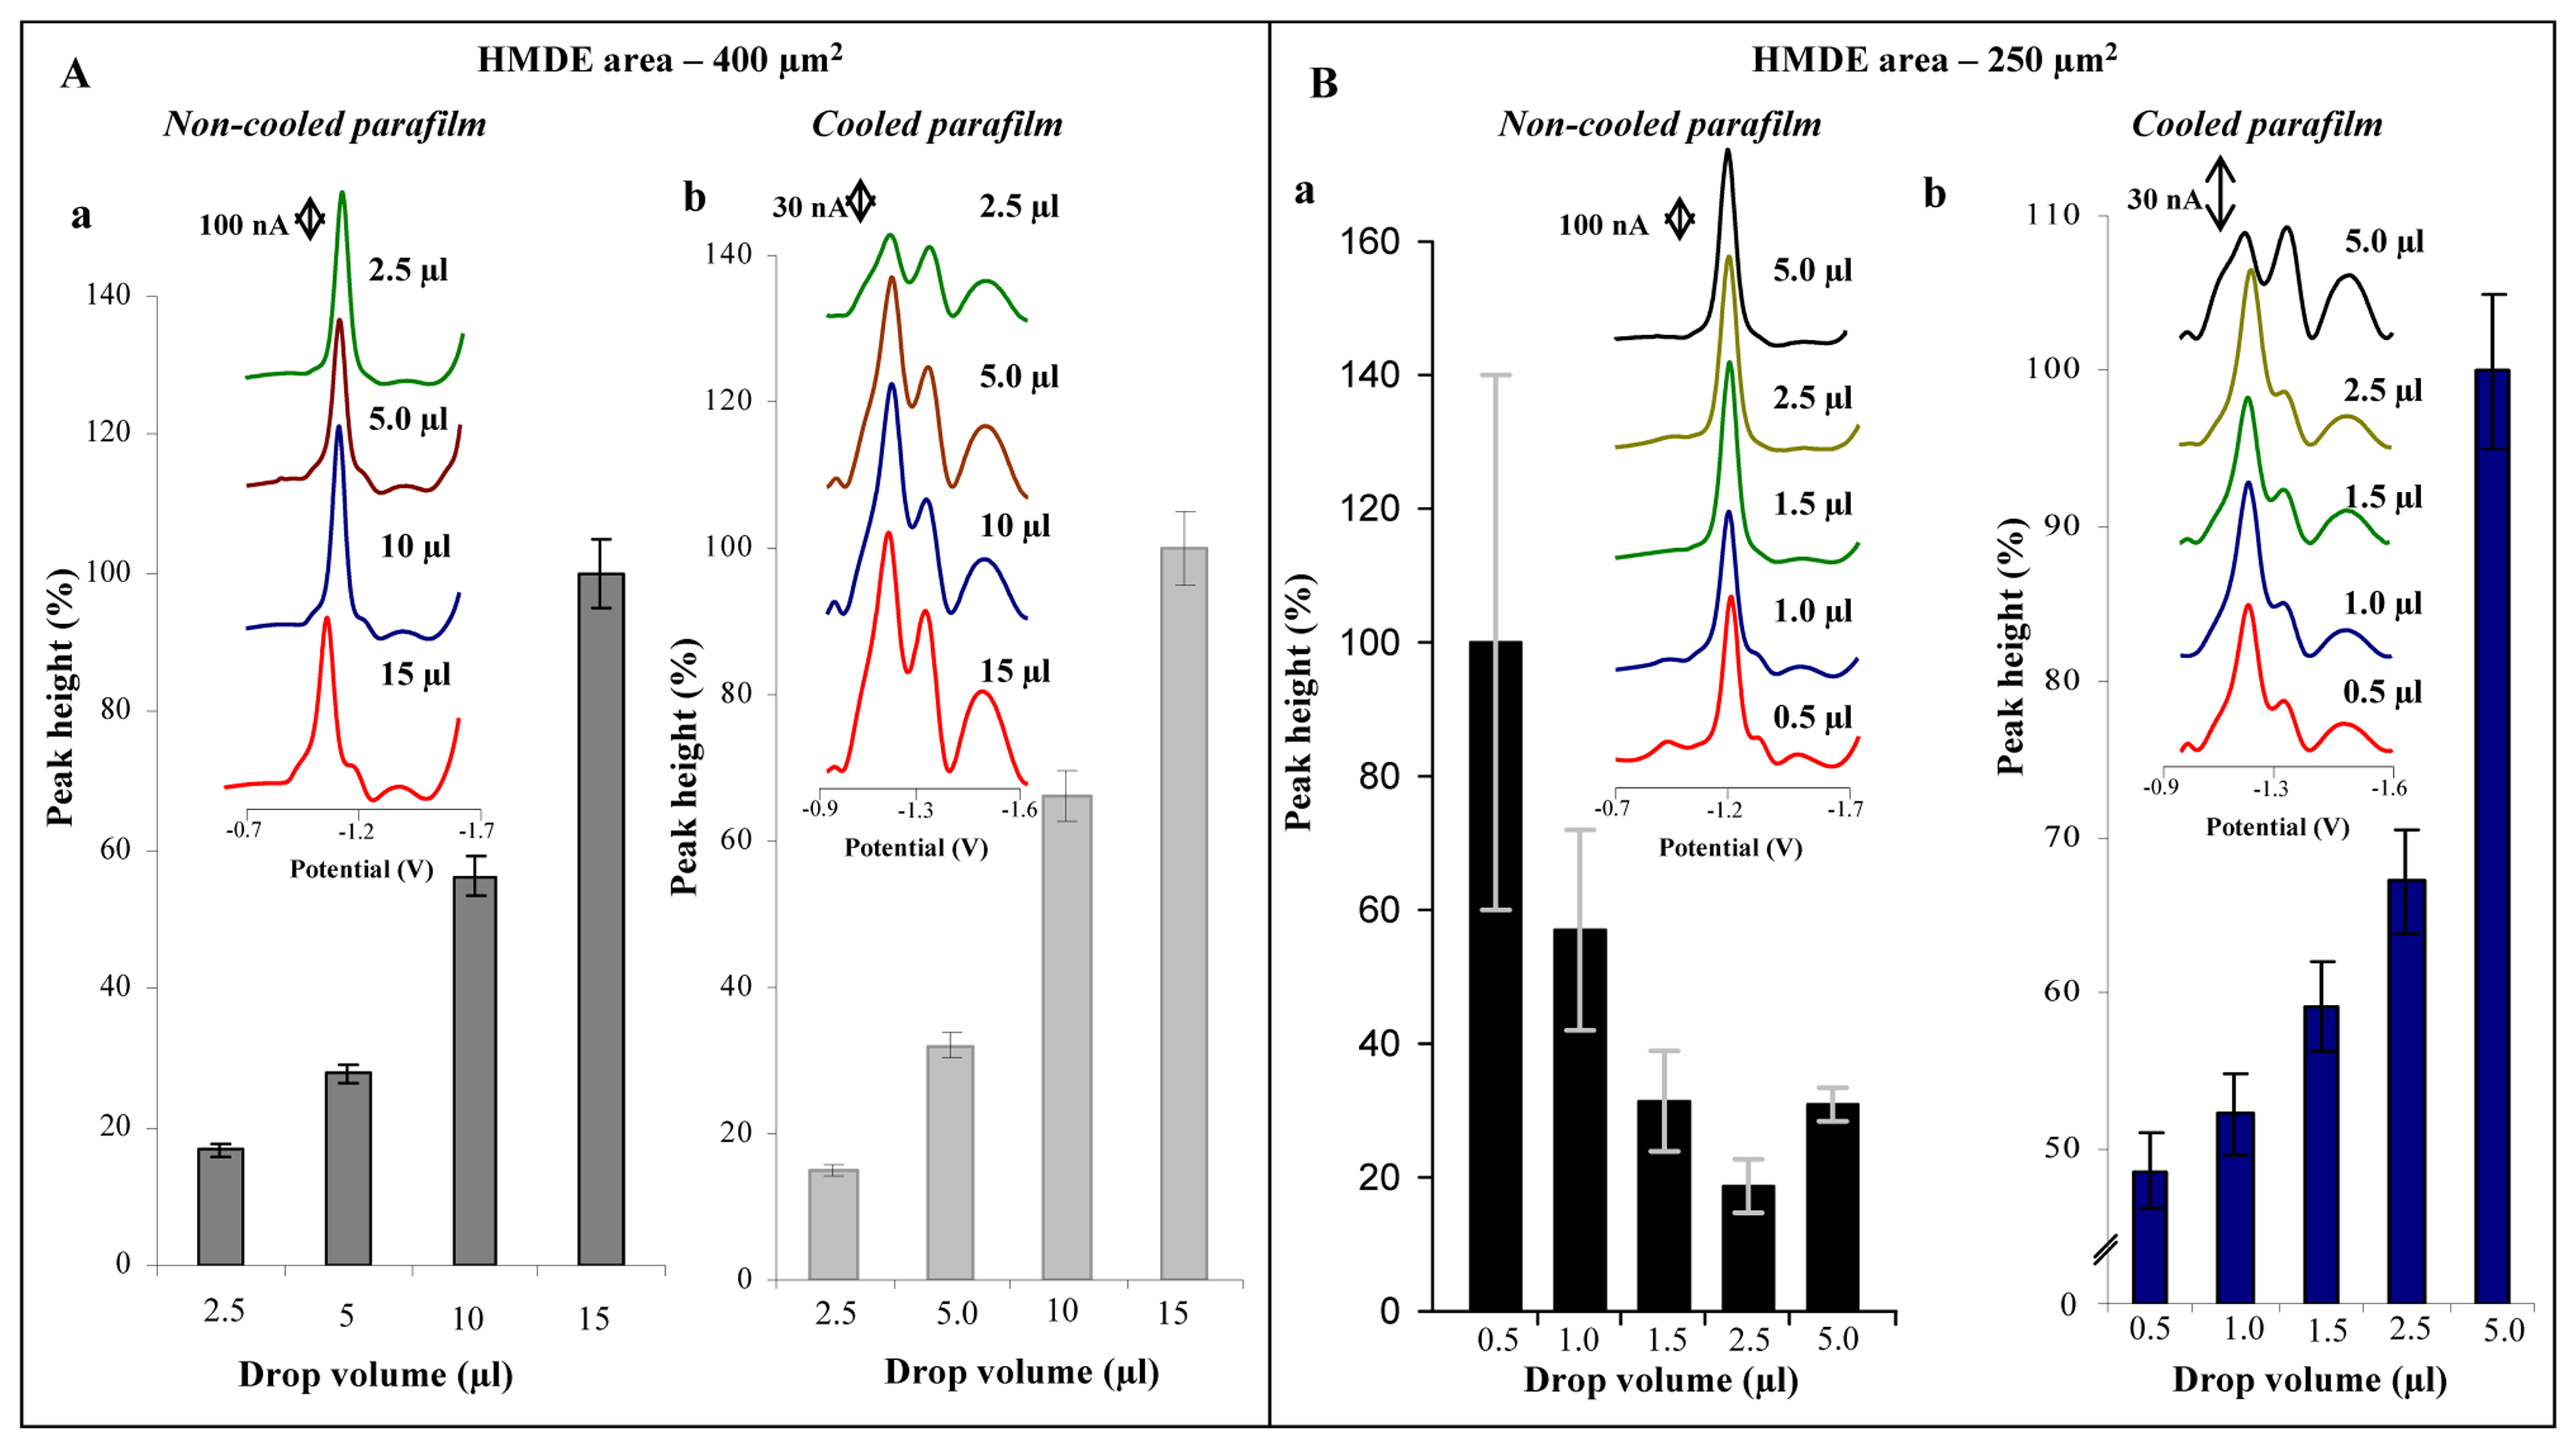
3.2 Improvement of the adsorptive transfer technique

This obstacle can be overcome by technically modifying the current transfer technique. A small square of parafilm (10 × 10 cm, Sigma-Aldrich) is seamed on a microscope slide by a burner (Figure 3a). The slide is washed with ethanol and distilled water (Milli Q, 18 MΩ) and transferred to a cooled space, in this case to a beaker filled with distilled water and placed in a tempered water bath (Julabo, Germany, Figure 3b) at a temperature of 2 °C. Prior to use, the slide is removed from the bath and dried using cellulose. MT low volume drops were pipetted onto the dried slide (Figure 3c) and then adsorbed on the surface of HMDE at open circuit (Figure 3d). The electrode with the adsorbed target molecule is washed and measured (Figures 3e-g). The experiment discussed in Section 3.1. was repeated and MT measurements (100 μM) with drop volumes of 2.5, 5.0, 10 and 15 μL were carried out using the improved AdTS DPV Brdicka reaction and HMDE with a drop area of 400 μm2 (Fig. 2Ab). Compared to results shown in Fig. 2Aa the signals were higher and more proportional to MT content with a R2 value of 1.000. Relative standard deviation of Cat2 (n = 5) peak height did not exceed 4 %.

3.3 Electrochemical analysis of MT in low volume samples

Due to these results further studies were done on MT samples with various volumes. Investigations were done on MT containing samples (100 nM) with volumes of 0.5, 1.0, 1.5, 2.5 and 5.0 μL using HMDE with a drop area of 250 μm2 (Figure 2Bb). The improvement of the transfer technique described above enabled us to detect MT in very low volume samples in comparison to the “standard” transfer technique (Figure 2Ba,b). The height of Cat2 signal was proportional to MT content with a R2 value of 0.9928 and the relative standard deviation of Cat2 peak height was not higher than 6 %. Substantial improvement in results was due to decrease in water evaporation in low volume drops.
Additional investigations on the influence of the accumulation of MT over time (500 nL) on Cat2 peak height were studied. The peak enhanced to 120 s long accumulation, then gradually decreased (Figure 4A).
Under 120 s long accumulation of MT on the surface of HMDE we measured the dependence of Cat2 peak height on MT concentration. The peak height increased with increasing MT concentration within the tested interval from 25 to 5,000 nM (Fig. 4B). The linear dependence was measured within the interval from 25 to 500 pM with relative standard deviation of 2.5 % (n = 5, inset in Figure 4B). Measurements were repeatable within a day and also weeks later. The relative deviation of such measurements did not exceed 5% (n = 4). The detection limit (3 S/N) of MT was evaluated as 500 zeptomoles per 500 nL (1 pM) and the quantification limit (10 S/N) as 1,500 zeptomoles per 500 nl (3 pM).

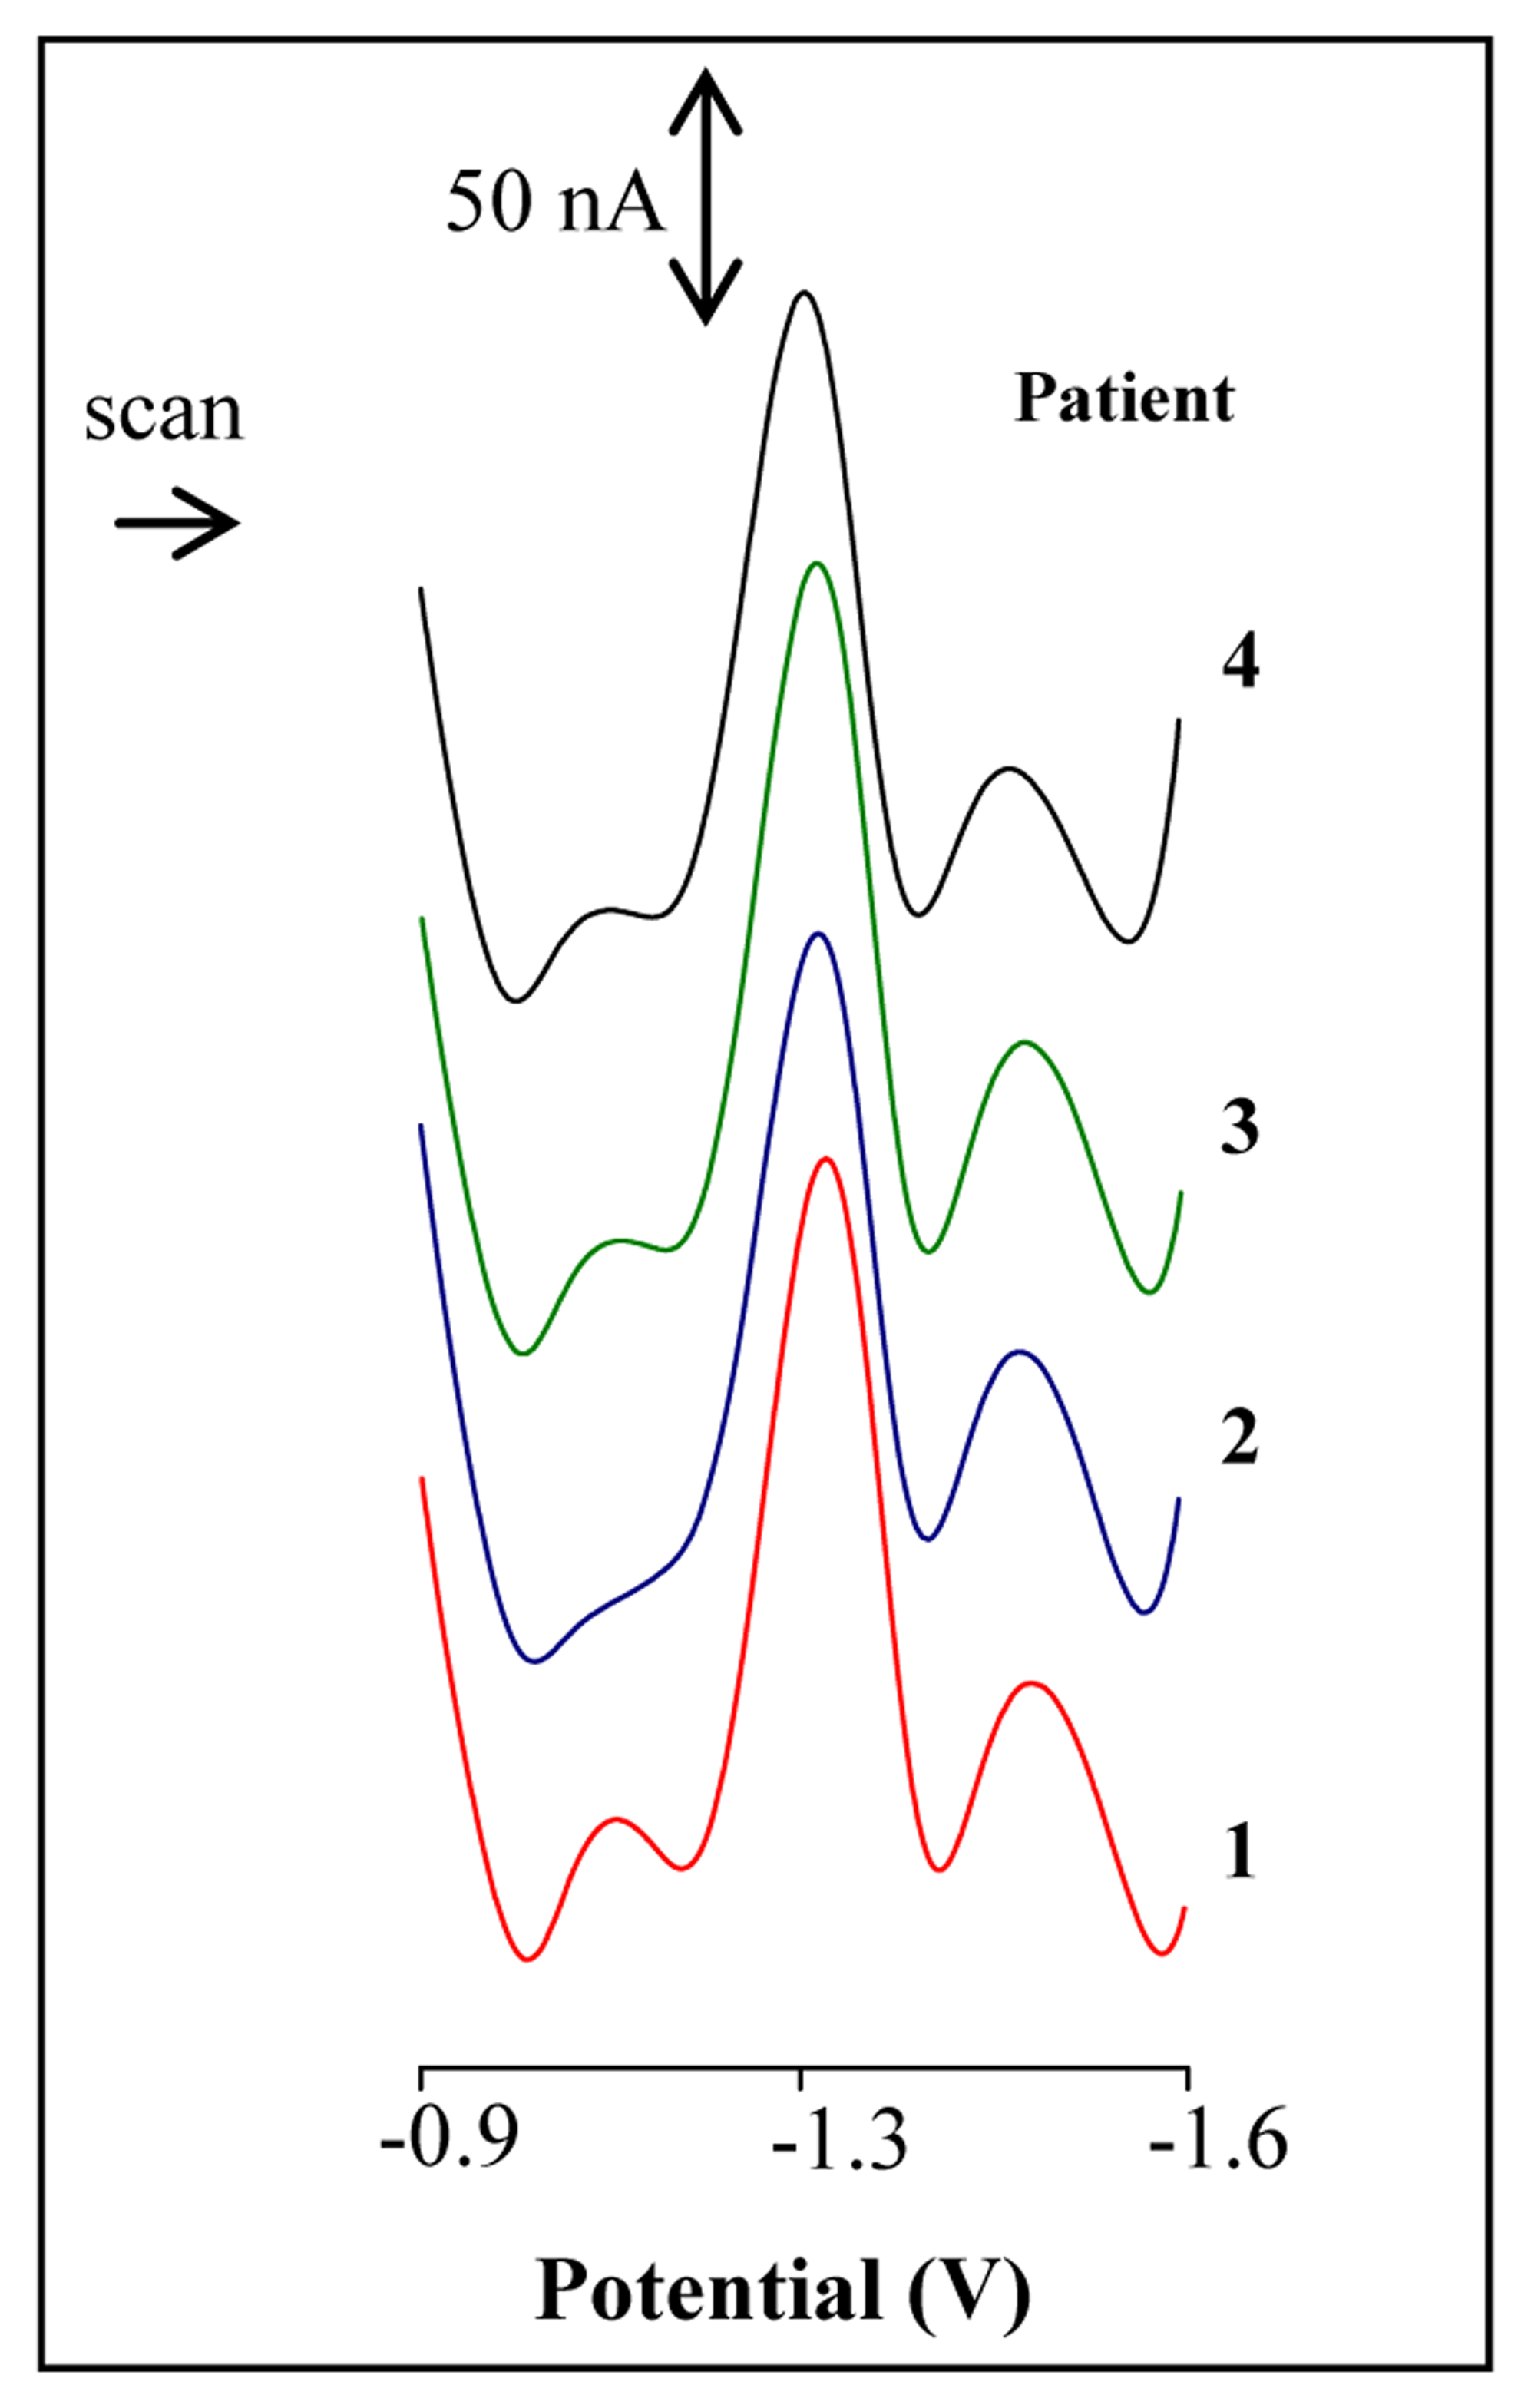
3.4 Analysis of blood serum from patients with a tumour disease

Recently published studies have shown an association between metallothionein and breast cancer. MT level analysis of one hundred patients with this type of cancer was reported. The authors showed a correlation between high levels of MT and an increase in disease prognosis and vice versa[59]. Using a different approach than the latter, we attempted to utilize the improved transfer technique mentioned above for measuring MT in blood serum from patients with breast cancer. MT samples with 500 nL volumes were analyzed using the revised technique according to the scheme shown in Fig. 3 and MT samples with 5 μL volumes were analyzed using the “standard” technique. Results from the revised technique were compared with the “standard” transfer technique data. In both cases well developed catalytic signals were observed (Figure 5).
Quantification of MT levels in the samples was based on the determination of the Cat2 peak height. MT levels varied from 0.8 to 2.4 μM (1.56 ± 0.79 μM) in respect to 5 μL volumes and from 1.2 to 1.7 μM (1.46 ± 0.28 μM) in respect to 500 nL volumes. A significant difference in standard deviations was observed between the two techniques. A sample prepared according to the procedure mentioned in the “Experimental” section contained several low molecular weight thiols (e.g. glutathione) in addition to the presence of MT containing thiols. This phenomenon could be a result due to altered adsorption of these substances at a lower temperature and lower sample volume. However, the means of MT levels determined in breast cancer patients by both techniques were in good agreement with each other.

4. Conclusions

Proteomic approaches to the identification of novel biomarkers for cancer diagnosis and staging have traditionally relied on the identification of differentially expressed proteins between tumour cells and their normal counterparts based on the patterns of protein expression observed by two-dimensional gel electrophoresis (2D-PAGE) and mass spectrometry. Here, we report on alternative way to detect proteins that can be carried out with very low demands on an instrument, consumable costs and of operator skill. The present paper suggested a simple but effective improvement (cooling of the parafilm) to the adsorptive transfer technique, which consequently resulted in several advantages when conducting measurements. Diminished water evaporation in low volume drops and greater MT adsorption under improved controlled conditions were the major changes observed which allowed measurements down to several hundred nanolitres with relatively low standard deviations and low detection and quantification limit.

Acknowledgments

The authors wish to express their thanks to Dr. Jiri Kukacka for providing clinical samples and to Dr. Grace J. Chavis for language corrections and discussions. Financial support from the Grant Agency of the Czech Academy of Sciences (Grant No. GAAV IAAA40199071) is greatly acknowledged.

References

  1. Fredriksson, S.; Dixon, W.; Ji, H.; Koong, A.C.; Mindrinos, M.; Davis, R.W. Multiplexed protein detection by proximity ligation for cancer biomarker validation. Nat. Methods 2007, 4, 327–329. [Google Scholar]
  2. Bertolini, F.; Shaked, Y.; Mancuso, P.; Kerbel, R.S. The multifaceted circulating endothelial cell in cancer: towards marker and target identification. Nat. Rev. Cancer 2006, 6, 833–845. [Google Scholar]
  3. Kagi, J.H.R. Overview of Metallothionein. Method Enzymol. 1991, 205, 613–626. [Google Scholar]
  4. Kagi, J.H.R.; Schaffer, A. Biochemistry of Metallothionein. Biochemistry 1988, 27, 8509–8515. [Google Scholar]
  5. Hamer, D.H. Metallothionein. Annu. Rev. Biochem. 1986, 55, 913–951. [Google Scholar]
  6. Angel, P.; Karin, M. The Role of Jun, Fos and the Ap-1 Complex in Cell-Proliferation and Transformation. Biochim. Biophys. Acta 1991, 1072, 129–157. [Google Scholar]
  7. Lee, W.; Haslinger, A.; Karin, M.; Tjian, R. Activation of Transcription by 2 Factors That Bind Promoter and Enhancer Sequences of the Human Metallothionein Gene and Sv40. Nature 1987, 325, 368–372. [Google Scholar]
  8. Karin, M.; Haslinger, A.; Holtgreve, H.; Richards, R.I.; Krauter, P.; Westphal, H.M.; Beato, M. Characterization of DNA-Sequences through Which Cadmium and Glucocorticoid Hormones Induce Human Metallothionein-Iia Gene. Nature 1984, 308, 513–519. [Google Scholar]
  9. Palmiter, R.D.; Norstedt, G.; Gelinas, R.E.; Hammer, R.E.; Brinster, R.L. Metallothionein Human Gh Fusion Genes Stimulate Growth of Mice. Science 1983, 222, 809–814. [Google Scholar]
  10. Szpunar, J. Advances in analytical methodology for bioinorganic speciation analysis: metallomics, metalloproteomics and heteroatom-tagged proteomics and metabolomics. Analyst 2005, 130, 442–465. [Google Scholar]
  11. Wolf, C.; Schaumloffel, D.; Richarz, A.N.; Prange, A.; Bratter, P. CZE-ICP-MS separation of metallothioneins in human brain cytosols: comparability of electropherograms obtained from different sample matrices. Analyst 2003, 128, 576–580. [Google Scholar]
  12. Szpunar, J. Bio-inorganic speciation analysis by hyphenated techniques. Analyst 2000, 125, 963–988. [Google Scholar]
  13. Szpunar, J. Trace element speciation analysis of biomaterials by high-performance liquid chromatography with inductively coupled plasma mass spectrometric detection. Trac-Trends Anal. Chem. 2000, 19, 127–137. [Google Scholar]
  14. Ferrarello, C.N.; de la Campa, M.D.F.; Carrasco, J.F.; Sanz-Medel, A. Speciation of metallothionein-like proteins of the mussel Mytilus edulis at basal levels by chromatographic separations coupled to quadrupole and double-focusing magnetic sector ICPMS. Anal. Chem. 2000, 72, 5874–5880. [Google Scholar]
  15. Harrington, C.F.; Vidler, D.S.; Watts, M.J.; Hall, J.F. Potential for using isotopically altered metalloproteins in species-specific isotope dilution analysis of proteins by HPLC coupled to inductively coupled plasma mass spectrometry. Anal. Chem. 2005, 77, 4034–4041. [Google Scholar]
  16. Wang, Z.X.; Prange, A. Use of surface-modified capillaries in the separation and characterization of metallothionein isoforms by capillary electrophoresis inductively coupled plasma mass spectrometry. Anal. Chem. 2002, 74, 626–631. [Google Scholar]
  17. Kizek, R.; Trnkova, L.; Palecek, E. Determination of metallothionein at the femtomole level by constant current stripping chronopotentiometry. Anal. Chem. 2001, 73, 4801–4807. [Google Scholar]
  18. Luo, D.B.; Lan, J.G.; Zhou, C.; Luo, C.X. Polarographic behavior of Co(II)-BSA or -HSA complex in the presence of a guanidine modifier. Anal. Chem. 2003, 75, 6346–6350. [Google Scholar]
  19. Erk, M.; Ivankovic, D.; Raspor, B.; Pavicic, J. Evaluation of different purification procedures for the electrochemical quantification of mussel metallothioneins. Talanta 2002, 57, 1211–1218. [Google Scholar]
  20. Long, G.L.; Winefordner, J.D. Limit of Detection. Anal. Chem. 1983, 55, A712–A724. [Google Scholar]
  21. Adam, V.; Hanustiak, P.; Krizkova, S.; Beklova, M.; Zehnalek, J.; Trnkova, L.; Horna, A.; Sures, B.; Kizek, R. Palladium biosensor. Electroanalysis 2007, 19, 1909–1914. [Google Scholar]
  22. Adam, V.; Krizkova, S.; Zitka, O.; Trnkova, L.; Petrlova, J.; Beklova, M.; Kizek, R. Determination of apo-metallothionein using adsorptive transfer stripping technique in connection with differential pulse voltammetry. Electroanalysis 2007, 19, 339–347. [Google Scholar]
  23. Hubalek, J.; Hradecky, J.; Adam, V.; Krystofova, O.; Huska, D.; Masarik, M.; Trnkova, L.; Horna, A.; Klosova, K.; Adamek, M.; Zehnalek, J.; Kizek, R. Spectrometric and voltammetric analysis of urease - nickel nanoelectrode as an electrochemical sensor. Sensors 2007, 7, 1238–1255. [Google Scholar]
  24. Huska, D.; Zitka, O.; Adam, V.; Beklova, M.; Krizkova, S.; Zeman, L.; Horna, A.; Havel, L.; Zehnalek, J.; Kizek, R. A sensor for investigating the interaction between biologically important heavy metals and glutathione. Czech J. Anim. Sci. 2007, 52, 37–43. [Google Scholar]
  25. Krizkova, S.; Adam, V.; Petrlova, J.; Zitka, O.; Stejskal, K.; Zehnalek, J.; Sures, B.; Trnkova, L.; Beklova, M.; Kizek, R. A suggestion of electrochemical biosensor for study of platinum(II)-DNA interactions. Electroanalysis 2007, 19, 331–338. [Google Scholar]
  26. Petrek, J.; Havel, L.; Petrlova, J.; Adam, V.; Potesil, D.; Babula, P.; Kizek, R. Analysis of salicylic acid in willow barks and branches by an electrochemical method. Russ. J. Plant Physiol. 2007, 54, 553–558. [Google Scholar]
  27. Petrlova, J.; Krizkova, S.; Zitka, O.; Hubalek, J.; Prusa, R.; Adam, V.; Wang, J.; Beklova, M.; Sures, B.; Kizek, R. Utilizing a chronopotentiometric sensor technique for metallothionein determination in fish tissues and their host parasites. Sens. Actuator B-Chem. 2007, 127, 112–119. [Google Scholar]
  28. Petrlova, J.; Masarik, M.; Potesil, D.; Adam, V.; Trnkova, L.; Kizek, R. Zeptomole detection of streptavidin using carbon paste electrode and square-wave voltammetry. Electroanalysis 2007, 19, 1177–1182. [Google Scholar]
  29. Supalkova, V.; Petrek, J.; Havel, L.; Krizkova, S.; Petrlova, J.; Adam, V.; Potesil, D.; Babula, P.; Beklova, M.; Horna, A.; Kizek, R. Electrochemical sensors for detection of acetylsalicylic acid. Sensors 2006, 6, 1483–1497. [Google Scholar]
  30. Vitecek, J.; Petrlova, J.; Petrek, J.; Adam, V.; Potesil, D.; Havel, L.; Mikelova, R.; Trnkova, L.; Kizek, R. Electrochemical study of S-nitrosoglutathione and nitric oxide by carbon fibre NO sensor and cyclic voltammetry - possible way of monitoring of nitric oxide. Electrochim. Acta 2006, 51, 5087–5094. [Google Scholar]
  31. Adam, V.; Petrlova, J.; Potesil, D.; Lubal, P.; Zehnalek, J.; Sures, B.; Kizek, R. New electrochemical biosensor to determine platinum cytostatics to DNA structure. Chem. Listy 2005, 99, 353–393. [Google Scholar]
  32. Adam, V.; Petrlova, J.; Potesil, D.; Zehnalek, J.; Sures, B.; Trnkova, L.; Jelen, F.; Kizek, R. Study of metallothionein modified electrode surface behavior in the presence of heavy metal ions-biosensor. Electroanalysis 2005, 17, 1649–1657. [Google Scholar]
  33. Adam, V.; Zehnalek, J.; Petrlova, J.; Potesil, D.; Sures, B.; Trnkova, L.; Jelen, F.; Vitecek, J.; Kizek, R. Phytochelatin modified electrode surface as a sensitive heavy-metal ion biosensor. Sensors 2005, 5, 70–84. [Google Scholar]
  34. Petrlova, J.; Potesil, D.; Zehnalek, J.; Sures, B.; Adam, V.; Trnkova, L.; Kizek, R. Cisplatin electrochemical biosensor. Electrochim. Acta 2006, 51, 5169–5173. [Google Scholar]
  35. Potesil, D.; Mikelova, R.; Adam, V.; Kizek, R.; Prusa, R. Change of the protein p53 electrochemical signal according to its structural form - Quick and sensitive distinguishing of native, denatured, and aggregated form of the “guardian of the genome”. Protein J. 2006, 25, 23–32. [Google Scholar]
  36. Trnkova, L.; Jelen, F.; Petrlova, J.; Adam, V.; Potesil, D.; Kizek, R. Elimination voltammetry with linear scan as a new detection method for DNA sensors. Sensors 2005, 5, 448–464. [Google Scholar]
  37. Li, L.; Boedicker, J.Q.; Ismagilov, R.F. Using a multijunction microfluidic device to inject substrate into an array of preformed plugs without cross-contamination: Comparing theory and experiments. Anal. Chem. 2007, 79, 2756–2761. [Google Scholar]
  38. Henares, T.G.; Takaishi, M.; Yoshida, N.; Terabe, S.; Mizutani, F.; Sekizawa, R.; Hisamoto, H. Integration of multianalyte sensing functions on a capillary-assembled microchip: Simultaneous determination of ion concentrations and enzymatic activities by a “drop-and-sip” technique. Anal. Chem. 2007, 79, 908–915. [Google Scholar]
  39. Du, W.B.; Fang, Q.; Fang, Z.L. Microfluidic sequential injection analysis in a short capillary. Anal. Chem. 2006, 78, 6404–6410. [Google Scholar]
  40. Lorenz, R.M.; Edgar, J.S.; Jeffries, G.D.M.; Chiu, D.T. Microfluidic and optical systems for the on-demand generation and manipulation of single femtoliter-volume aqueous droplets. Anal. Chem. 2006, 78, 6433–6439. [Google Scholar]
  41. Legendre, L.A.; Bienvenue, J.M.; Roper, M.G.; Ferrance, J.P.; Landers, J.P. A simple, valveless microfluidic sample preparation device for extraction and amplification of DNA from nanoliter-volume samples. Anal. Chem. 2006, 78, 1444–1451. [Google Scholar]
  42. Adam, V.; Zitka, O.; Dolezal, P.; Zeman, L.; Horna, A.; Hubalek, J.; Sileny, J.; Krizkova, S.; Trnkova, L.; Kizek, R. Lactoferrin isolation using monolithic column coupled with spectrometric or micro-amperometric detector. Sensors 2008, 8, 464–487. [Google Scholar]
  43. Babula, P.; Huska, D.; Hanustiak, P.; Baloun, J.; Krizkova, S.; Adam, V.; Hubalek, J.; Havel, L.; Zemlicka, M.; Horna, A.; Beklova, M.; Kizek, R. Flow injection analysis coupled with carbon electrodes as the tool for analysis of naphthoquinones with respect to their content and functions in biological samples. Sensors 2006, 6, 1466–1482. [Google Scholar]
  44. Prasek, J.; Adamek, M.; Hubalek, J.; Adam, V.; Trnkova, L.; Kizek, R. New hydrodynamic electrochemical arrangement for cadmium ions detection using thick-film chemical sensor electrodes. Sensors 2006, 6, 1498–1512. [Google Scholar]
  45. Zitka, O.; Horna, A.; Stejskal, K.; Zehnalek, J.; Adam, V.; Havel, L.; Zeman, L.; Kizek, R. Study of structural changes of lactoferrin using flow injection analysis with electrochemical detection on glassy carbon electrode. Acta Chim. Slov. 2007, 54, 68–73. [Google Scholar]
  46. Zitka, O.; Huska, D.; Krizkova, S.; Adam, V.; Chavis, G.J.; Trnkova, L.; Horna, A.; Hubalek, J.; Kizek, R. An investigation of glutathione-platinum(II) interactions by means of the flow injection analysis using glassy carbon electrode. Sensors 2007, 7, 1256–1270. [Google Scholar]
  47. Fojta, M.; Havran, L.; Billova, S.; Kostecka, P.; Masarik, M.; Kizek, R. Two-surface strategy in electrochemical DNA hybridization assays: Detection of osmium-labeled target DNA at carbon electrodes. Electroanalysis 2003, 15, 431–440. [Google Scholar]
  48. Fojta, M.; Havran, L.; Kizek, R.; Billova, S.; Palecek, E. Multiply osmium-labeled reporter probes for electrochemical DNA hybridization assays: detection of trinucleotide repeats. Biosens. Bioelectron. 2004, 20, 985–994. [Google Scholar]
  49. Kizek, R.; Masarik, M.; Kramer, K.J.; Potesil, D.; Bailey, M.; Howard, J.A.; Klejdus, B.; Mikelova, R.; Adam, V.; Trnkova, L.; Jelen, F. An analysis of avidin, biotin and their interaction at attomole levels by voltammetric and chromatographic techniques. Anal. Bioanal. Chem. 2005, 381, 1167–1178. [Google Scholar]
  50. Masarik, M.; Kizek, R.; Kramer, K.J.; Billova, S.; Brazdova, M.; Vacek, J.; Bailey, M.; Jelen, F.; Howard, J.A. Application of avidin-biotin technology and adsorptive transfer stripping square-wave voltammetry for detection of DNA hybridization and avidin in transgenic avidin maize. Anal. Chem. 2003, 75, 2663–2669. [Google Scholar]
  51. Palecek, E.; Kizek, R.; Havran, L.; Billova, S.; Fojta, M. Electrochemical enzyme-linked immunoassay in a DNA hybridization sensor. Anal. Chim. Acta 2002, 469, 73–83. [Google Scholar]
  52. Palecek, E.; Masarik, M.; Kizek, R.; Kuhlmeier, D.; Hassmann, J.; Schulein, J. Sensitive electrochemical determination of unlabeled MutS protein and detection of point mutations in DNA. Anal. Chem. 2004, 76, 5930–5936. [Google Scholar]
  53. Jelen, F.; Kourilova, A.; Pecinka, P.; Palecek, E. Microanalysis of DNA by stripping transfer voltammetry. Bioelectrochemistry 2004, 63, 249–252. [Google Scholar]
  54. Palecek, E. Surface-attached molecular beacons light the way for DNA sequencing. Trends Biotechnol. 2004, 22, 55–58. [Google Scholar]
  55. Palecek, E.; Jelen, F. Electrochemistry of nucleic acids and development of DNA sensors. Crit. Rev. Anal. Chem. 2002, 32, 261–270. [Google Scholar]
  56. Palecek, E.; Fojta, M. Detecting DNA hybridization and damage. Anal. Chem. 2001, 73, 74A–83A. [Google Scholar]
  57. Palecek, E. From polarography of DNA to microanalysis with nucleic acid-modified electrodes. Electroanalysis 1996, 8, 7–14. [Google Scholar]
  58. Palecek, E.; Postbieglova, I. Adsorptive Stripping Voltammetry of Biomacromolecules with Transfer of the Adsorbed Layer. J. Electroanal. Chem. 1986, 214, 359–371. [Google Scholar]
  59. Goulding, H.; Jasani, B.; Pereira, H.; Reid, A.; Galea, M.; Bell, J.A.; Elston, C.W.; Robertson, J.F.; Blamey, R.W.; Nicholson, R.A.; Schmid, K.W.; Ellis, I.O. Metallothionein Expression in Human Breast-Cancer. Br. J. Cancer 1995, 72, 968–972. [Google Scholar]
Figure 1. Scheme of adsorptive transfer technique (A). Typical voltammograms of 100 nM MT (solid red line), supporting electrolyte (dotted black line) (B).
Sensors 08 02293f1
Figure 2. Dependence of Cat2 peak height of MT on drop volumes of 2.5, 5.0, 10 and 15 μL (A, non-cooled parafilm a and cooled parafilm b, measured at HMDE of area of 400 μm2) and of 0.5, 1, 1.5, 2.5 and 5 μL (B, non-cooled parafilm a and cooled parafilm b, measured at HMDE of area of 250 μm2). In insets: typical DP voltammograms of MT (100 nM). Peak height of 72.3 nA (Aa), 78.6 nA (Ab), 1.1 nA (Ba) and 22.3 (Bb) correspond to 100 %.
Sensors 08 02293f2
Figure 3. Scheme of improvement of the transfer to detect MT in very low volumes of a sample. Microscopic slide, degreasing and seaming of small square from parafilm (10 × 10 cm, Sigma-Aldrich) (a), transferring it to a beaker filled with distilled water and placed in the tempered water bath (temperature of 2 °C, at least 15 min., Julabo, Germany) (b), drying it using cellulose and pipetting of a sample on it (c), adsorbing of MT on the surface of HMDE (d), transferring the electrode (e) and washing it with supporting electrolyte (f), transferring the electrode and measuring (g).
Sensors 08 02293f3
Figure 4. Dependence of Cat2 peak height on accumulation time (A) and on MT concentration within the range from 25 to 5,000 pM (blue square, B) and from 25 to 500 pM (red triangles, in inset in B). Dependence of Cat2 peak potential on MT concentration (black dot, B). Volume: 500 nL, HMDE area: 250 μm2. Other experimental conditions the same as in Figure 1 and 3.
Sensors 08 02293f4
Figure 5. DP voltammograms of human blood serum samples from four patients with breast cancer. Volume of the sample analyzed: 500 nl, HMDE area: 250 μm2. Other experimental conditions the same as in Figure 1 and 3.
Sensors 08 02293f5

