Article

Indium Tin Oxide-Polyaniline Biosensor: Fabrication and Characterization

1
Biosystems and Agricultural Engineering, Michigan State University, East Lansing, MI 48824, USA
2
Large Animal Clinical Sciences, Michigan State University, East Lansing, MI 48824, USA
*
Author to whom correspondence should be addressed.
Sensors 2007, 7(7), 1123-1140; https://doi.org/10.3390/s7071123
Submission received: 6 December 2006 / Accepted: 7 June 2007 / Published: 9 July 2007

Abstract

:
In this study, a novel indium tin oxide (ITO)-polyaniline (Pani) biosensor was designed, fabricated, and characterized. Initial testing was conducted for the detection of bovine viral diarrhea virus (BVDV). The biosensor design was based upon the specific nature of antibodies to capture the target virus, and the conductive properties of self-doped Pani to translate the antibody-antigen binding into a quantifying signal. The first part of the study was to assess the feasibility of the self-doped Pani to be incorporated into the biosensor design by evaluating its several parameters, such as conductivity, physical structure, thermogravimetric properties, and antibody-binding properties. The second part of the paper highlights the fabrication of the ITO-Pani biosensor to detect the presence of bovine viral diarrhea virus (BVDV) in pure culture. Although only BVDV culture was tested in this study, the biosensor is versatile for the detection of other pathogen of interest by changing the specificity of the antibodies.

1. Introduction

For the last 25 years, biosensors based on the conducting polymer polyaniline (Pani) have been investigated to detect numerous types of targets. Besides its excellent electrical and optical properties, Pani is also shown to be a mediator of antibody immobilization by entrapping these biological sensing elements in the polymer matrix (1, 2). It has been shown that these entrapped biological materials maintain their biological activity (1, 3). This entrapment feature is widely used for direct measurement of antibody-antigen binding (4, 5) and is further investigated in this paper.
Polyaniline is extensively researched for its electrical, optical, chemical and electrochemical properties due to its simple synthesis method, stability in air, and potential range of applications (6). It is the best-known semiflexible rod conducting polymer system with chemical and structural flexibility surrounding its amine nitrogen linkages for binding with biological materials (7). The electrical property of Pani is pH-dependent with most studies conducted in a pH level lower than pH 4.0 (8). In a biosensor design however, nearly neutral pH solution (pH 6-8) is important since most biocatalytic and immunological reactions occur optimally at neutral pH (pH 7). Thus, it is a challenge to incorporate biological elements in the conventional pH-dependent Pani synthesis due to the acidic environment.
Recently, significant progress has been accomplished to improve the electrical and physiochemical properties of Pani in a higher pH level (9-11). One progress is by introducing acid residues to the emeraldine base (deprotonated Pani) to give rise to a so-called 'self-doped' Pani (11). Lukachova et al. (2003) reported that the addition of sulfonic acid group to the benzene ring of Pani resulted in a Pani structure with a negatively charged functional group acting as an inner anion dopant. No anion or electron exchange between polymer and surrounding solution was required during the oxidation and reduction processes (11). Such type of Pani had a conductivity of approximately 1 S/cm in an environment of up to pH 7 (11). The most common route for the preparation of self-doped Pani is by chemical modification of the emeraldine base with camphorsulfonic acid (CSA) (12). Based on the characterization studies of the chemical degradation of Pani-CSA compounds by Rannou et al. (1999), Figure 1 shows a proposed polymerization process of Pani in CSA (adapted from 13).
From previous publications (14, 15), a conductometric biosensor based on a sandwich immunoassay format was designed for microbial and viral detection. The biosensor consisted of lateral-flow membranes as the platform, antibodies as the bio-receptor and non-self doped Pani as the transducer. The presence of antigen was detected by measuring the presence of Pani, which was manifested by an increase in conductance (or a drop in resistance). Although the biosensor has a promising performance in detecting a low level of antigen concentration, the design however has a disadvantage: the platform can only be used once due to the non-reversible properties of nitrocellulose and cellulose membranes. Because of this, the calibration (control sample) and the sample testing cannot be performed on the same biosensor platform. The inability to calibrate and test samples using the same biosensor was thought to contribute to the large variability observed in previous experiments (15). The aforementioned challenge has motivated the authors to explore the use of indium tin oxide glass (ITO) as a biosensor platform.
The main goal of this paper was to demonstrate the concept of using ITO glass, and spin-coating Pani and antibodies on it, to create a biosensor platform. In this study, the self-doped Pani was first synthesized and characterized to evaluate its feasibility for incorporation in the biosensor design. Then a method of spin-coating self doped Pani and antibodies specific to bovine viral diarrhea virus, our model pathogen, was evaluated.

2. Results and Discussion

2.1 Characterization of polyaniline

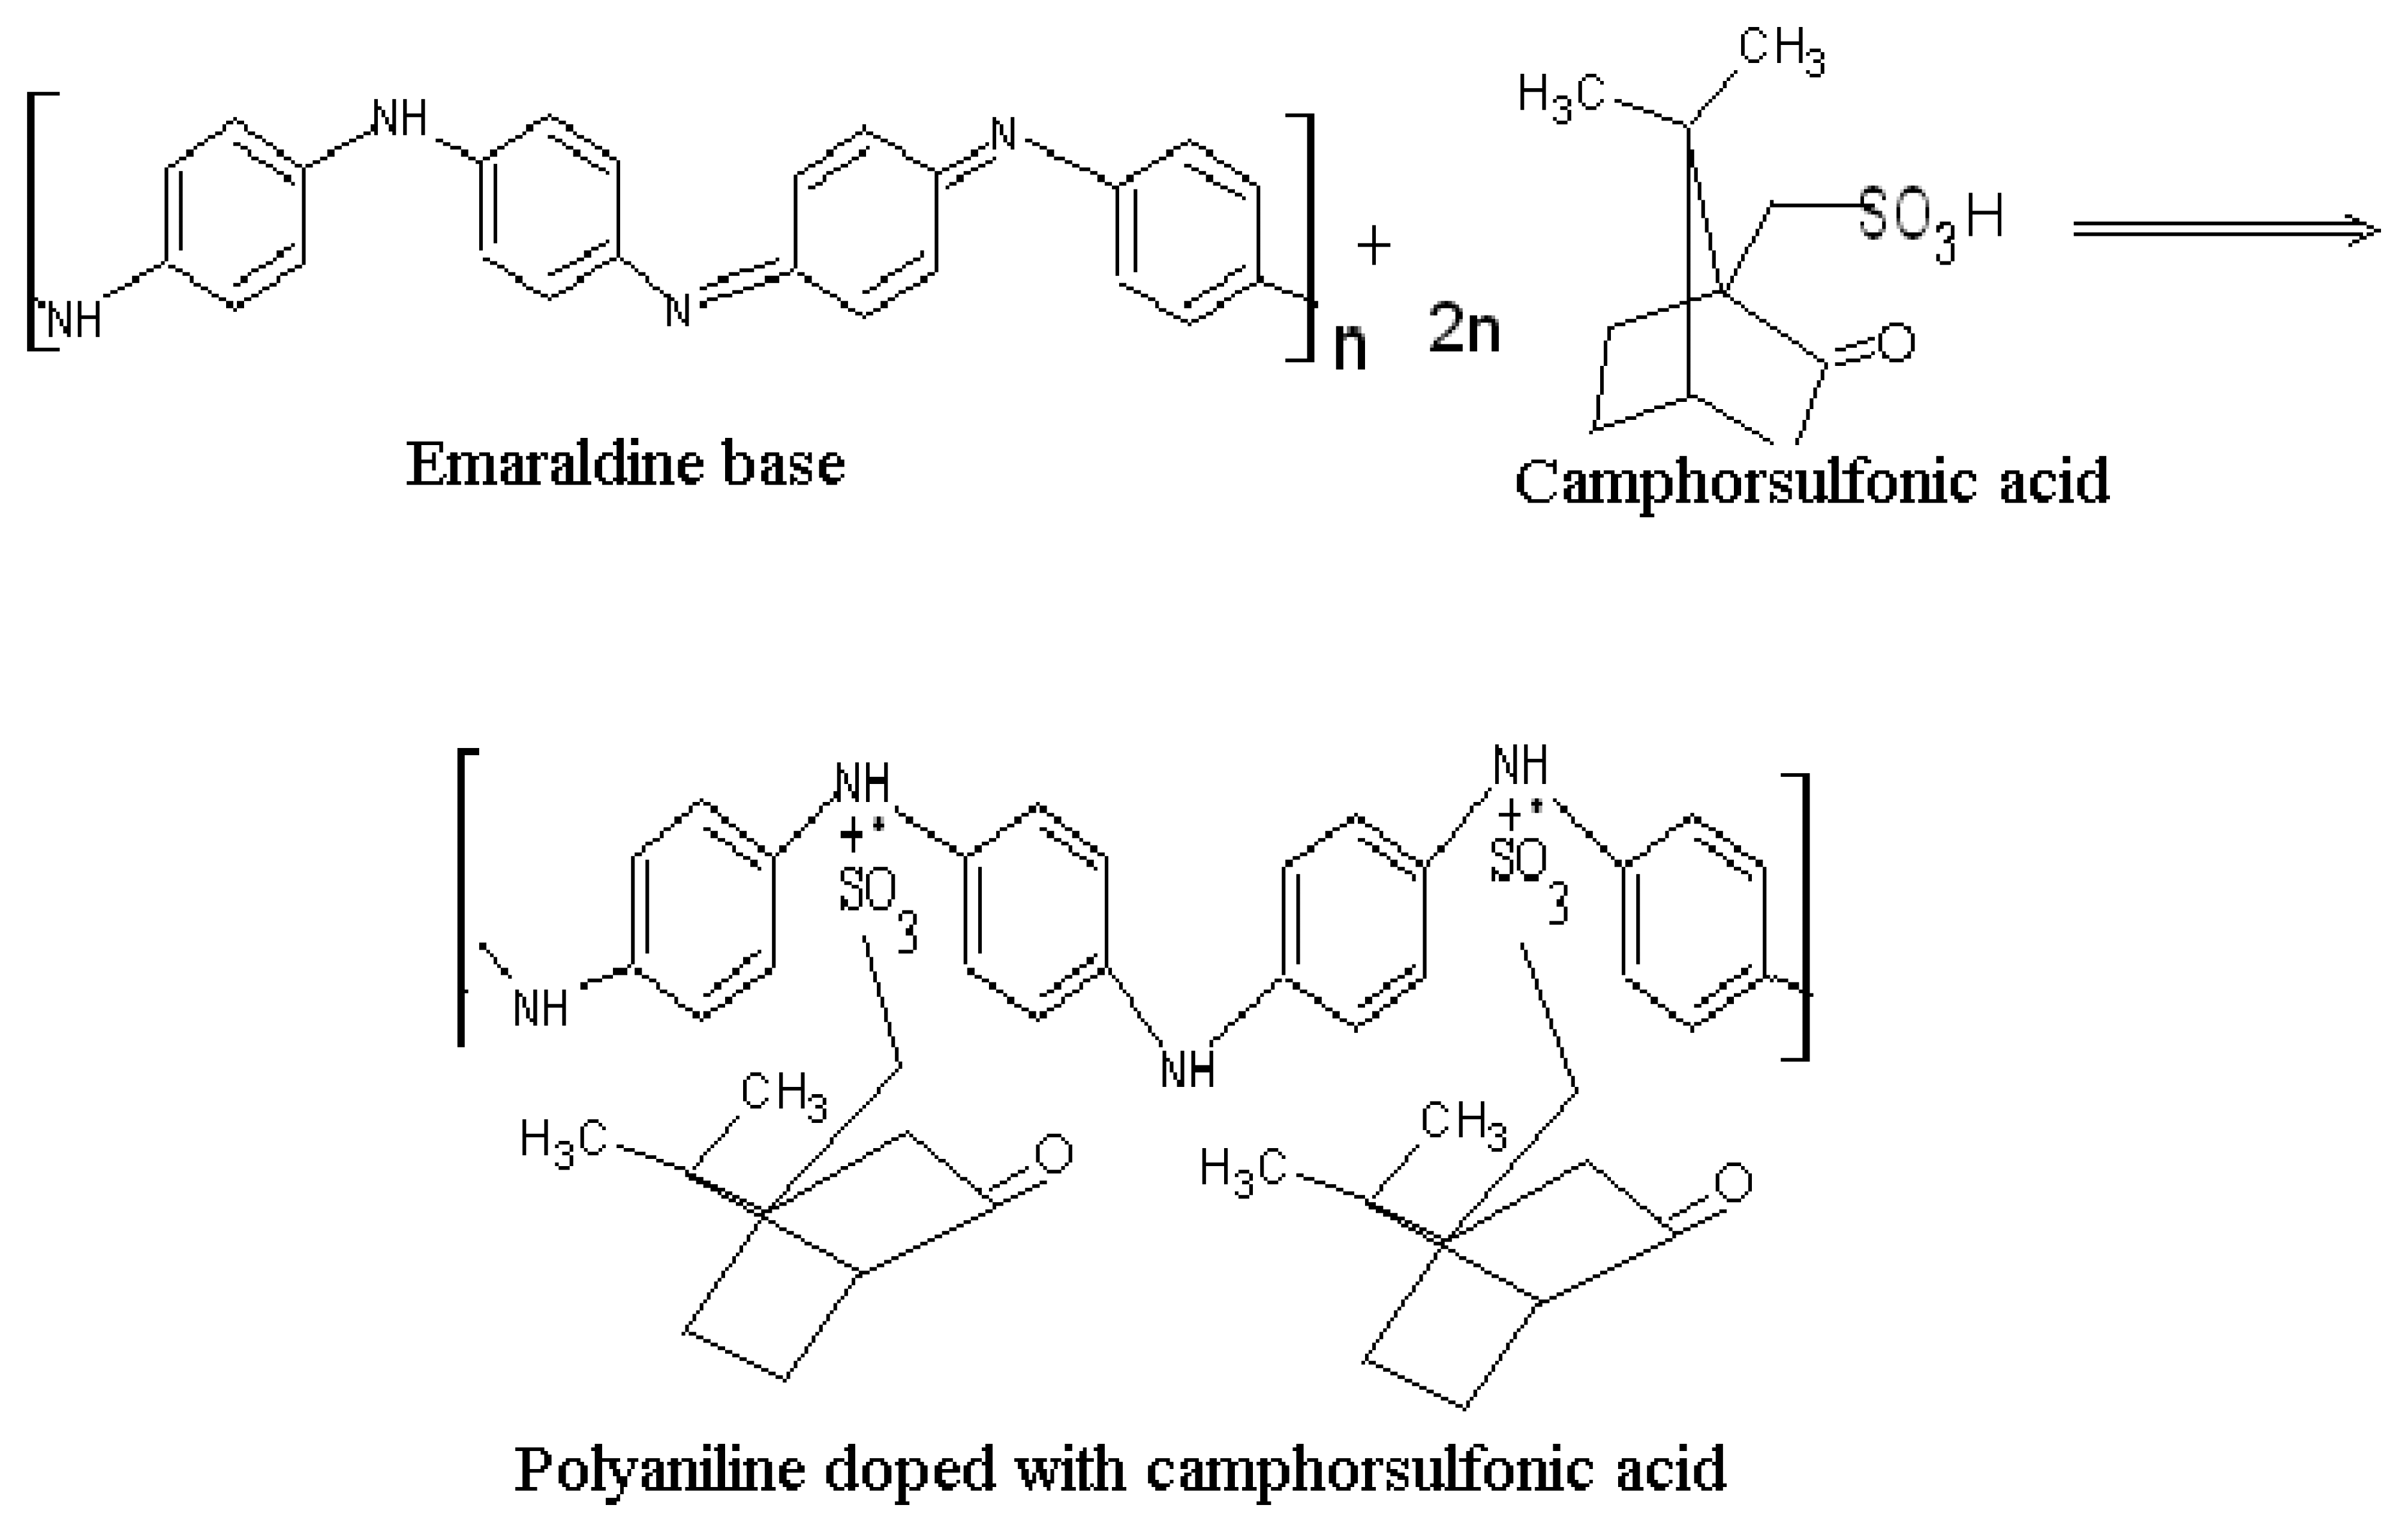
Sergeyeva et al. (1996) reported that the conductivity of non-self doped Pani (Pani chemically polymerized with hydrochloric acid) linearly increased with increasing molecular weight from 10 KDa up to 45 KDa. The conductivity of 100 KDa of the same Pani, however, was reported to be lower than that of the 45 KDa (4). Owing to this report, three commercially-available emeraldine base compounds were self doped with camphorsulfonic acid: two with molecular weights larger than 45 KDa (65 and 50 KDa) and one lower than 45 KDa (20KDa). 
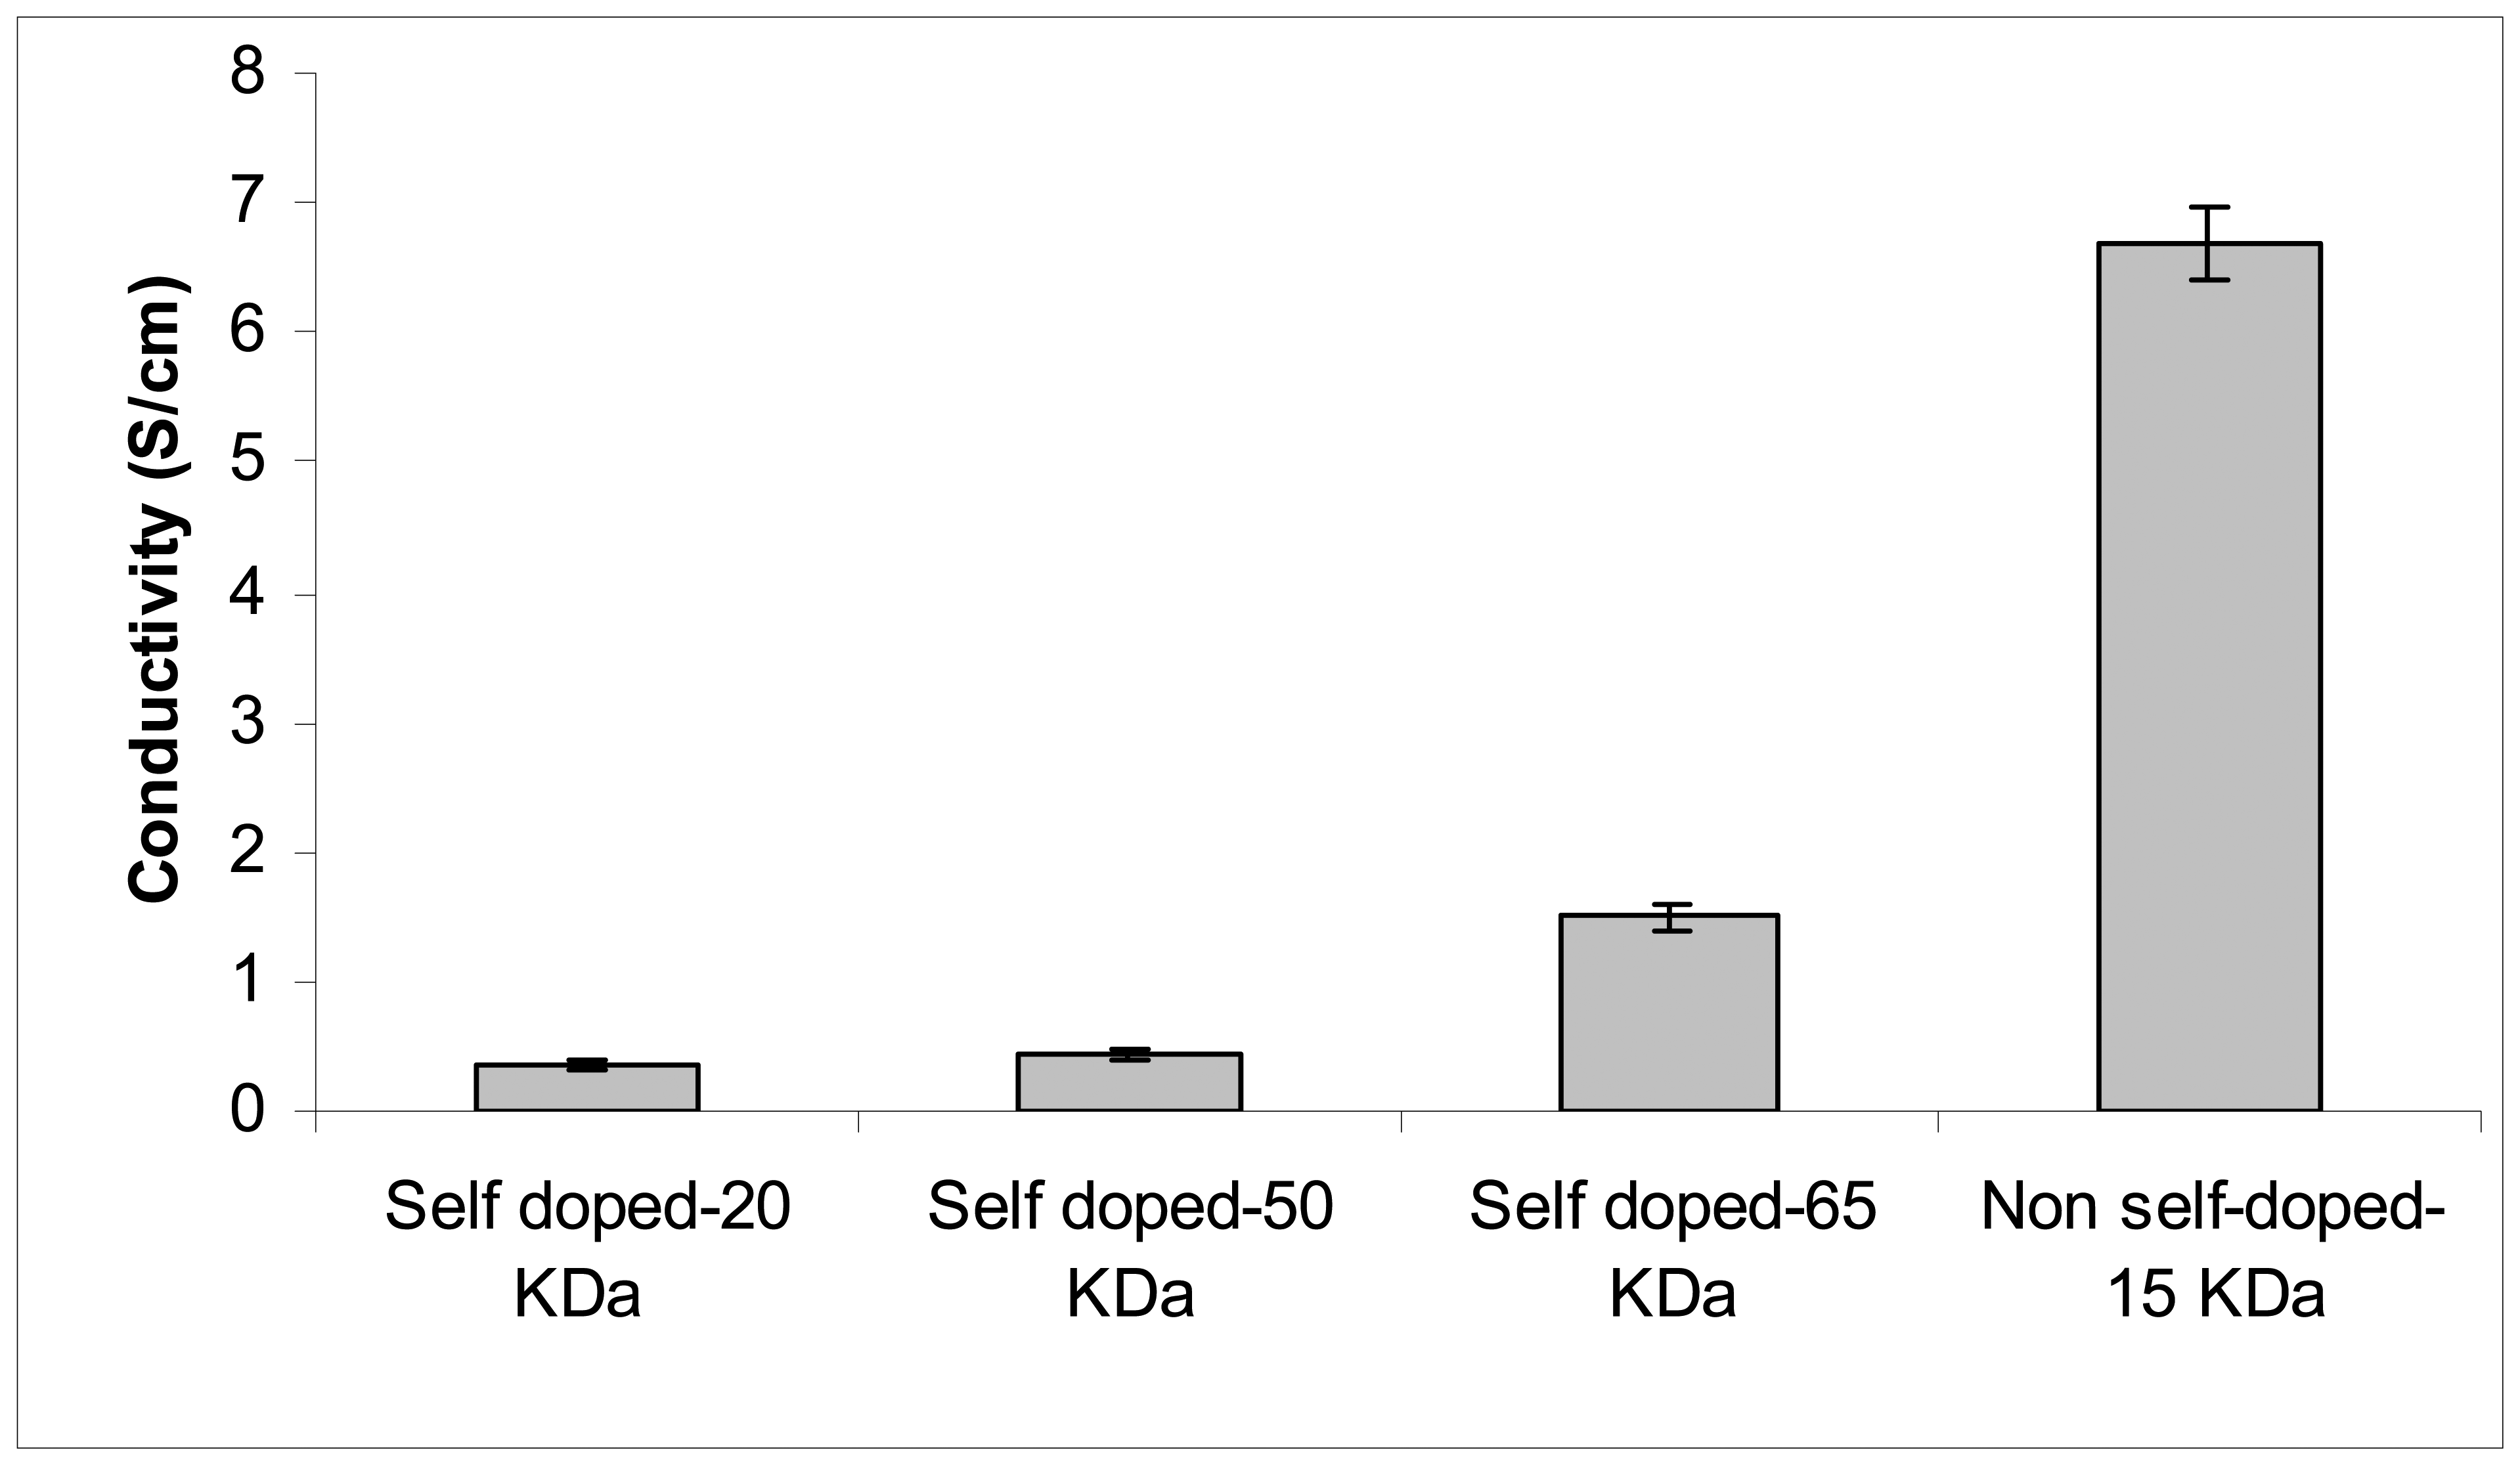
Figure 2 shows the conductivity of self and non-self doped Pani compounds using a four-point probe meter. Among the self doped Pani, the compound with a molecular weight 65-KDa has the highest conductivity at 1.5 Siemens (S)/cm, followed by the 50 (0.44 S/cm) and the 20 (0.36 S/cm) KDa. The conductivities of these self doped Pani are within the range of conductivity levels found in a previous study (11) and are also reported to be increasing with increasing molecular weight. Interestingly, the commercially-available non-self doped Pani has the highest conductivity at 6.7 S/cm even though its molecular weight of ~15 KDa is smaller than the self doped compounds (Figure 2). This finding may be due to the different doping acids used in the Pani polymerization process (10, 16). As indicated earlier, the self doped Pani was doped with camphorsulfonic acid while the commercially-available non-self doped compound was doped with a proprietary organic acid. This observation was confirmed in the subsequent transmission electron microscope (TEM) analysis.
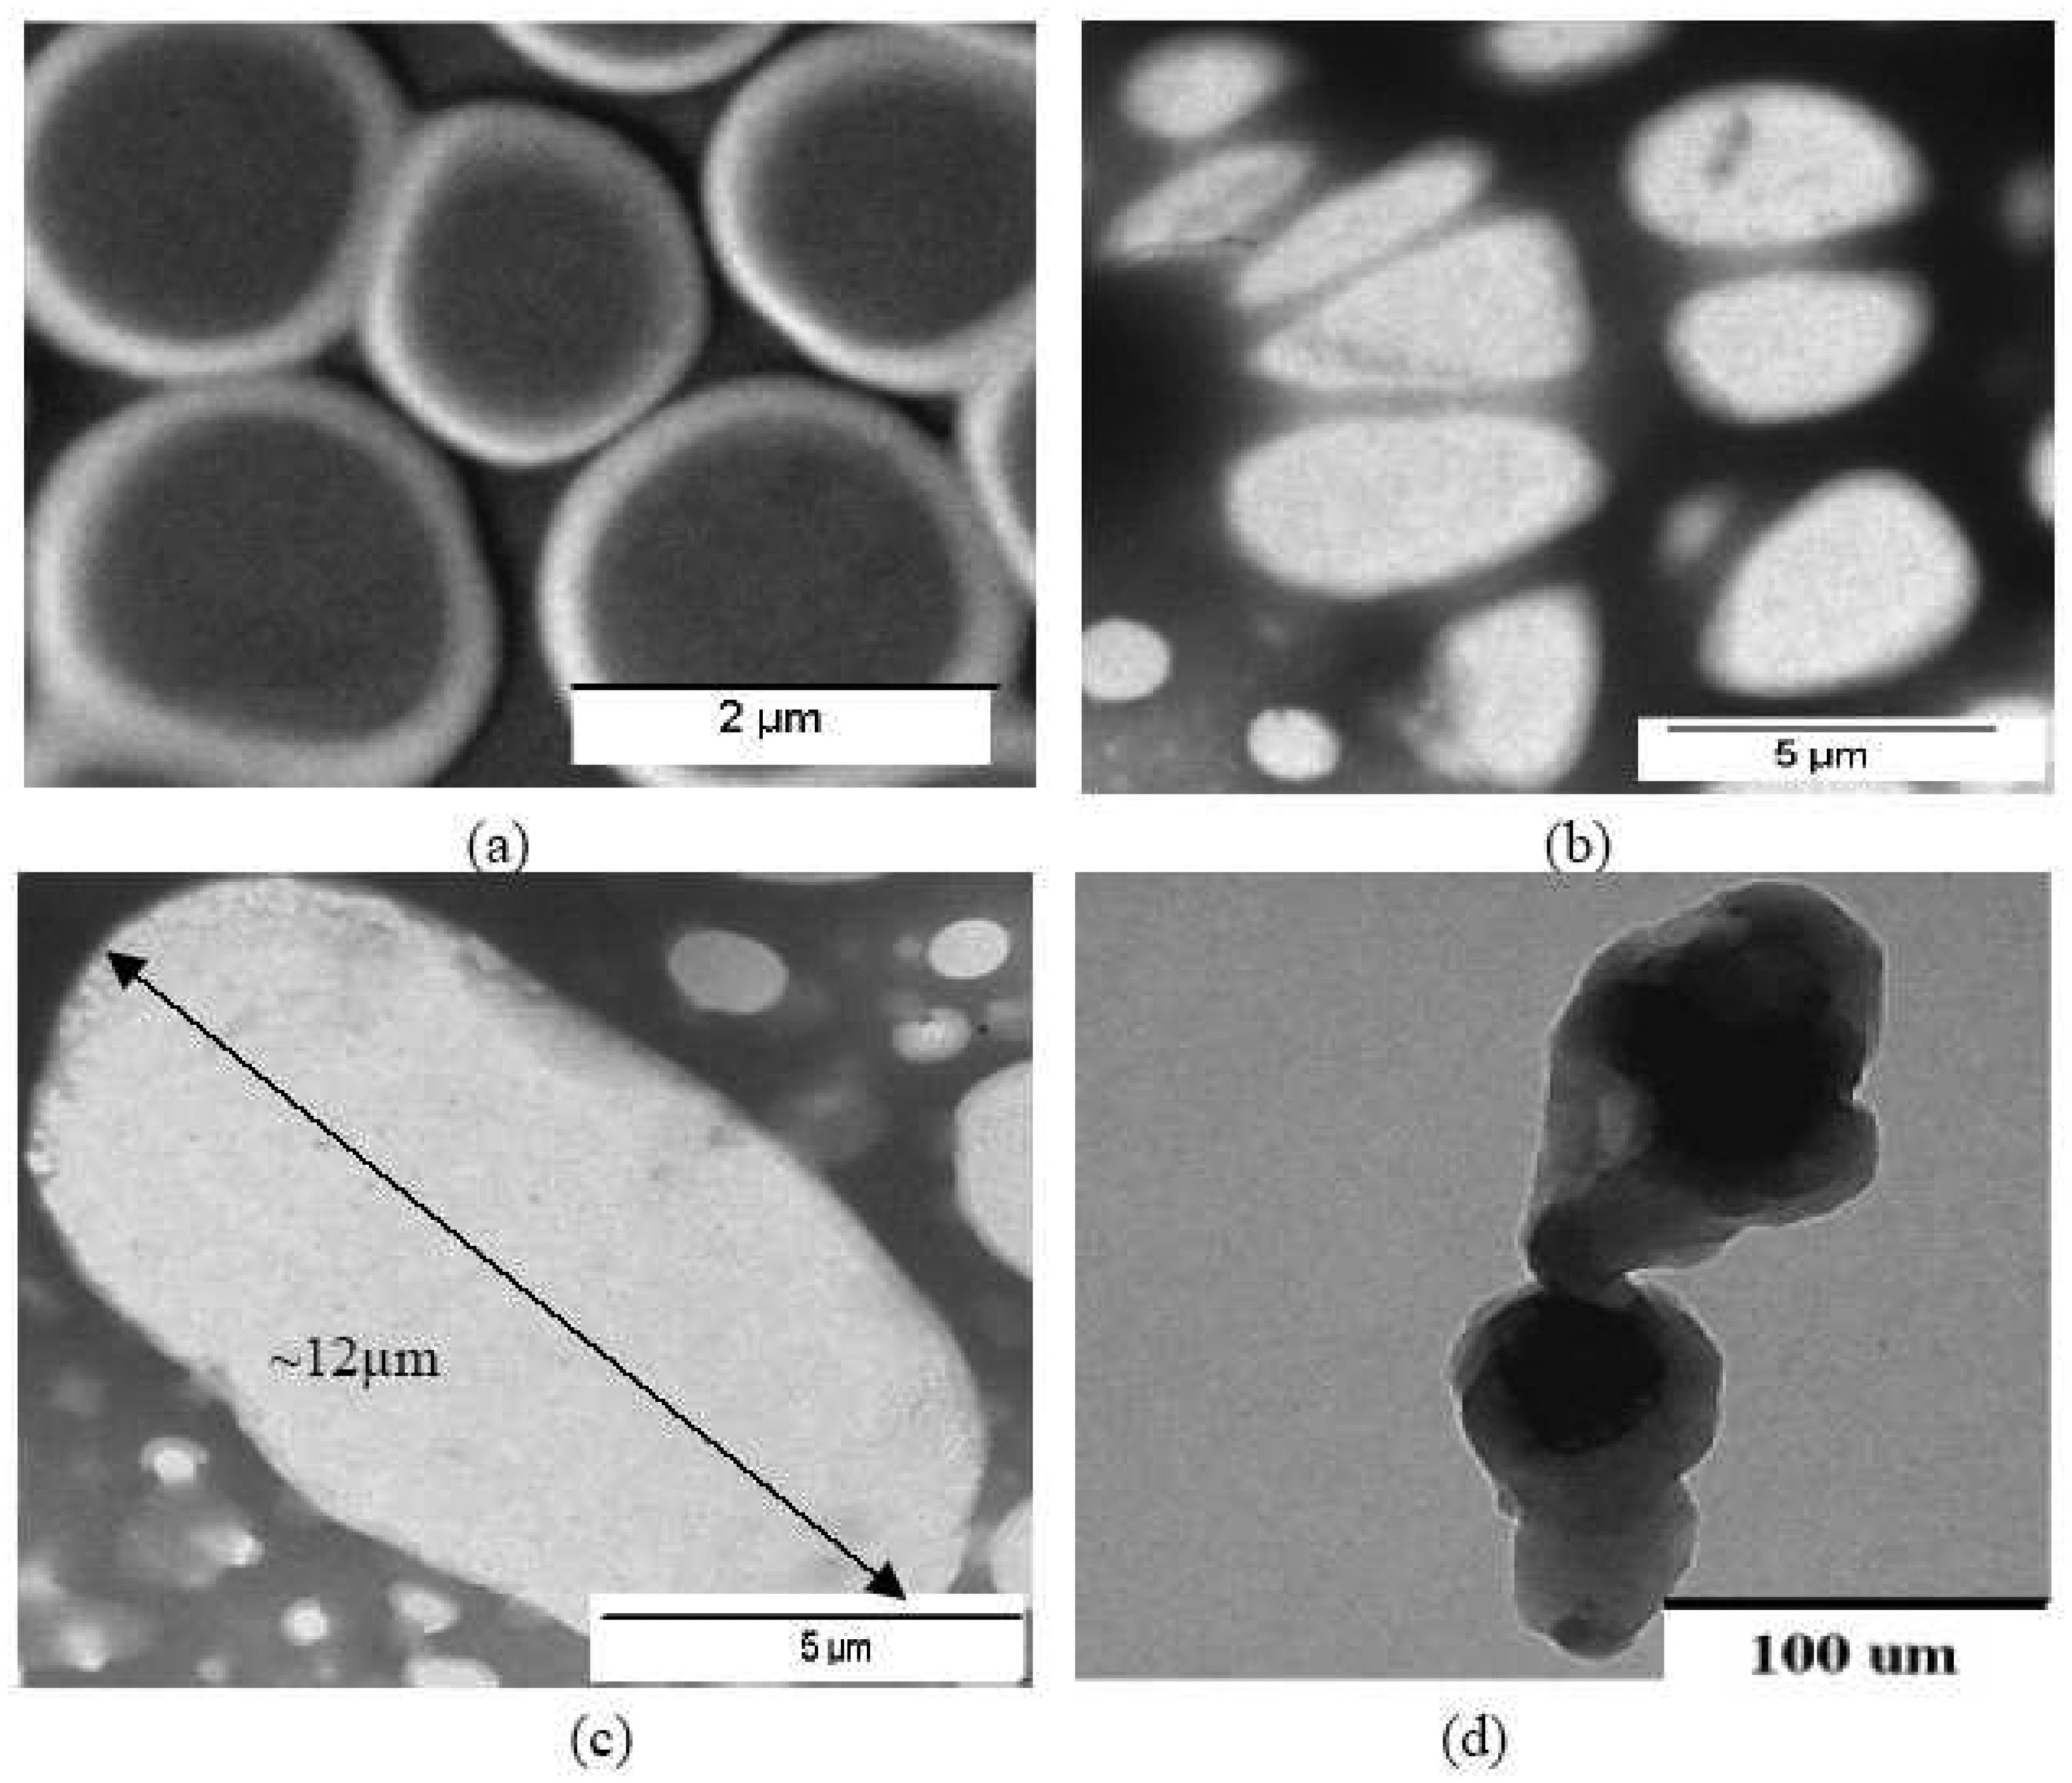
A transmission electron microscope (TEM) was used to study the morphology of Pani compounds (Figure 3). The TEM images show that the higher the molecular weight of the self doped Pani, the larger is the polymer structure. The 65-KDa self doped Pani is approximately 12μm in diameter (Figure 3c); the 50 KDa Pani is about 5 μm (Figure 3b) and the 20 KDa Pani is 2μm (Figure 3a). Additionally, Figure 3 also shows that the self doped Pani compounds have more globular shapes and are smaller than the non-self doped Pani. The non-self doped Pani is more of a rod shape with an approximate length of 100μm. Duic et al. (1994) and Stejskal et al. (1998) also observed differences in size and shape of Pani when using different types of doping acids in their polymerization processes.
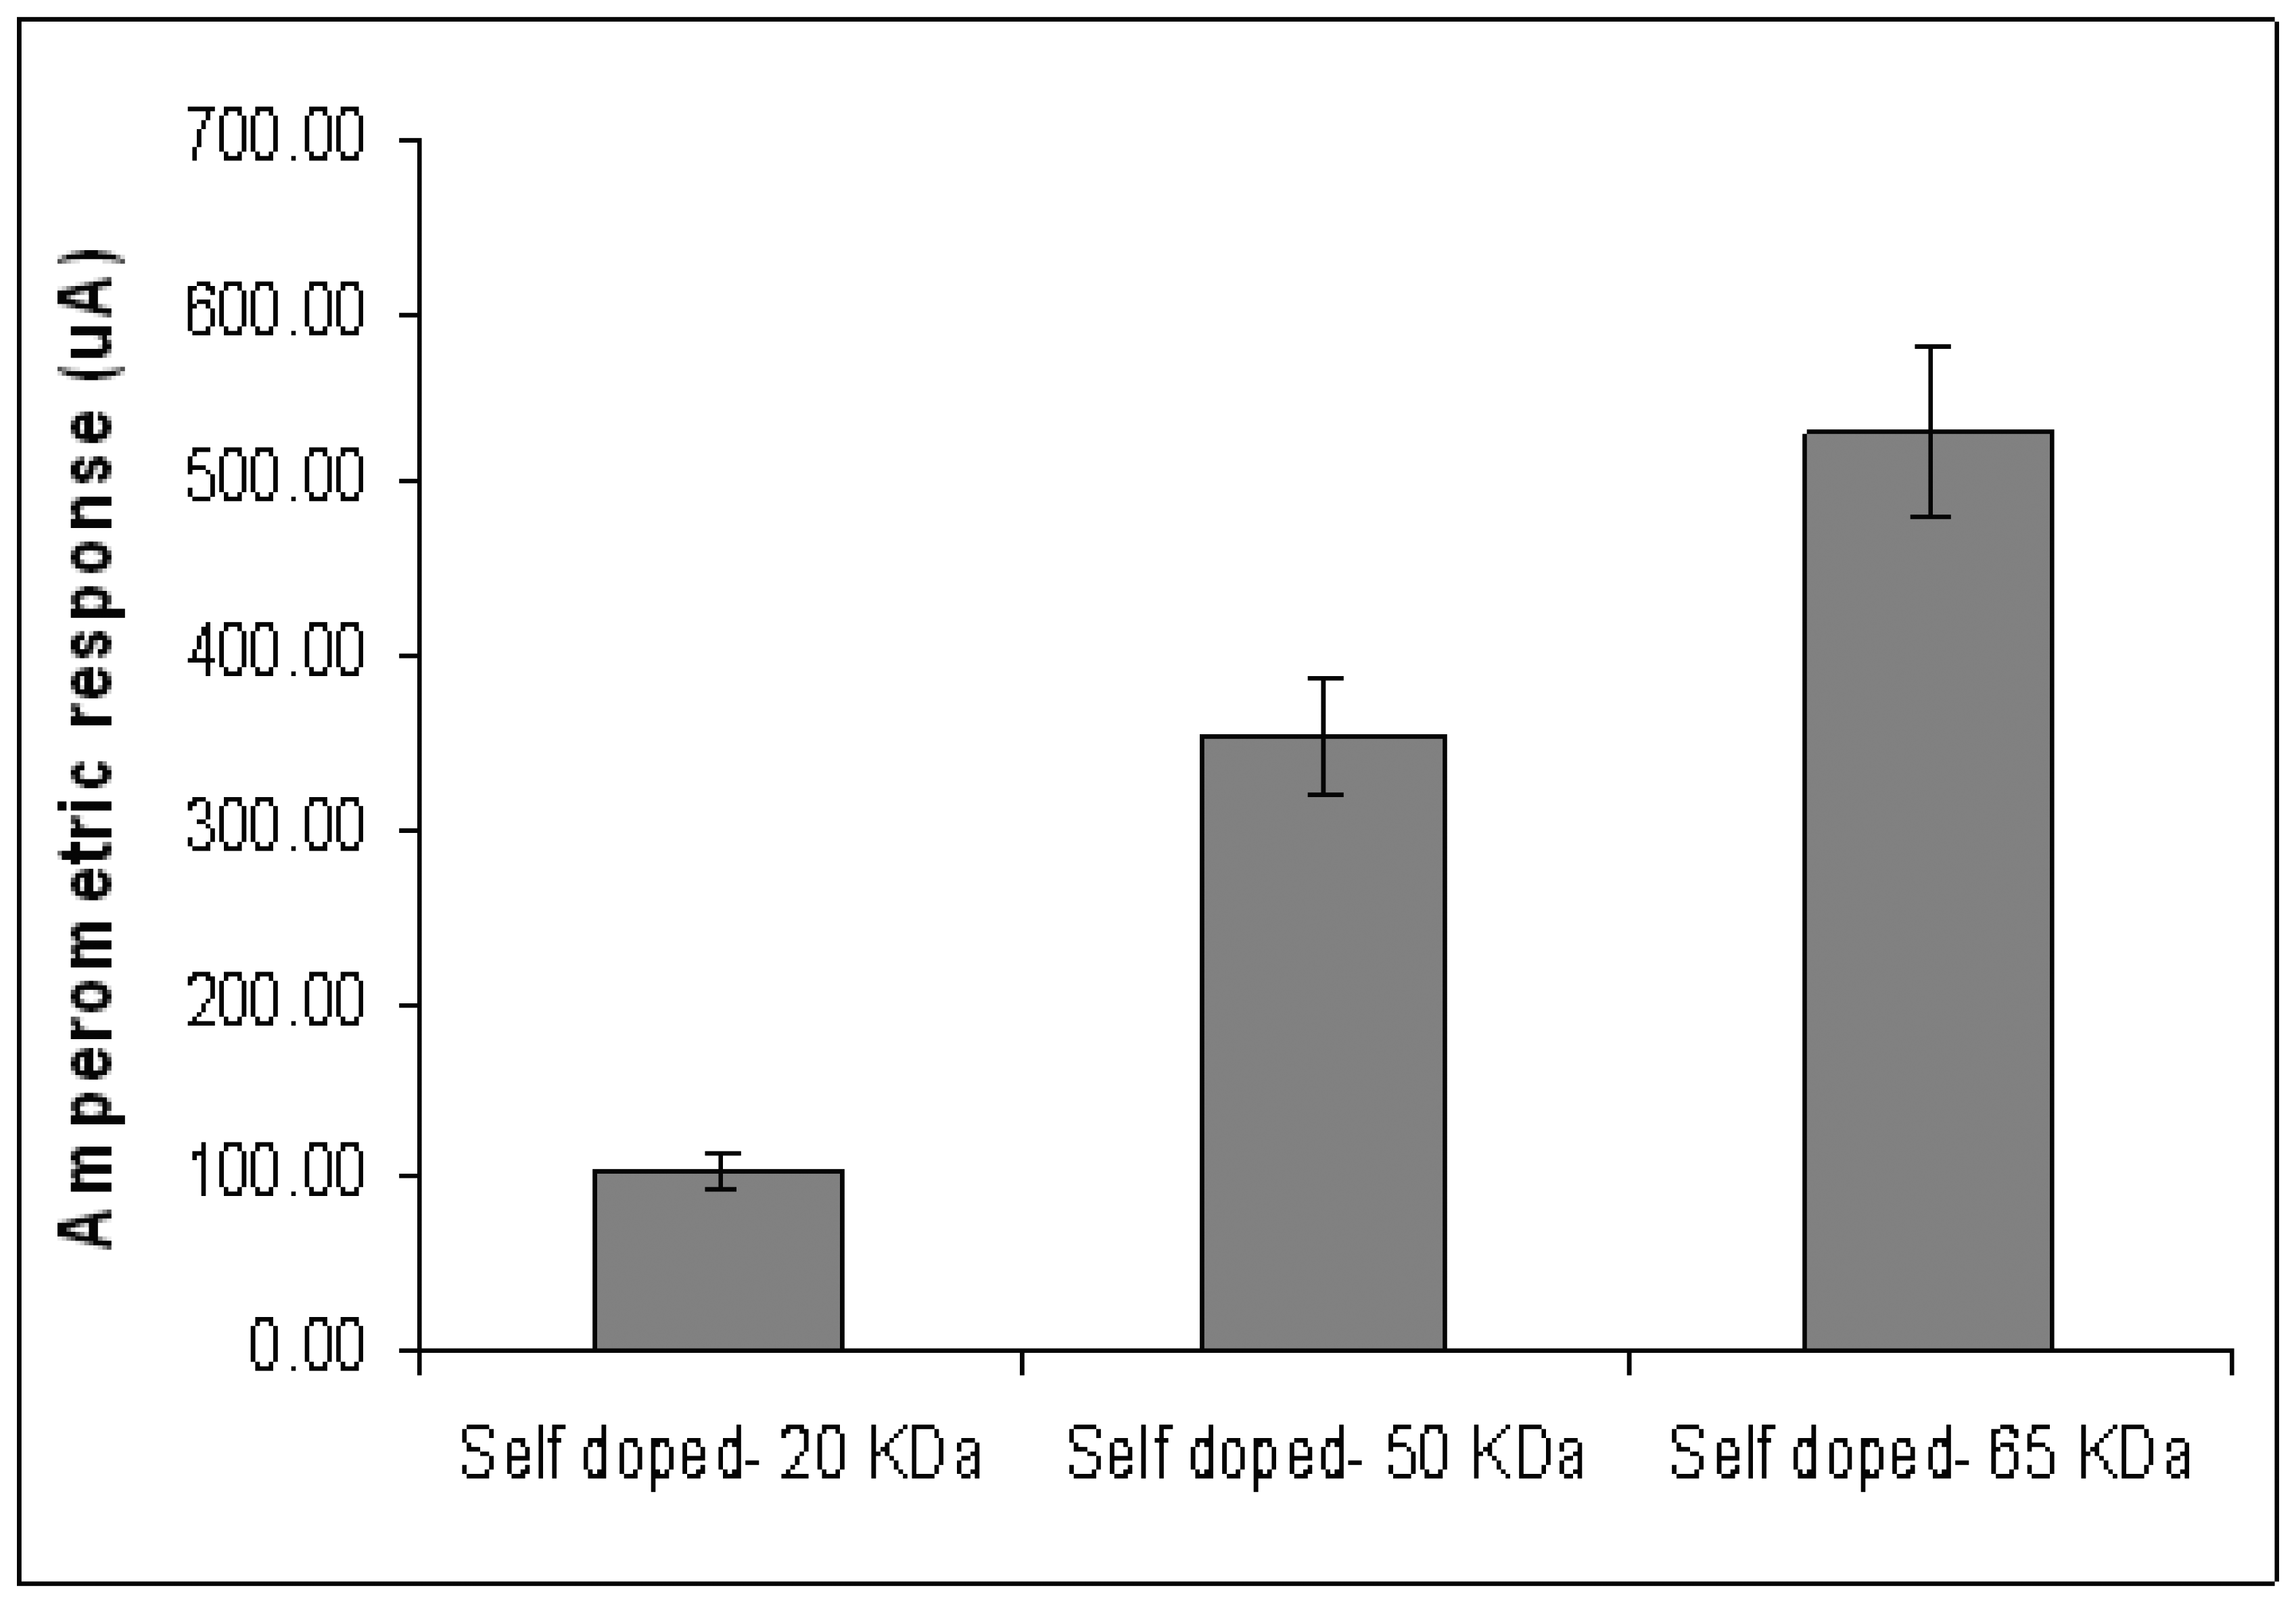
The conductive property of Pani was further evaluated by measuring its amperometric response. Both the self and non-self doped Pani compounds were spin-coated on the ITO substrate and tested for their amperometric responses using the electrochemical set-up described in sections 3.1.1 and 3.1.2. These substrates are referred to as ITO-self doped and ITO–non self doped substrates hereafter. Figure 4 shows the amperometric response of the ITO-self doped substrates in phosphate buffer (PB). The ITO coated with the 65-KDa self doped Pani results in the highest amperometric signal at 530.52 μA. This is followed by the ITO glasses coated with 50KDa (355.78 μA) and 20 KDa (105.13 μA) self doped Pani (Figure 4). A similar trend was observed in the conductivity experiment (Figure 2). Therefore, it is appropriate to conclude that the molecular weight of self doped Pani is directly related to its conductivity. This observation could be explained in terms of polymer backbone density. As the molecular weight increases, the length of the polymer backbone per unit area increases as well (17), enhancing the flow of electrons and subsequently increasing the conductivity. A similar characteristic was also reported by Ryu et al. (1999).
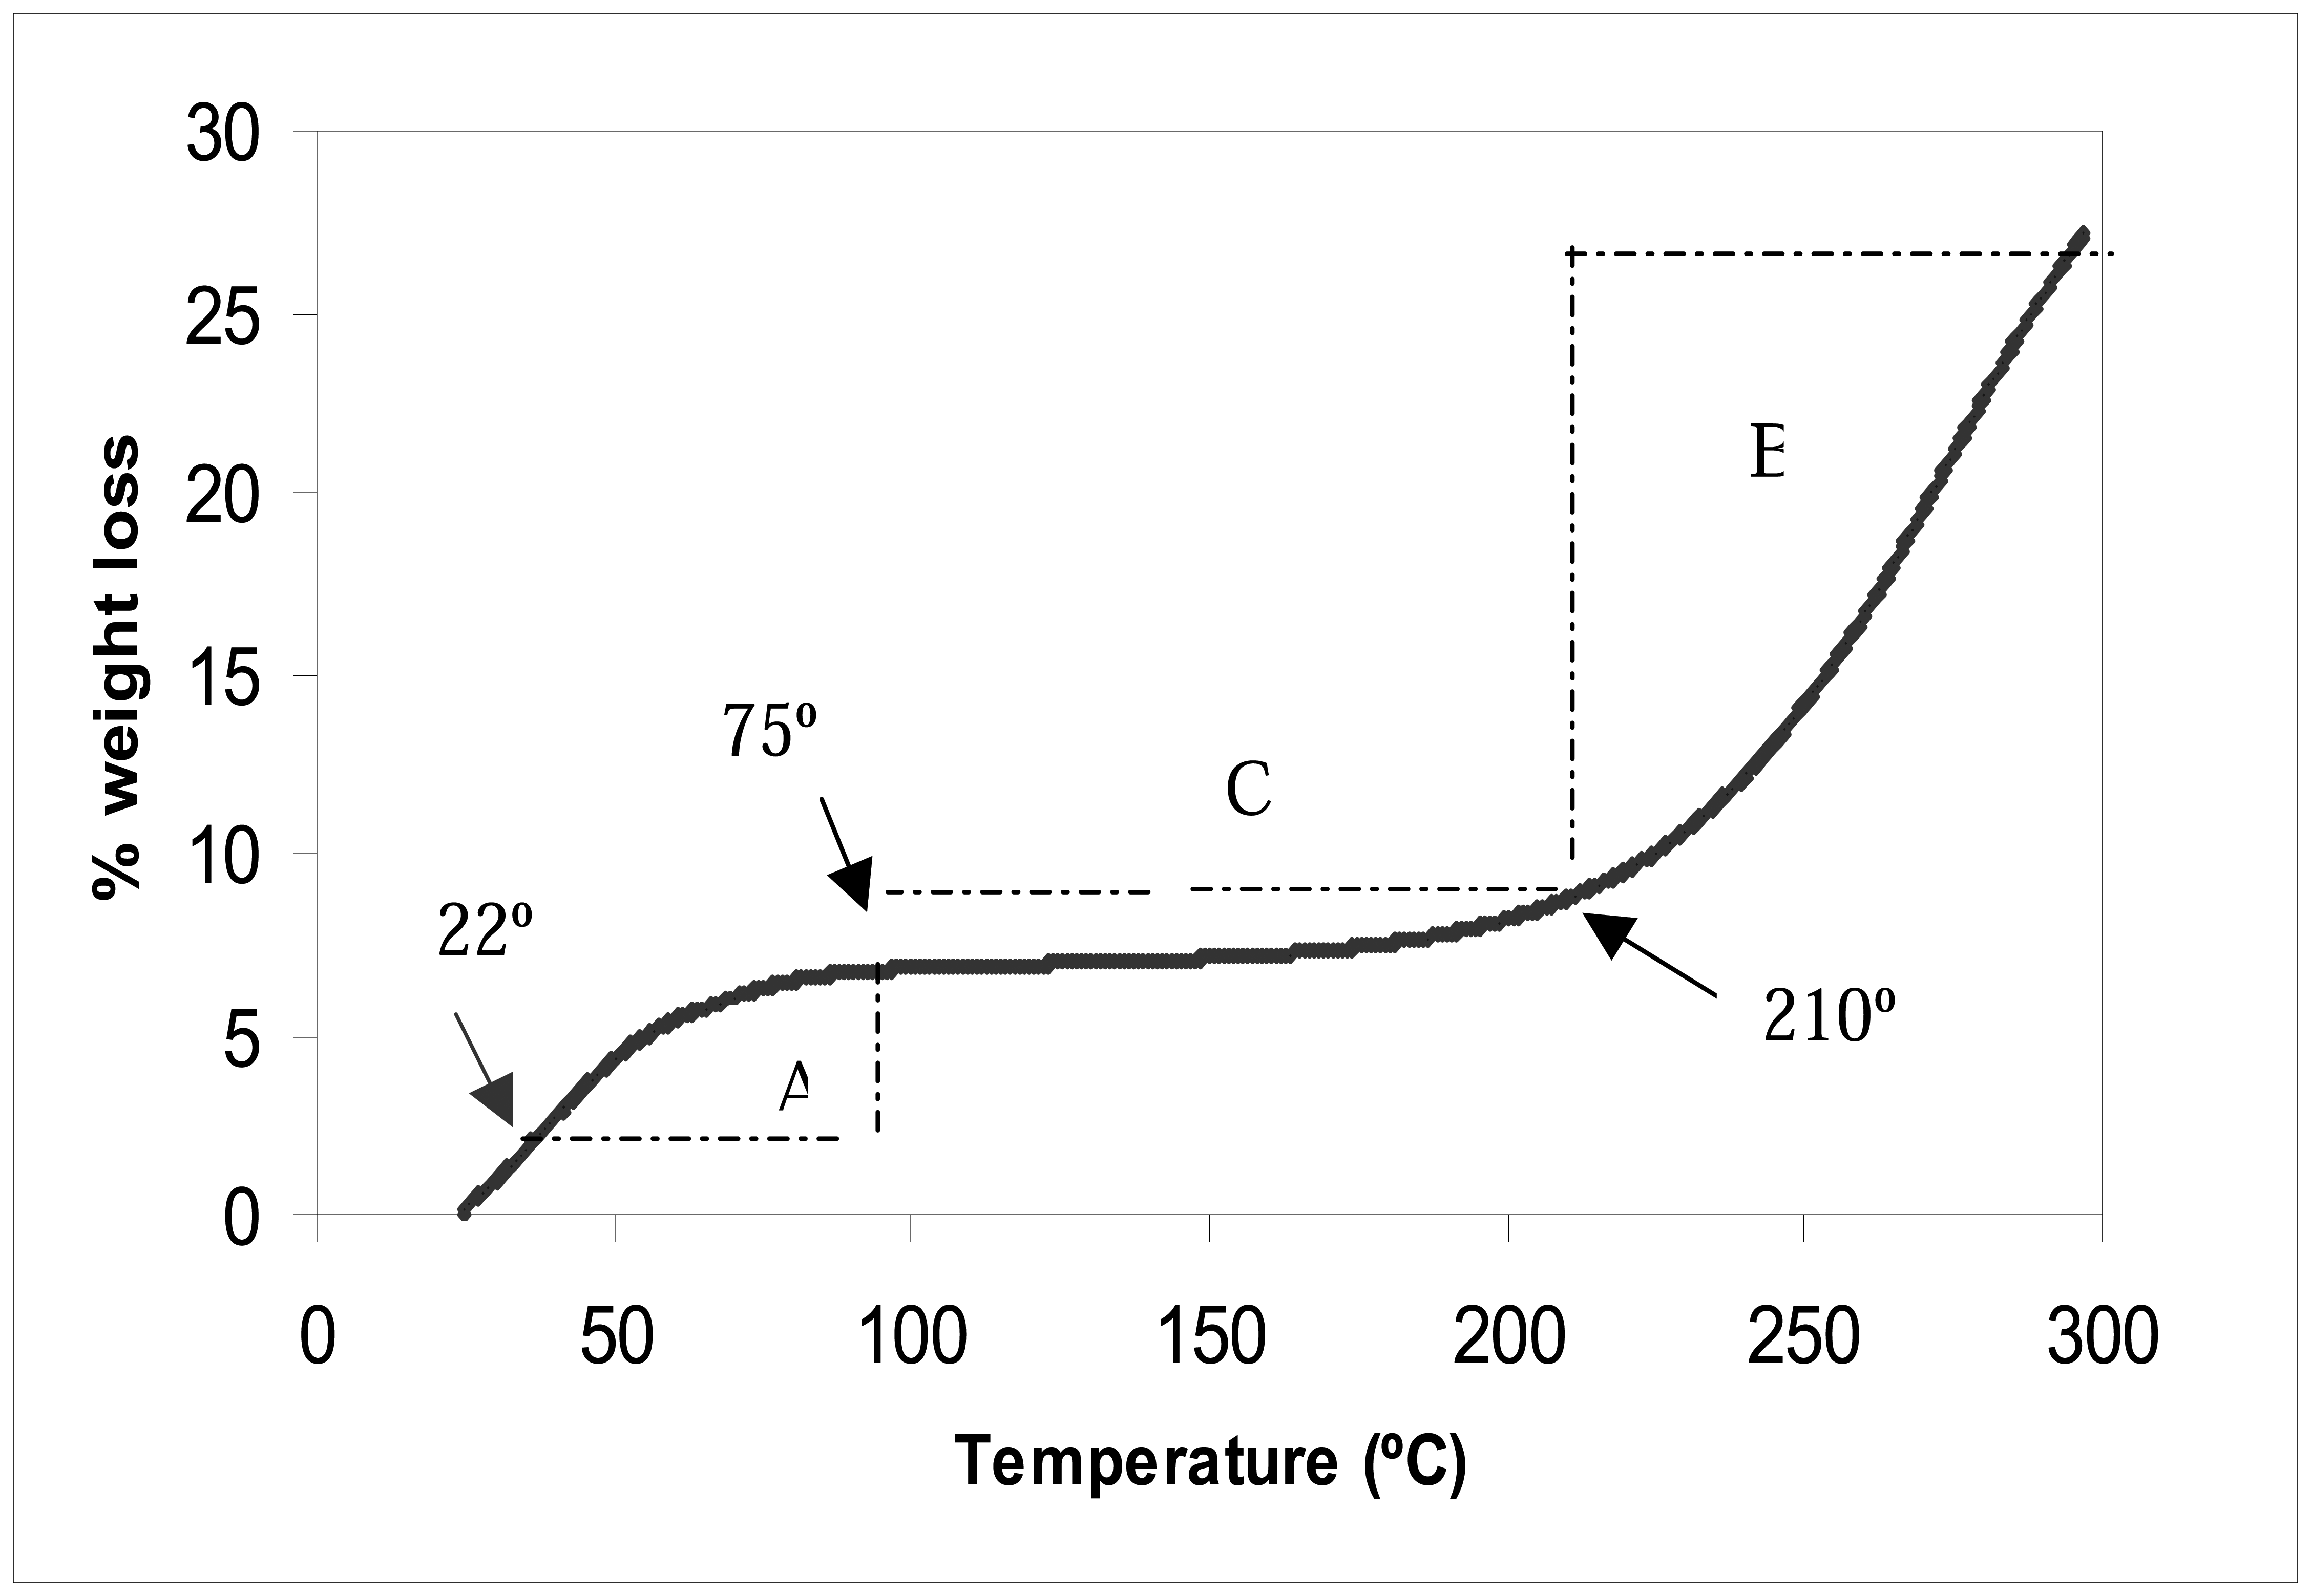
Thermogravimetric (TG) analysis was conducted to study the effect of temperature on the Pani weight. Figure 5 shows the changes in the weight loss of the self doped Pani (65 KDa) after exposing the compound to temperatures ranging from 22°C to 300°C. A similar trend was also observed when testing the 50 and 20 KDa Pani compounds. Figure 5 shows a steep rate of weight loss change in regions A (22°C to 75°C) and B (210°C to 300°C), and a smaller rate of change in region C (75°C to 210°C). From this finding, it is optimal to use the Pani between temperatures ranging from 75°C to 210°C (region C) since a temperature fluctuation within this region would only lead to a small change in Pani weight loss (Figure 5). Since it was shown earlier that the weight of Pani affected the conductive property of the polymer, the use of Pani in region C would ensure minimal changes in the polymer conductive property. Temperature levels at this region, however, are too high for any biological element, such as antibodies, in the biosensor design. An antibody thermal stability study concluded that a heat treatment at 60°C resulted in the cleavage of the antibody heavy and light chains and promoted the denaturation of the protein (18). For this reason, most biosensor operations are conducted in room temperature (~ 25°C) (19, 20). Since the Pani weight is sensitive to temperature changes between 22 °C and 75°C (region A), a temperature-controlled mechanism needs to be introduced to the biosensor design to minimize temperature-dependent variations in the polymer properties.
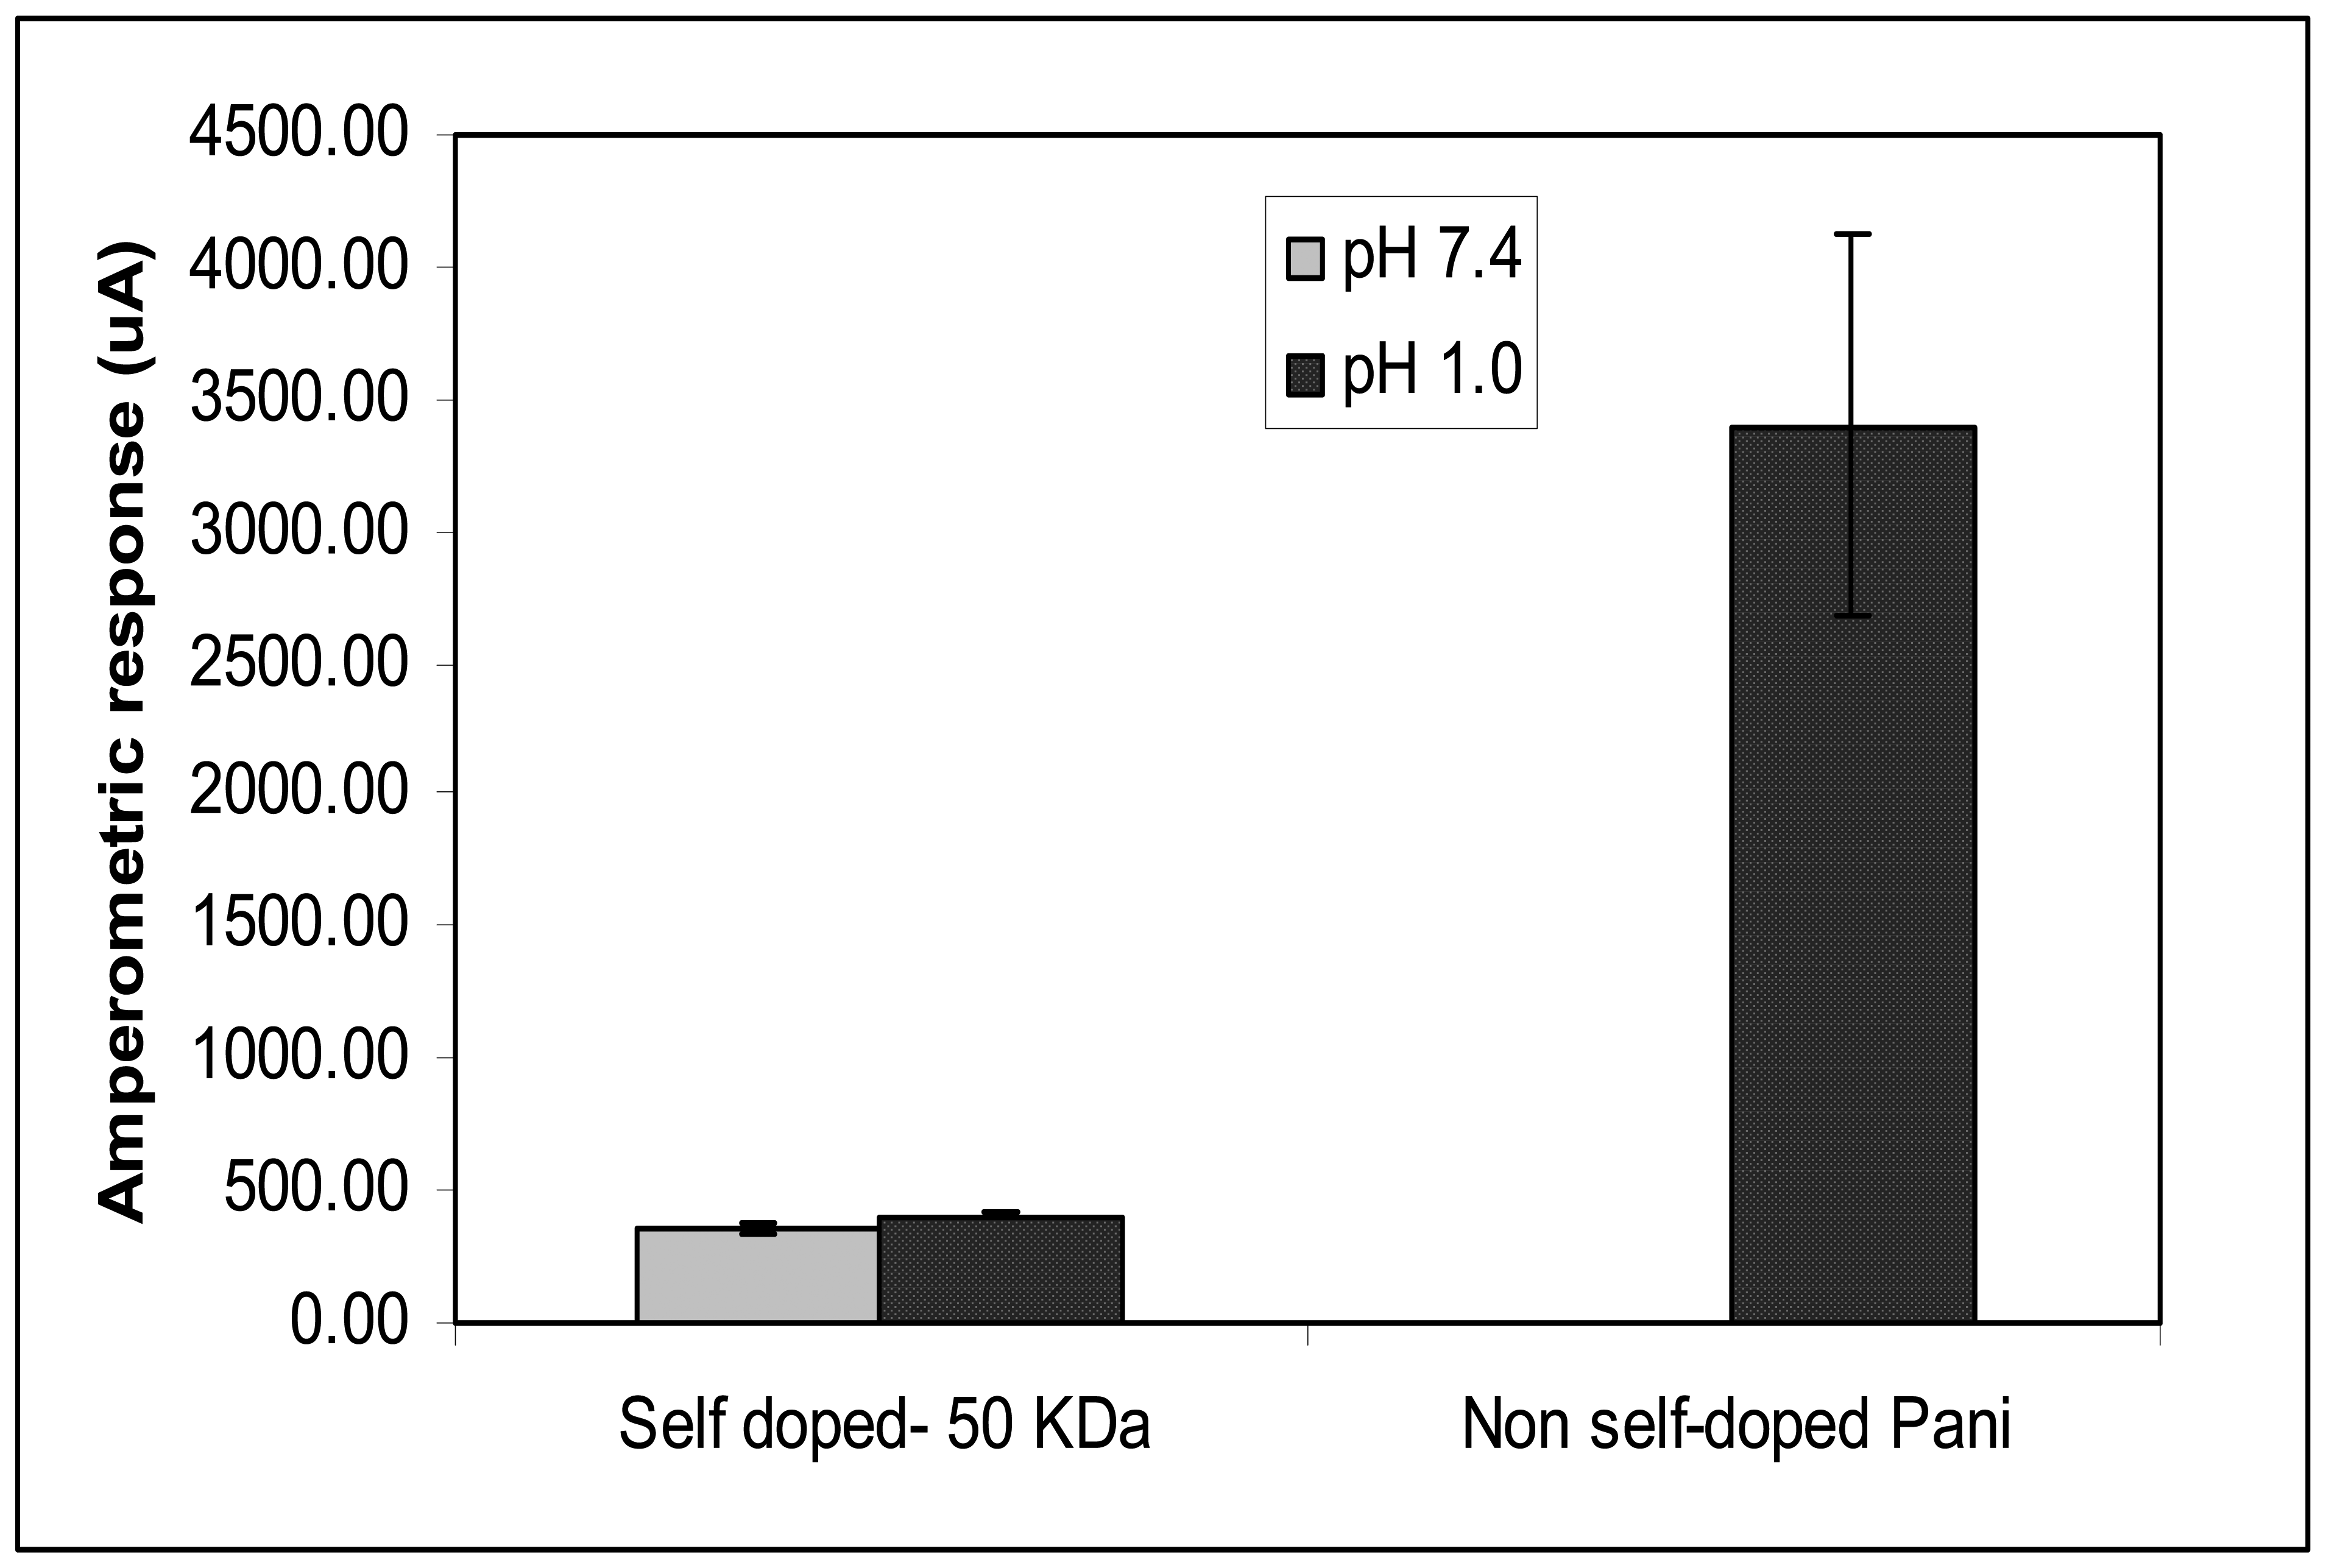
The pH-dependency of Pani compounds was also conducted in this study by testing the self and non-self doped Pani compounds in electrolytes with different pH levels: PB at pH 7.4 and 1 M hydrochloric acid at pH 1.0 (Figure 6). Results show no statistical difference in amperometric responses between the ITO-self doped Pani (50 KDa) tested in PB, and that in 1 M hydrochloric acid. This finding suggests that there are no changes in the conductivity level of the self doped Pani from a highly acidic to a near neutral pH environment. A significant difference in responses however, was observed between the ITO-non self doped Pani in PB and that in 1 M hydrochloric acid. Though the above substrate resulted in a high amperometric response (3400.16 μA) in 1M hydrochloric acid, the ITO-non self doped Pani was observed to be not conductive in PB (Figure 6). Additionally, the amperometric response of the ITO-non self doped Pani substrate was observed to be 10 times higher than that of the 50 KDa self doped Pani (355.78 μA) in 1 M hydrochloric acid. Though the reason for this is not yet stipulated, the difference in types of acids used in the doping process could be a factor for the difference in the conductivity level of the two tested Pani compounds. A study reported that different anions present in a doping acid influenced the conductivity, solubility, and other chemical characteristics of Pani (21, 22). This finding confirms that the conductivity of the non-self doped Pani dependTherefore, in this study, a constant s highly on pH levels and therefore, is not suitable to be used in a neutral pH environment where most immunological reaction occurs optimally (23). Due to this finding, the self doped Pani compounds were chosen to be incorporated in the subsequent biosensor fabrication.

2.2 Concept of detection

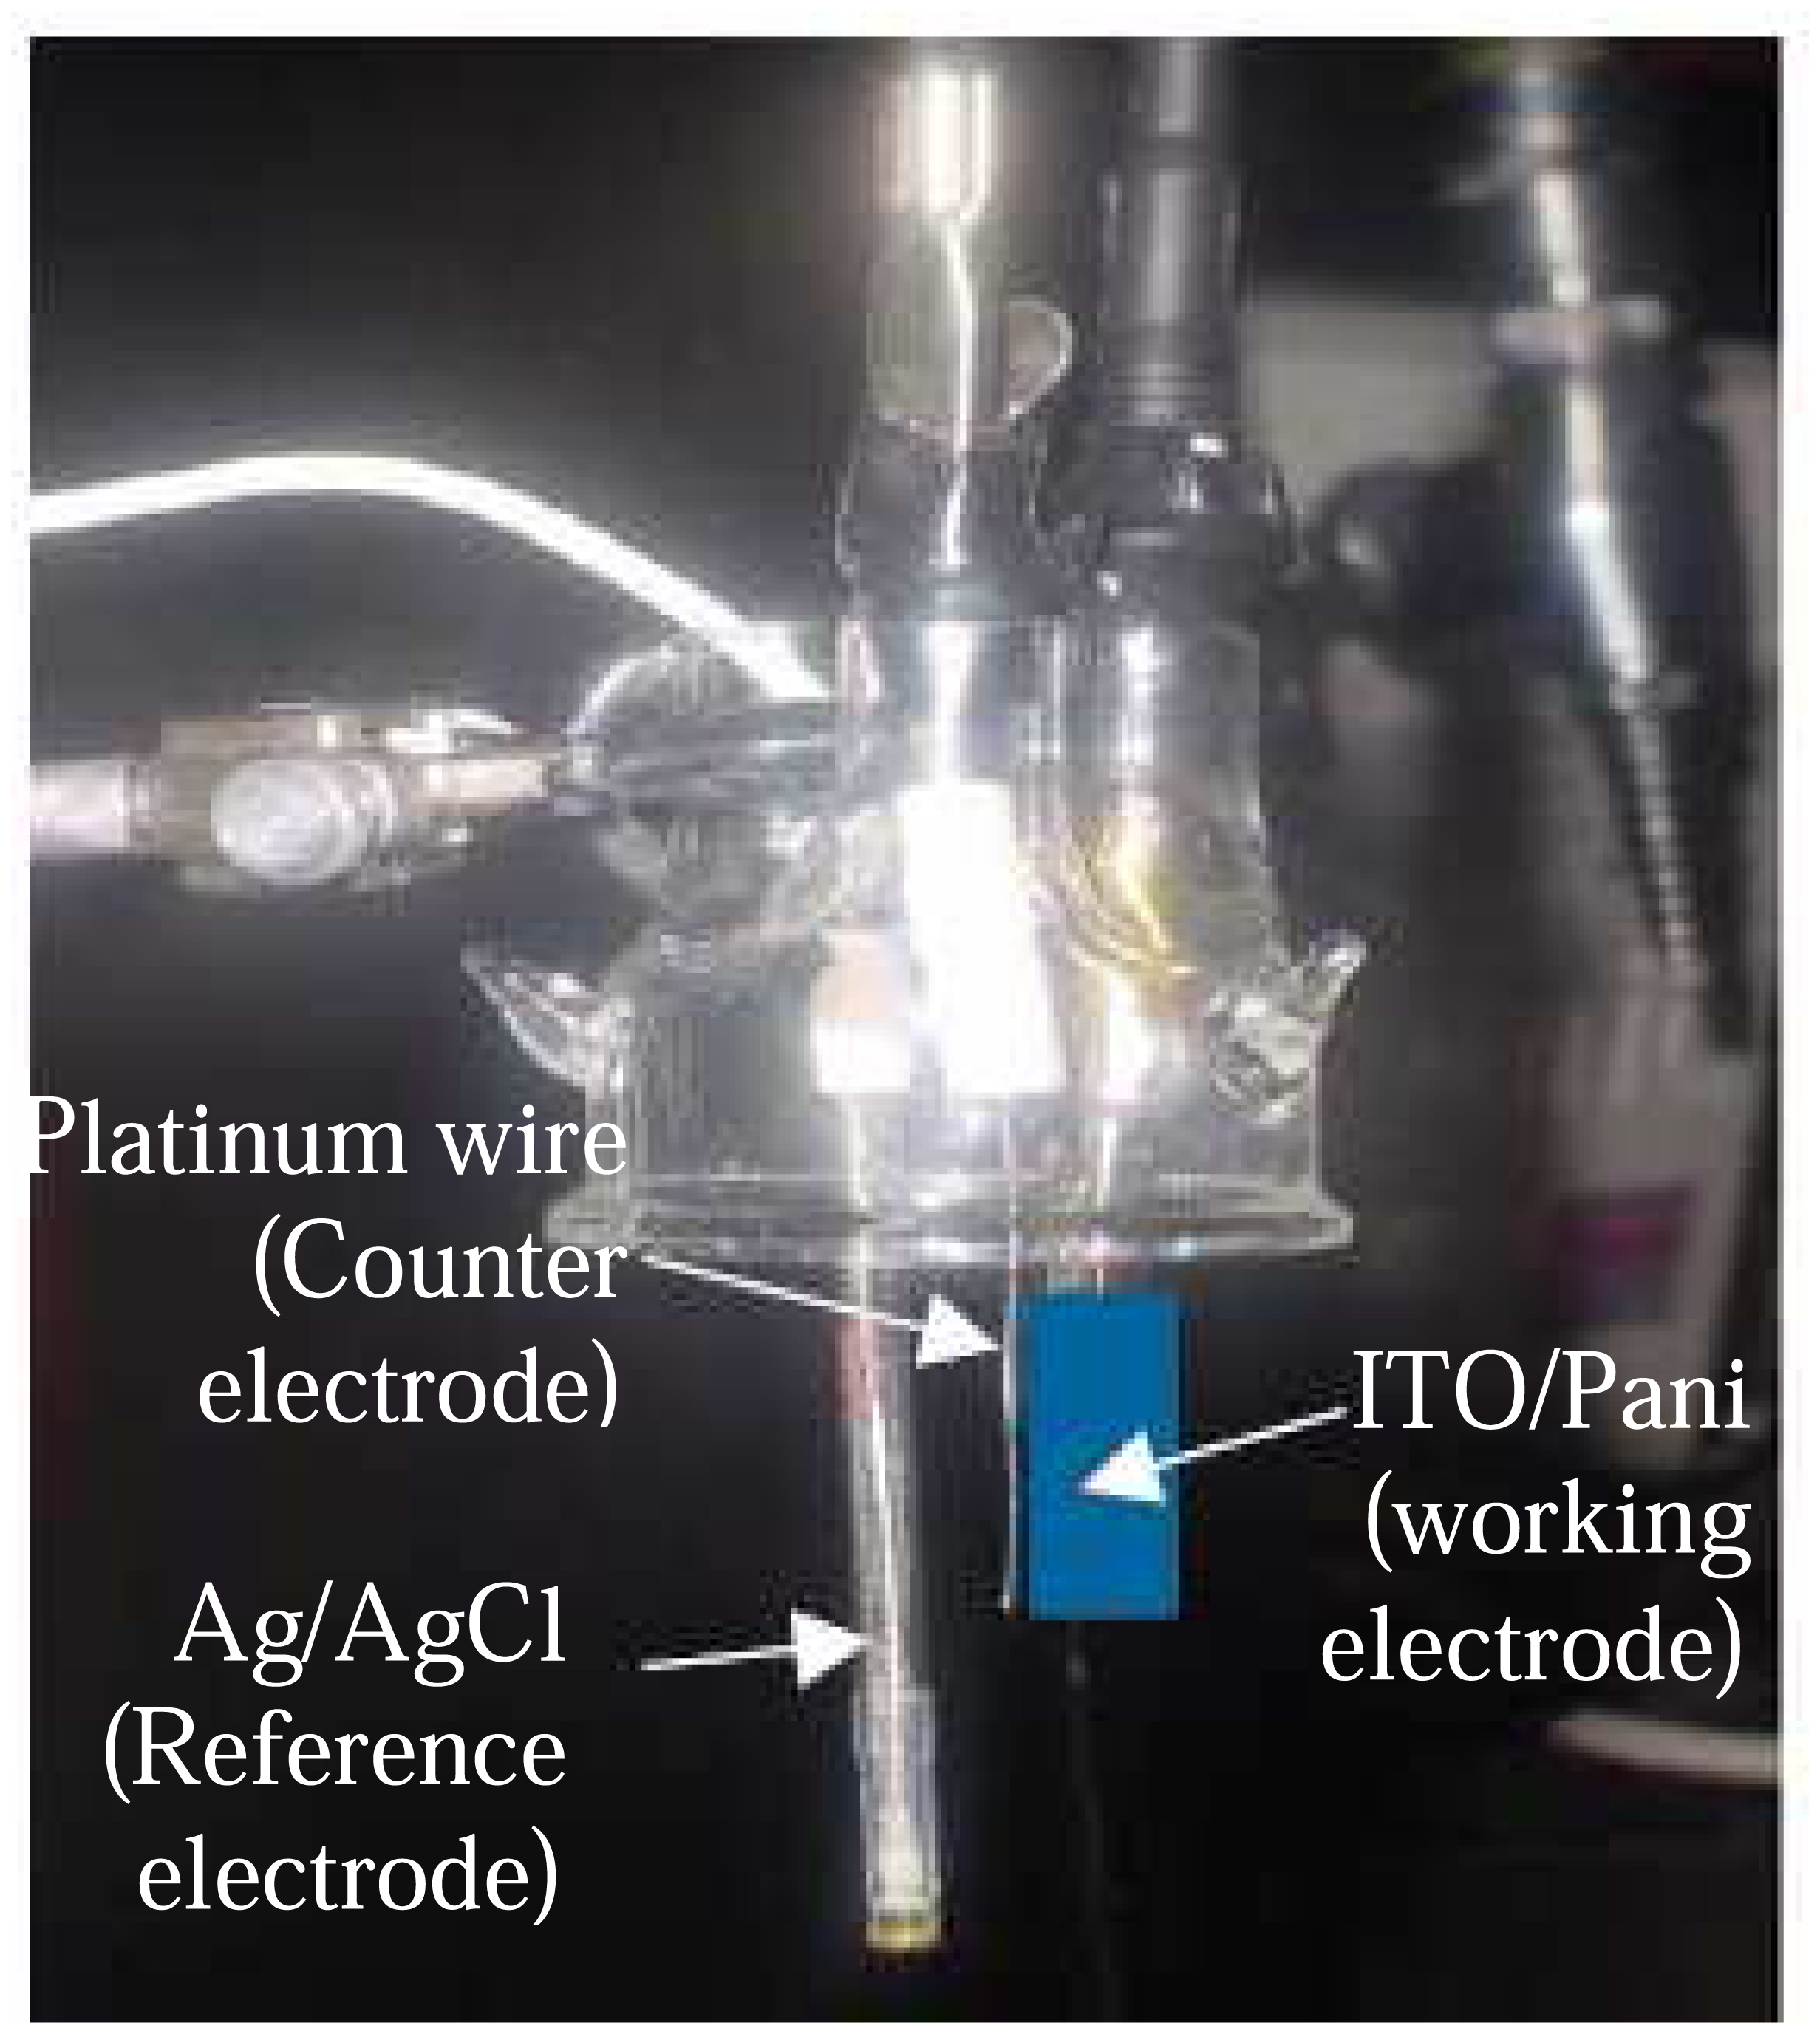
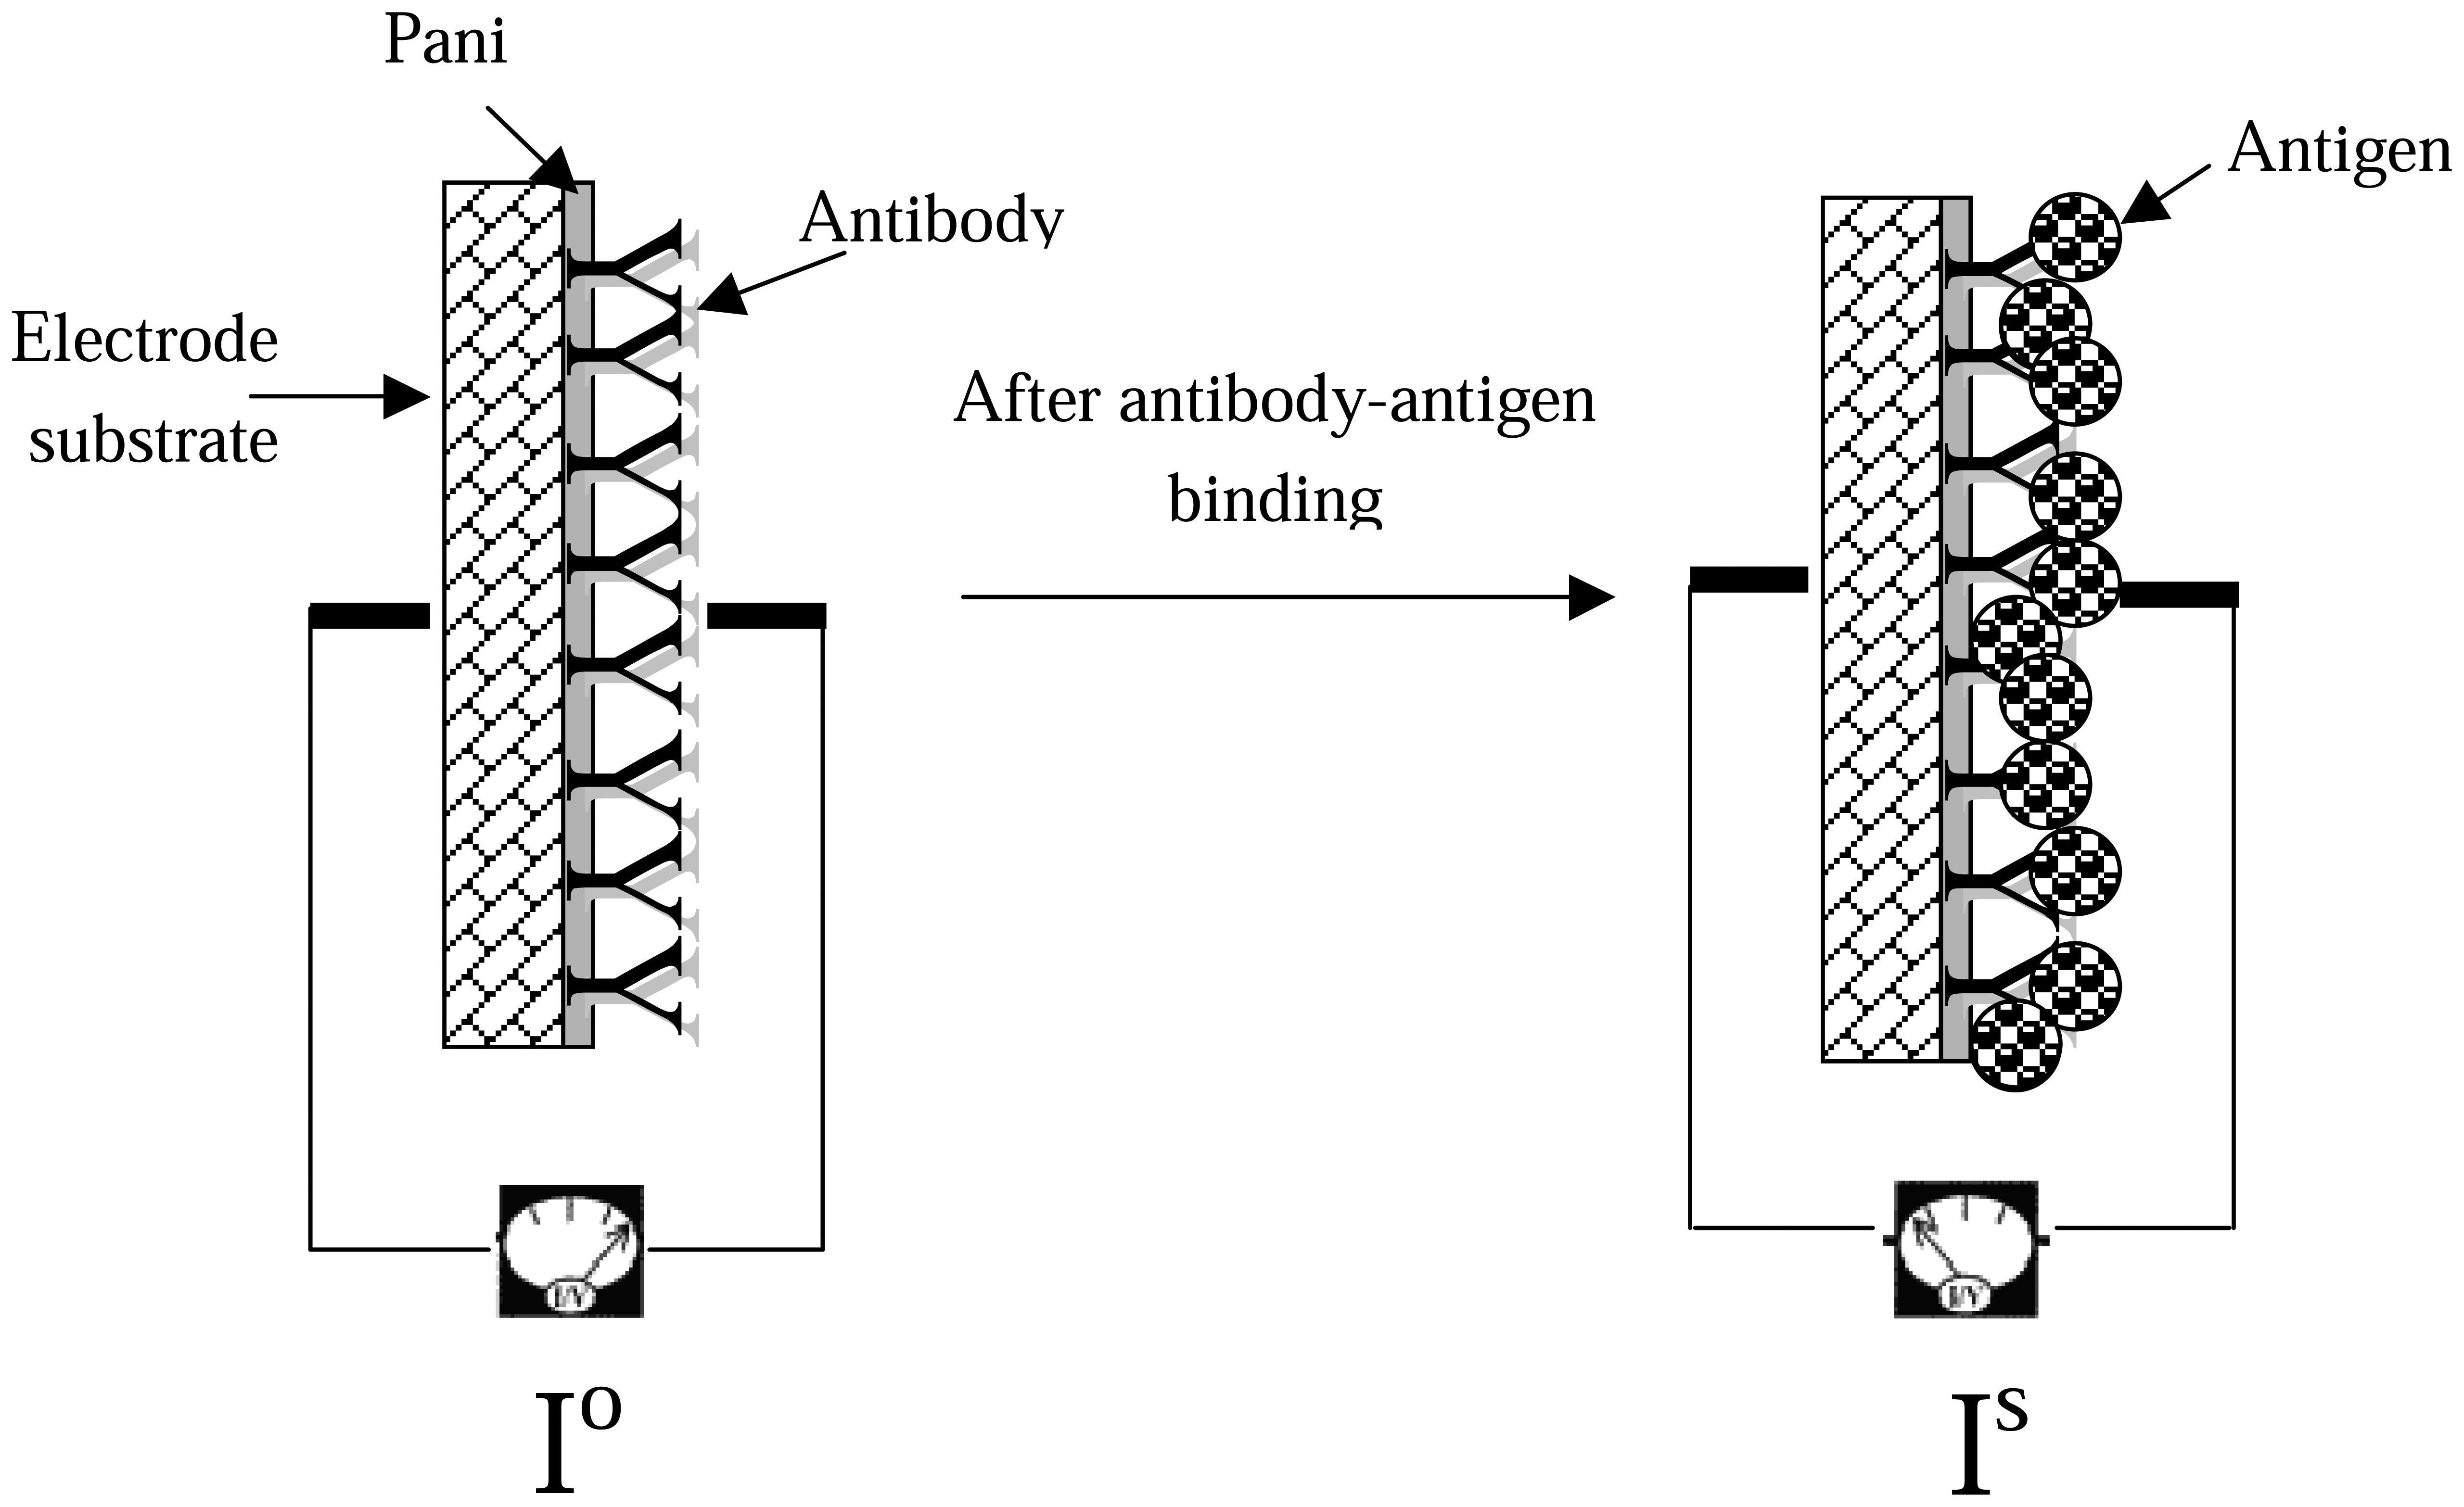
The ITO-Pani biosensor uses a direct antibody-antigen binding format with the self doped Pani as the transducer. By using the three-electrode electrochemical set-up, the input signal is transferred from the auxiliary electrode to the working electrode by the ionic charges forming in the electrolyte solution. When a fixed potential is applied, electrons are allowed to flow freely from the auxiliary electrode to the ITO-Pani substrate (working electrode) due to the conductive property of Pani and ITO substrate. When proteins (e.g., antibodies with a molecular weight of 150 KDa), are immobilized within the polymer backbones, electron flows are restricted. This phenomenon could be caused by the insulating protein membrane, interfering the transfer of electrons within the polymer π-backbone (24). The electron flow is restricted even more when a bigger antigen-antibody complex (molecular weight of BVDV is at least 4 MDa) present within the Pani backbone. It is here hypothesized that the bigger the protein complex present in the Pani backbone, the more restricted is the flow of electron.
A potential of between 0.2 V and 0.8 V has been demonstrated in previous studies to be a sufficient input signal, especially when dealing with whole cells or biological elements (25-27). Therefore, in this study, a constant potential of 0.5 V was chosen arbitrarily as the input signal.
The biosensor detection concept is based on the difference between the signal before (Io) and the signal after (Is) antibody-antigen binding (Figure 8). This current drop (ΔI) is expressed mathematically as Δ I= Io – Is. Theoretically, the higher the current drop between Io and Is, the more antibody-antigen complexes are formed on the biosensor surface, blocking the transfer of electrons. Therefore, the value of current drop (ΔI) should be increasing with increasing antigen concentration.

2.3 Fabrication of ITO-Pani biosensor

The ITO-Pani biosensor consisted of two components: immunosensor and an amperometric measuring device (Figure 8). The immunosensor was constructed from an ITO glass, and layered with Pani and antibodies. The amperometric measuring device was a three electrode electrochemical cell that was connected to a potentiostat and described in detail in the Experimental Section (section 3). The ITO glass is a common substrate used in an amperometric biosensor due to its structural flexibility to bind directly with biological elements (28), stable electrical property with high charge-carrier density (29), and inexpensive production cost. In this study, an ITO glass substrate with a dimension of 1.27 × 2.54 × 0.1 cm3 and a resistance value ranging from 15 to 25 ohms were prepared for biosensor fabrication.
To fabricate the biosensor, the ITO substrate was first cleaned and treated with a strong oxidizing agent, ammonium hydroxide, to enable the adherence of Pani to the ITO substrate (30). Figure 9 shows the increase in thickness with NH4OH. Then, the self doped Pani was layered onto the ITO substrate using a spin coating method. Spin coating method was chosen because of its ease of use, rapid processing time, reproducibility and is inexpensive compared to other types of polymer coating mechanism, such as Langmuir-Bloggert technique (31) or layer by layer molecular deposition (
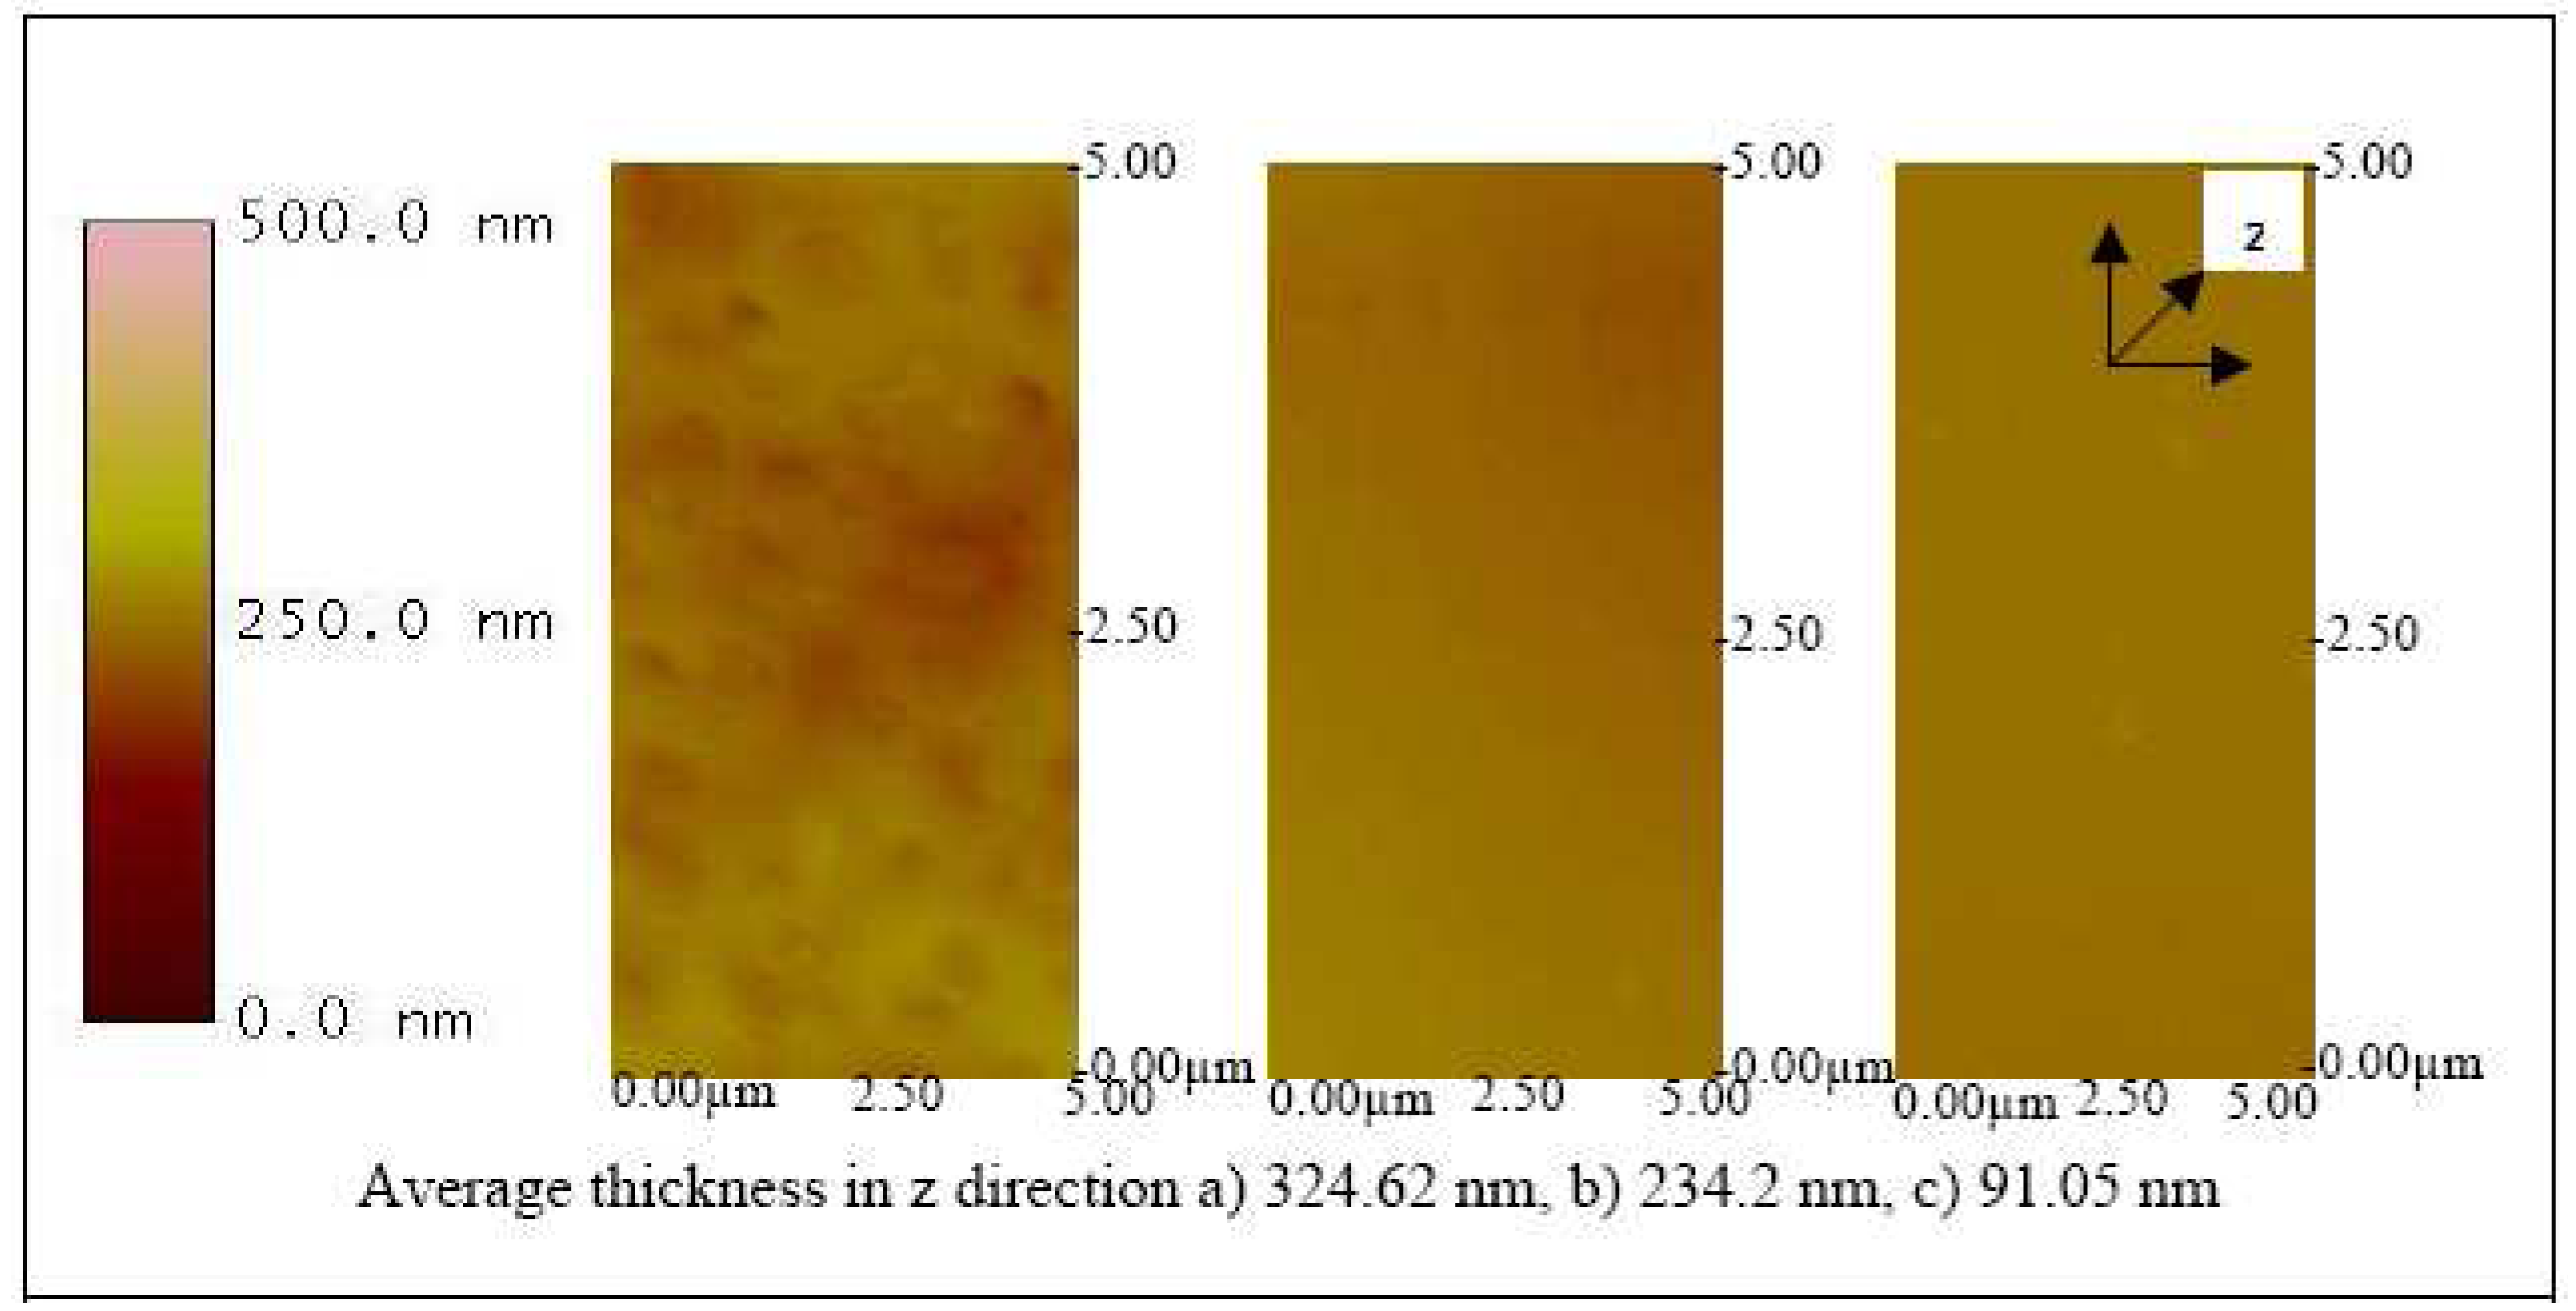
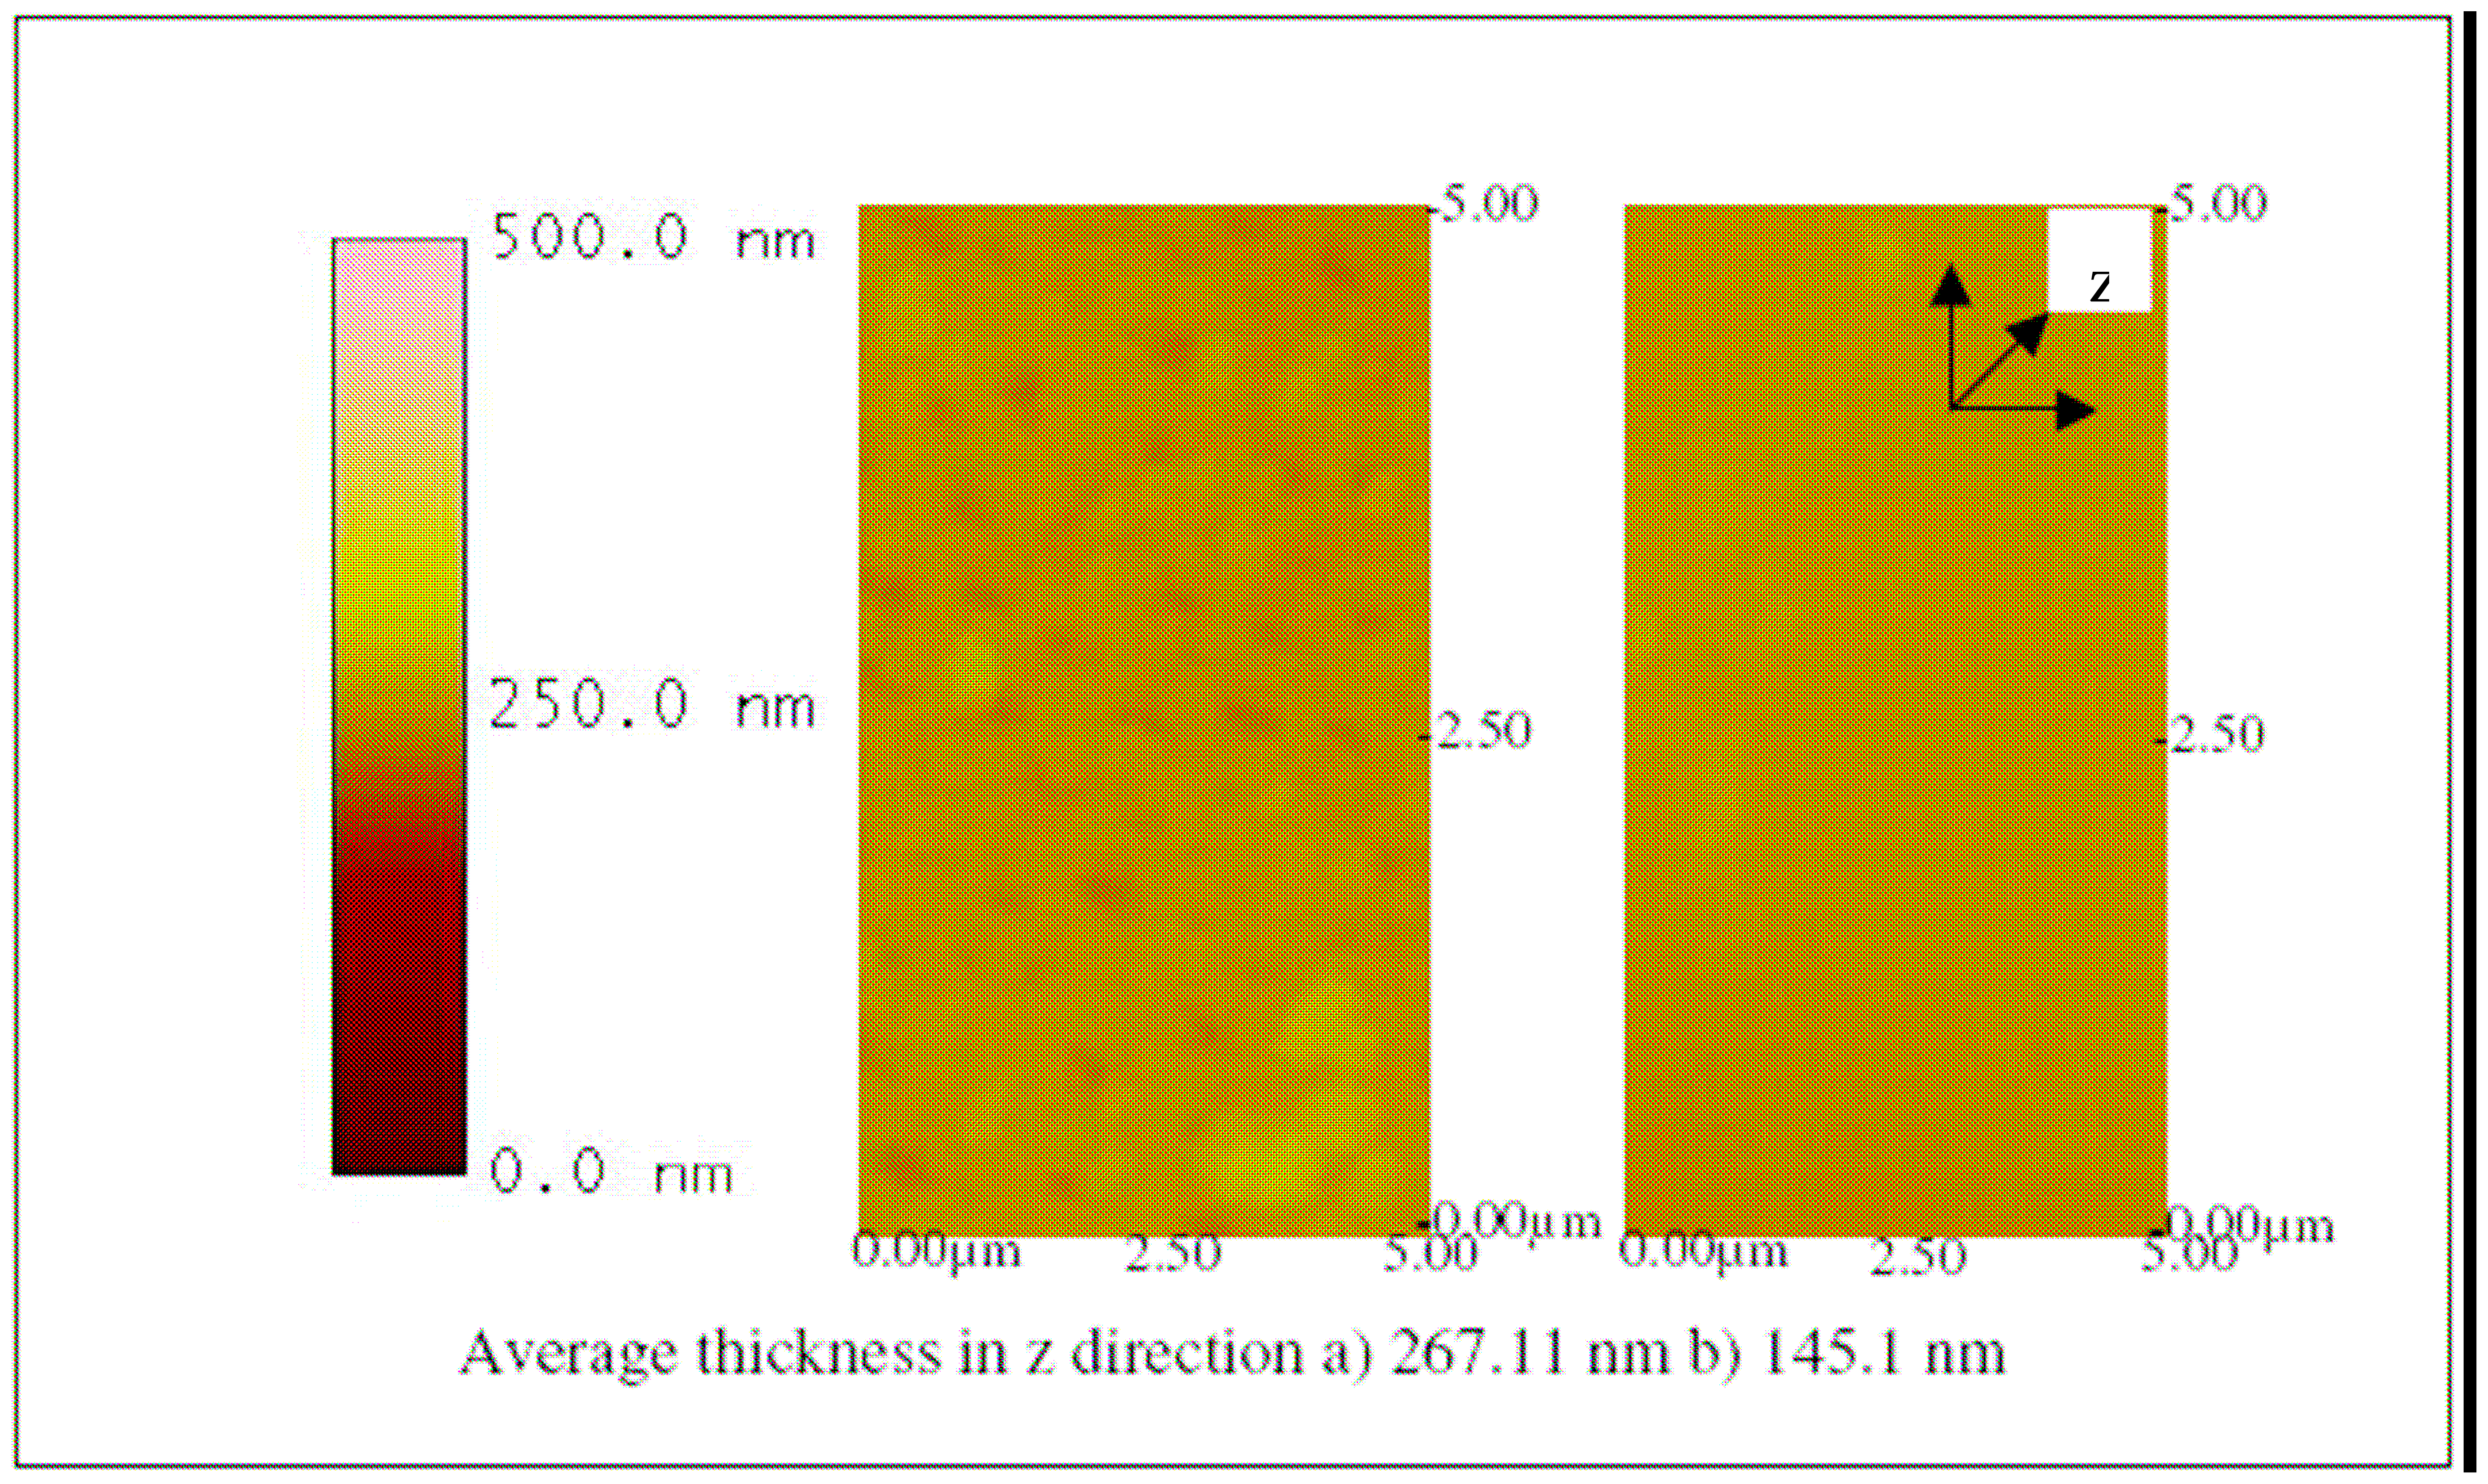
32). With a speed of 500 rpm for 6 seconds, a thickness of 324.62, 234.2, and 91.05 nm were observed on the ITO substrates coated with 65, 50 and 20 KDa Pani, respectively (Figure 10). After the coating procedure, the substrate was then functionalized into a biosensor by immobilizing antibodies onto the surface. A three-electrode electrochemical cell was used to charge the substrate by applying a small (0.5 V) negative potential. This step was essential to promote electrostatic bonding between the negatively charged substrate and the NH+ site of the antibodies (33). The use of a divalent crosslinker, glutaraldehyde, also helped facilitate the antibody binding mechanism (34, 35).
The successful fabrication of the biosensor was evaluated by using an atomic force microscope (AFM). Figures 9, 10, 11, 12, 13 and 14 show AFM images of an ITO-Pani biosensor prepared with 20, 50, and 65 KDa Pani, functionalized with antibodies, and incubated with 104 and 10
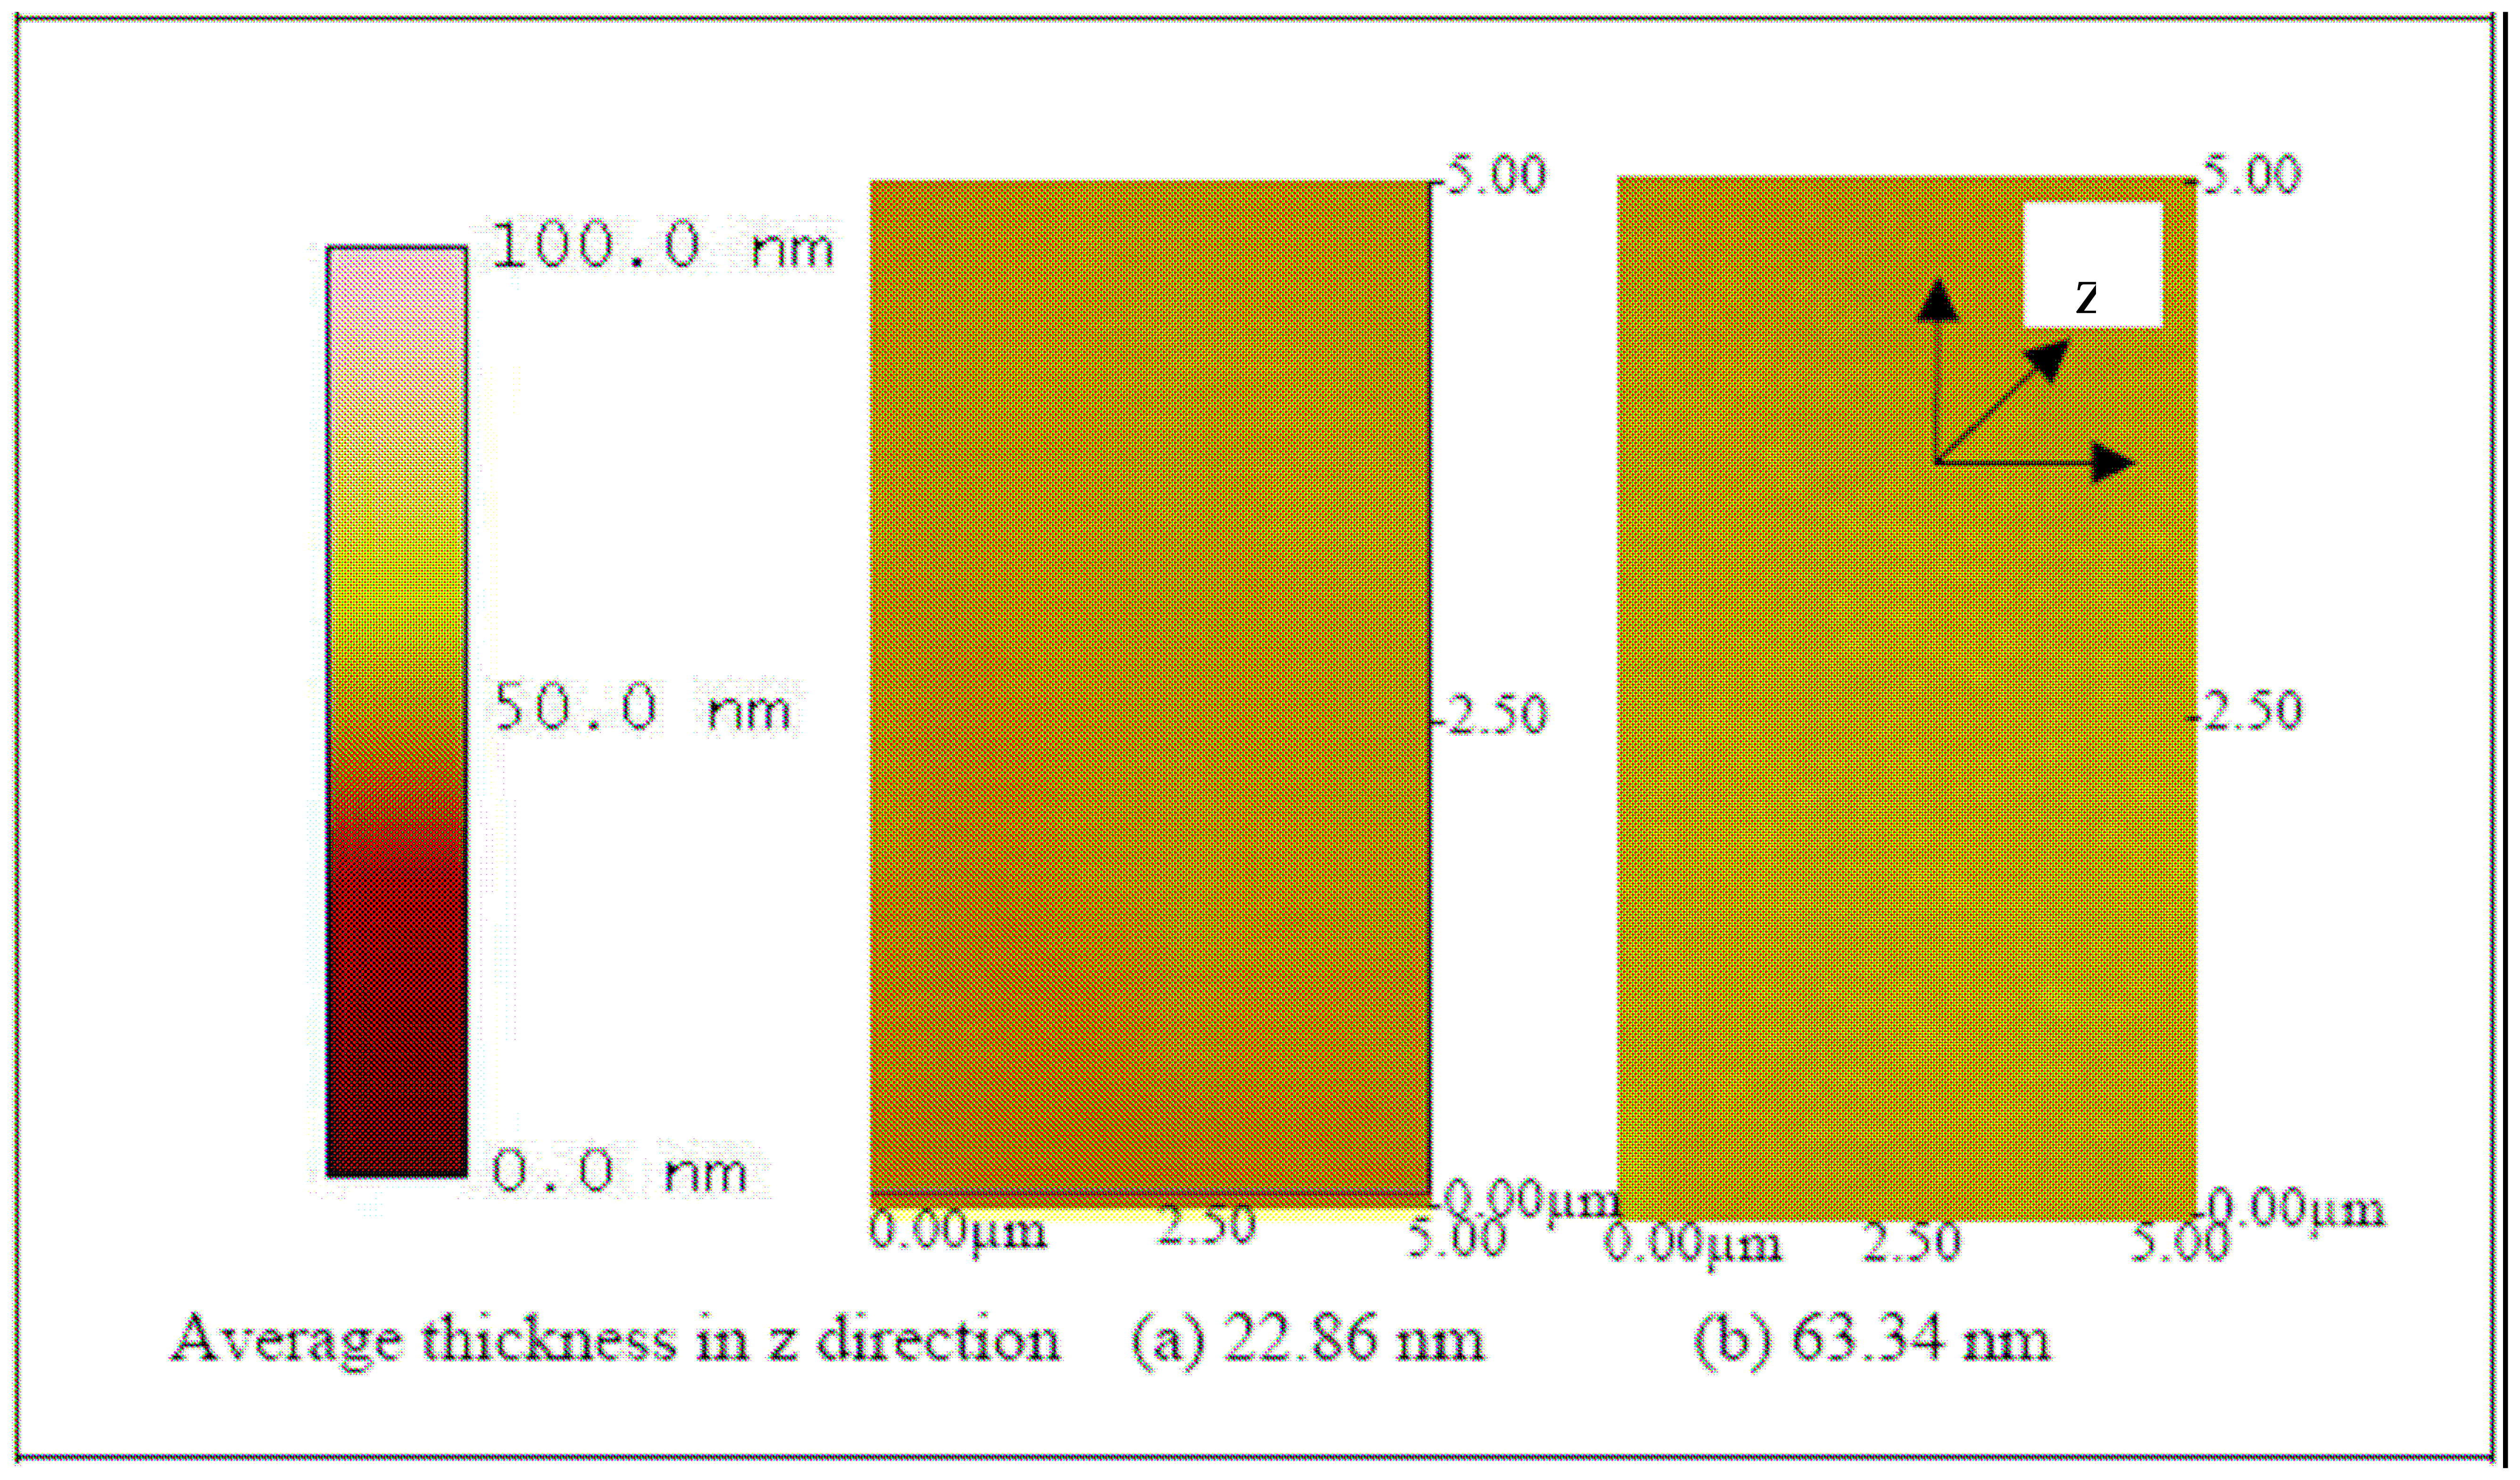
6 CCID/ ml of BVDV. An increase in height in the z direction (thickness) between plain ITO (Figure 9) and ITO-Pani substrates (Figure 10) indicates successful polymer coating. Figure 10 also shows that the higher molecular weight Pani formed a thicker layer on the ITO substrate. Similarly, an increase in thickness was observed in 
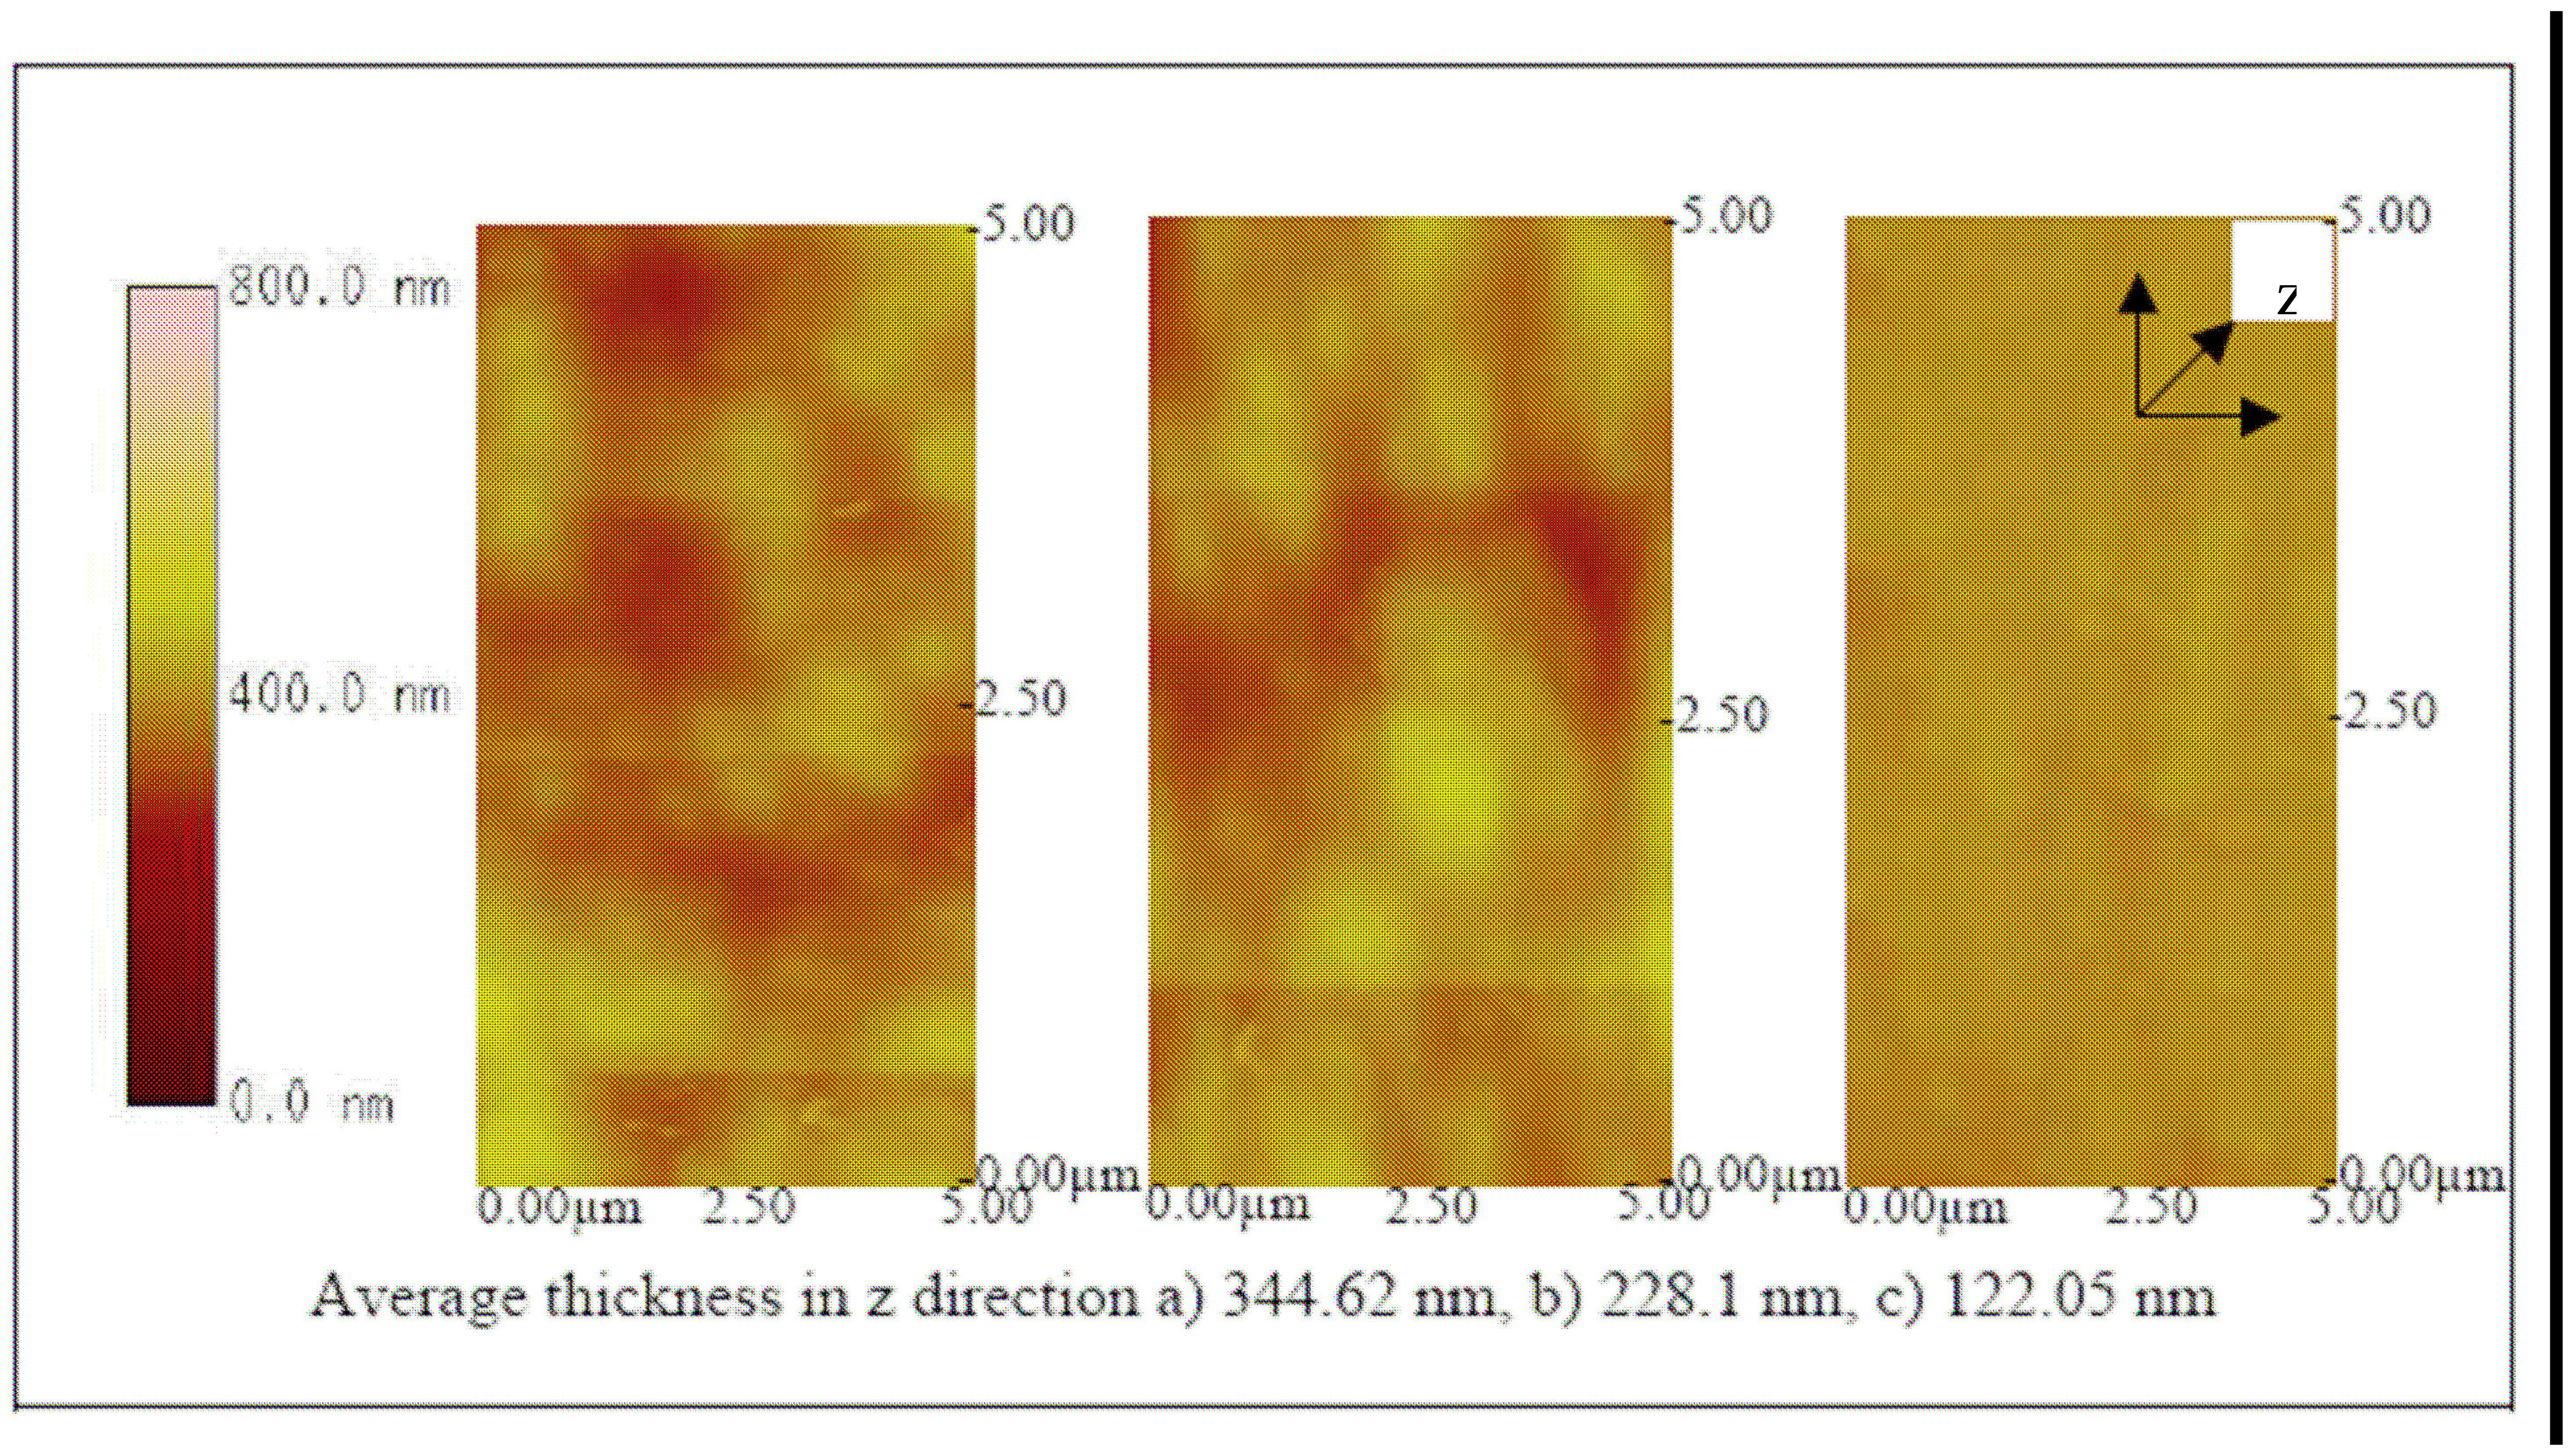
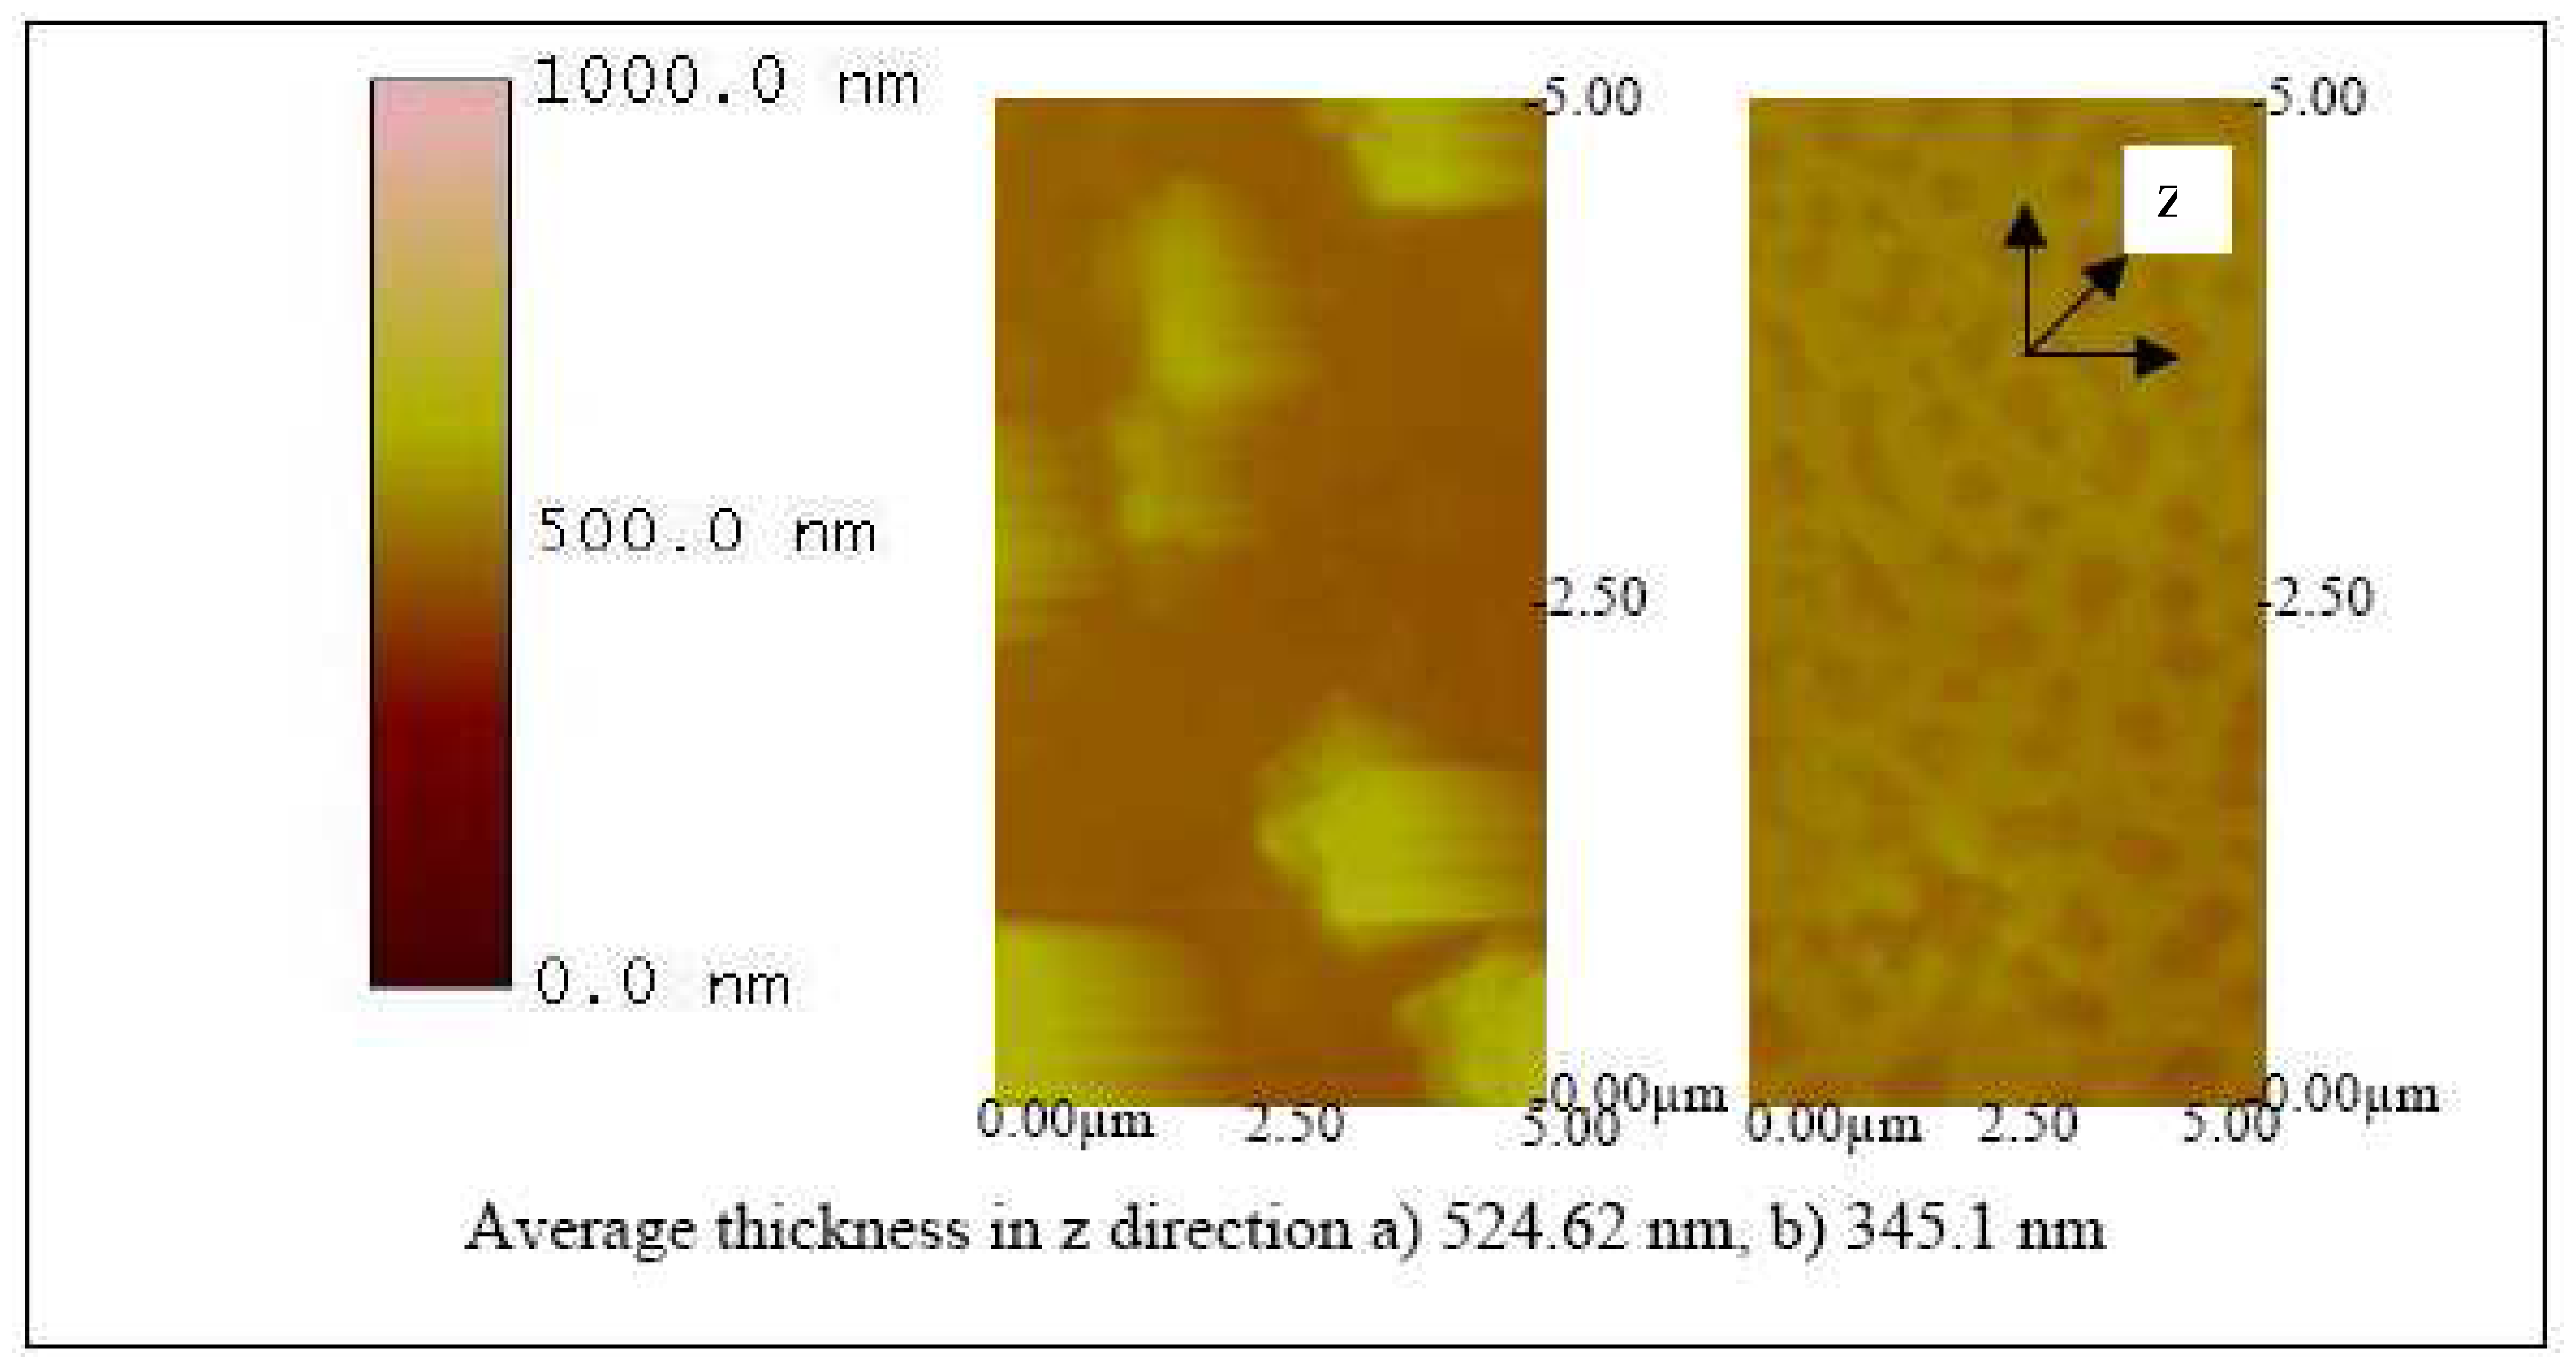
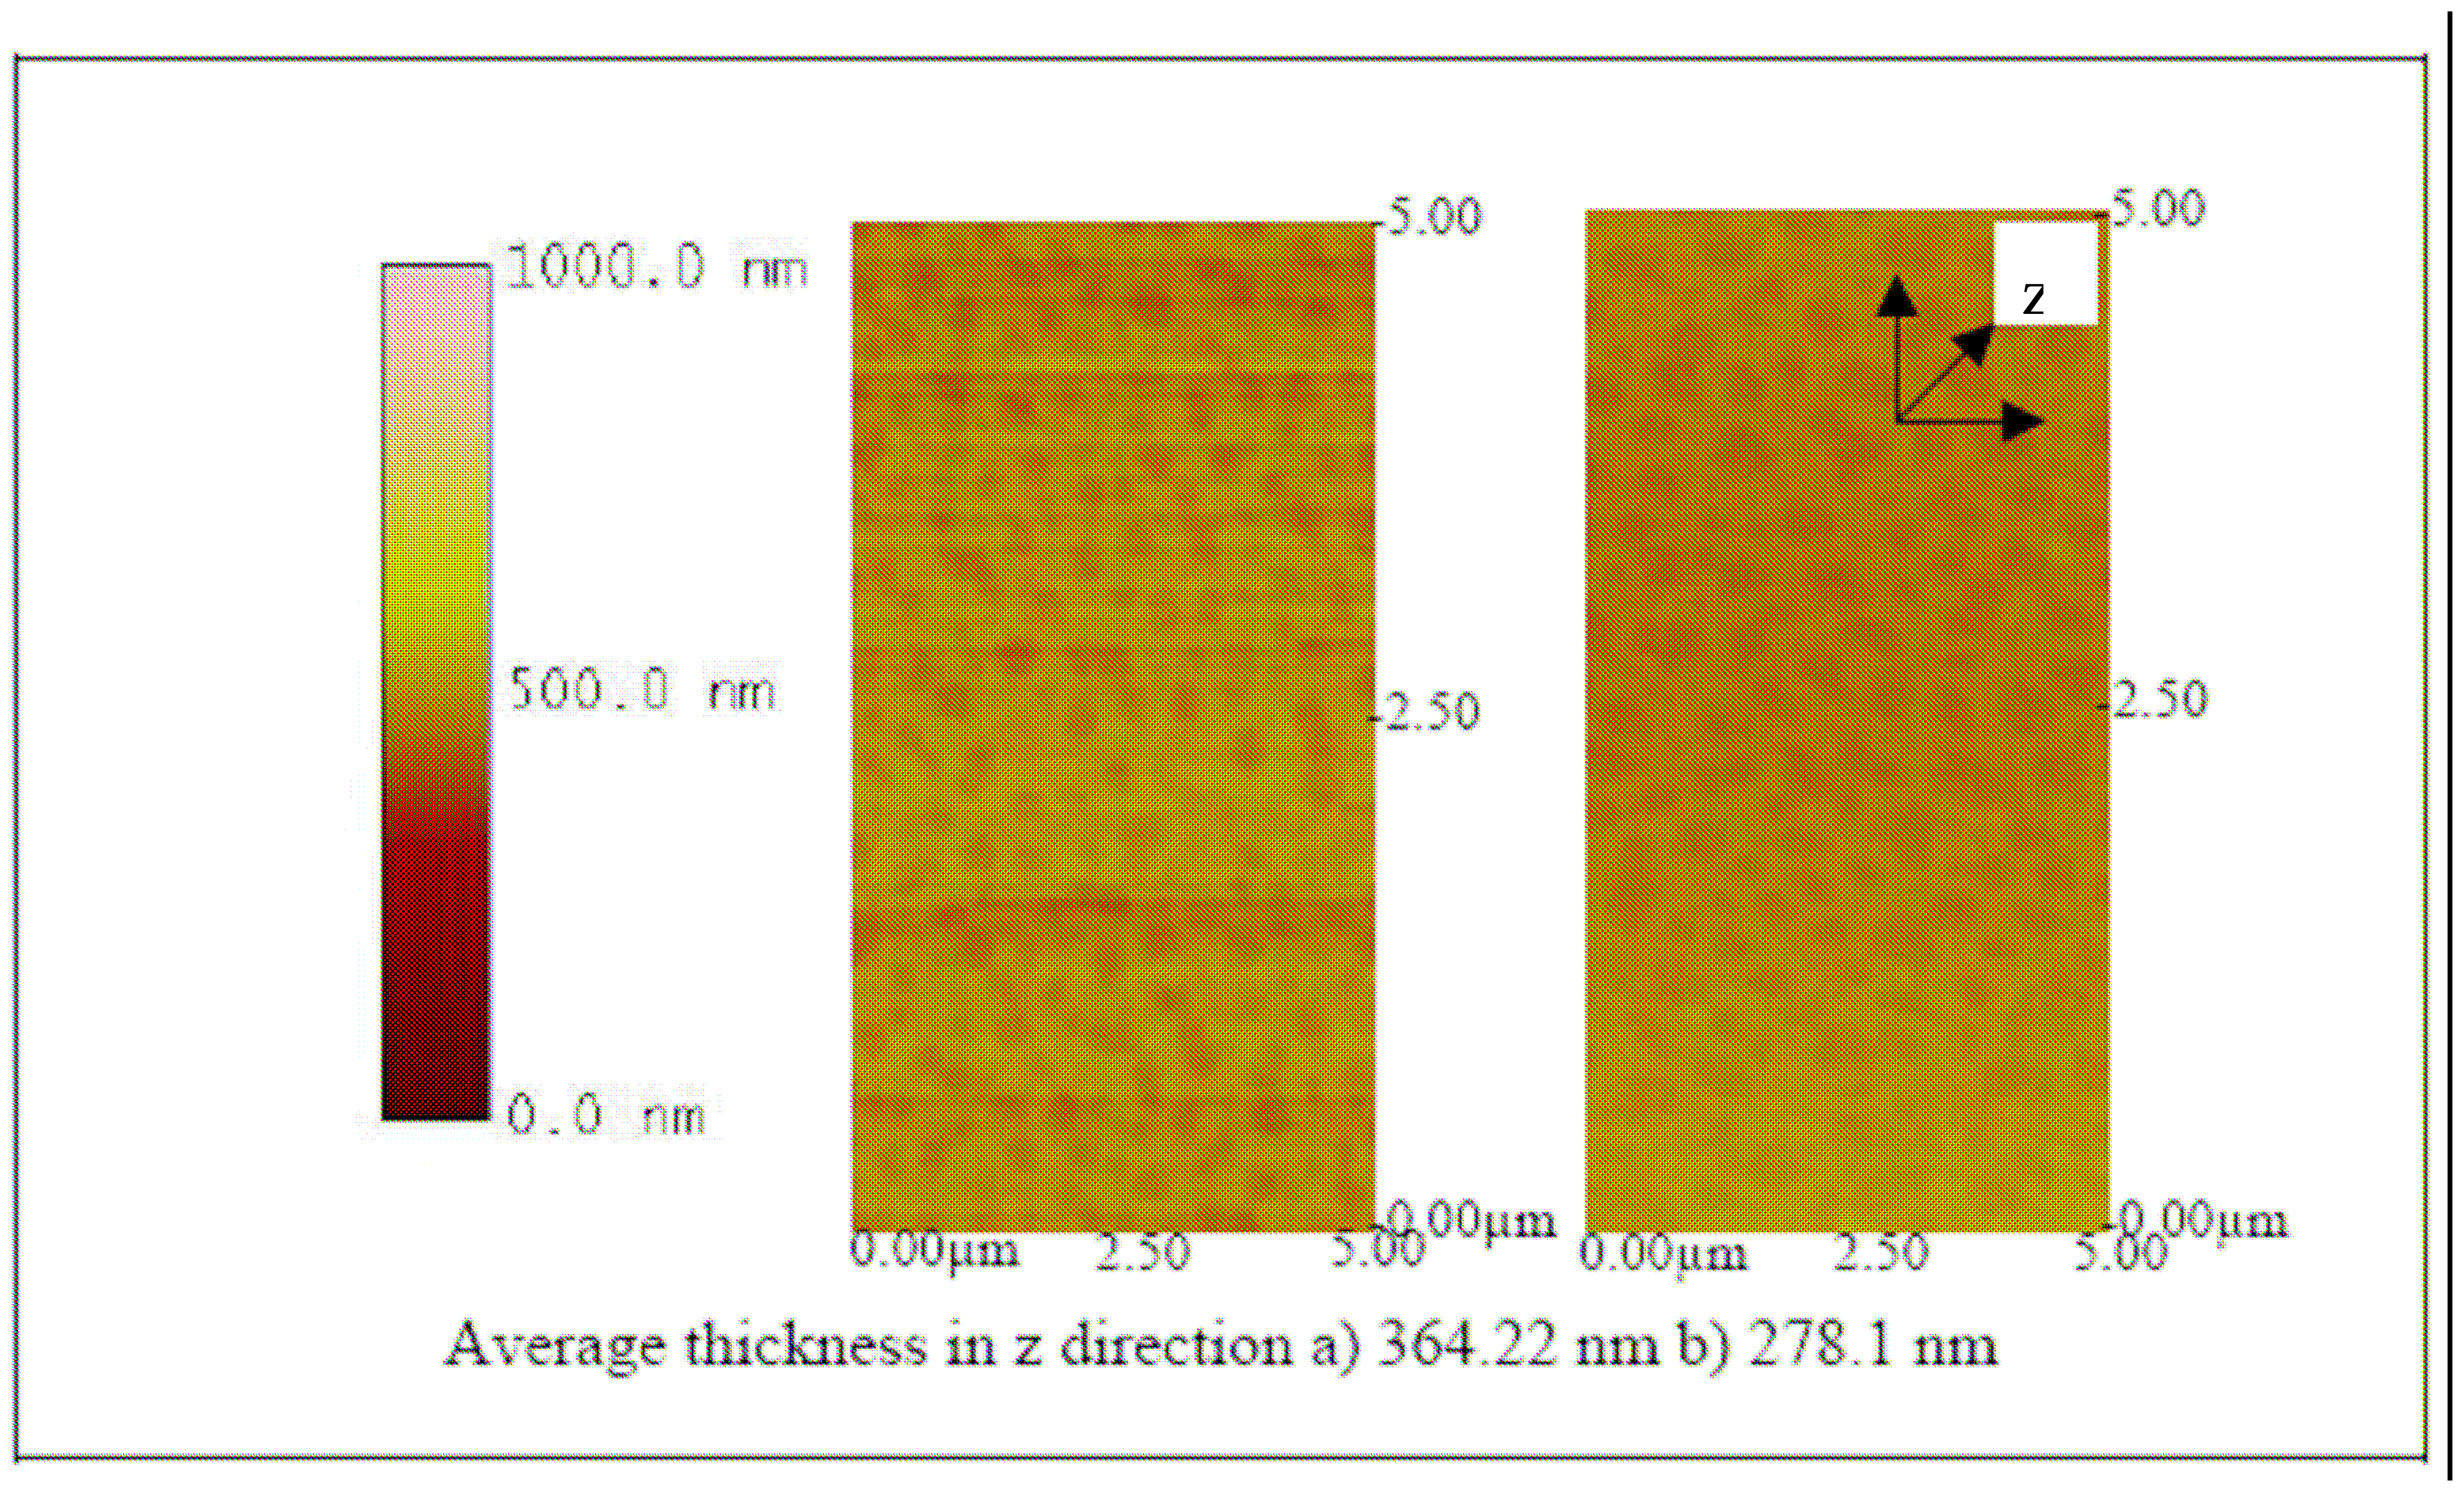
Figure 11 where each of the ITO-Pani substrate was immobilized with antibodies, suggesting successful antibody immobilization. More importantly, Figures 12, 13 and 14 show the AFM images of the biosensor surface after incubating them in various concentrations of BVDV cultures. A thicker substrate was observed when incubating the biosensor with the higher concentration of BVDV, supporting the logical phenomenon that the higher the antigen concentration, the more antibody-antigen complex occurs. When the biosensors were tested with the same level of BVDV concentration (e.g., 106 CCID/ml), biosensors coated with the higher molecular weight Pani (e.g., 65 KDa) were observed to be thicker than that with a lower molecular weight (e.g., 20 KDa) (Figures 12, 13 and 14). This finding shows that the higher the molecular weight of Pani, the more antibody binding sites is available. This finding is further confirmed in the subsequent experiment.
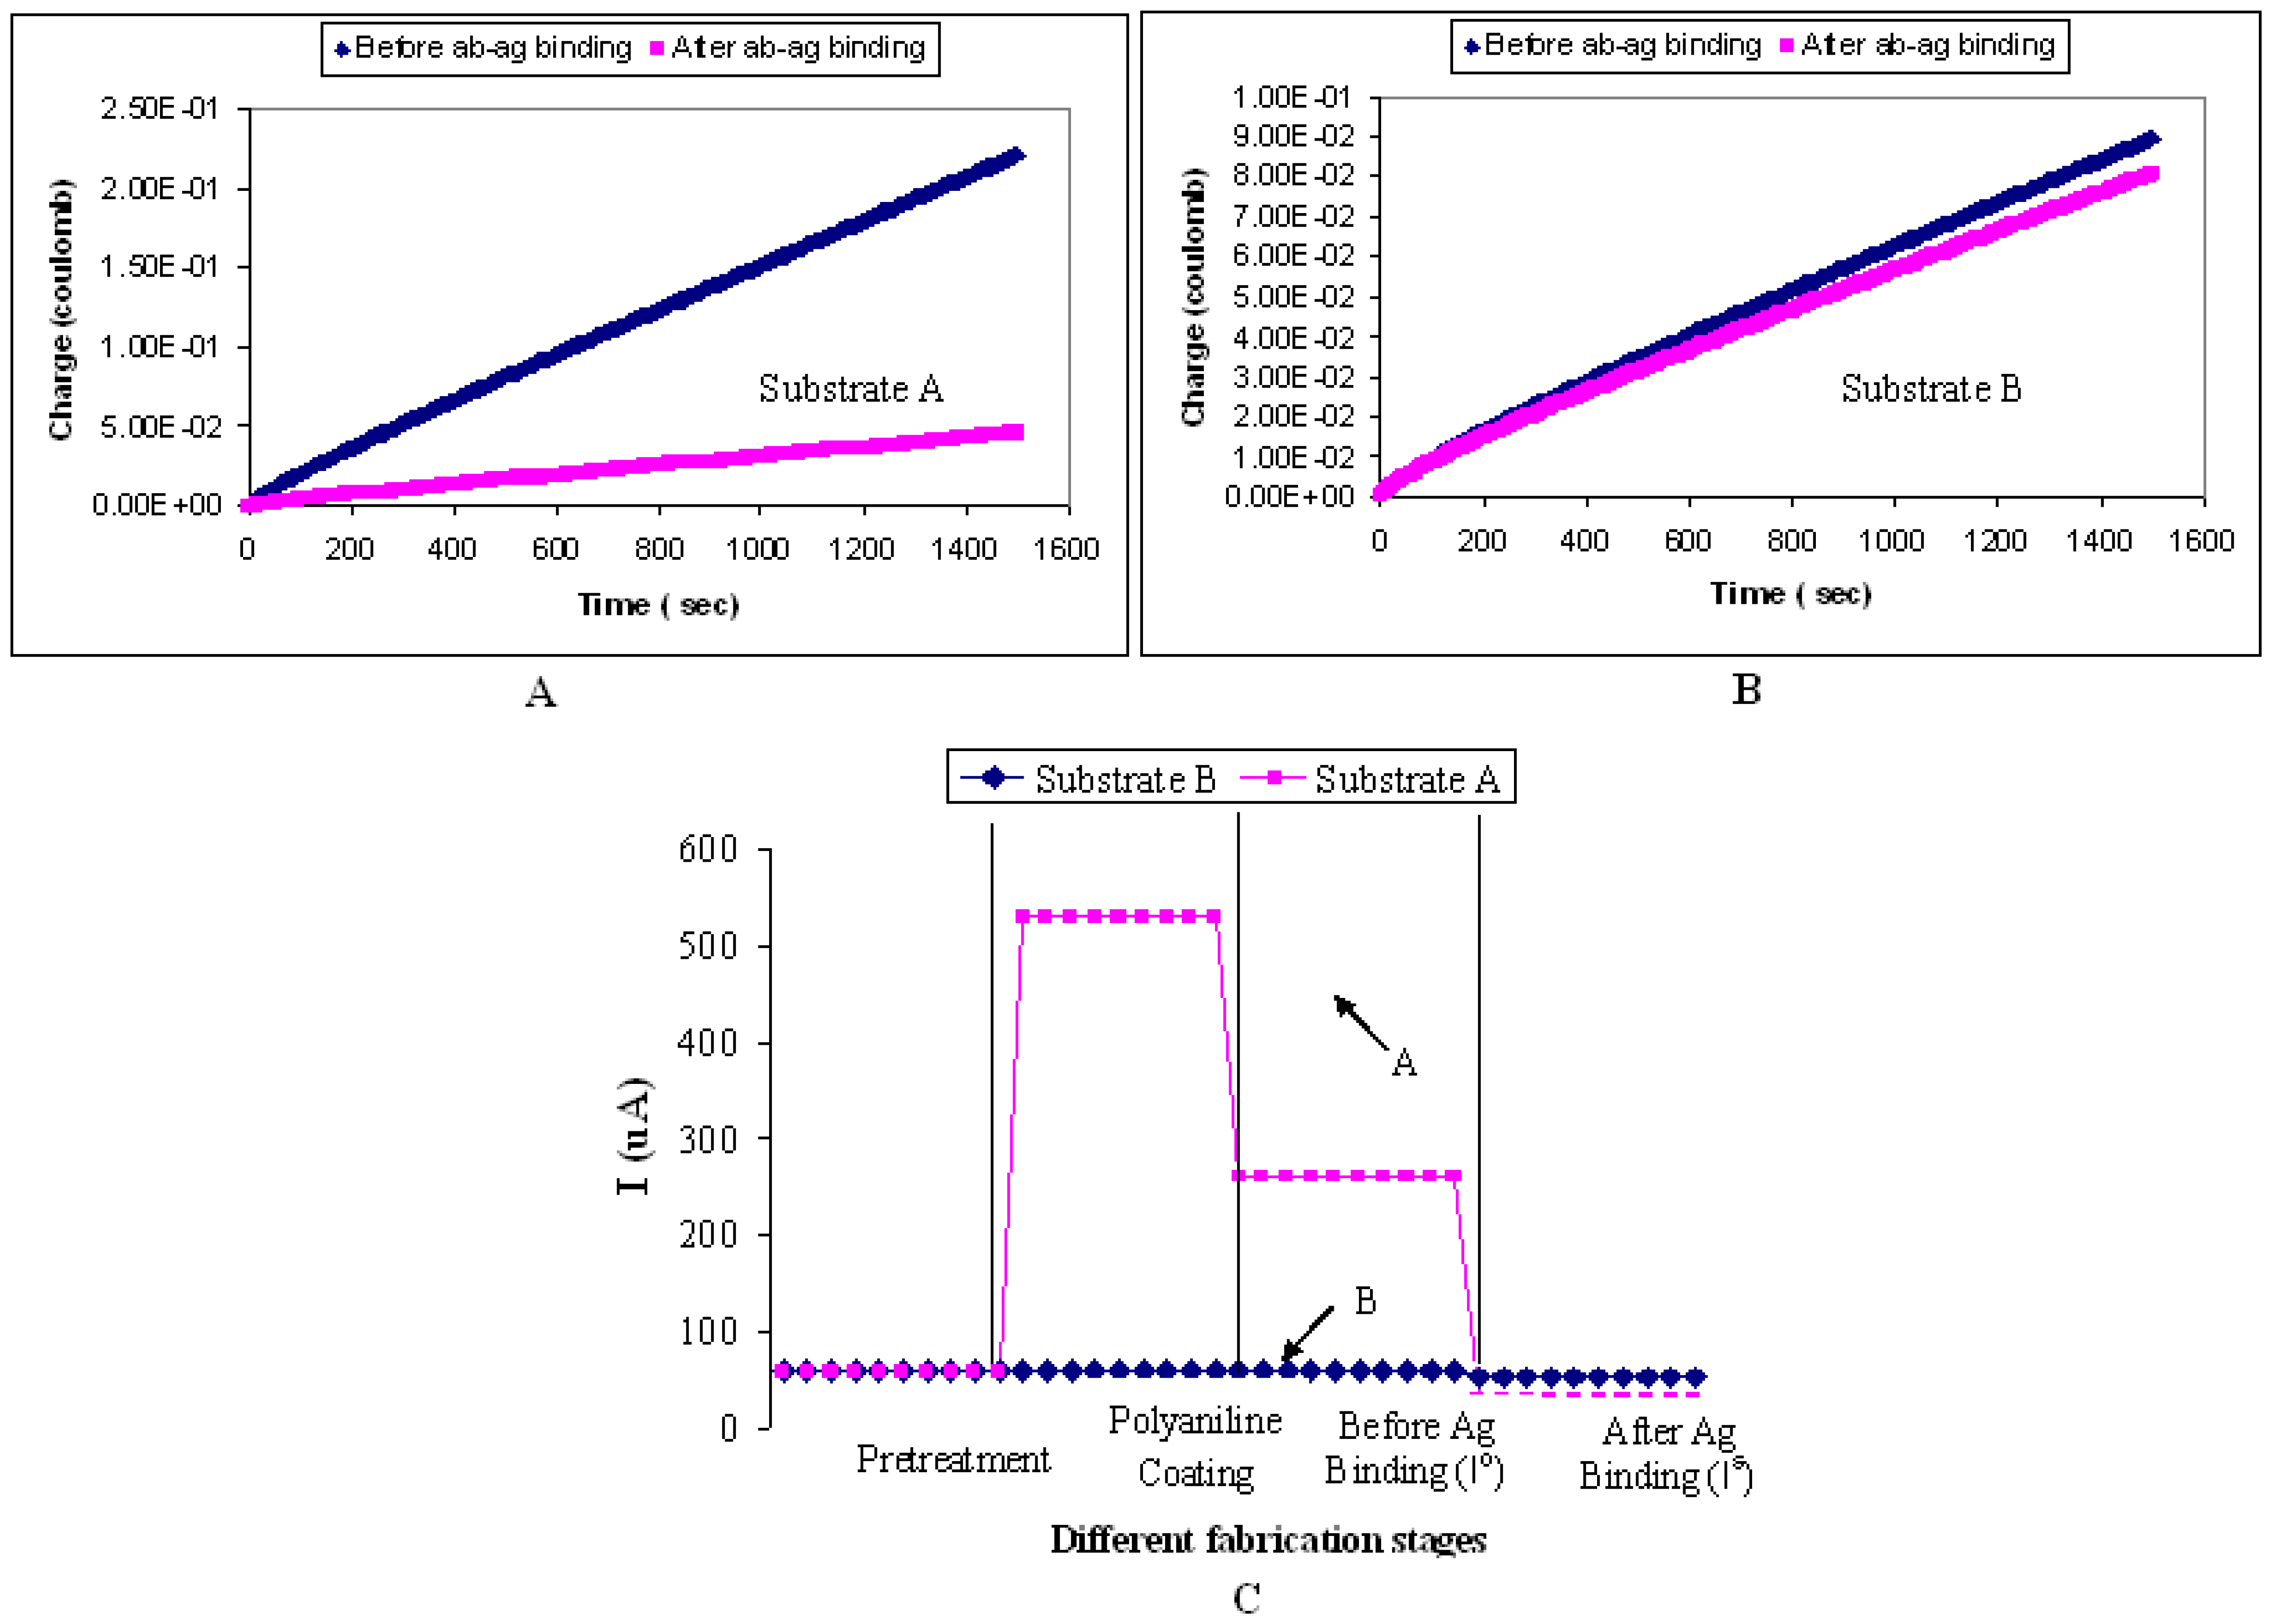
To elucidate the use of Pani as a mediator or a “glue” for the binding of antibody on the biosensor platform, ITO glasses undergoing A) the fabrication process described in sections 3.4 and 3.5, and B) the same fabrication process without the Pani spin-coating step, were tested for their amperometric responses (Figure 15). Depending on the fabrication process, the substrate is referred to as substrate A or substrate B thereafter. Figure 15A shows a significant difference between (Io) and (Is) for substrate A. The (Io) and (Is) responses for substrate B (Figure 15B), on the other hand, are statistically insignificant between each other. The latter finding is proposed to be caused by the absence of Pani on the ITO substrate which contributes to the lack of antibody binding, and subsequently to the insignificant responses between (Io) and (Is). To investigate this theory further, the presence of antibodies on both substrates was confirmed by repeating the above experiment with flourescent-tagged antibodies. Results show that a much higher fluorescence emission level (250 out of 256-bit color mode) was observed from substrate A than that from substrate B (20 out of 256-bit color mode). This finding implies that more antibodies are present from substrate A than substrate B. Therefore, in this study, it can be concluded that Pani is not only required as the biosensor transducing system but also as a mediator for the antibody binding. Kim et al. (2000) also demonstrated the use of Pani as a mediator between the antibodies and gold electrodes in their Pani-based biosensor.
Figure 15C shows the amperometric responses of the biosensor at every fabrication stage. The amperometric responses were calculated using the method described in section 3.1.2. An increase in current response is observed after the ITO substrate is coated with Pani. Then a decrease in current response is observed after antibody immobilization, suggesting the reduction in the electron flow that could be due to the insulating property of antibodies. A much higher drop in current response is observed after the antibody-antigen binding. This result supports the proposition made earlier that the bigger the protein molecules present on the surface of the biosensor, the lower the flow of electrons and thus the smaller the signal response.
This study shows the possibility of using ITO glass, coupled with spin-coating mechanism to deposit Pani and antibodies on the biosensor surface, as a new biosensor platform. In this format, the ability of using the same biosensor for both the blank and sample testing is shown to be promising. Further study will be dedicated in analyzing the sensitivity, specificity and stability of the biosensor to detect pure culture of target organisms.

3. Experimental Section

3.1 Reagents

The reagents included emeraldine base with molecular weight of 65, 50, and 20 kilo-Dalton (KDa), camphorsulphonic acid, methanol, chloroform, glutaraldehyde, nafion, phenol, 0.1 M phosphate buffer pH 7.4 (PB), ITO glass, silver/silver chloride electrode (Princeton Applied Research, TN), platinum electrode (CH instruments, TX), affinity purified swine anti- BVDV polyclonal antibody (USDA: NADL, IA), fluorescein isothiocyanate (FITC) labeled BVDV antibody (Veterinary Medical Research & Development, WA), and chromic-sulfuric acid solution (Ricca Chemical company, IL). All other reagents and materials were purchased from Sigma-Aldrich (MO) unless otherwise noted.

3.1.1 Apparatus

A three-electrode electrochemical cell (MSU Scientific Glassblowing laboratory, Michigan State University, MI) was used, with a platinum counter electrode, a silver/silver chloride reference electrode, and the ITO glass as the working electrode. The electrochemical cell was used with a VersaStat II potentiostat (AMETEK Princeton Applied Research, TN) in the amperometric mode with 0.1 M PB as the electrolyte.

3.1.2 Amperometric measurement

The amperometric measurement was conducted by first immersing the ITO glass in a 45-ml of PB. Using the three-electrode electrochemical cell set-up, a fixed potential of 0.5 Volts (V) was applied over 25 minutes. The theoretical value of the current flow between the working electrode and the electrolyte was obtained by performing a linear regression analysis on the charge-versus-time experimental data.

3.2 Pani preparation

Self doped Pani was prepared by doping emaraldine base with camphorsulfonic acid (9, 16, 36). Each of the commercially available emaraldine base compound was doped with camphorsulfonic acid in the ratio of 1.0 p-phenyleneimine (C6H4N) unit per 0.5 mol doping acid. Emeraldine and camphorsulfonic acid were mixed using a mortar and pestle in a nitrogen environment. The mixture was dissolved in chloroform to give a final concentration of 0.5 % by weight. To improve processability of Pani, phenol, in a ratio of 0.5 mol per p-phenyleneimine, was added. The mixture was stirred for 15 minutes before being filtered through a 0.45 μm filter paper. The solution was then stirred for 72 hours before further used. A commercially-available non-self doped Pani with a molecular weight > 15 KDa was purchased from Sigma-Aldrich (MO).

3.3 Pani characterization: conductivity and physical features

A mixture of each self-doped Pani compound dissolved in chloroform was air dried overnight. The dried Pani was compressed into pellets and its conductivity was measured using a four-point-probe (Signatone model S-301, CA).
A transmission electron microscope (TEM) (JEOL 2100FEF 200 kV field emission, Center for Advance Microscopy, Michigan State University) and an atomic force microscopy (AFM) were used to inspect the physical morphology of Pani and the biosensor. No pretreatment was performed prior to the analysis.

3.4 Fabrication of the ITO-Pani biosensor

Indium tin oxide glass with a dimension of 1.27 cm × 2.54 cm was used as the biosensor platform. The ITO glass was first washed with methanol/chloroform (1:1) before being soaked in ammonium hydroxide and air-dried (30). A 100-μl of Pani solution prepared from the above method was used to spin-coat a thin layer of the polymer on the ITO platform at the speed of 500 rpm for 6 seconds. The substrate was left to air-dry and referred to hereafter as ITO-Pani substrate.

3.5 Antibody immobilization and confirmation

The ITO-Pani substrate was functionalized into a biosensor by using target-specific antibodies at 0.5 mg/ml of concentration. All antibodies used in this study were prepared in PB (pH 7.4). The antibodies were immobilized onto the ITO-Pani substrate using the following method:
Using the three-electrode cell and the potentiostat, a potential of -0.5 V was applied to the ITO-Pani substrate for 1500 seconds. Forty-five ml of PB was used as the electrolyte. After applying the potential for 1500 seconds, the substrate was removed from the cell and then immersed in 1ml of solution mixture containing the antibody, 1% glutaraldehyde and PB in a volume ratio of 2.5:0.5:1. The substrate was left in the antibody solution at room temperature for 30 minutes (33).
The above immobilization procedure was repeated using fluorescein isothiocyanate (FITC) labeled antibodies to confirm the antibody immobilization. A confocal florescence microscope was used to visualize and measure the intensity of the emitted fluorescence and to confirm the immobilization.

3.6 Viral culturing

A characterized strain of noncytopathic BVDV 890 from the collection of the Department of Large Animal Clinical Sciences (Veterinary Medical Center, Michigan State University) was grown in bovine turbinate cells in Eagle's minimum essential medium (EMEM) broth containing 10% fetal equine serum for 5 days at 37 °C and 5% CO2. The culture was frozen at –80 °C for 1 hour to break apart the cells and to release the mature viruses. Then, the viral culture was centrifuged at 13000 rpm for 10 minutes. The culture supernatant containing approximately 106 CCID/ml of BVDV was used as the antigen solution for the subsequent experiments. Virus titer (the number of infectious units per unit volume) was determined by a standard method (37).

3.7 Detection

Detection process was conducted by 1), recording amperometric response after antibody immobilization, 2) incubating the biosensor from (1) with 1 ml of BVDV culture for 30 minutes and 3) measuring amperometric response of the biosensor from (2).

Conclusion

In this study, the self-doped Pani was first characterized and chosen as the transducing element in the biosensor design due to its conductivity stability in a near neutral pH solution. By using an AFM, the fabrication of the biosensor, which includes several processes such as surface treatment, Pani coating, and antibody functionalization, was demonstrated to be successful. The role of Pani as mediator for antibody binding on the ITO substrate was also discovered and demonstrated by comparing the amperometric response of a plain ITO and an ITO coated with Pani. A significant value of ΔI was observed from testing the Pani coated substrate and not from the plain ITO suggesting a significant degree of antibody-antigen complexes on the Pani coated substrate. A preliminary study on the biosensor's ability to detect 106 CCID/ml of BVDV culture was also demonstrated. However, experimental conditions such as antibody concentration, Pani size, immobilization method, and incubation time also play an important role in the biosensor development and therefore need to be investigated further.

References

  1. Sadik, O. A.; Emon, J. M. V. Biosensors & Bioelectronics; Volume 11, pp. i–xi. 1996. [Google Scholar]
  2. Adeloju, S. B.; Wallace, G. G. The Analyst; Volume 121, pp. 699–703. 1996 6; 1996. [Google Scholar]
  3. Cosnier, S. Biosensors & Bioelectronics; Volume 14, pp. 433–456. 1999 5 31; 1999. [Google Scholar]
  4. Sergeyeva, T. A.; Lavrik, N. V.; Rachkov, A. E. Sensors and Actuators B; Volume 34, pp. 283–288. 1996. [Google Scholar]
  5. Gerard, M.; Chaubey, A.; Malhotra, B. D. Biosensors & Bioelectronics; Volume 17, pp. 345–359. 2002. [Google Scholar]
  6. Winokur, W. J. Handbook of conducting polymers; Skotheim, T. A., Elsenbaumer, R. L., Reynolds, J. R., Eds.; Marcel Dekker, Inc, 1998; pp. 707–726. [Google Scholar]
  7. Genies, E. M.; Boyle, A.; Lapkowski, M.; Tsintavis, C. Synthetic Metals; Volume 36, pp. 139–182. 1990 6; 1990. [Google Scholar]
  8. Shaolin, M.; Jincui, L. Chemistry Journal on Internet; 1999; vol. 1. [Google Scholar]
  9. Cao, Y.; Smith, P.; Heeger, A. J. Synthetic Metals; Volume 57, pp. 3514–3519. 1993 4 12; 1993. [Google Scholar]
  10. Stejskal, J.; et al. Synthetic Metals; Volume 96, pp. 55–61. 1998. [Google Scholar]
  11. Lukachova, L. V.; et al. Journal of Electroanalytical Chemistry; Volume 544, pp. 59–63. 2003 3 13; 2003. [Google Scholar]
  12. Winokur, M. J.; Guo, H.; Kaner, R. B. Synthetic Metals; Volume 119, pp. 403–404. 2001 3 15; 2001. [Google Scholar]
  13. Rannou, P.; et al. Synthetic Metals; Volume 101, pp. 734–737. 1999 5; 1999. [Google Scholar]
  14. Muhammad-Tahir, Z.; Alocilja, E. C. Biosensors & Bioelectronics; Volume 18, pp. 813–819. 2003. [Google Scholar]
  15. Muhammad-Tahir, Z.; Alocilja, E. C.; Grooms, D. L. Sensors Journal, IEEE; Volume 5, pp. 757–762. 2005. [Google Scholar]
  16. Duic, L.; Mandic, Z.; Kovacicek, F. Journal of polymer science: Part A: Polymer chemistry; Volume 32, pp. 105–111. 1994. [Google Scholar]
  17. Ryu, K. S.; Chang, S. H.; Kang, S.-G.; Oh, E. J.; Chul-Hyun, Y. Bulletin of the Korean Chemical Society; Volume 20, pp. 333–336. 1999. [Google Scholar]
  18. Alexander, A. J.; Hughes, D. E. Analytical Chemistry; Volume 67, pp. 3636–3632. 1995. [Google Scholar]
  19. Radke, S. M.; Alocilja, E. C. Biosensors & Bioelectronics; Volume 20, pp. 1662–1667. 2005 2 15; 2005. [Google Scholar]
  20. Rodriguez, M.; Alocilja, E. IEEE Sensors Journal; Volume 5, pp. 733–736. 2005. [Google Scholar]
  21. Plesu, N.; Iliescu, S.; Ilia, G.; Popa, A.; Pascariu, A. Revue Roumaine De Chimie; Volume 50, pp. 805–813. Sep-Oct 2005. [Google Scholar]
  22. Gok, A.; Sari, B.; Talu, M. International Journal of Polymer Analysis and Characterization; Volume 11, pp. 227–238. May-Jun 2006. [Google Scholar]
  23. Garjonyte, R.; Malinaiuskas, A. Biosensors & Bioelectronics; Volume 15, pp. 445–451. 2000. [Google Scholar]
  24. Kim, J. H.; Cho, J. H.; Cha, G. S. Biosensors & Bioelectronics; Volume 14, pp. 907–915. 2000. [Google Scholar]
  25. Tsiafoulis, C. G.; Prodromidis, M. I.; Karayannis, M. I. Biosensors & Bioelectronics; Volume 20, pp. 620–627. 2004 10 15; 2004. [Google Scholar]
  26. Cattaneo, M. V.; Luong, J. H. T.; Mercille, S. Biosensors & Bioelectronics; Volume 7, pp. 329–334. 1992. [Google Scholar]
  27. Darain, F.; Park, S.-U.; Shim, Y.-B. Biosensors & Bioelectronics; Volume 18, pp. 773–780. 2003 5; 2003. [Google Scholar]
  28. Fang, A.; Ng, H. T.; Li, S. F. Y. Biosensors & Bioelectronics; Volume 19, pp. 43–49. 2003 10 30; 2003. [Google Scholar]
  29. Marks, R. S.; Novoa, A.; Konry, T.; Krais, R.; Cosnier, S. Materials Science and Engineering: C-Biomimetic and Supramolecular Systems; Volume 21, pp. 189–194. 2002 9 1; 2002. [Google Scholar]
  30. Ram, M.; Salerno, M.; Manuela, A.; Faraci, P.; Nicolini, C. Langmuir; Volume 15, pp. 125–1259. 1999. [Google Scholar]
  31. Rubner, M. F. Conjugated polymers.; Bredas, J., Silbey, L., Eds.; Kluwer Academic Publisher: Boston, 1991. [Google Scholar]
  32. Ferreira, M.; Rubner, M. F. Macromolecules; Volume 28, pp. 7107–7114. 1995. [Google Scholar]
  33. Liu, C. H.; Liao, K. T.; Huang, H. J. Analytical Chemistry; Volume 72, pp. 2925–2929. 2000. [Google Scholar]
  34. Irina, I.-M.; Sanchez, Y.; Fields, H. A.; Dreesman, G. R. Journal of Virological Methods; Volume 6, pp. 41–52. 1983 1; 1983. [Google Scholar]
  35. Diao, J.; Ren, D.; Engstrom, J. R.; Lee, K. H. Analytical Biochemistry; Volume 343, pp. 322–328. 2005 8 15; 2005. [Google Scholar]
  36. Cao, Y.; Qiu, J.; Smith, P. Synthetic Metals; Volume 69, pp. 187–190. 1995 3 1; 1995. [Google Scholar]
  37. Carbrey, E. A.; Brown, L. N.; Chow, T. L. Proceeding of US Animal Health Association; pp. 629–701. 1971. [Google Scholar]
Figure 1. Proposed mechanism for chemical polymerization of Pani doped with camphorsulfonic acid (adapted from 13).
Sensors 07 01123f1
Figure 2. Conductivity of polyaniline compounds.
Sensors 07 01123f2
Figure 3. Transmission electron microscopy images of a) 20 KDa, b) 50 KDa, and c) 65 KDa self doped Pani, and d) non-self doped Pani.
Sensors 07 01123f3
Figure 4. Amperometric responses of ITO -self doped polyaniline compounds.
Sensors 07 01123f4
Figure 5. Percent of weight loss of 65 KDa Pani in varying temperatures.
Sensors 07 01123f5
Figure 6. Amperometric responses of ITO substrates coated with non-self doped Pani and 50 KDa self doped Pani in two pH controlled electrolytes.
Sensors 07 01123f6
Figure 7. Schematic of an ITO-Pani biosensor before and after antibody-antigen binding.
Sensors 07 01123f7
Figure 8. ITO-Pani biosensor.
Sensors 07 01123f8
Figure 9. Atomic force microscopy images of a) untreated ITO glass and b) ITO glass treated with ammonium hydroxide (NH4OH).
Sensors 07 01123f9
Figure 10. Atomic force microscopy images of a) ITO glass treated with (NH4OH) and spin coated with 65KDa, b) 50KDa, c) 20KDa Pani.
Sensors 07 01123f10
Figure 11. Atomic force microscopy images of a) ITO glass spin coated with Pani (65KDa) + antibody, b) Pani (50 KDa) + antibody, and c) Pani (20 KDa) + antibody.
Sensors 07 01123f11
Figure 12. Atomic force microscopy images of a) ITO-Pani biosensor (65KDa) tested with a)106CCID/ml and b) 104CCID/ml of bovine viral diarrhea virus (BVDV).
Sensors 07 01123f12
Figure 13. Atomic force microscopy images of a) ITO-Pani biosensor (50KDa) tested with a) 106CCID/ml and b) 104CCID/ml of bovine viral diarrhea virus (BVDV).
Sensors 07 01123f13
Figure 14. Atomic force microscopy images of a) ITO-Pani biosensor (20KDa) tested with a) 106CCID/ml and b) 104CCID/ml of bovine viral diarrhea virus (BVDV).
Sensors 07 01123f14
Figure 15. Current-versus-time response of A) substrate A (ITO biosensor spin-coated with self-doped Pani and B) substrate B (ITO biosensor without Pani coating). Amperometric responses of both substrates at every fabrication stage (C).
Sensors 07 01123f15

