Investigation on Clarified Fruit Juice Composition by Using Visible Light Micro-Raman Spectroscopy

Abstract
:1. Introduction
2. Materials and Methods
2.1 Materials
2.2 Methods
2.2.1 Raman spectroscopy measurements
2.2.2 Biochemical assays
2.2.2.1 Pectin content
2.2.2.2 Fructose content
2.2.2.3 β–Carotene content
2.2.3. Data analysis
3. Results and Discussion
4. Conclusions
References
- Alvarez, S.; Riera, F.A.; Alvarez, R.; Coca, J.; Cuperus, F.P.; Bouwer, S.Th.; Boswinkel, G.; van Gemert, R.W.; Veldsink, J.W.; Giorno, L.; Donato, L.; Todisco, S.; Drioli, E.; Olsson, G.; Tragardh, J.; Gaeta, S.N.; Panyor, L. A new integrated membrane process for producing clarified apple juice and apple juice aroma concentrate. Journal of Food Engineering 2000, 46, 109–125. [Google Scholar]
- Li Chan, E.C.Y. The Application of Raman Spectroscopy in Food Science. Trends in Food Science & Technology 1996, 7, 361–370. [Google Scholar]
- Thygesen, L.G.; Lokke, M.M.; Micklander, E.; Engelsen, S. B. Vibrational microspectroscopy of food. Raman vs FT-IR. Trends in Food Science & Technology 2003, 14, 50–57. [Google Scholar]
- Micklander, E.; Brimer, L.; Engelsen, S.B. Non-invasive assays for cyanogenic constituents in plants by Raman spectroscopy: contents and distribution of amygdalin in bitter almond. Applied Spectroscopy 2002, 56, 1139–1146. [Google Scholar]
- Baeten, V.; Dardenne, V.; Aparicio, R. Interpretation of Fourier-Transform Raman spectra of the unsaponifiable matter in a selection of edible oils. J. Agric. and Food Chemistry 2001, 49, 5098–5107. [Google Scholar]
- Synytsya, A.; Copíková, J.; Matejka, P.; Machovic, V. Fourier-Transform Raman and infrared spectroscopy of pectins. Carbohydrate Polymers 2003, 54, 97–106. [Google Scholar]
- Goral, J.; Zichy, V. Fourier-Transform Raman Studies of Materials and Compounds of Biological Importance. Spectrochimica Acta 1990, 46A, 253–275. [Google Scholar]
- Goodacre, R.; Radovic, B.S.; Anklam, E. Progress toward the rapid non-destructive assessment of the floral origin of European honey using dispersive Raman spectroscopy. Applied Spectroscopy 2002, 56, 521–527. [Google Scholar]
- Berger, A.J.; Itzkan, I.; Feld, M. Feasibility of measuring blood glucose concentration by near-infrared Raman spectroscopy. Spetrochim. Acta Part A 1997, 53, 287–292. [Google Scholar]
- National Centre for Biotechnology Education. In a jam and out of juice. In NCBE - Practical protocol; 2000; ISBN 0 7049 13739; U.K.
- Raman, C. V.; Krishnan, K. S. A New Type of Secondary Radiation. Nature 1928, 121, 501–502. [Google Scholar]
- Lewis, I. R.; Edwards, H.G.M. Handbook of Raman Spectroscopy; New York, 2001; Marcel Dekker Inc. [Google Scholar]
- Aarnoutse, P. A.; Westerhuis, J. A. Quantitative Raman Reaction Monitoring Using the Solvent as Internal Standard. Anal. Chem. 2005, 77, 1228–1236. [Google Scholar]
- Bernfeld, P. Amylase a and b. Methods in Enzymology 1955, 1, 149–150. [Google Scholar]
- Grassin, C.; Fauquembergue, P. Progress in Biotechnology 14: Pectins and pectinases.; Visser, J., Voragen, A.G.J., Eds.; 1996; Elsevier: Amsterdam; pp. 453–463. [Google Scholar]
- Youn, K.S.; Hong, J.H.; Bae, D.H.; Kim, S.J.; Kim, S.D. Effective clarifying process of reconstituted apple juice using membrane filtration with filter-aid pretreatment. Journal of Membrane Science 2004, 228, 179–186. [Google Scholar]
- Stahl, W.; Schwarz, W.; Sies, H. Human serum concentrations of all-trans ß- and α-carotene but not 9-cis ß-carotene increase upon ingestion of a natural isomer mixture obtained from Dunaliella salina (betatene). J. Nutrition 1993, 123, 847–851. [Google Scholar]
- Doker, O.; Salgin, U.; Sanal, I.; Mehentogh, U.; Calimli, A. Modeling the extraction of β - carotene from apricot bagasse using supercritical CO2 in packed bed extractor. Journal of Supercritical Fluids 2004, 28, 11–19. [Google Scholar]
- Camerlingo, C.; Delfino, I.; Lepore, M. Micro-Raman spectroscopy on YBCO films during heat treatments. Supercond. Sci. Technol. 2002, 15, 1606–1609. [Google Scholar]
- Cerchiaro, G.; Sant'Ana, A.C.; Arruda Temperini, M.L.; da Costa Ferriera, A.M. Investigations of different carbohydrate anomers in copper(II) complexes with D-glucose, D-fructose, and D-galactose by Raman and EPR spectroscopy. Carbohydrates Research 2005, 340, 2352–2359. [Google Scholar]
- Engelsen, S.B.; Noorgard, L. Comparative vibrational spectroscopy for determination of quality parameters in amidated pectins as evaluated by chemometrics. Carbohydrates Polimers 1996, 30, 9–24. [Google Scholar]
- Engelsen, S.B. Food Technology KVL. Database on Raman Spectra of Carbohydrates http://www.models.kvl.dk/users/engelsen/specarb/fructose.html.
- Koyama, Y.; Takatsuka, I.; Nakata, M.; Tasumi, M. Raman and infrared spectra of all-trans, 7-cis, 9-cis and 15-cis isomers of β-carotene: key-bands distinguishing stretched or terminal-bent configuration from central-bent configurations. J. Raman Spectrosc. 1988, 19, 37–49. [Google Scholar]
- Baranska, M.; Schulz, H.; Baranski, R.; Nothnagel, T.; Christensen, L.P. In Situ Simultaneous Analysis of Polyacetylenes, Carotenoids and Polysaccharides in Carrots Roots. J. Agric. Food Chem. 2005, 53, 6565–6571. [Google Scholar]
- Martens, H.; Noes, T. Multivariate Calibration; Wiley: New York, 1993. [Google Scholar]

| Compound | Concentration (g/l) |
|---|---|
| Water | 860-900 |
| Sugars | 100-120 |
| Fructose | 46-70 |
| Sucrose | 27 |
| Glucose | 20 |
| Malic acid | 3-7 |
| Pectin | 1-5 |
| Starch | 0.5-5 |
| Polyphenols | 1 |
| Proteins | 0.6 |
| Vitamins(mainly ascorbic acid) | 0.05 |
| Ashes | 2 |
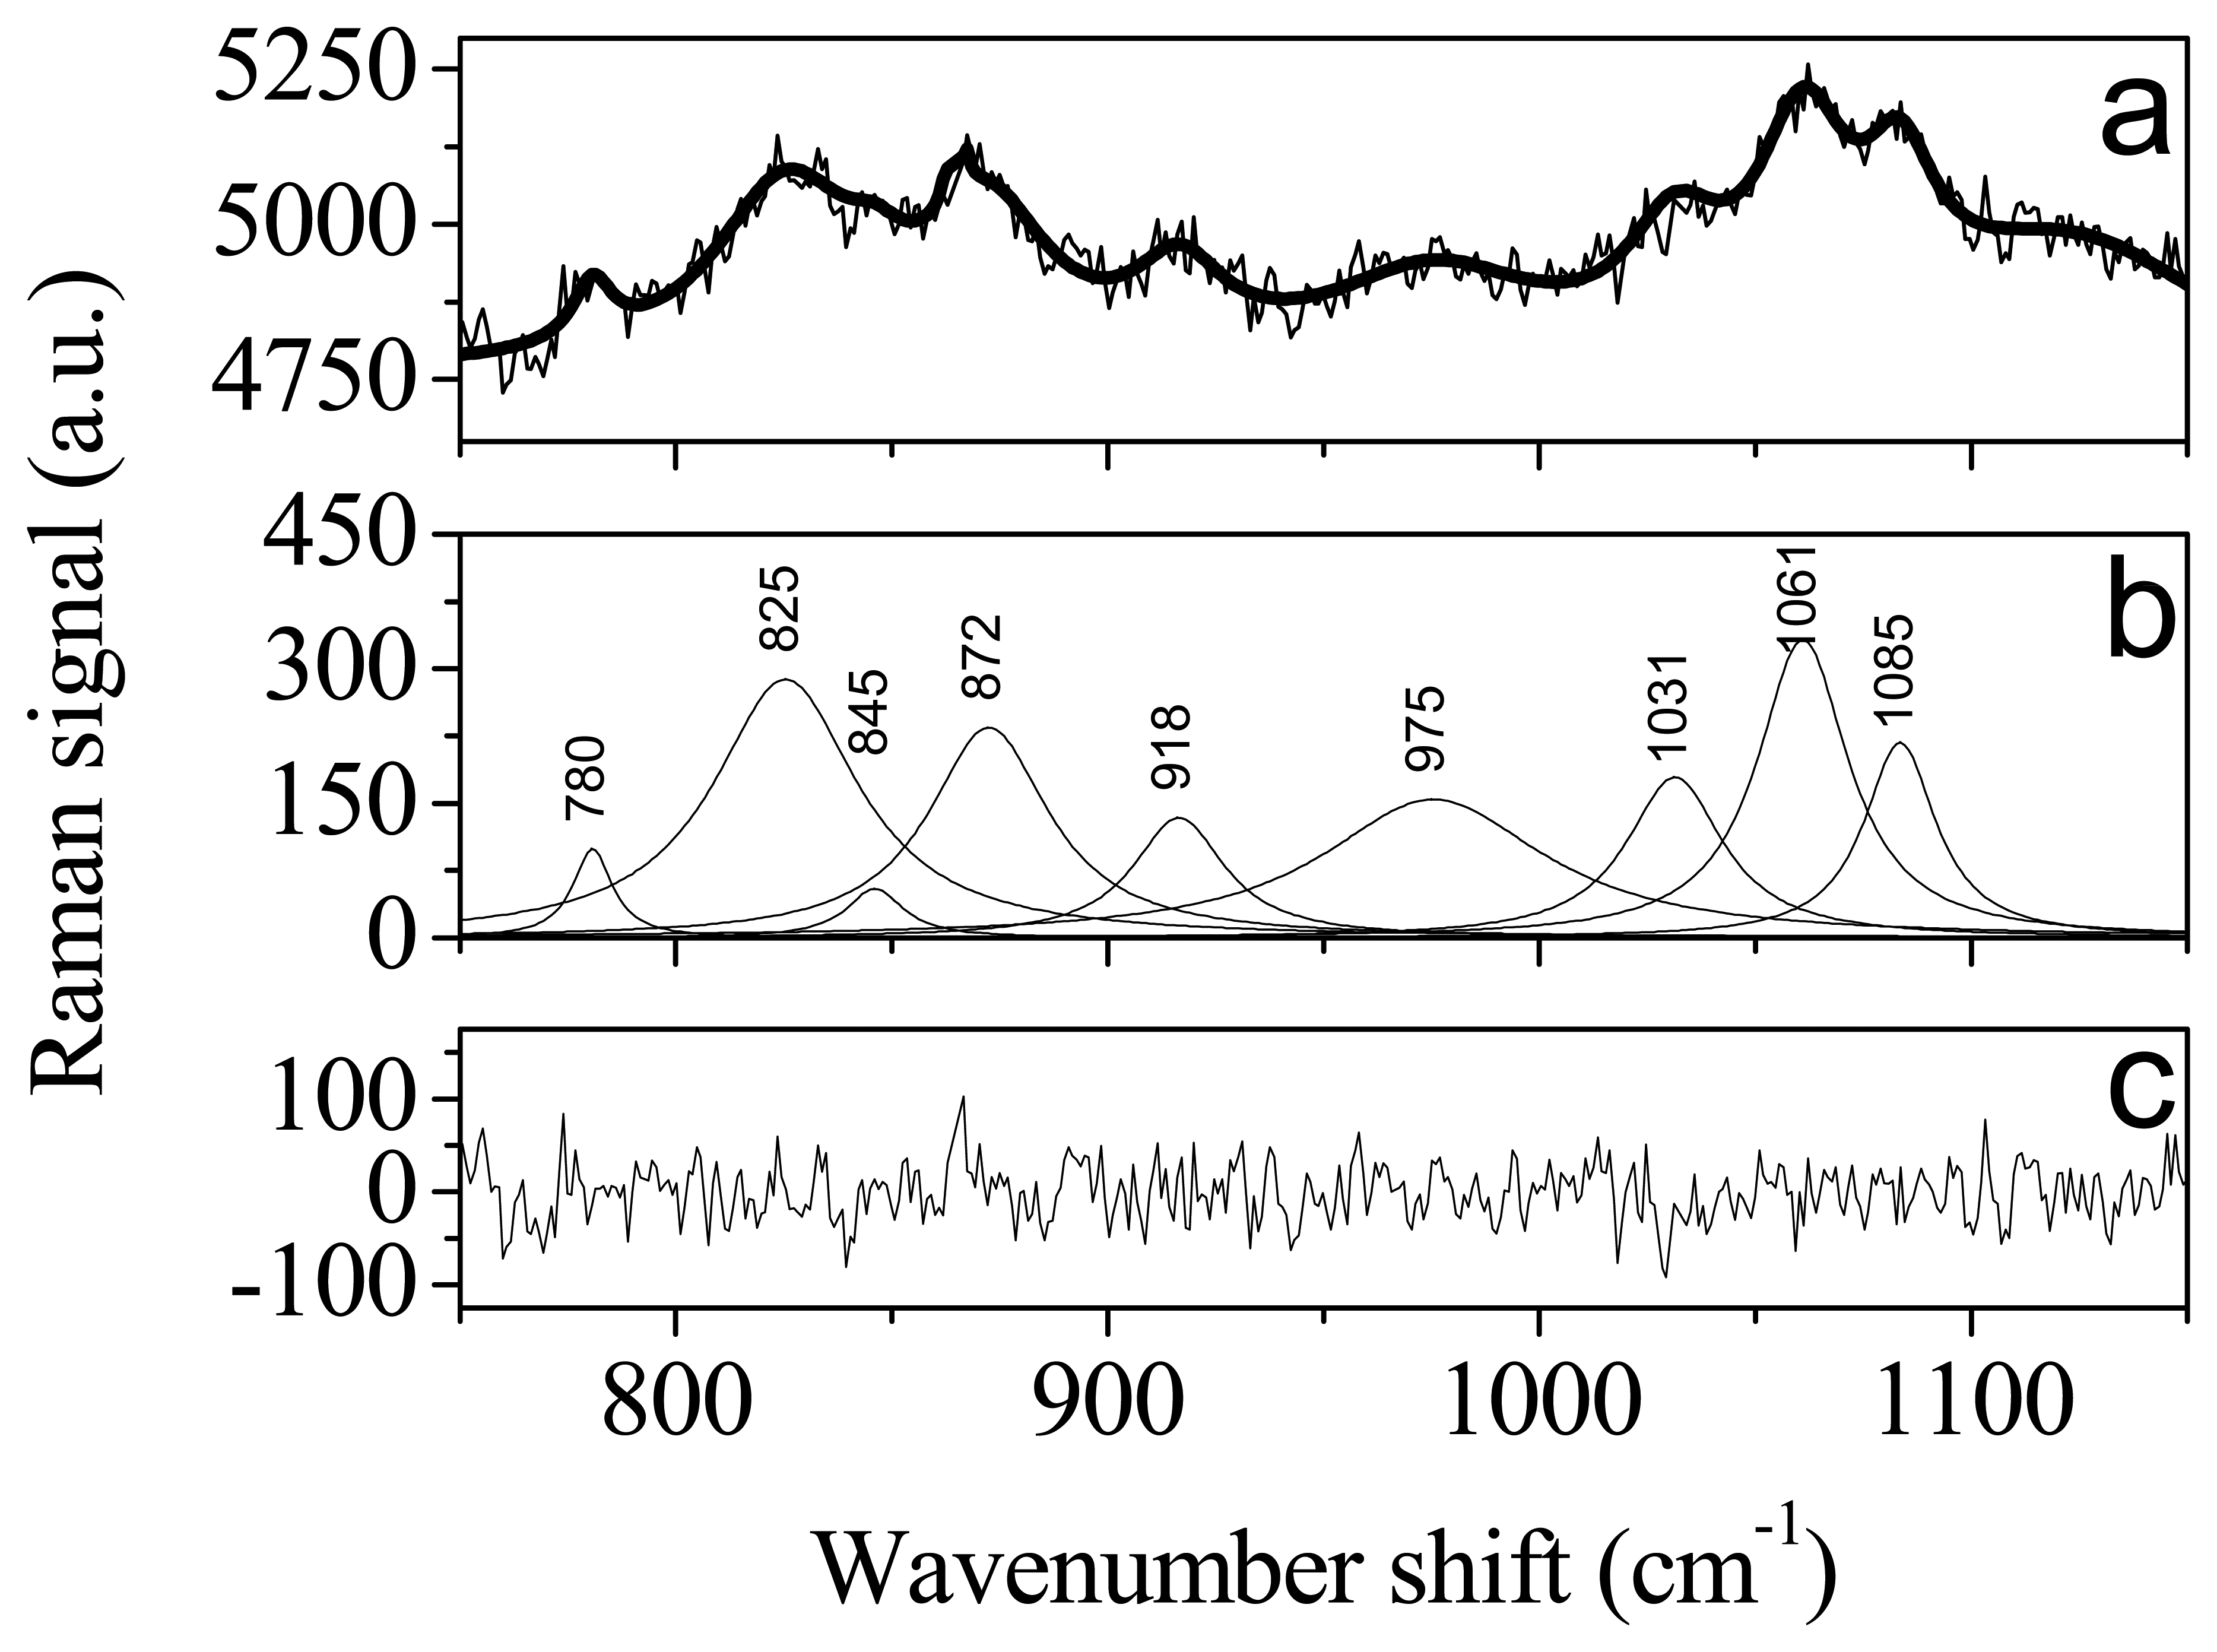
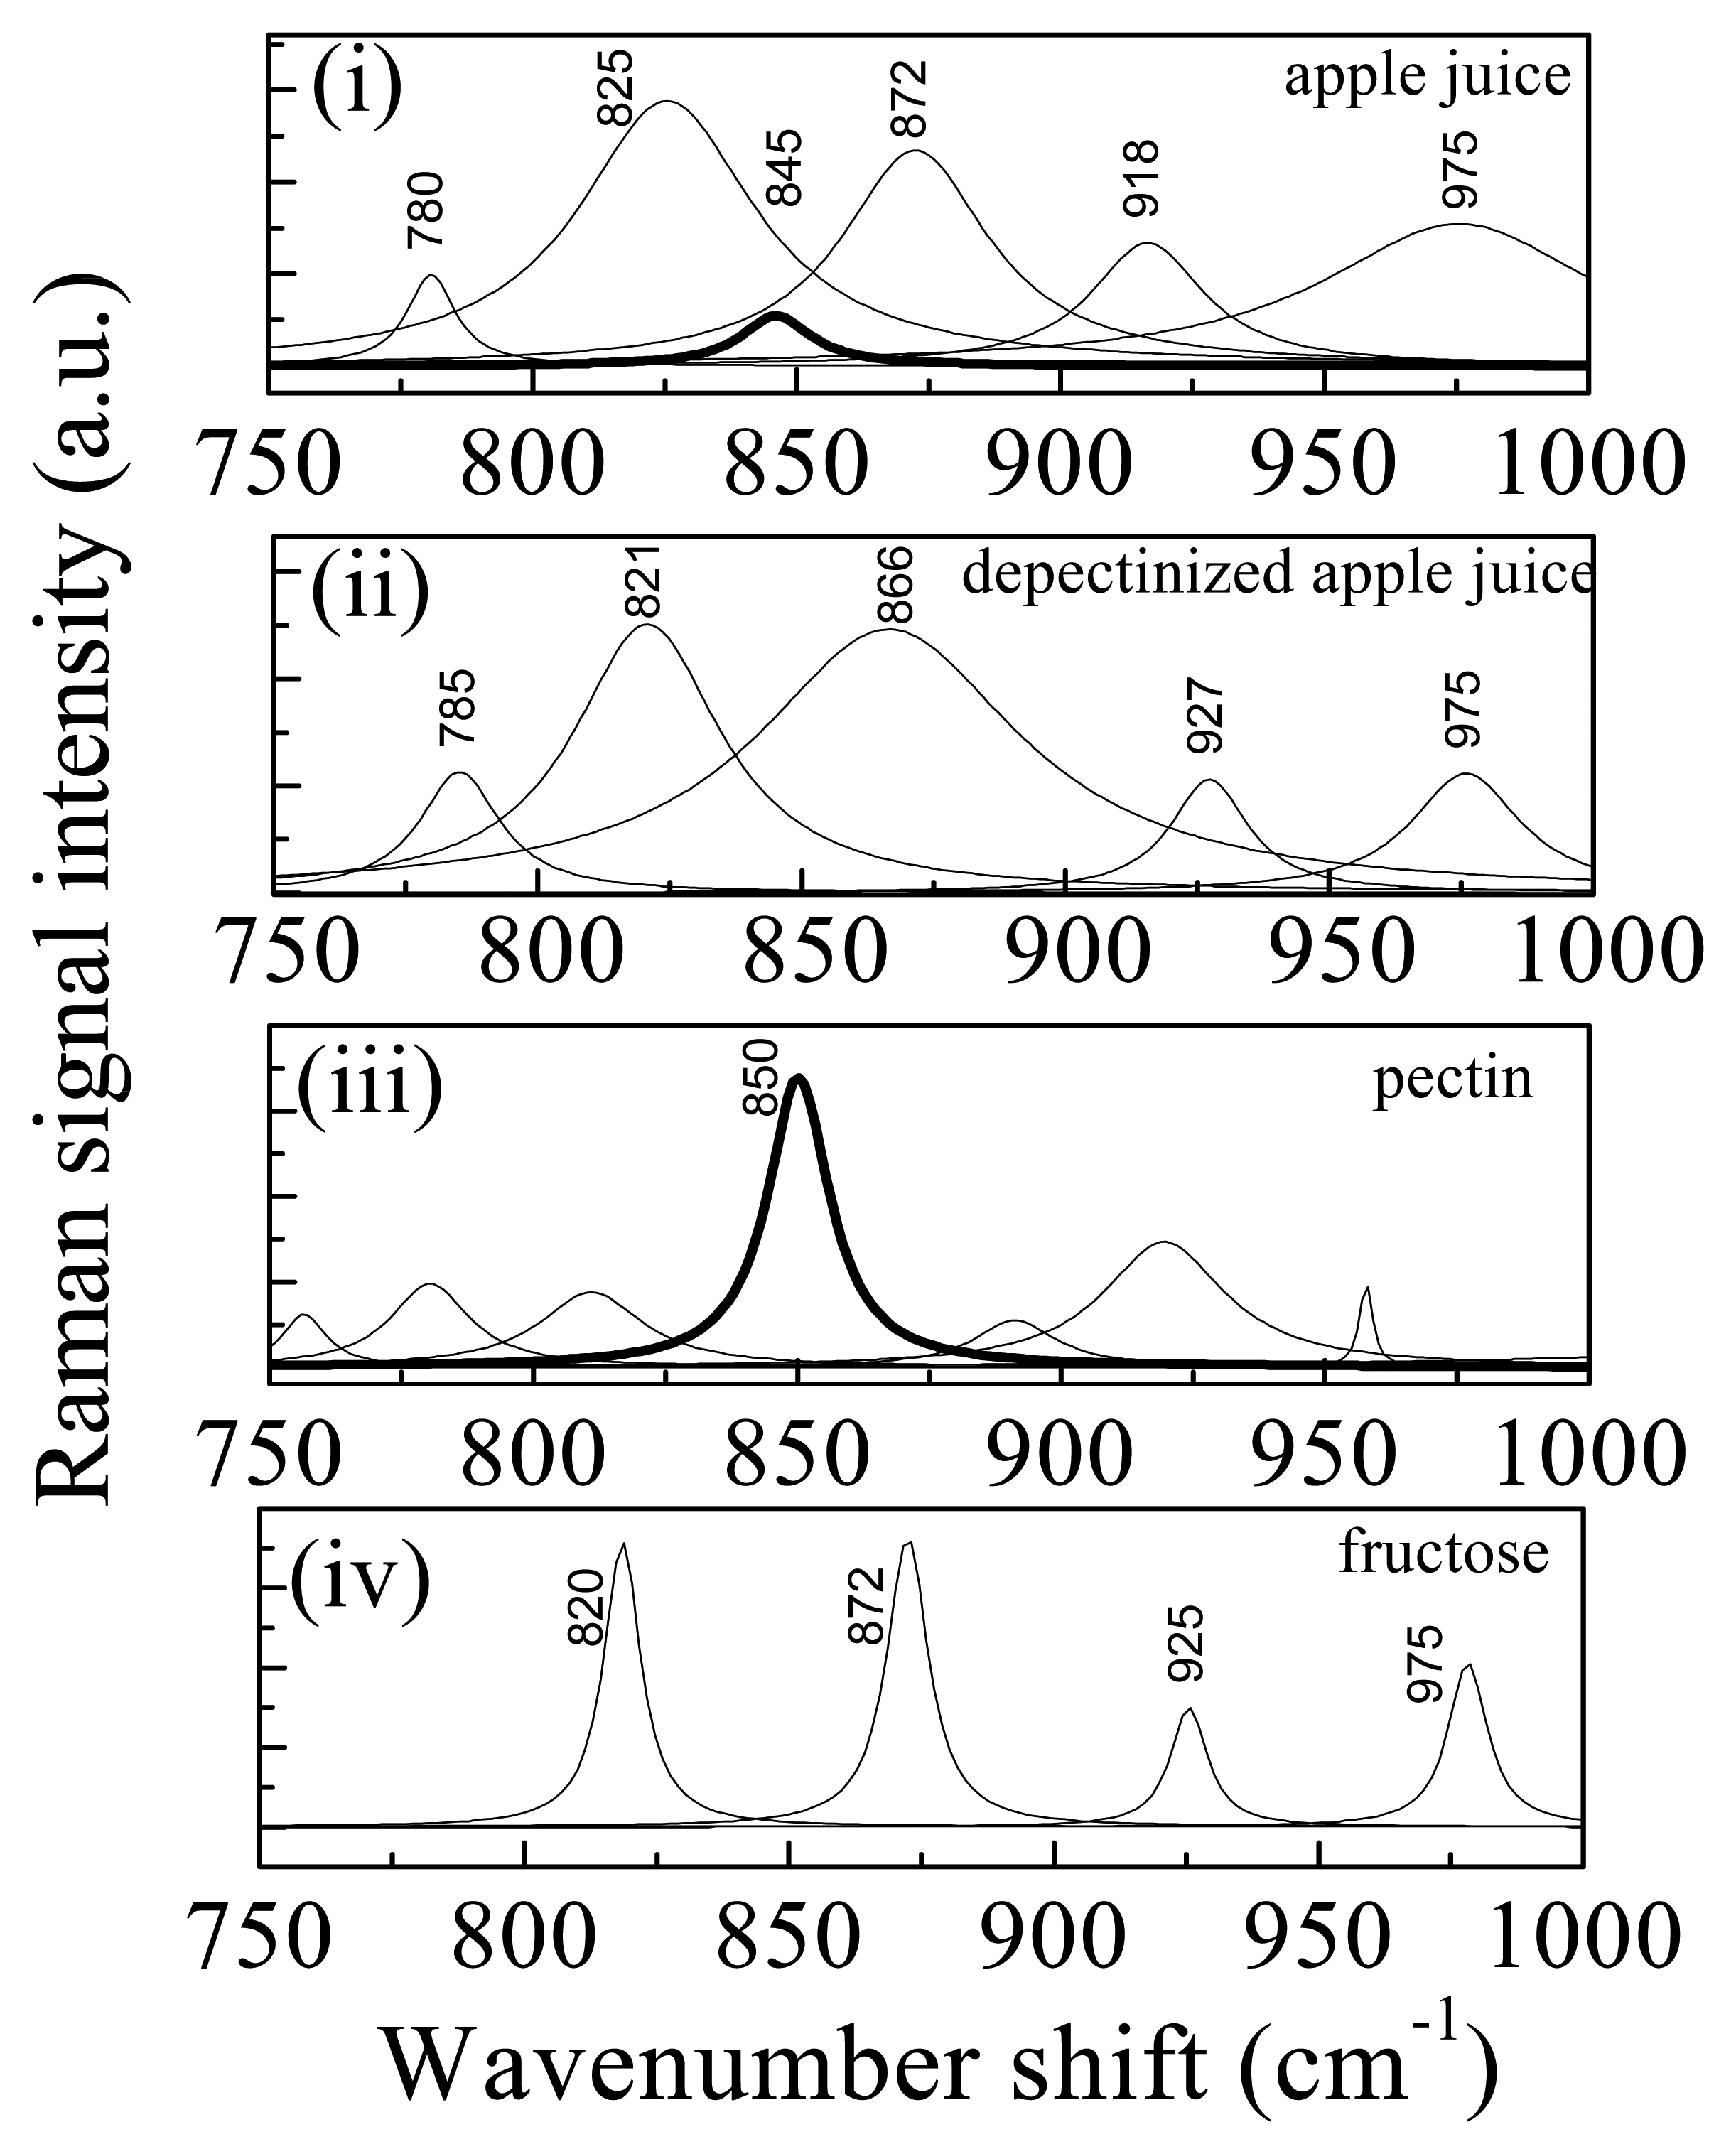
| Peak wavenumber (cm-1) | Pectin | Fructose | Ref. |
|---|---|---|---|
| 825 | furanose isomer | 20 | |
| 845 | C-O-C antisymmetric stretching of the glycoside linkage | 3, 21 | |
| 872 | furanose isomer | 20 | |
| 918 | In-plane bending of CH2 | furanose isomer | 20 |
| 975 | pyranose isomer | 20 | |
| 1031 | Nonlocalized, highly coupled vibrational modes of polysaccharide backbones | 21 | |
| 1061 | 21 | ||
| 1083 | C-O stretching | 20 |
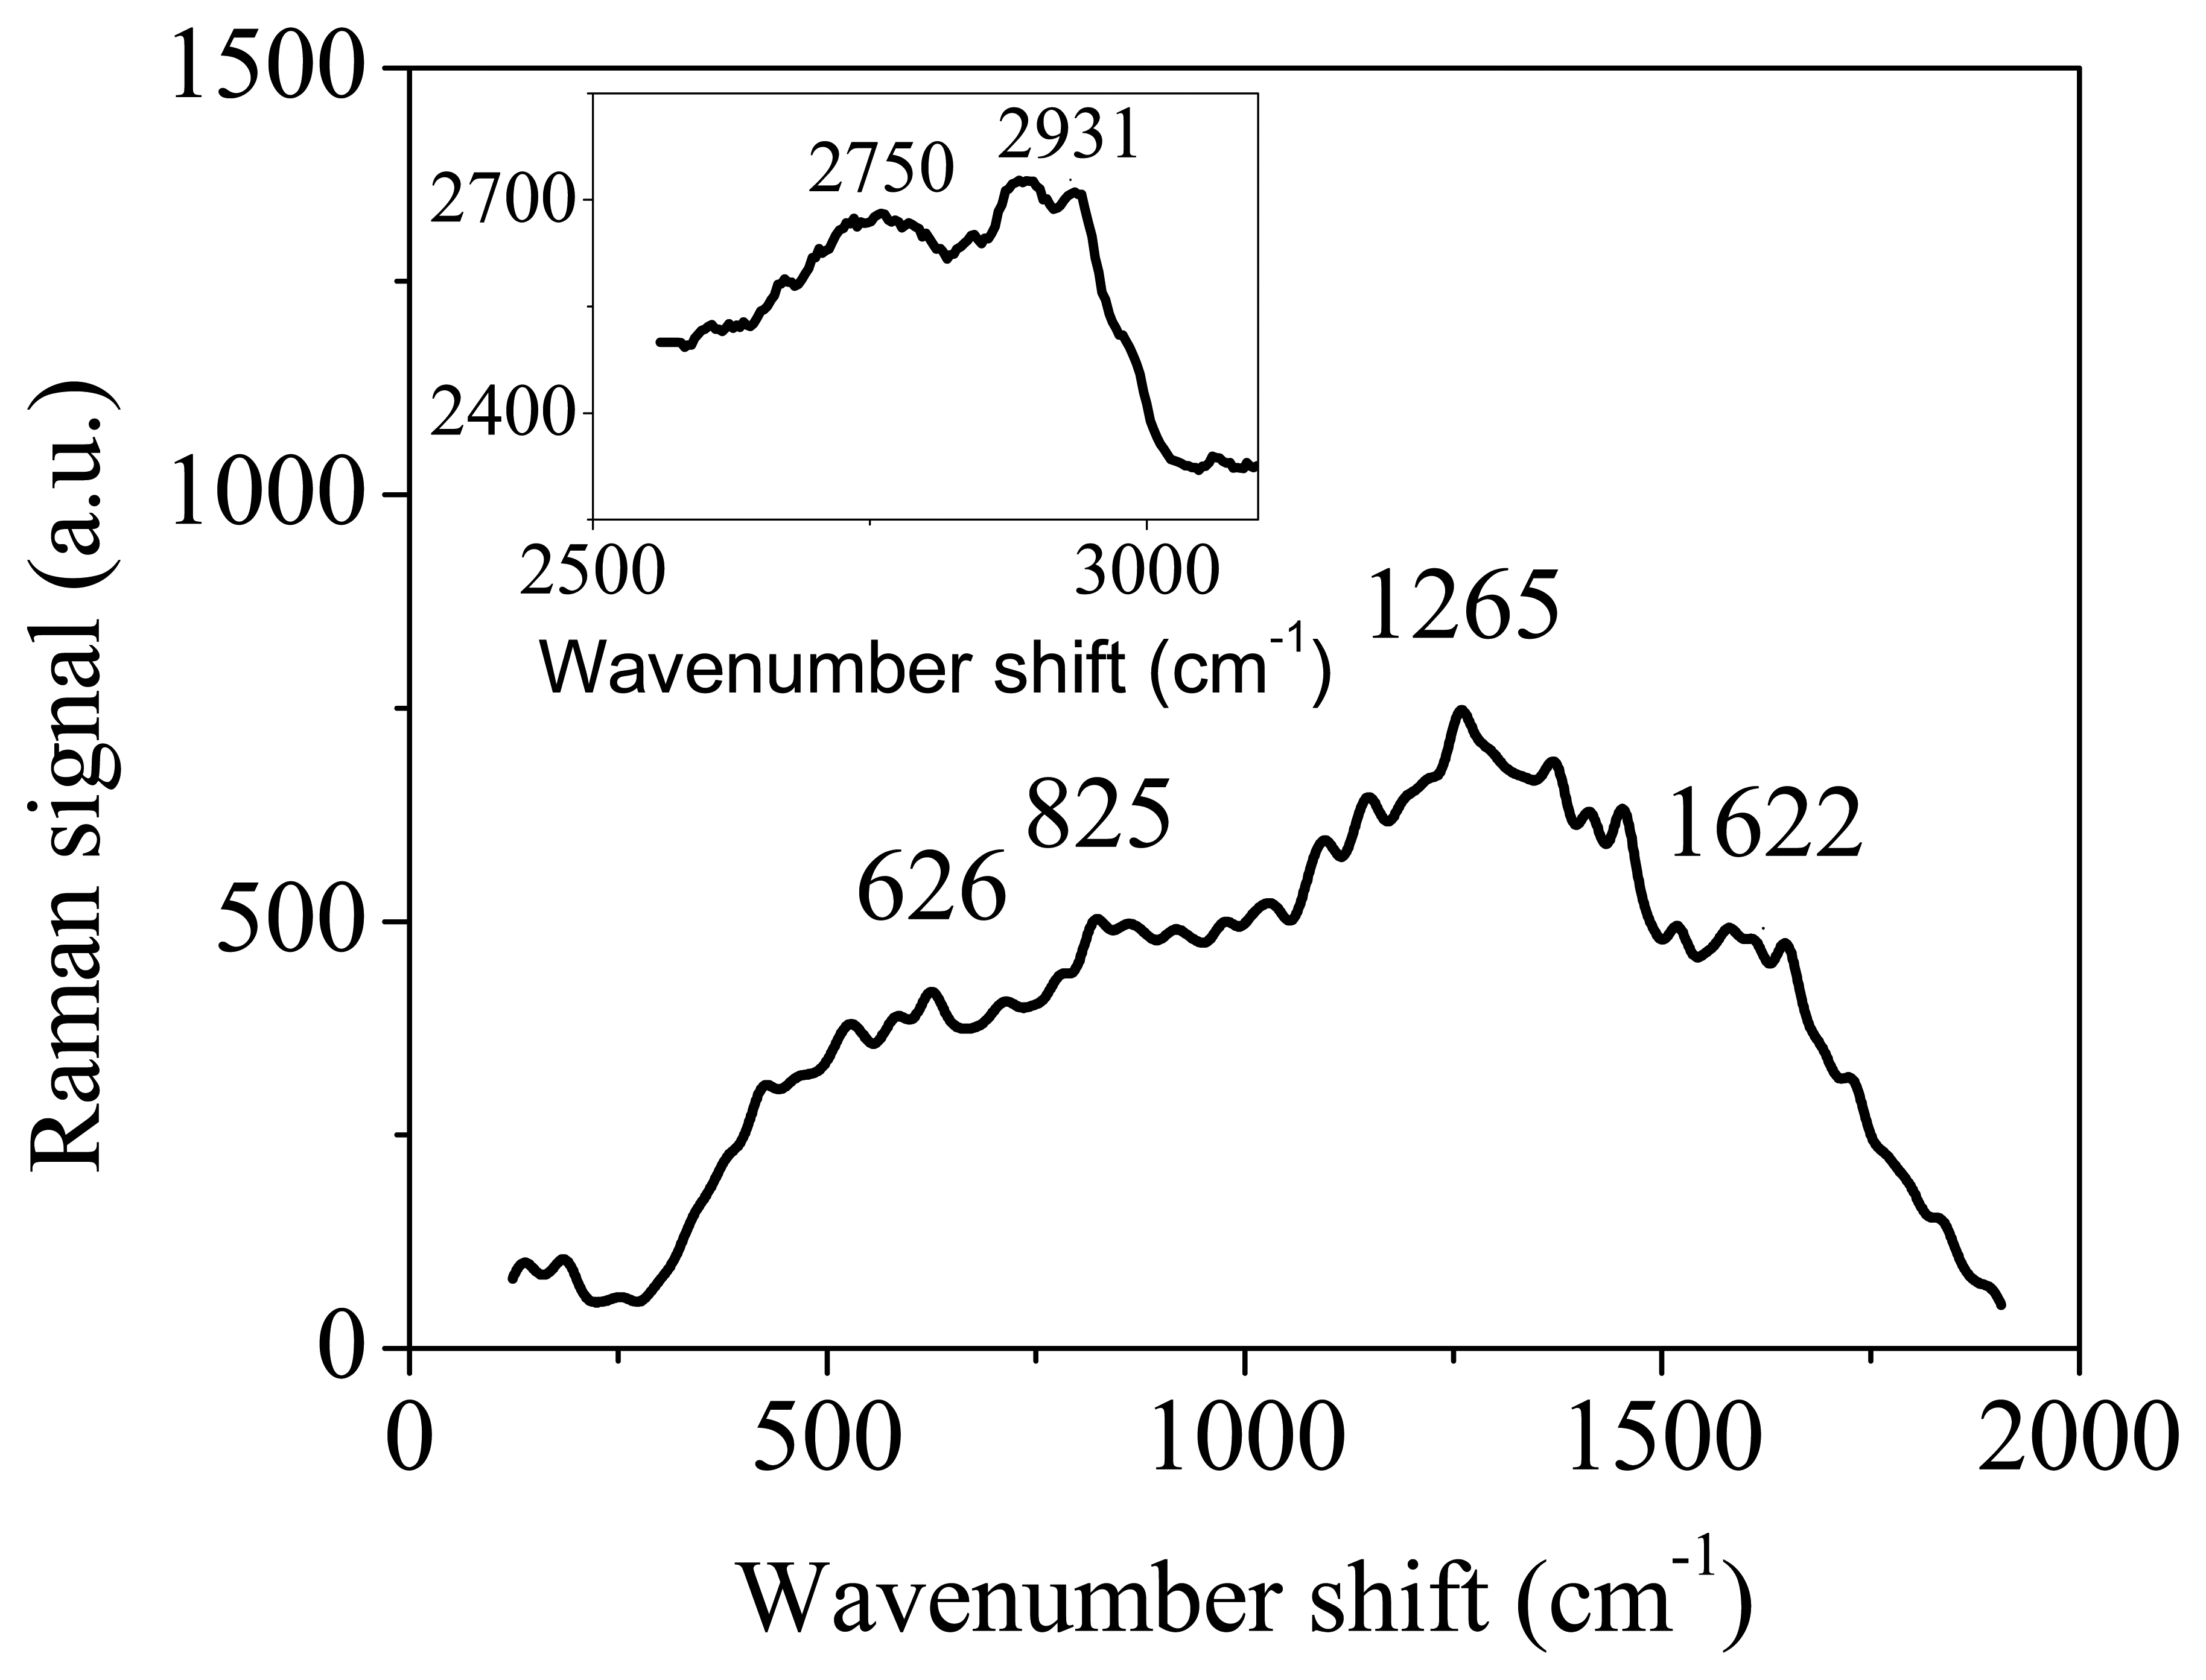
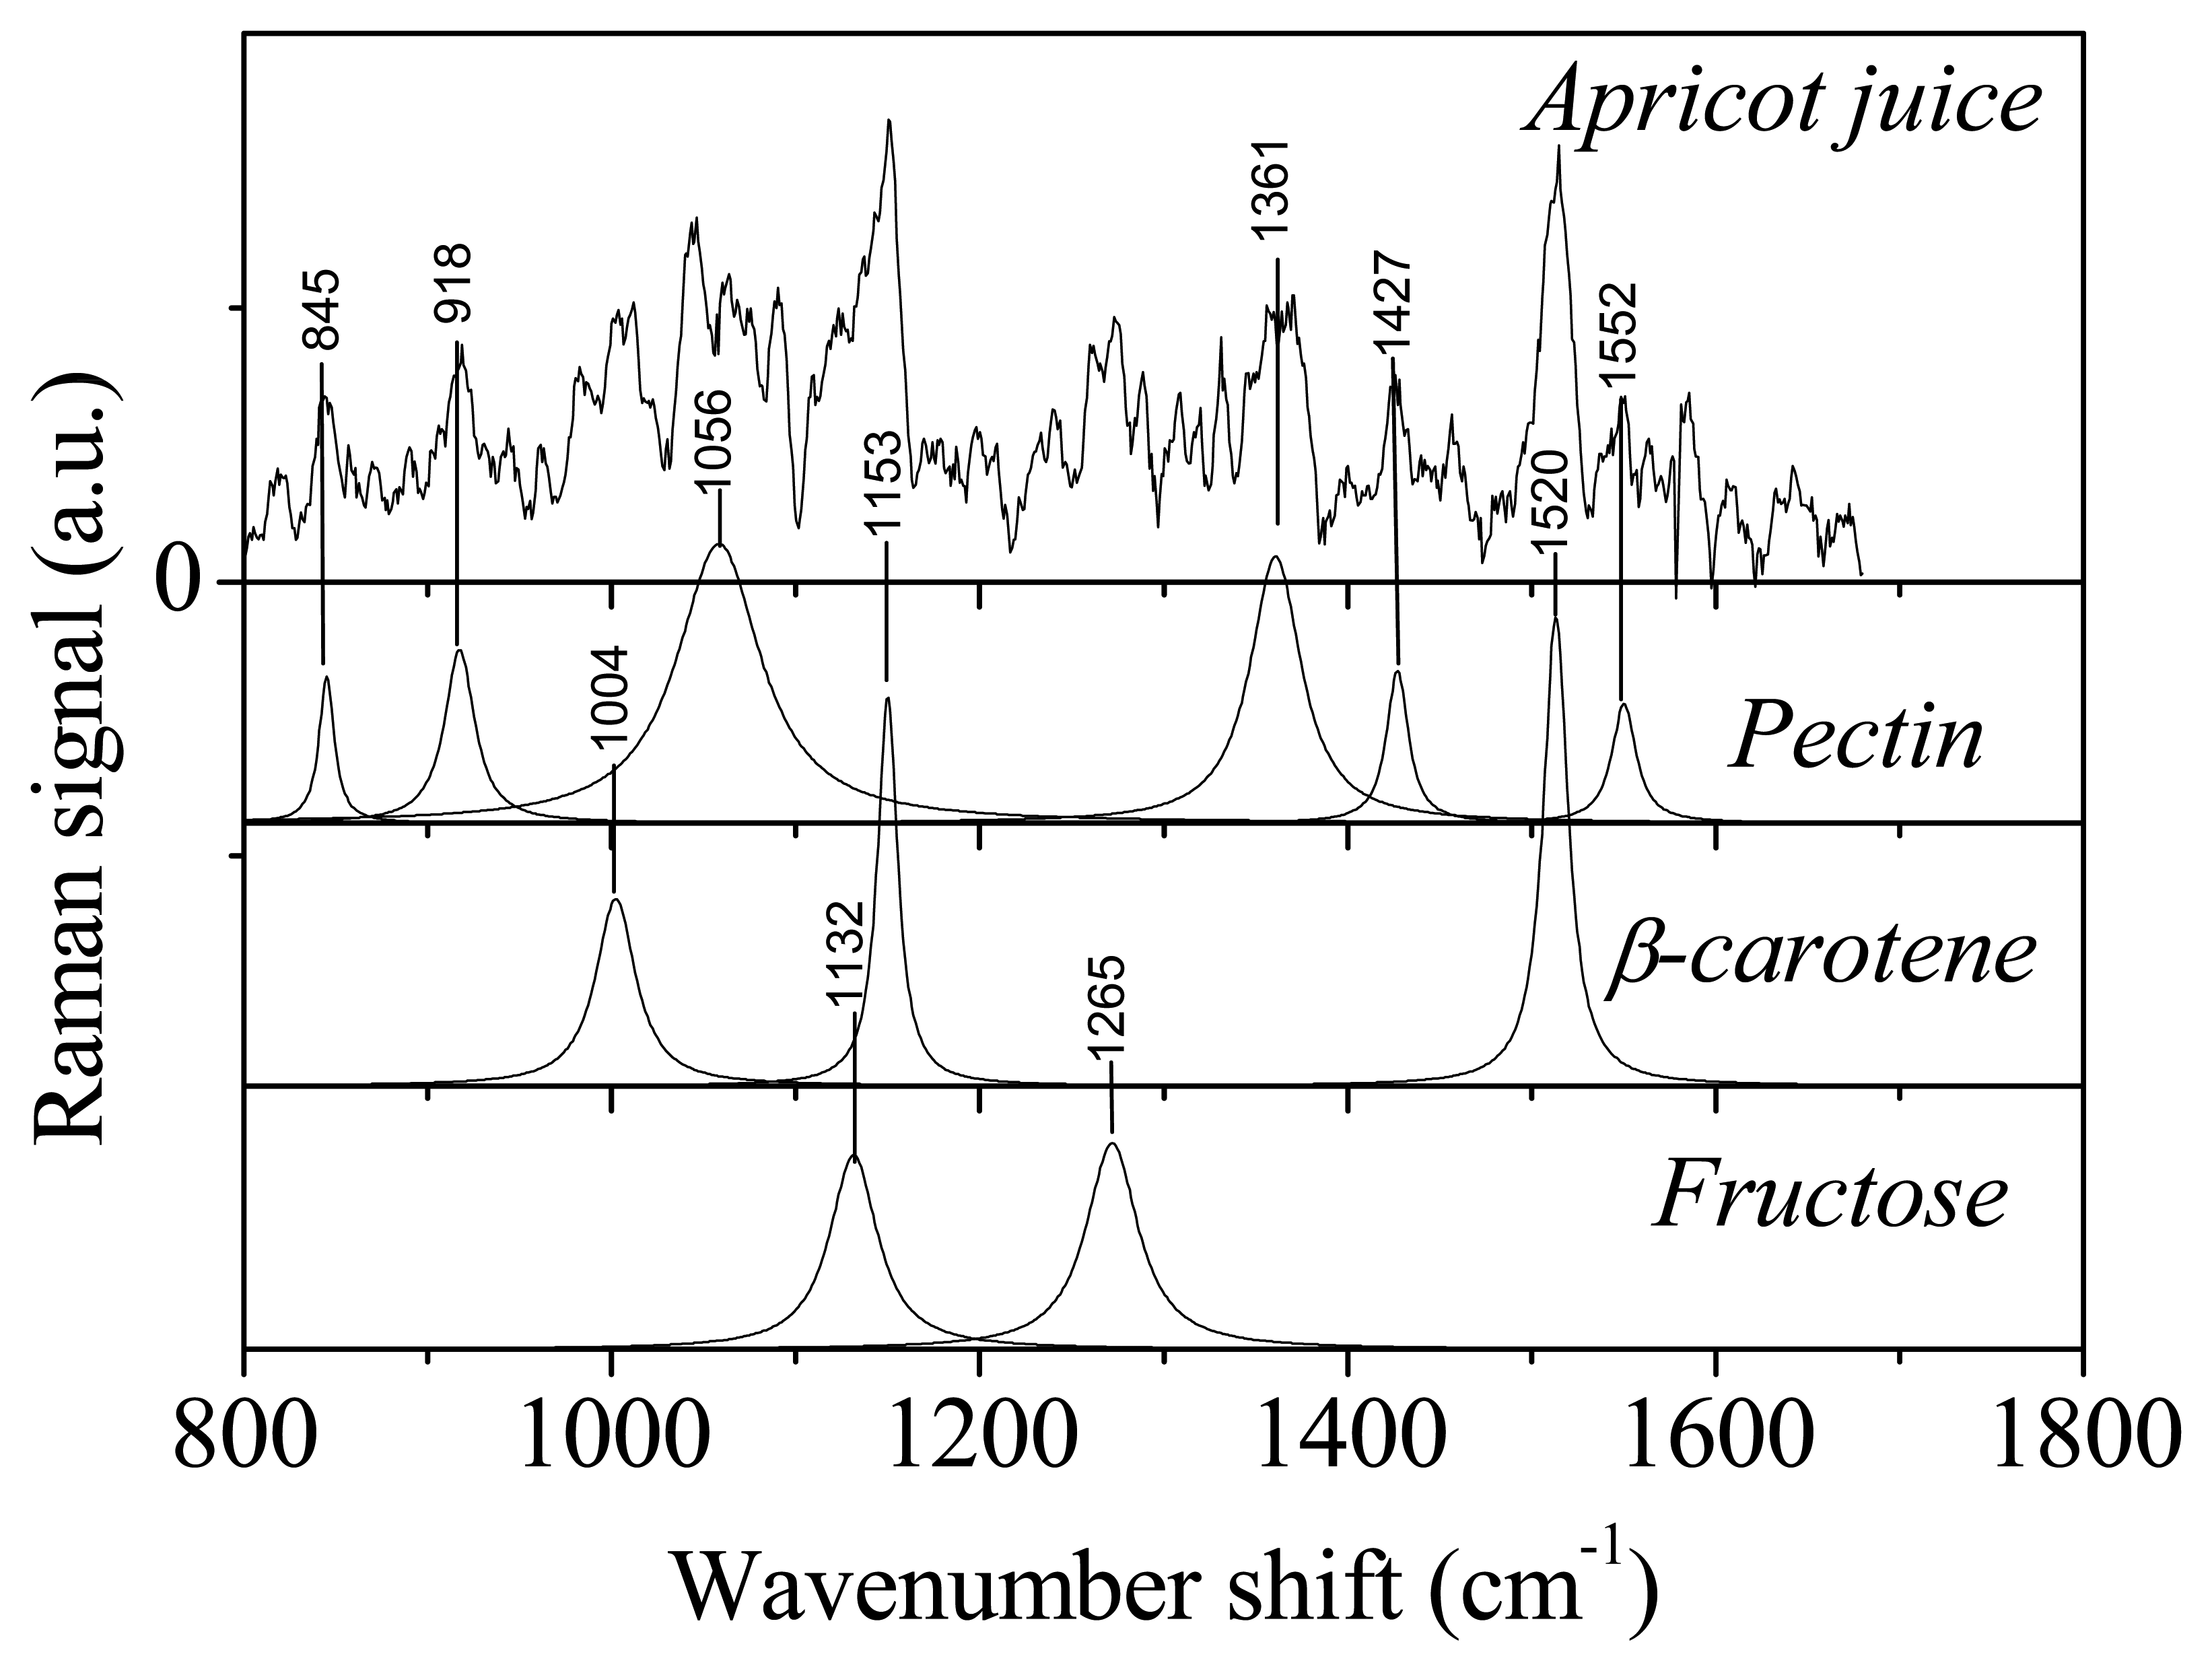
| Peak wavenumber (cm-1) | Pectin | Fructose | β–carotene | Refs. |
|---|---|---|---|---|
| 845 | C-O-C antisymmetric stretching of the glycoside linkage | - | - | 21 |
| 918 | In-plane bending of CH2 | Furanose isomer | - | 20 |
| 1004 | - | - | Methyl component rocking | 23 |
| 1056 | Nonlocalized, highly coupled vibrational modes of polysaccharide backbones | - | - | 21 |
| 1132 | - | Pyranose isomer | - | 20 |
| 1153 | - | - | C-C stretching | 23 |
| 1265 | - | D- fructose | - | 20 |
| 1361 | C-H bending | - | - | 21 |
| 1427 | COO- symmetric stretching | - | - | 21 |
| 1520 | - | - | C=C stretching | 23 |
| 1552 | Amide II: N-H deformation Contribution from C-N stretching | - | - | 21 |
© 2007 by MDPI ( http://www.mdpi.org). Reproduction is permitted for noncommercial purposes.
Share and Cite
Camerlingo, C.; Zenone, F.; Delfino, I.; Diano, N.; Mita, D.G.; Lepore, M. Investigation on Clarified Fruit Juice Composition by Using Visible Light Micro-Raman Spectroscopy. Sensors 2007, 7, 2049-2061. https://doi.org/10.3390/s7102049
Camerlingo C, Zenone F, Delfino I, Diano N, Mita DG, Lepore M. Investigation on Clarified Fruit Juice Composition by Using Visible Light Micro-Raman Spectroscopy. Sensors. 2007; 7(10):2049-2061. https://doi.org/10.3390/s7102049
Chicago/Turabian StyleCamerlingo, Carlo, Flora Zenone, Ines Delfino, Nadia Diano, Damiano Gustavo Mita, and Maria Lepore. 2007. "Investigation on Clarified Fruit Juice Composition by Using Visible Light Micro-Raman Spectroscopy" Sensors 7, no. 10: 2049-2061. https://doi.org/10.3390/s7102049
APA StyleCamerlingo, C., Zenone, F., Delfino, I., Diano, N., Mita, D. G., & Lepore, M. (2007). Investigation on Clarified Fruit Juice Composition by Using Visible Light Micro-Raman Spectroscopy. Sensors, 7(10), 2049-2061. https://doi.org/10.3390/s7102049