Determination of Trace Antimony (III) by Adsorption Voltammetry at Carbon Paste Electrode

1
Department of Chemistry, Shaoguan University, Shaoguan, 512005, China
2
State Key Laboratory of Bioelectronics (Chien-Shiung Wu Laboratory), Southeast University, Nanjing 210096, China
3
Department of Chemistry, Xiangtan University, Xiangtan, 411105, China
*
Authors to whom correspondence should be addressed.
Sensors 2005, 5(4), 284-292; https://doi.org/10.3390/s5040284
Submission received: 12 July 2004
/
Accepted: 2 May 2005
/
Published: 4 May 2005
(This article belongs to the Special Issue Papers presented at I3S2004, Nanjing)
Abstract
:This work presents a sensitive method for the determination of trace antimony based on the antimony-pyrogallol red (PGR) adsorption at a carbon paste electrode (CPE). The optimal conditions were to use an electrode containing 25% paraffin oil and 75% high purity graphite powder as working electrode, a 0.10 mol/L HCl solution containing 3.0×10⁻⁵ mol/L PGR as accumulation medium and a 0.20 mol/L HCl solution as electrolyte with an accumulation time of 150 s and a reduction time of 60 s at -0.50 V followed with a sweep from -0.50 V to 0.20 V. The mechanism of the electrode reaction was discussed. Interferences of other metal ions were studied as well. The detection limit was 1×10⁻⁹ mol/L. The linear range was from 2.0×10⁻⁹ mol/L to 5.0×10⁻⁷ mol/L. Application of the proposed method to the determination of antimony in water and human hair samples gave good results.
Introduction
Antimony (Sb), in trace and ultratrace amounts, is an important element in biological and environmental systems. It is a toxic element and seriously harmful to human health. It is considered as pollutant of priority interest by the Environmental Protection Agency of the United States and the Council of the European Communities. Therefore, it is not surprising that various methods have been developed for Sb determination [1-4]. Among these methods electrochemical stripping analysis is favored for its high sensitivity, low cost, as well as easy and rapid operation.
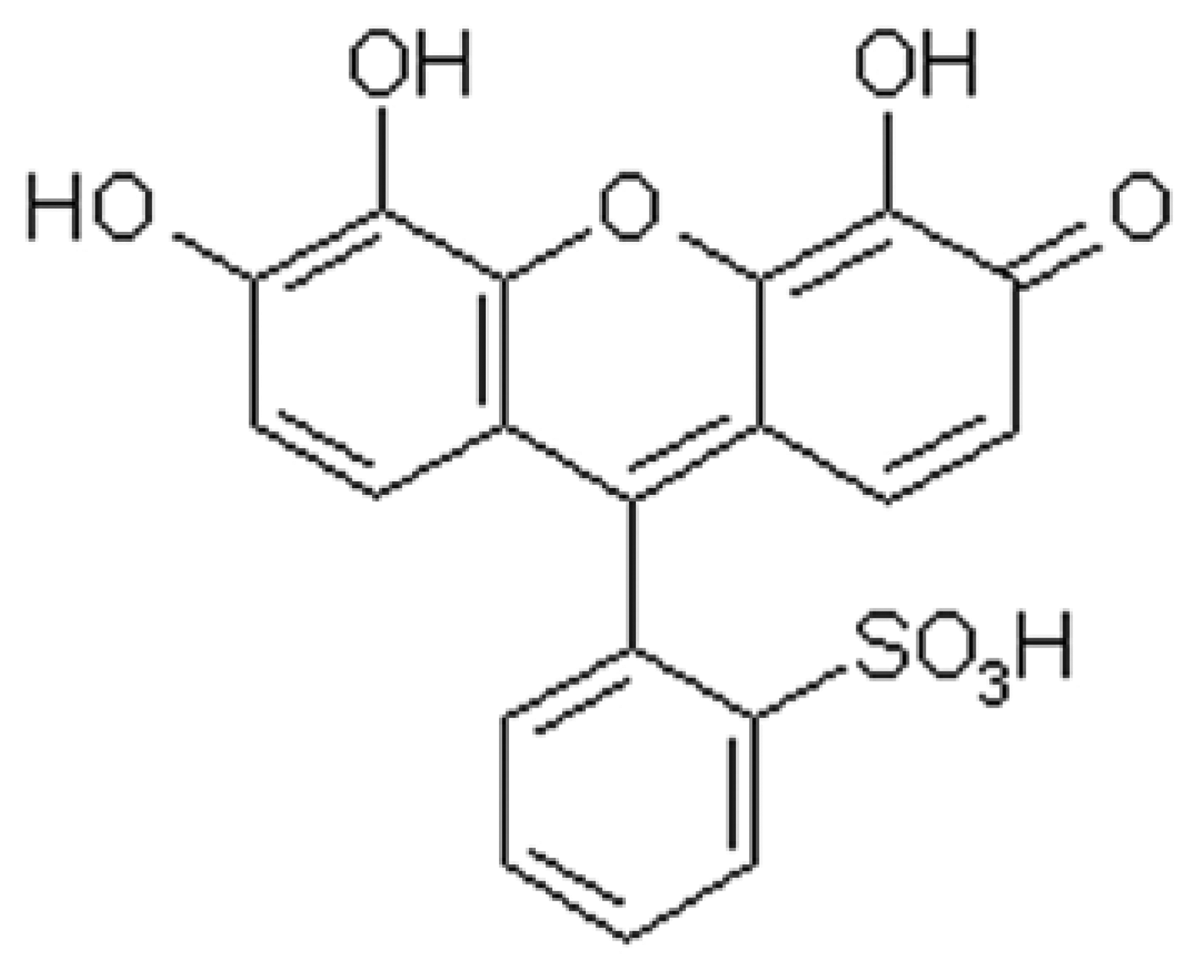
Pyrogallol red (PGR), a metal sensitive dye, is a widely used hydroxyketone ligand with the structure shown in Figure 1. It has been applied to the determination of various substances such as tin (IV) [5], copper (II) [6], nitrite [7], and proteins [8].
The application of carbon paste electrode (CPE) has attracted considerable attention in recent years. CPEs have several advantages such as nontoxic, low background current, wide range of used potential, rapid renewal, and easy fabrication [9-10]. We have reported a pyrogallol red modified carbon paste electrode for the determination of Sb (III) [11]. Though this method was found to be sensitive, it was only applied to spiked samples due to the serious interference of Cu (II). The aim of this work was to develop a simple, selective and sensitive method for the determination of Sb (III) by adsorptive voltammetry on CPE in real samples.
Experimental
Reagents and solutions
Chemicals were of analytical reagent grade unless otherwise stated. A 1.0×10⁻³ mol/L antimony (III) stock solution was prepared by dissolving an appropriate amount of antimony oxide in 6 mol/L HCl. Pyrogallol red (PGR, Sigma) solution (1×10⁻³ mol/L) was prepared by dissolving PGR (0.1001 g) in ethanol (100 mL), then diluting to 250 mL with double distilled water. Carbon paste was prepared by thoroughly mixing 0.5 g of paraffin oil with 1.5 g of high purity graphite powder. All other solutions were prepared using standard laboratory procedures. Double distilled water was used throughout.
Apparatus
A JP-303 polarographic analyzer (Chengdu Instrument Factory) was used for the electrochemical experiments. A working carbon paste electrode was prepared by packing carbon pastes into a glass tube (4 mm inner diameter) with a stainless steel rod as the electric contact. The surface of working electrode was polished on a sheet of graph paper. This working electrode was used together with a platinum wire counter electrode and a saturated calomel reference electrode (SCE). A magnetic stirrer (Shanghai Analytical Instrument Company) with a Teflon-coated stirring bar was used in the accumulation, cleaning and rinsing steps.
Procedure
The electrode surface was immersed in a preconcentration solution (0.10 mol/L HCl) which contains an appropriate concentration of Sb (III) and 3.0×10⁻⁵ mol/L PGR, and the accumulation ofSb(III)-PGR complex onto the electrode surface was achieved at open circuit, under constant stirring. After the accumulation, the electrode was removed, rinsed with water and dried with absorbent paper. Then it was introduced into the separate voltammetric cell containing only a supporting electrolyte (0.20 mol/L HCl). A cathodic potential (-0.50 V) was applied for 60 s in the quiescent supporting medium to ensure the reduction of the accumulated species. Finally, the second-order derivative voltammogram was recorded by applying a potential scan at a scan rate of 100 mV/s from -0.50 V to 0.20 V. The same electrode surface could be reused without any treatment for at least 30 successive experiments. Further use required a renewal of the electrode surface by mechanical smoothing, similarly as reported elsewhere [9-10]. All experiments were performed at room temperature and it was not necessary to remove oxygen from the solution.
Results and Discussion
Adsorptive and voltammetric characteristics of the Sb (III)-PGR complex on CPE
As shown in Figure 2, curve 1, no peak was found when the CPE was processed according to the procedure showed above in a solution only containing 1.0×10⁻⁷ mol/L Sb (III). Anodic stripping voltammograms (ASVs) were obtained in the solution of PGR without (Figure 2, curve 2) and with (Figure 2, curve 3) Sb (III). The ASV in the solution of PGR without Sb (III) did not show any current peak in the potential range used, whereas the ASV in the solution of PGR with Sb (III) illustrated a sensitive anodic peak at about 0.08 V. It seems clear that the Sb (III)-PGR complex in the solution can be accumulated onto the electrode surface during the preconcentration period, and, then reduced to Sb(0) during the reduction interval. The anodic peak at about 0.08 V corresponds to the oxidation of Sb(0) on the electrode surface to Sb (III).
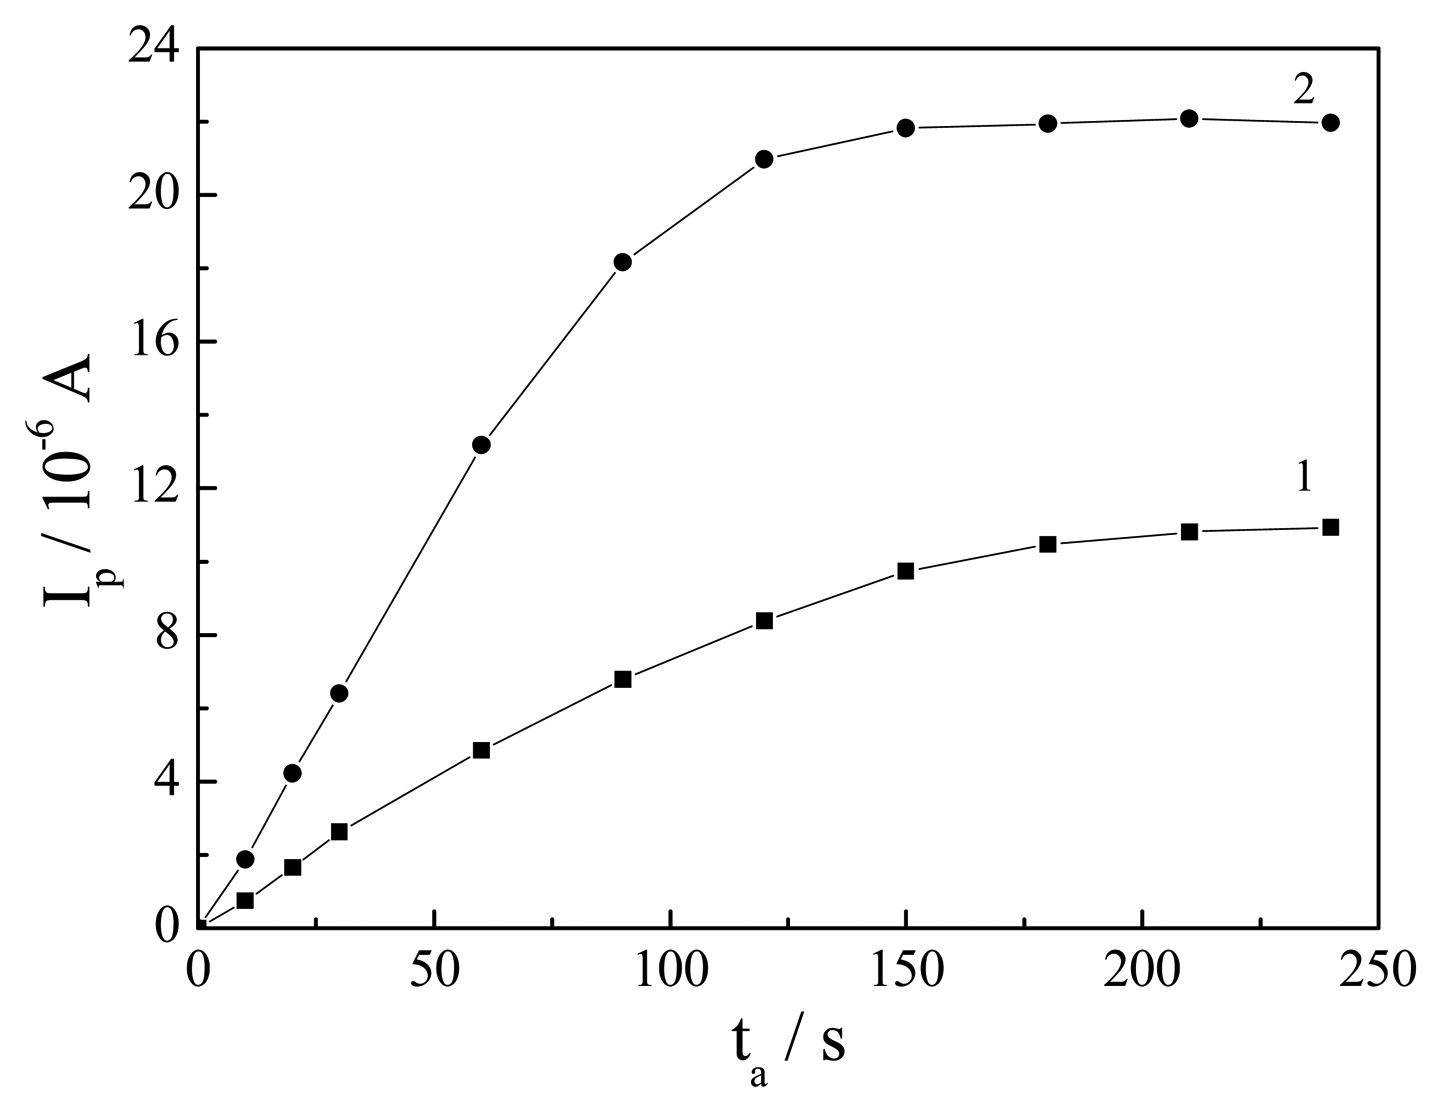
Figure 3 shows the plots of the peak current varying with the accumulation time (ta) for 1.0×10⁻⁷ mol/L and 5.0×10⁻⁸ mol/L Sb (III), respectively. The trends were nearly the same as those obtained from this kind of electrode [9-11], i.e., both curves showed initially linear behavior, stripping peak current increased with an increasing accumulation time until the peak current reached a plateau, which indicates adsorption equilibrium was achieved. The plots in Figure 3 also displayed a steeper slope at higher concentration of Sb (III), pointing to a higher rate of uptake of Sb (III)-PGR complex on the electrode surface and a longer accumulation time required to reach the current plateau at a lower concentration of Sb (III). A preconcentration time of 150 s was selected for further studies in order to keep the linear relationship at a higher concentration level of Sb (III).
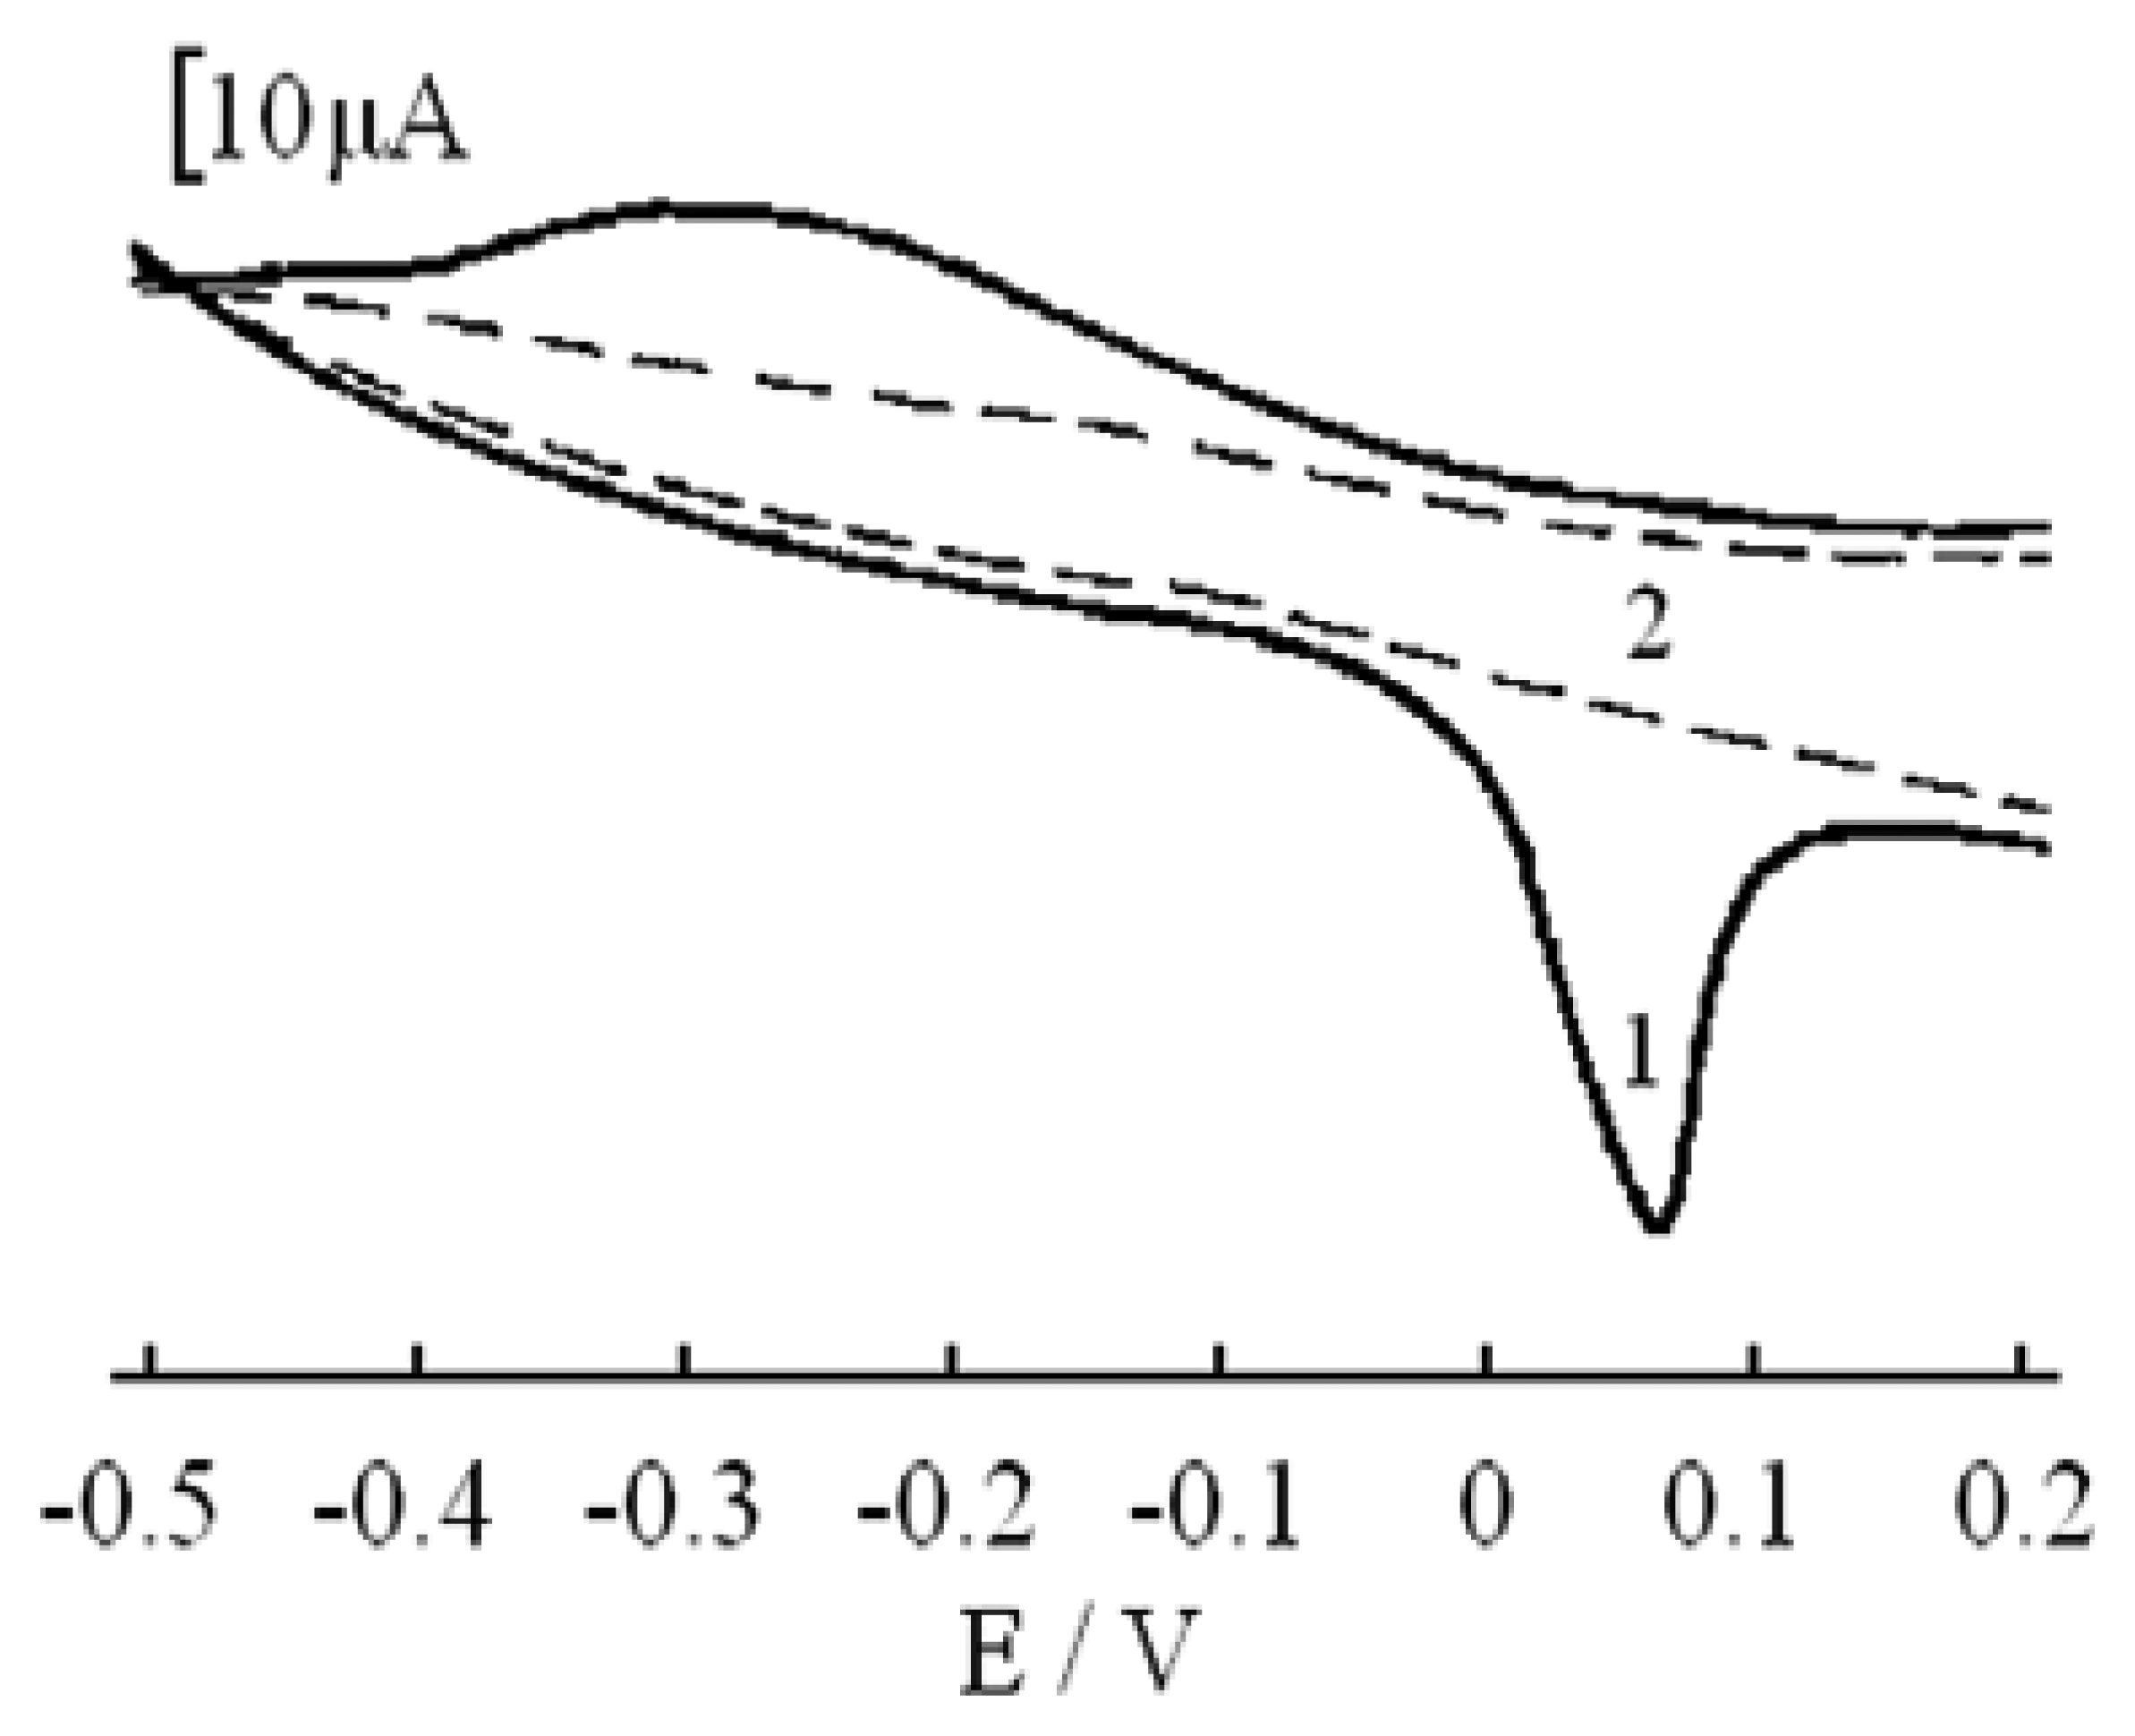
In order to further investigate the behavior of the Sb (III)-PGR complex on the CPE, cyclic voltammetry was adopted. Figure 4 displays cyclic voltammograms (CVs) after preconcentration for 150 s on CPEs in 0.10 mol/L HCl solution containing 1.0×10⁻⁶ mol/L Sb (III) and 3.0×10⁻⁵ mol/L PGR (curve 1). The anodic peak at 0.08 V corresponds to the oxidation of Sb (0) on the electrode surface to Sb (III), and the cathodic peak at -0.30 V corresponds to the reduction of Sb (III) in the Sb (III)-PGR complex to Sb (0). The fact that the peak current rapidly decreased upon repetitive scanning (curve 2) indicates the Sb (0) precipitated on the electrode surface can be completely stripped into the supporting electrolyte, which conduced to the renewal of the electrode surface.
Selection of the adhesive in the electrode
Mineral butter, silicon oil, solid paraffin and liquid paraffin were tested as the adhesive of the CPE. It was found that liquid paraffin was the best choice for the highest sensitivity. The effect of paraffin oil content in the CPE was investigated as well. It was found that too high oil contents would increase the hydrophobic character of the electrode surface, limiting somewhat the adsorption of Sb (III)-PGR complex onto the CPE surface. However, at the same time too low oil loadings resulted in rather poor reproducibility due to the lack in compaction of the electrode materials. Hence, CPEs containing 25% paraffin oil were employed in all subsequent experiments.
Effect of the supporting medium
Seven media, namely sodium hydroxide, phosphate buffer, Britton-Robinson buffer, acetate buffer, sulfuric acid, nitric acid and hydrochloric acid were tested as accumulation supporting media. It was found that sulfuric acid, nitric acid and hydrochloric acid were outstanding in terms of peak shape and sensitivity. Among these three media, the best peak shape was obtained in hydrochloric acid. When the concentration of hydrochloric acid was 0.10 mol/L, the highest peak height was obtained. A 0.10 mol/L HCl solution was chosen as accumulation supporting medium accordingly.
Solutions discussed above were also examined as stripping electrolyte medium. A sensitive and shapely peak was obtained when a 0.20 mol/L HCl solution was used. Therefore, a 0.20 mol/L HCl solution was selected as reduction and stripping medium for further studies.
Effect of the concentration of PGR
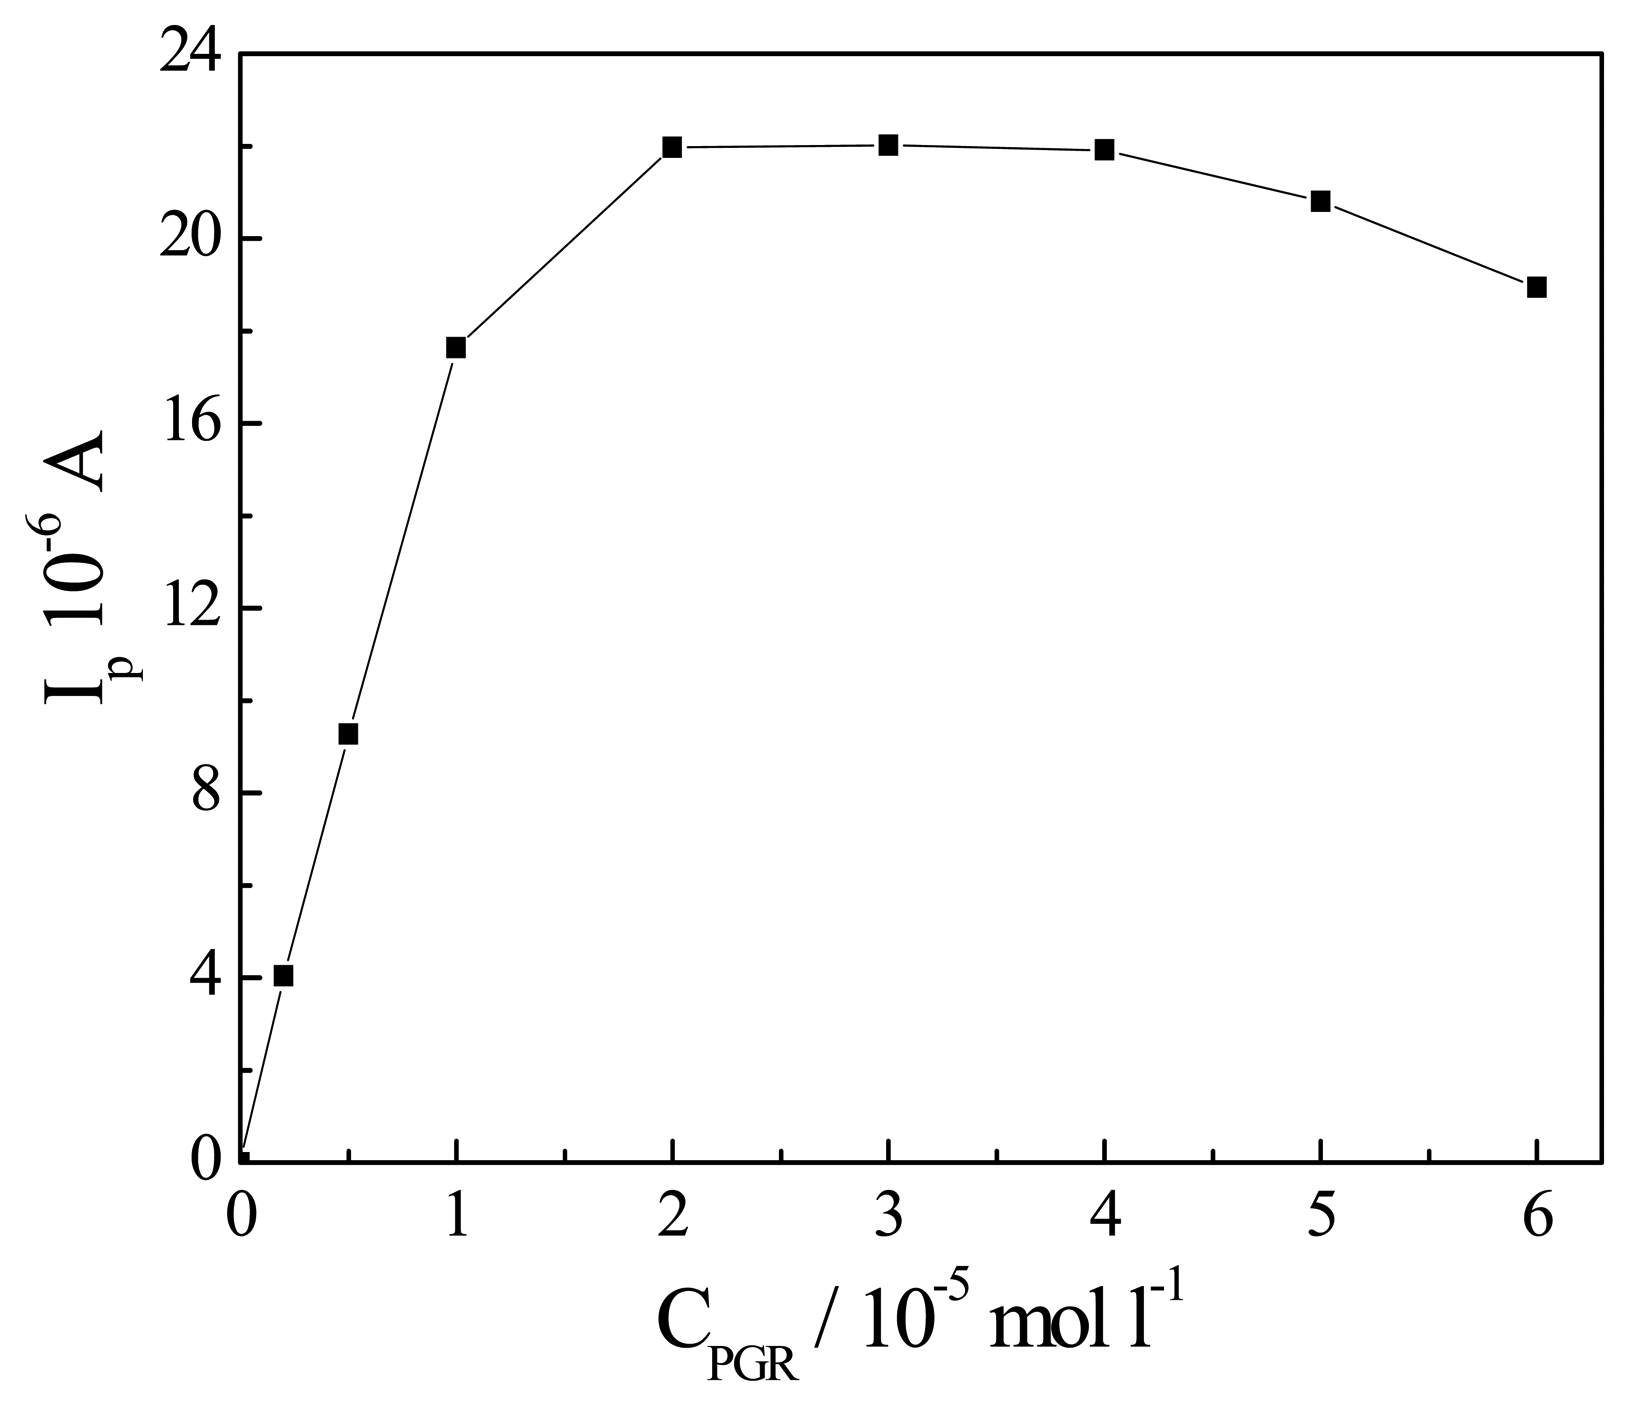
Figure 5 shows the effect of variation of PGR concentration on the peak current. The peak current increased with increasing PGR concentration up to 2.0×10⁻⁵ mol/L and remained constant when the concentration of PGR was in the range from 2.0×10⁻⁵ mol/L to 4.0×10⁻⁵ mol/L. Higher concentration of PGR led to somewhat decrease of the peak current, which was most probably due to the competitive adsorption of PGR and Sb (III)-PGR complex on the CPE surface. Thus, an optimum PGR concentration of 3.0×10⁻⁵ mol/L was selected for further experiments.
Effect of the reduction potential and time
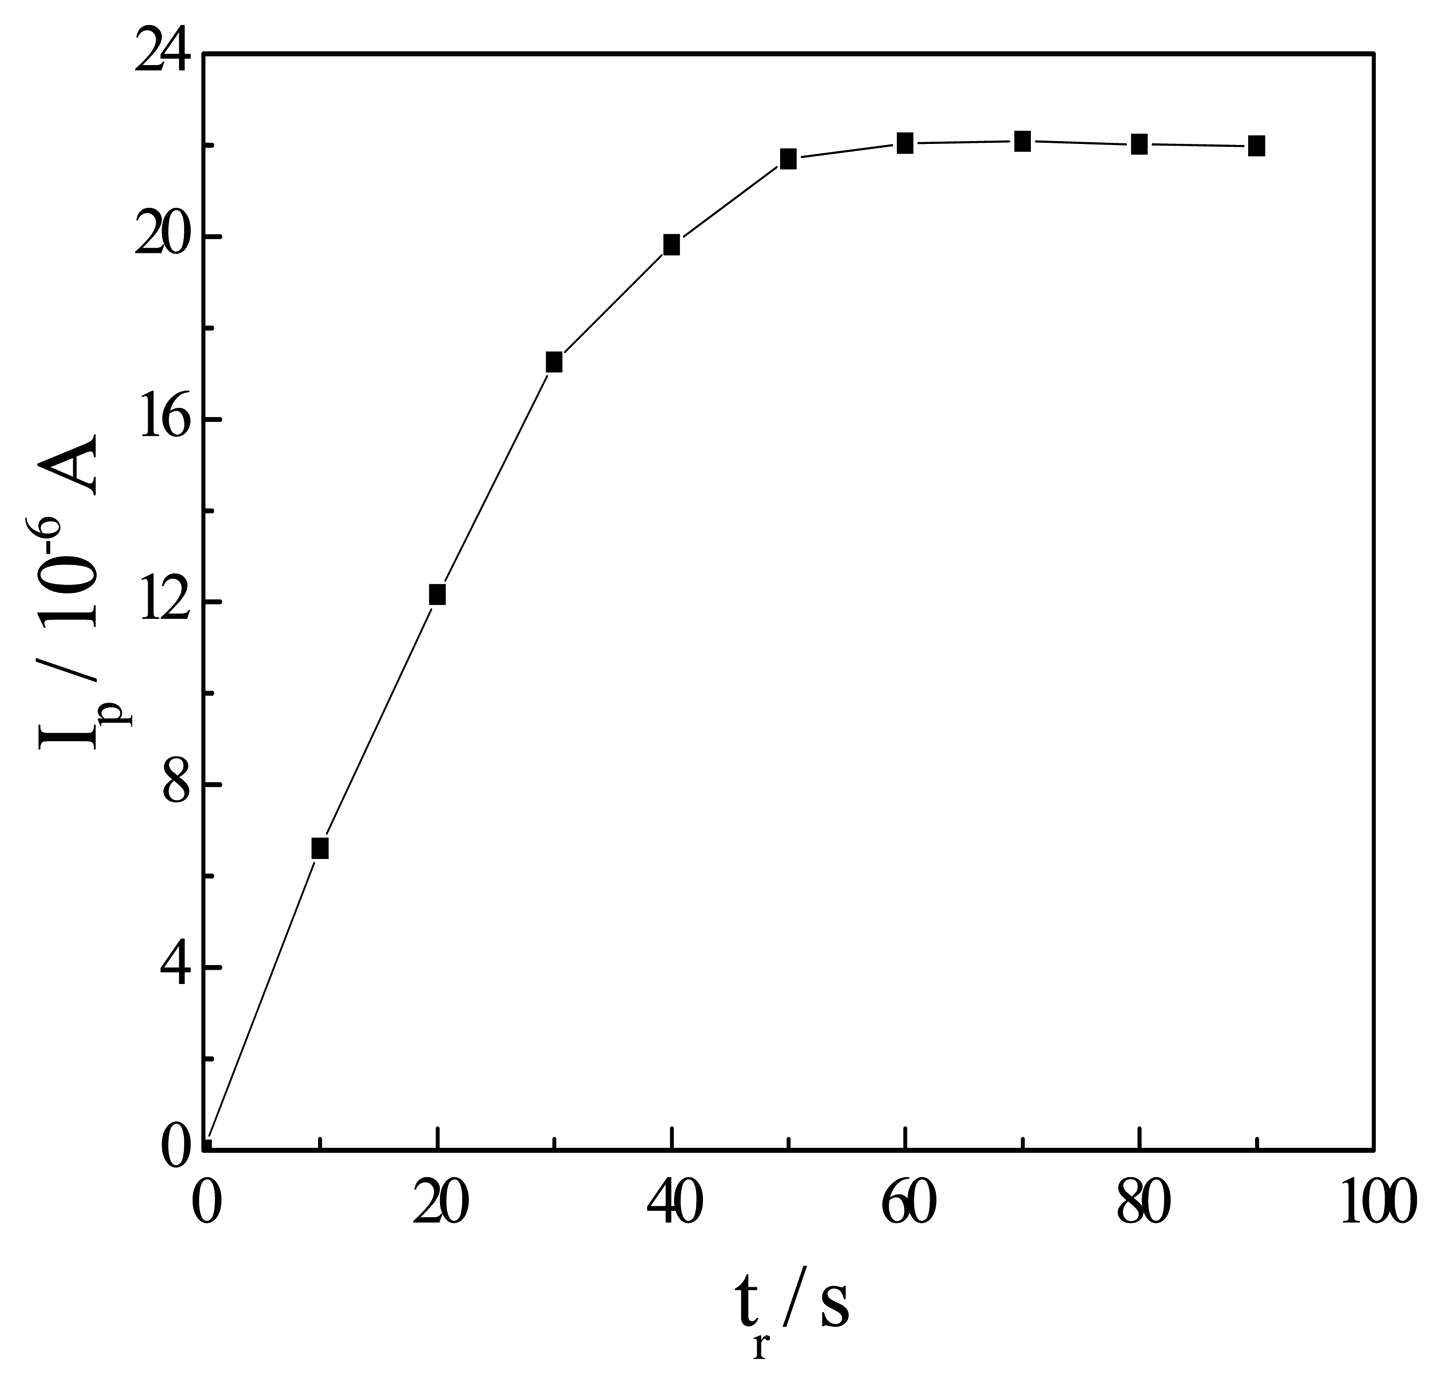
The peak current increased sharply with negative-going reduction potential up to -0.40 V and then remained constant till -0.55 V (Figure 6). When the reduction potential was more negative than -0.60 V, the peak current decreased rapidly, which was due to the fact that hydrogen ions in the aqueous solution were reduced to hydrogen and, therefore, led to the exfoliation of the Sb (0) from the electrode surface. Accordingly, -0.50 V was selected as the reduction potential for all subsequent studies. Under this reduction potential, a 60 s of reduction time (tr) was judged to be sufficient and was therefore favored (Fig. 7).
Linear range and detection limit of the method
The second-order derivative peak current increased linearly with Sb (III) concentration over the range from 2.0×10⁻⁹ mol/L to 5.0×10⁻⁷ mol/L. The detection limit (three times signal to noise) was found to be 1×10⁻⁹ mol/L with a preconcentration time of 150 s and a reduction time of 60 s. After the CPE was activated, the relative standard deviation (R.S.D.) of 4.7% was obtained by ten successive determinations of 1.0×10⁻⁷ mol/L Sb(III).
Interference studies
To check the selectivity of the proposed stripping voltammetric method for the Sb (III) ions, various metal ions, as potential interferents, were tested. The results showed that less than a 500-fold molar excess of Ca2+, Mg2+, Zn2+, Ba2+; a 100-fold molar excess of Al3+, Fe3+,Cr3+, Mn2+; a 50-fold molar excess of Fe2+, Co2+, Ni2+, Ga (III), Ge (IV), Se (IV), Ti (IV), V (V); a 20-fold molar excess of Cd2+, Hg2+, As (III), Sn (IV); a 10-fold molar excess of Pb2+, Bi3+, Ag+ and 5-fold molar excess of Cu2+ did not interfere the determination of 1.0×10⁻⁷ mol/L Sb (III). When adding 1.0×10⁻³ mol/L sodium oxalate into the accumulation medium, the sustainable coexistent concentration of Cu2+, Pb2+ and Bi3+ could be increased up to 50-fold, 100-fold and 100-fold molar excess over Sb (III), respectively.
Analytical applications
The proposed method was applied to the determination of antimony in water and human hair samples. Samples were pretreated according to [12] and [13] and concentrated to a suitable volume by slowly heating evaporation before the determination. A proper amount of Na2C2O4 was added to the sample solution to obtain a final concentration of 1.0×10⁻³ mol/L. A suitable volume was transferred into a cell for the determination of antimony, using the procedure described above. The results, summarized in Tables 1 and 2, showed satisfactory recoveries.
Conclusions
This paper showed that the pyrogallol red is a useful ligand for the highly sensitive and selective determination of Sb (III) by adsorptive stripping voltammetry at CPE. The cheap, nonpoisonous CPE was used instead of the severe toxic, expensive mercury electrode in this method. Thus, it has excellent environmental and economical benefit. In this method, the accumulation was achieved by non-electrochemical deposition step and the stripping analysis was performed in a pure electrolyte solution. This approach not only enhanced the sensitivity but also eliminated the majority of the interferences from the sample background. Compared with the determination method of antimony based on CPE previously reported [11], the method presented here had a lower detection limit and a higher selectivity (not interfered so strongly by other metal ions). The determination results of trace antimony in water and human hair samples gave good results.
Acknowledgments
This research was supported by the Natural Science Foundation of China, the Trans-Century Training Programme Foundation for the Talents by the Ministry of Education of China, the Chinese Post Doctoral Science Foundation, the Natural Science Research Program of Education Department of Guangdong Province (Z02078), and the Science and Technology Research Program of Guangdong Province.
References
- Kubota, T.; Kawakami, A.; Sagara, T.; Ookubo, N.; Okutani, T. Determination of antimony content in natural water by graphite furnace atomic absorption spectrometry after collection as antimony (III)-pyrogallol complex on activated carbon. Talanta 2001, 53, 1117. [Google Scholar]
- Deng, T.L.; Chen, Y.W.; Belzile, N. Antimony speciation at ultra trace levels using hydride generation atomic fluorescence spectrometry and 8-hydroxyquinoline as an efficient masking agent. Anal. Chim. Acta 2001, 432, 293. [Google Scholar]
- Quentel, F.; Filella, M. Determination of inorganic antimony species in seawater by differential pulse anodic stripping voltammetry: stability of the trivalent state. Anal. Chim. Acta 2002, 452, 237. [Google Scholar]
- Tanaka, T.; Ishiyama, T.; Okamoto, K. Determination of Antimony in Steel by Differential Pulse Anodic Stripping Voltammetry at a Rotating Gold Film Electrode. Anal. Sci. 2000, 16, 19. [Google Scholar]
- Long, H.; Hou, X.F.; Li, Y.H. Polarographic Adsorptive Catalytic Wave of Tin (IV)-Pyrogallol Red-Vanadium (IV)-Sodium Dodecyl Sulfonate System. Chin. J. Anal. Chem. 1999, 27, 316. [Google Scholar]
- Safavi, A.; Shams, E. Determination of trace amounts of copper (II) by adsorptive stripping voltammetry of its complex with pyrogallol red. Anal. Chim. Acta 1999, 385, 265. [Google Scholar]
- Kazemzadeh, A.; Ensafi, A.A. Simultaneous determination of nitrite and nitrate in various samples using flow-injection spectrophotometric detection. Microchem. J. 2001, 69, 159. [Google Scholar]
- Williams, K.M.; Marshall, T. Protein concentration of cerebrospinal fluid by precipitation with Pyrogallol Red prior to sodium dodecyl sulphate-polyacrylamide gel electrophoresis. J. Biochem. Biophys. Methods 2001, 47, 197. [Google Scholar]
- Mousavi, M.F.; Rahmani, A.; Golabi, S.M.; Shamsipur, M.; Sharghi, H. Differential pulse anodic stripping voltammetric determination of lead (II) with a 1,4-bis(prop-2′-enyloxy)-9,10-anthra- quinone modified carbon paste electrode. Talanta 2001, 55, 305. [Google Scholar]
- Abbaspour, A.; Moosavi, S.M.M. Chemically modified carbon paste electrode for determination of copper (II) by potentiometric method. Talanta 2002, 56, 91. [Google Scholar]
- Guo, H.S.; Li, Y.H.; Xie, H.Q. Determination of Trace Antimony by Adsorptive Stripping Voltammetry with Pyrogallol Red Modified Carbon Paste Electrode. Nat. Sci. J. of Xiangtan Univ. 2001, 23, 68. [Google Scholar]
- Wei, X.Y.; Tan, J.X. Polarographic Adsorptive Complex Catalytic Wave of Antimony (III) and Tin (IV) with 7-Iodo-8-hydroxyquinolin-5-sulfonic Acid (Ferron) and Its Application. Fenxi Shiyanshi 1996, 15, 58. [Google Scholar]
- Zhang, X.L.; Ma, C.S.; Wang, L.Z.; Zhang, J.G. Trace adsorptive voltammetric determination of antimony in hair. Talanta 1995, 42, 897. [Google Scholar]
Figure 1.
The structure of pyrogallol red (PGR).

Figure 2.
Anodic stripping curves of (1) 1.0×10⁻⁷ mol/L Sb (III); (2) 3.0×10⁻⁵ mol/L PGR; (3) 1.0×10⁻⁷ mol/L Sb (III) + 3.0×10⁻⁵ mol/L PGR. Preconcentration medium, 0.10 mol/L HCl; preconcentration time: 150 s; reduction and stripping medium, 0.20 mol/L HCl; reduction time and potential: 60 s, -0.50 V; scan rate: 100 mV/s.
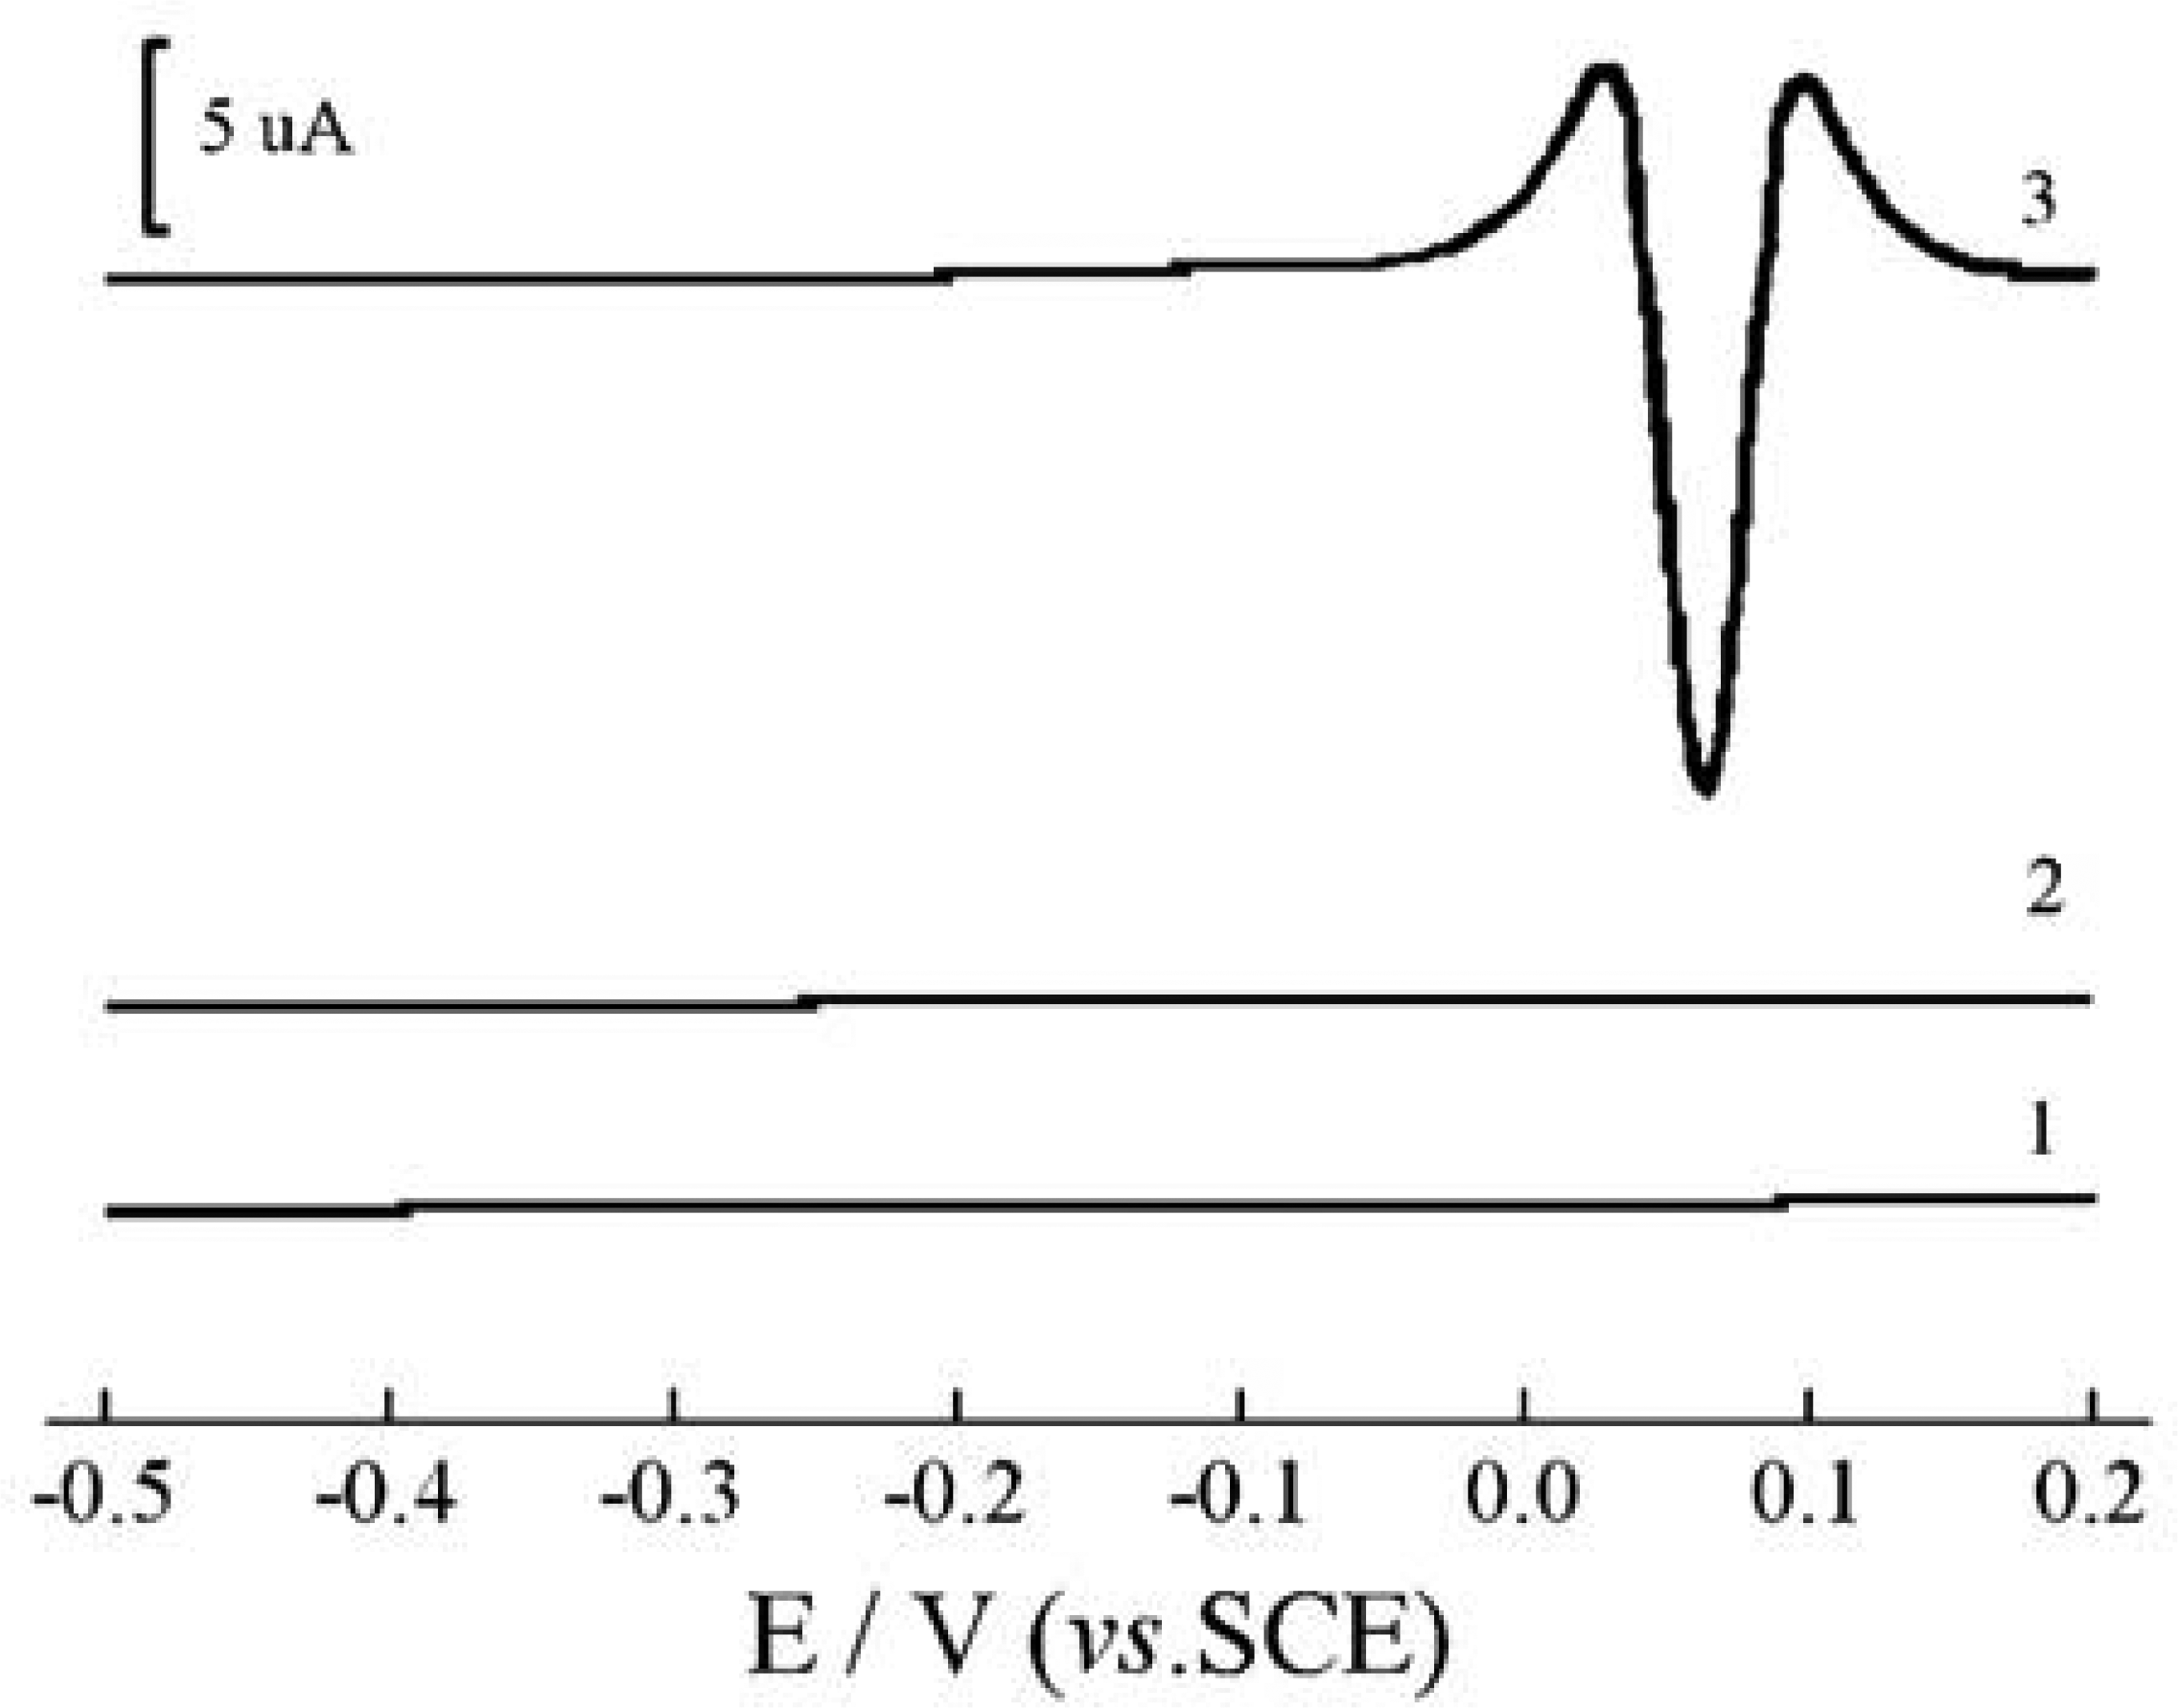
Figure 3.
Effect of preconcentration time on the peak current. Open-circuit preconcentration in (1) 5.0×10⁻⁸ mol/L Sb (III); (2) 1.0×10⁻⁷ mol/L Sb (III). Other conditions as in Figure 2, curve 3.
Figure 3.
Effect of preconcentration time on the peak current. Open-circuit preconcentration in (1) 5.0×10⁻⁸ mol/L Sb (III); (2) 1.0×10⁻⁷ mol/L Sb (III). Other conditions as in Figure 2, curve 3.

Figure 4.
Cyclic voltammograms of the CPE preconcentration in 0.10 mol/L HCl solution containing 1.0×10⁻⁶ mol/L Sb (III) and 3.0×10⁻⁵ mol/L PGR. (1) the first scan; (2) the repetitive scan. Scan rate: 50 mV/s, other conditions as in Figure 2, curve 3.
Figure 4.
Cyclic voltammograms of the CPE preconcentration in 0.10 mol/L HCl solution containing 1.0×10⁻⁶ mol/L Sb (III) and 3.0×10⁻⁵ mol/L PGR. (1) the first scan; (2) the repetitive scan. Scan rate: 50 mV/s, other conditions as in Figure 2, curve 3.

Figure 5.
Effect of PGR concentration on the peak current. Other conditions as in Figure 2, curve 3.
Figure 5.
Effect of PGR concentration on the peak current. Other conditions as in Figure 2, curve 3.

Figure 6.
Effect of reduction potential on the peak current. Other conditions as in Figure 2 curve 3.
Figure 6.
Effect of reduction potential on the peak current. Other conditions as in Figure 2 curve 3.
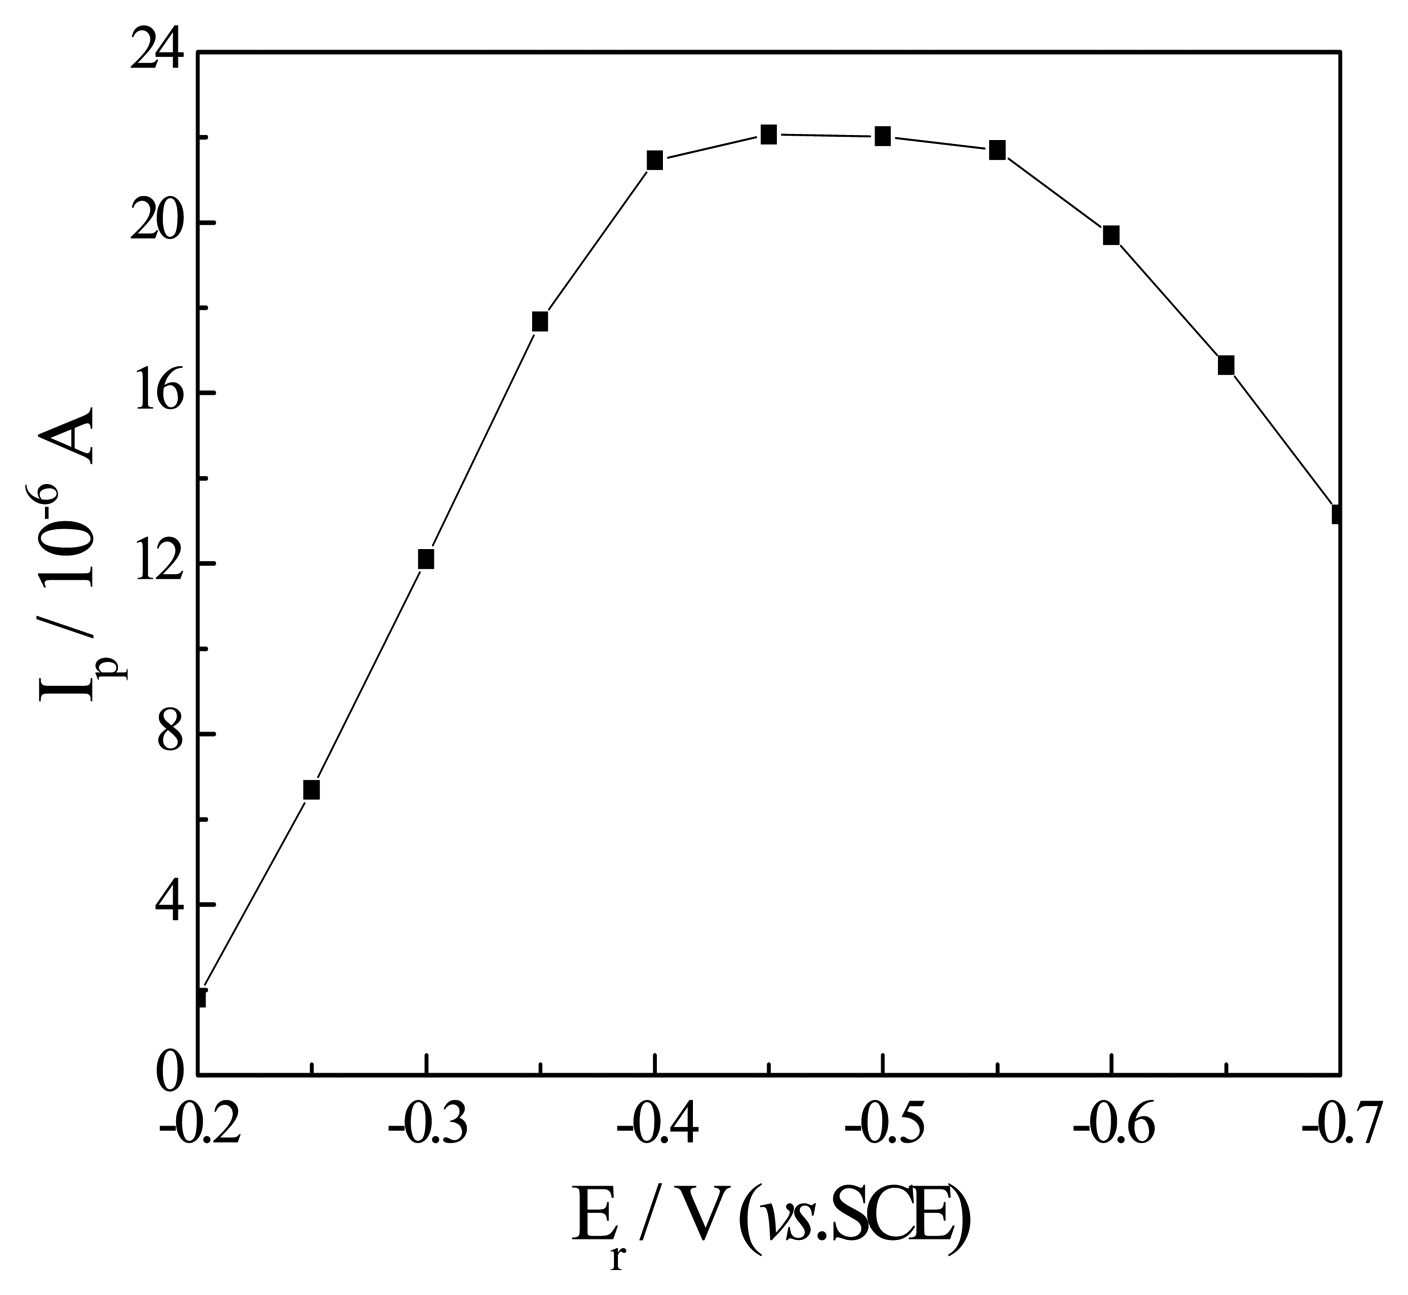
Figure 7.
Effect of reduction time on the peak current. Other conditions as in Figure 2, curve 3.
Figure 7.
Effect of reduction time on the peak current. Other conditions as in Figure 2, curve 3.

| Sample | Found (μg/L) | R.S.D. (%) | Added Sb3+ (μg/L) | Total found (μg/L) | Recovery (%) |
|---|---|---|---|---|---|
| Tap water | 0.24 | 3.8 | 0.50 | 0.72 | 96 |
| River water | 0.32 | 4.2 | 0.50 | 0.83 | 102 |
| Waste water | 1.68 | 4.7 | 0.50 | 2.17 | 98 |
| Sample | Found (μg/g) | R.S.D. (%) | Added Sb3+ (μg/g) | Total found (μg/g) | Recovery (%) |
|---|---|---|---|---|---|
| Human hair 1 | 6.57 | 3.4 | 5.00 | 11.49 | 98.4 |
| Human hair 2 | 5.88 | 5.3 | 5.00 | 11.06 | 103.6 |
© 2005 by MDPI ( http://www.mdpi.org). Reproduction is permitted for noncommercial purposes.
Share and Cite
MDPI and ACS Style
Guo, H.; Li, Y.; Chen, X.; Nie, L.; He, N. Determination of Trace Antimony (III) by Adsorption Voltammetry at Carbon Paste Electrode. Sensors 2005, 5, 284-292. https://doi.org/10.3390/s5040284
AMA Style
Guo H, Li Y, Chen X, Nie L, He N. Determination of Trace Antimony (III) by Adsorption Voltammetry at Carbon Paste Electrode. Sensors. 2005; 5(4):284-292. https://doi.org/10.3390/s5040284
Chicago/Turabian StyleGuo, Huishi, Yiheng Li, Xiaokang Chen, Libo Nie, and Nongyue He. 2005. "Determination of Trace Antimony (III) by Adsorption Voltammetry at Carbon Paste Electrode" Sensors 5, no. 4: 284-292. https://doi.org/10.3390/s5040284