
A Review of Deep Learning-Based Methods for Pedestrian Trajectory Prediction


Abstract
:1. Introduction
- The sensor types, typically used in the context of our problem, are presented in relation to the DL techniques that use them.
- A detailed analysis of deep learning approaches for pedestrian trajectory prediction is performed.
- An overview of the most important datasets in the field, considering sensor types, size, number of pedestrians, location, view, etc., is also provided.
- An emphasis on the research gaps from the literature and an outline of potential new research directions.
2. Sensor Technologies for Pedestrian Trajectory Prediction
2.1. Automotive Sensing
2.2. Radar
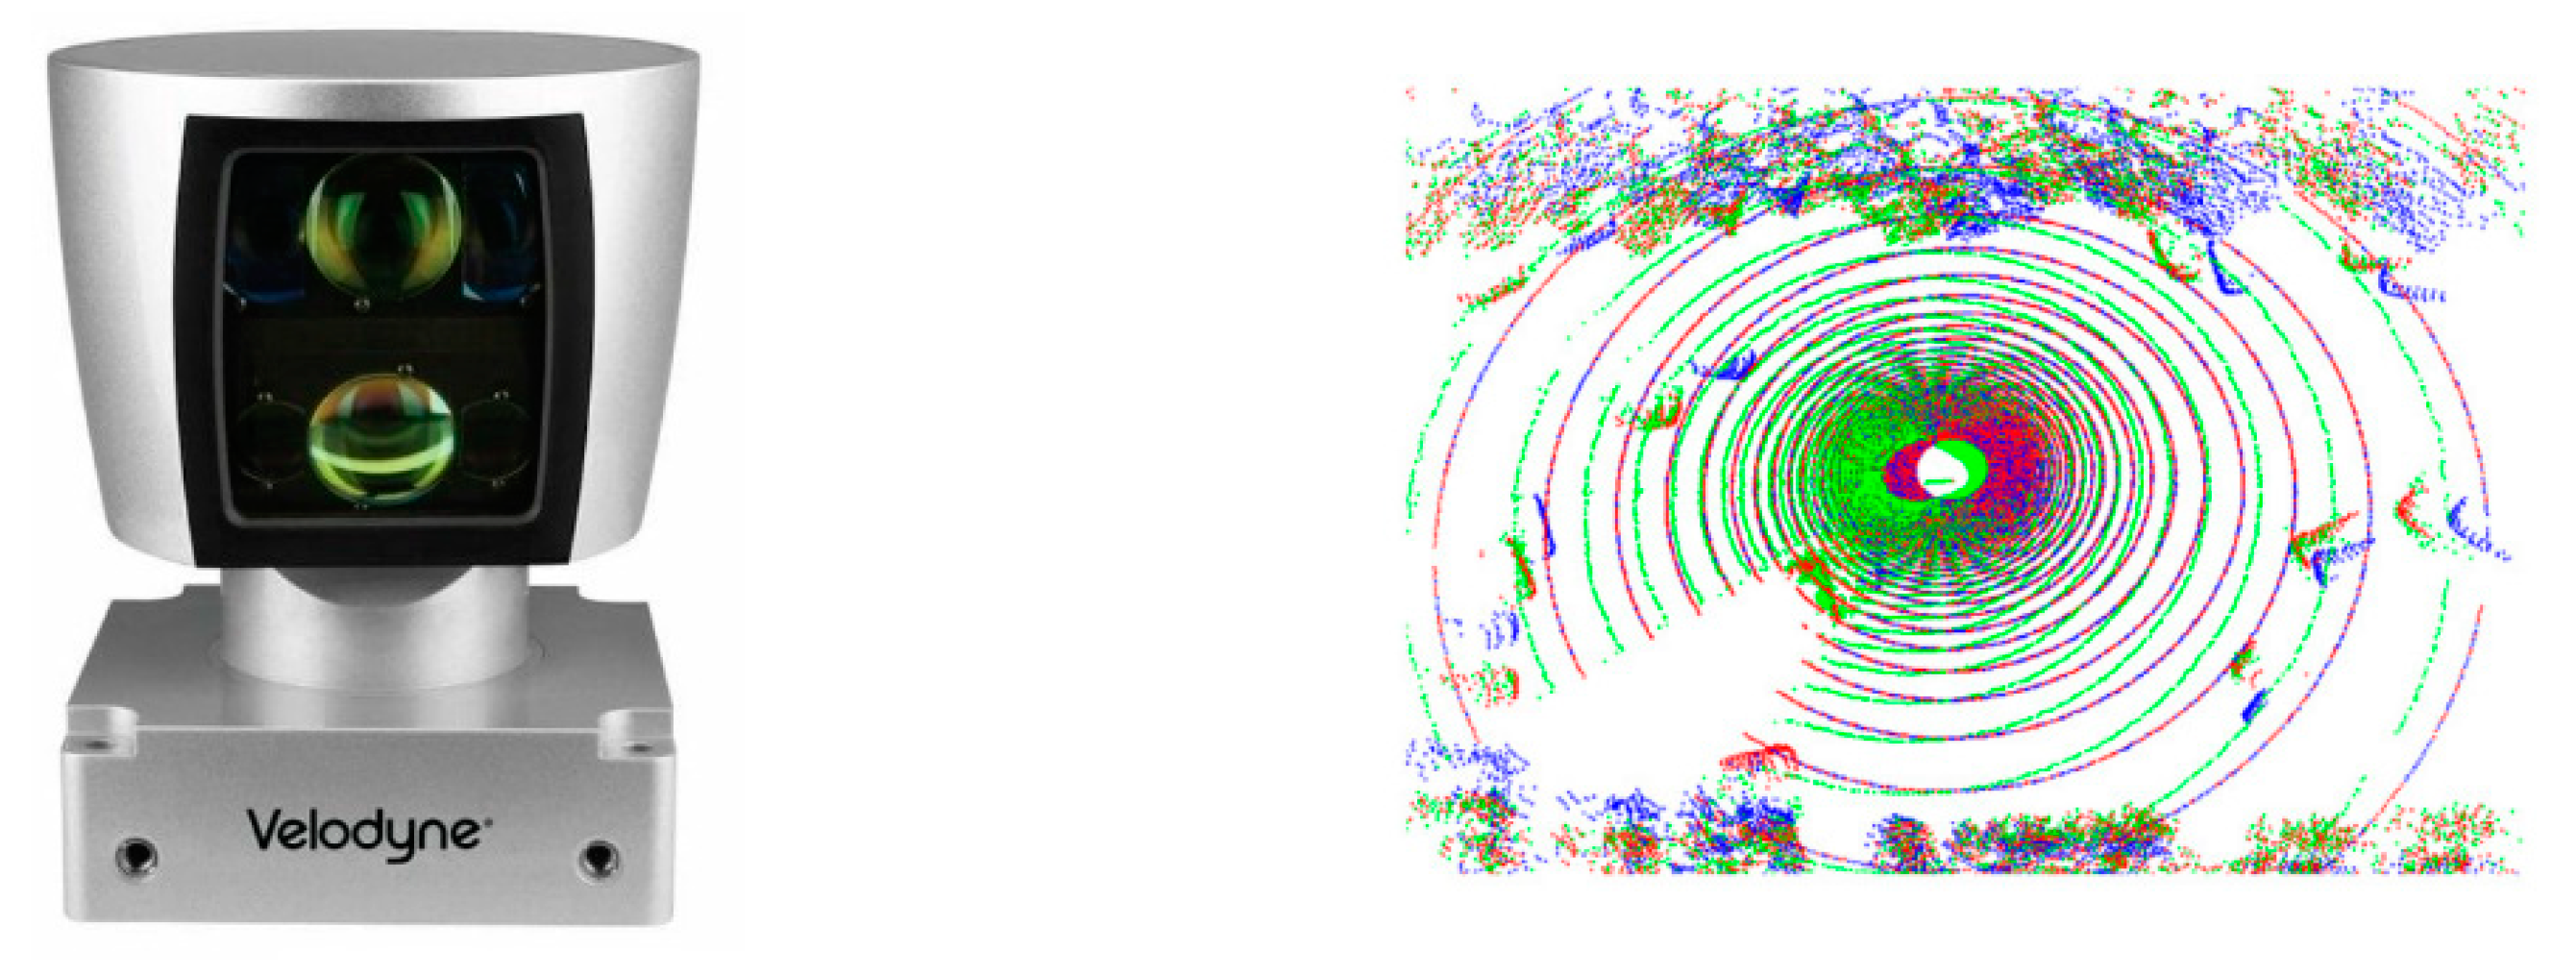
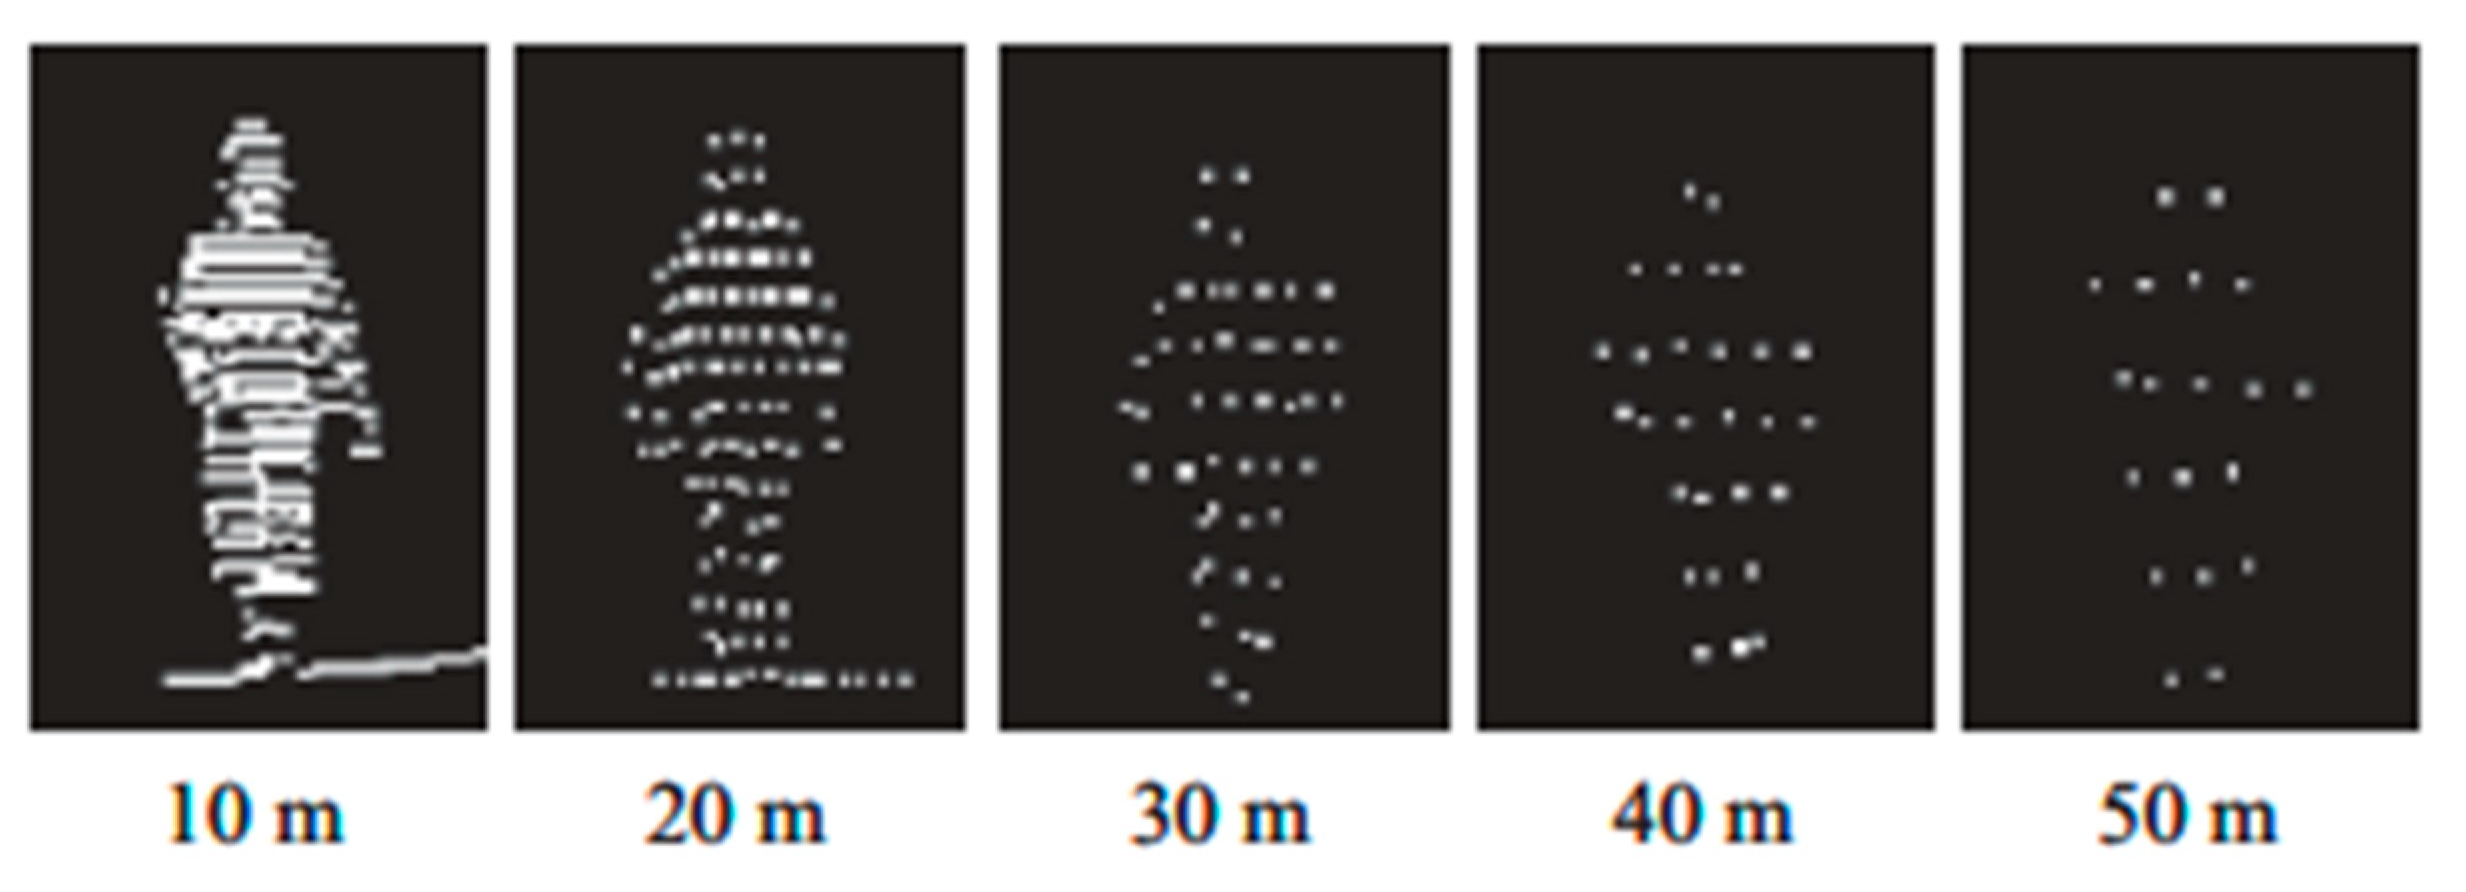
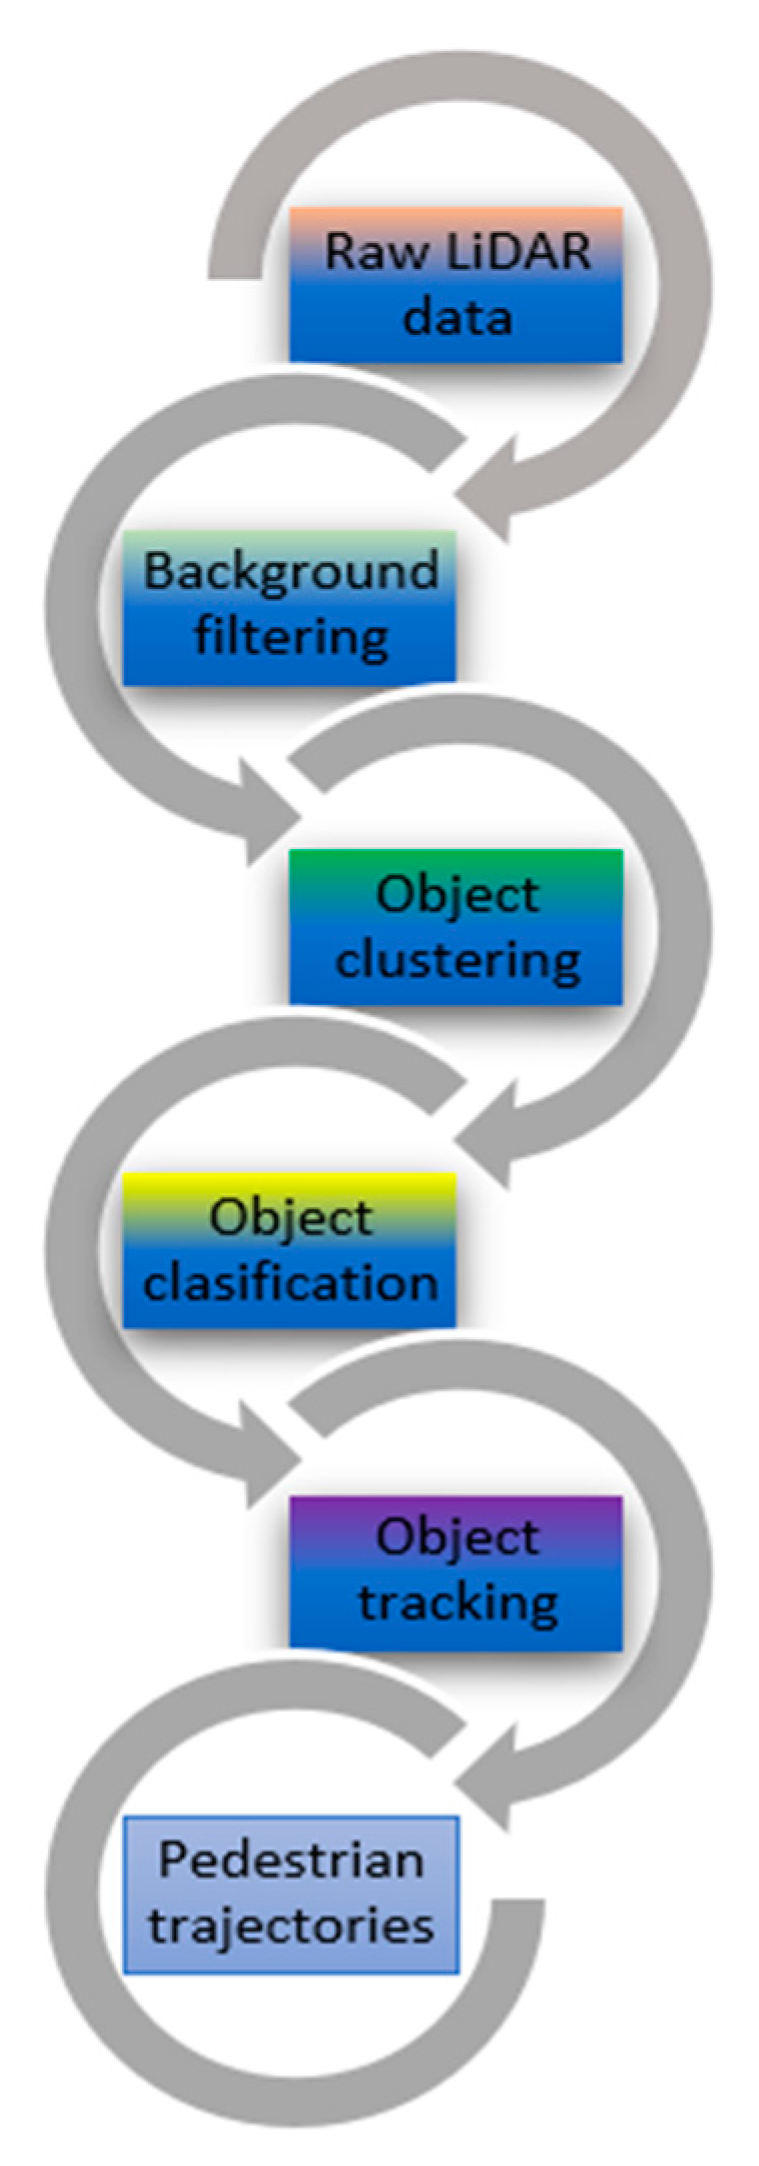
2.3. LiDAR
2.4. Video Camera
2.5. Comparative Features of Sensors
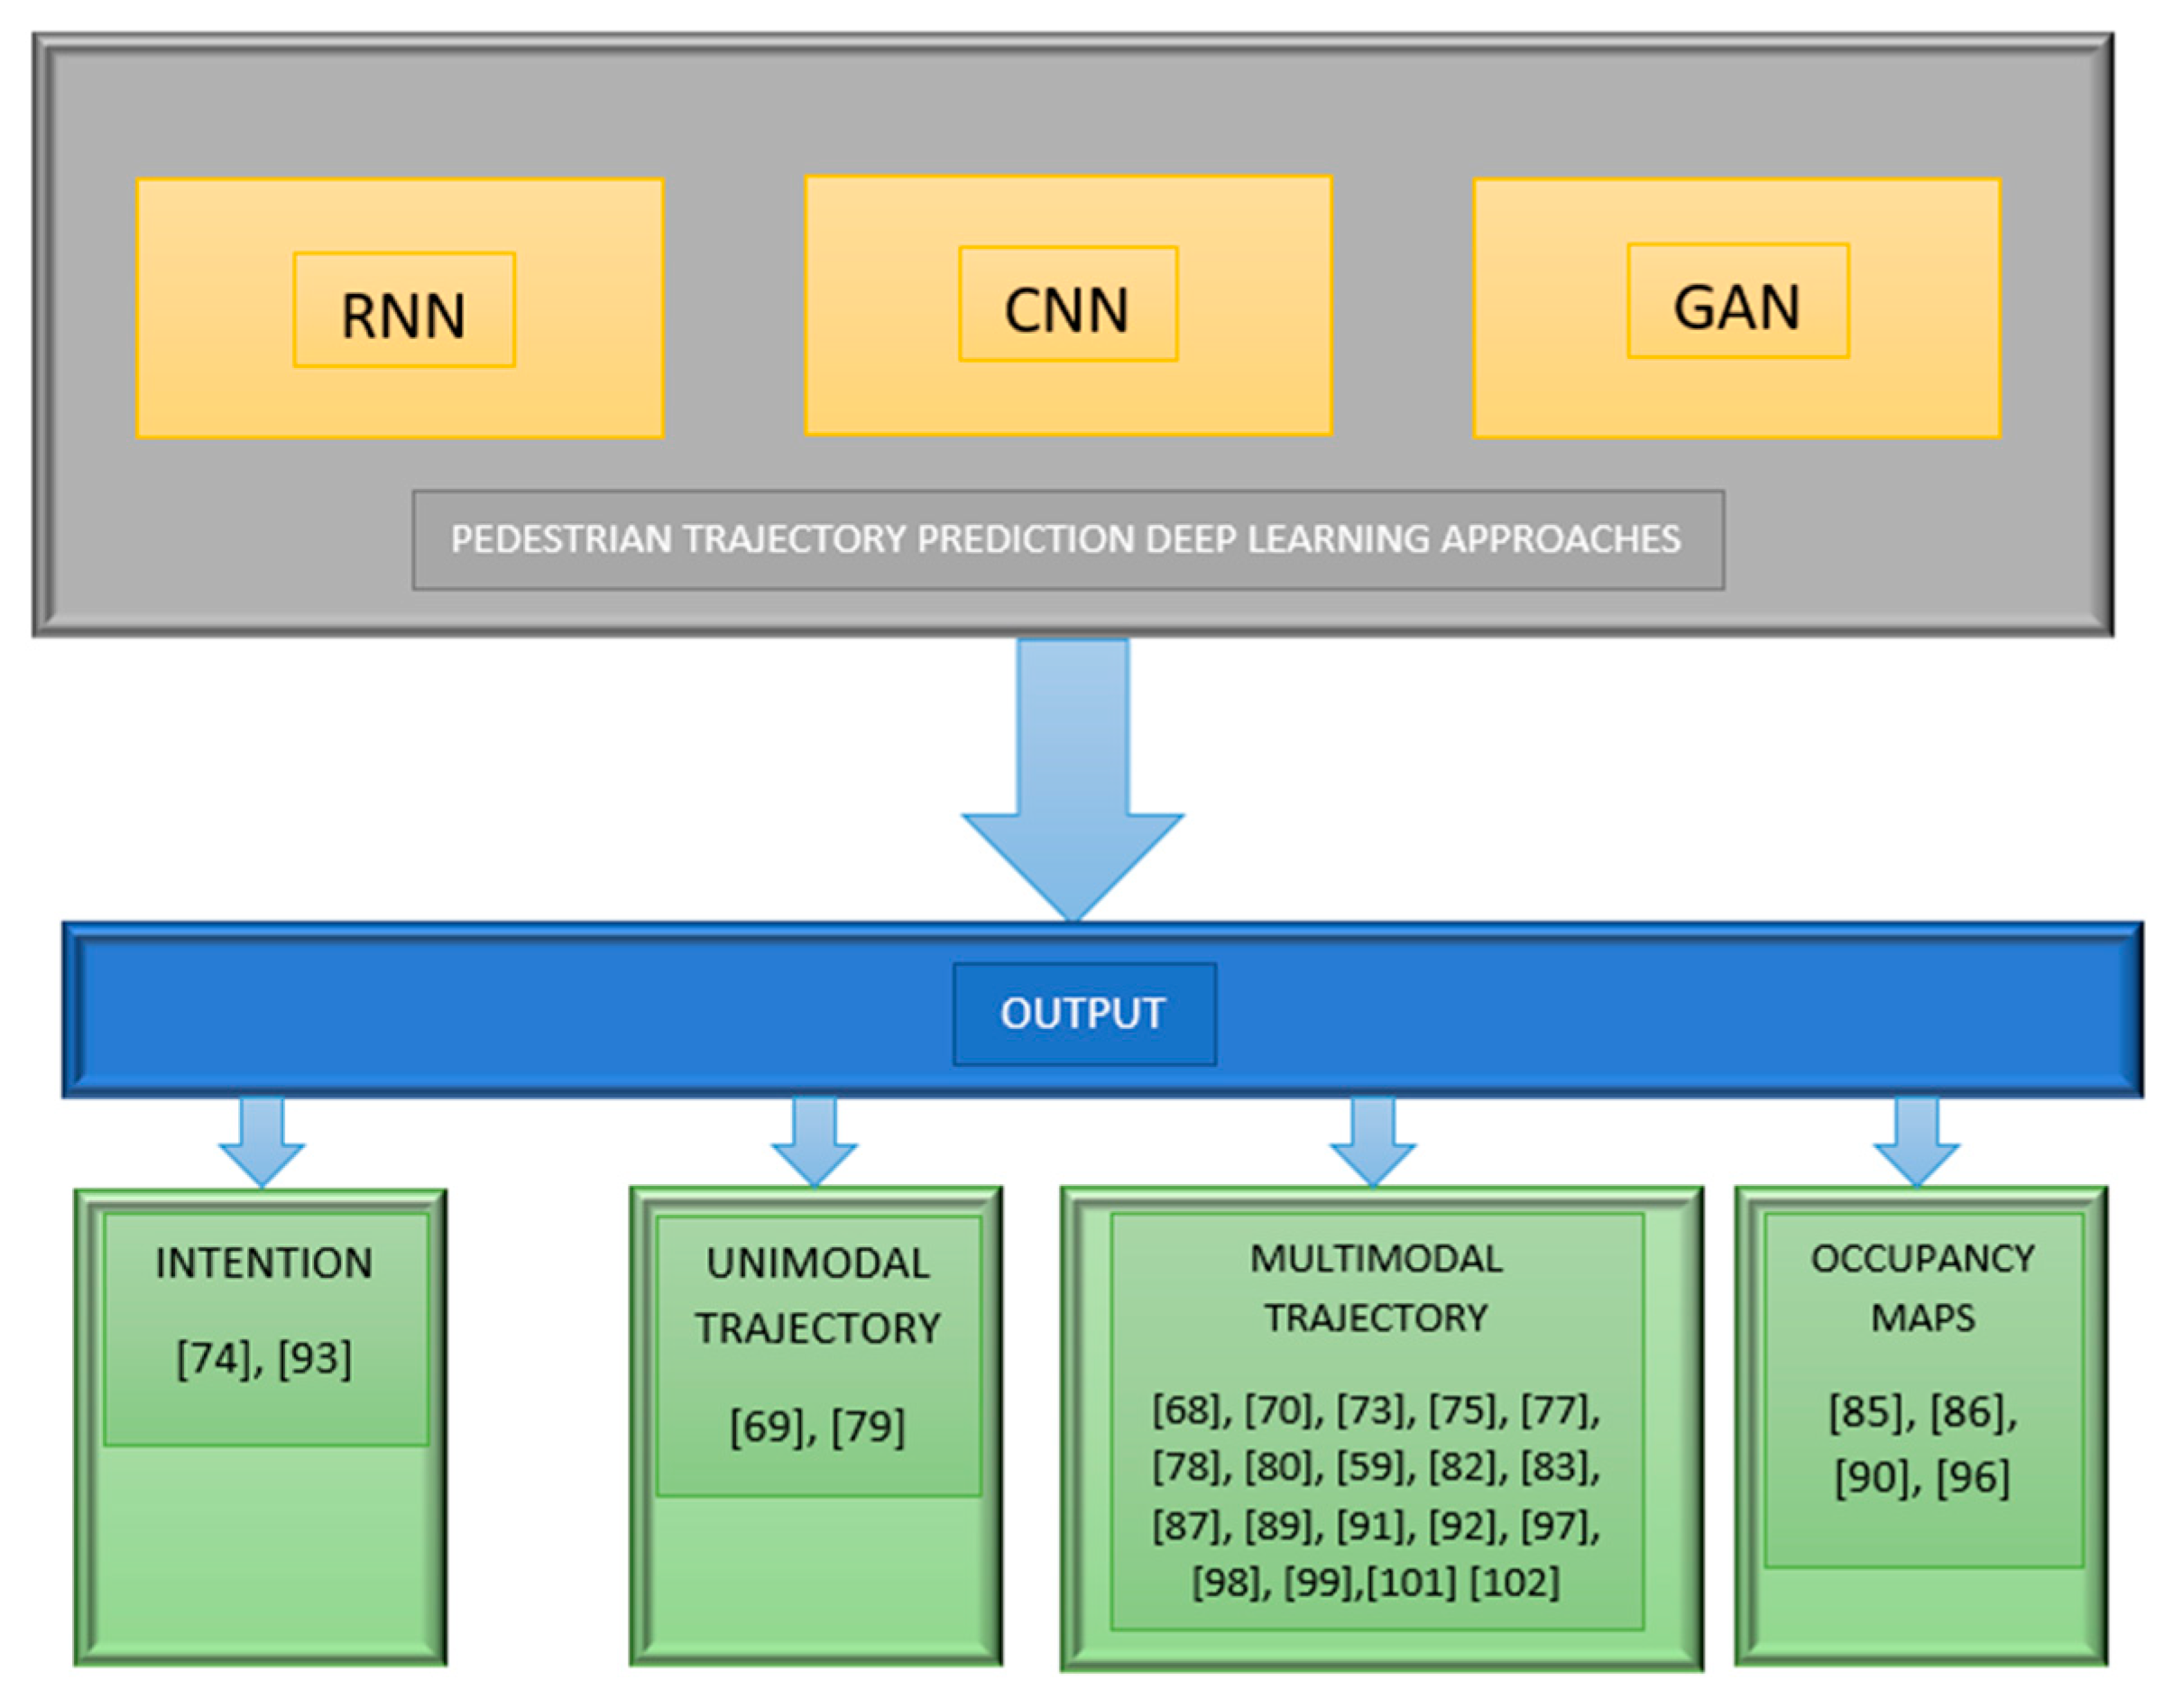
3. Deep Learning Paradigms for Pedestrian Trajectory Prediction
- Recurrent neural networks (RNN), typically in the form of long short-term memory (LSTM).
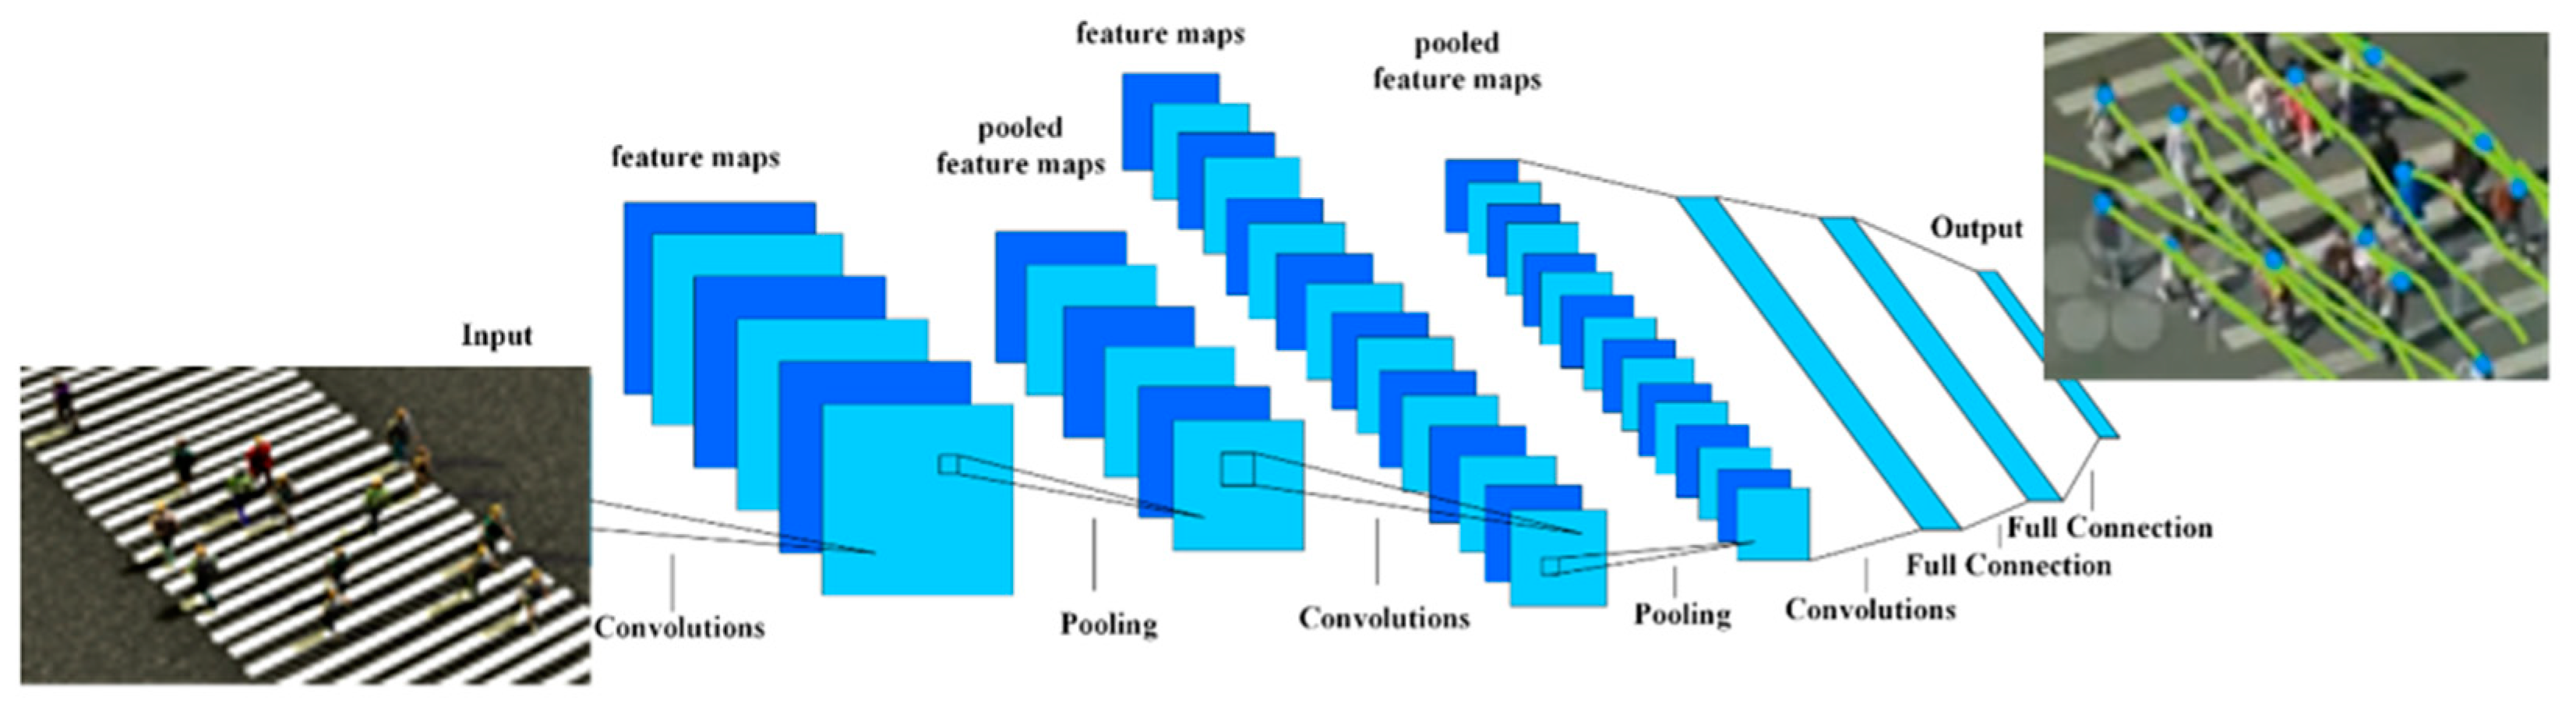
- Convolutional neural networks (CNN).
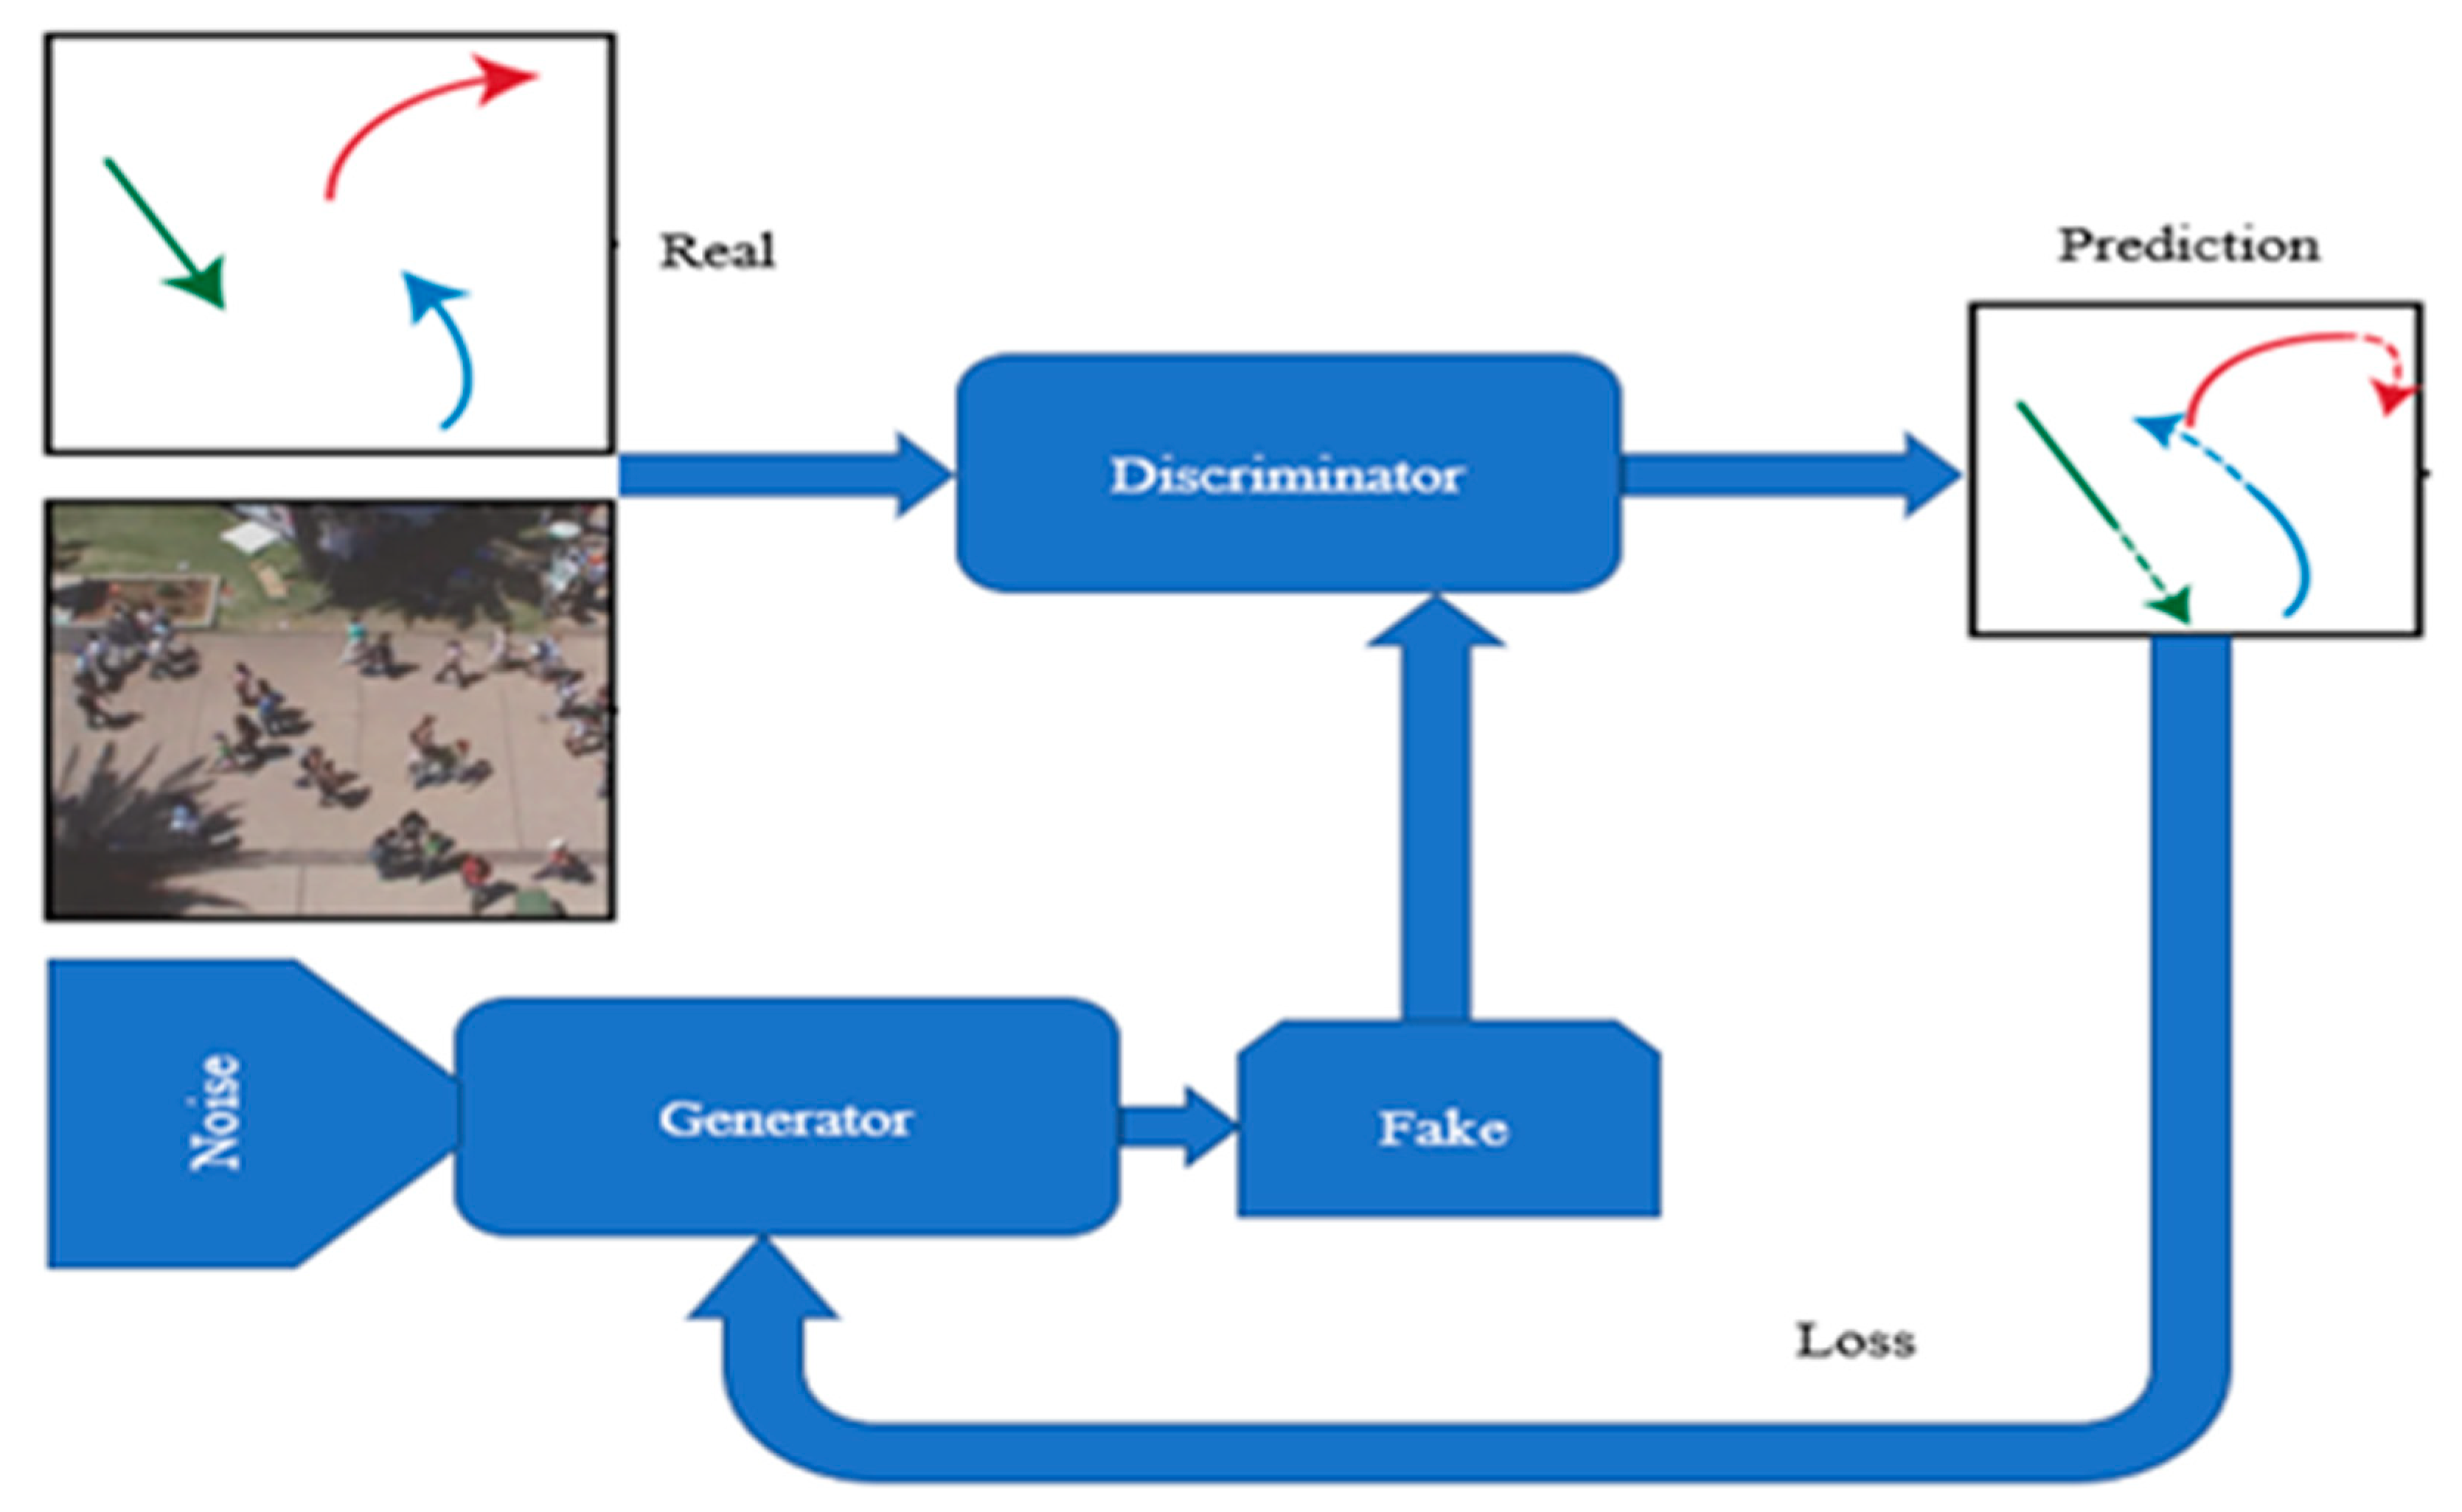
- Generative adversarial networks (GAN).
3.1. Trajectory Prediction Based on RNNs
3.2. Trajectory Prediction Based on Convolutional Neural Networks
3.3. Trajectory Prediction Based on GAN

| DNN Architecture | Paper | Summary of Prediction Method | Dataset and Results (Metric) |
|---|---|---|---|
| Recurrent Neural Networks | Social LSTM [70] | The method has a novel architecture that connects the LSTMs corresponding to nearby sequences: Social pooling (S-pooling) layer to connect LSTM layer. LSTM type encoder Memory network (past memory and future memory) with RNN architecture | ETH ADE: 0.50 FDE: 1.07 NL-ADE: 0.25 UCY ADE: 0.27 FDE: 0.77 NL-ADE: 0.16 |
| Trajectron++ [82] | LSTM network with 32 hidden dimensions to encode a node’s ground truth future trajectory. Two nodes (History, Future) with semantic class matching. Encoder (LSTM—Edge—Map) Decoder (Gated Recurrent Unit—Gaussian Mixture Model) | ETH ADE: 0.71 FDE: 1.66 KDE NLL: 1.31 nuScenes FDE: 0.01 (1 s) KDE NLL: −5.58 (1 s) | |
| LSTM—Bayesian [59] | Bounding box and odometry sequences are the inputs to the sequence RNN model. This model has encoder–decoder layers with Bayesian modeling: Encoder (extract visual features to improve longer-term prediction). At the base, this encoder has CNN architecture with 10 convolutional layer and ReLU non-linearities. Decoder (to extract the odometry and visual summary vectors at every time-step). | Cityscapes MSE: 695 L: 3.97 | |
| DESIRE [75] | This method uses the Sample Generation Module which is an encoder–decoder architecture. The following Ranking and Refinement Module adjusts the prediction samples at each time step to have more accurate predictions. The regression of prediction samples is refined with an interactive RNN layer feedback. CVAE is used to prediction of the short-term visual motion from a single image. | KITTI Error in meters/miss-rate with 1 m threshold: 0.27/0.04 Stanford Drone Pixel error at 1/5 resolution: 1.29 | |
| SS—LSTM [83] | LSTM network with 128 dimensions using encoder and decoder architecture. Hidden states have non-linear ReLU activations layer. | ETH ADE: 0.095 FDE: 0.235 UCY ADE: 0.081 FDE: 0.131 Town Center ADE: 29.01 (0.8 s) FDE: 36.88 (0.8 s) | |
| Convolutional Neural Networks | MATF [87] | The method uses encoder and decoder architecture. To capture the multimodal uncertainty of predictions the architecture use generator G and discriminator D. Encoder (dynamic scenes—LSTM layer, static scenes—CNN layer) Decoder (LSTM layer) | ETH ADE (Deterministic): 0.64 ADE (Stochastic): 0.48 FDE (Deterministic): 1.26 FDE (Stochastic): 0.90 Stanford Drone ADE (Deterministic): 30.75 ADE (Stochastic): 22.59 FDE (Deterministic): 65.90 FDE (Stochastic): 33.53 |
| MANTRA [91] | The model has encoder–decoder architecture with autoencoder system.
| KITTI ADE: 0.16 (1 s) FDE: 0.25 (1 s) Cityscapes ADE: 0.49 FDE: 0.79 Oxford RobotCar ADE: 0.31 (1 s) FDE: 0.35 (1 s) | |
| Social—STGCNN [92] | Spatio-temporal graph representing G = (V, A), when G is forwarded through the spatio-temporal graph CNN. Fallowing this, TXP-CNN layer is responsible with futures trajectories. P is the dimension of pedestrian position. N is the number of pedestrians. T is the number of time steps | ETH ADE: 0.64 FDE: 1.11 UCY ADE: 0.44 FDE: 0.79 | |
| MI—CNN [93] | The method implemented encoder–decoder module by encoding and decoding the input information about pedestrians. The encoder–decoder module contains several blocks structured in convolution layer.
| MOT16 ADE: 18.25 FDE: 21.70 MOT20 ADE: 16.63 FDE: 19.34 | |
| Generative Adversarial Networks | DGMMPT [96] | Algorithm for data association in multi person tracking. Generator composed from:
| 3D MOT 2015, AVG-Town Centre MOTA: 42.5, MOTP: 69.8 |
| Social GAN [97] | The network learns social norms in a data-driven approach Generator composed from:
| ETH ADE: 0.39/0.58 FDE: 0.78/1.18 | |
| Social—BiGAT [98] | Graph-based generative adversarial network in the form of graph attention network (GAT) that learns reliable feature representations that encode the social interactions between humans in the scene. | ETH ADE: 0.69 FDE: 1.29 | |
| Social Ways [99] | Info-GAN plus hand-designed interaction features inspired from the neuroscience and biomechanics. | ETH: ADE: 0.39 FDE: 0.64 UCY ADE: 0.55 FDE: 1.31 | |
| FSGAN [101] | Attentive GAN using two attention modules: physical attention and social attention. | ETH: ADE: 0.70 FDE: 1.43 UCY ADE: 0.54 FDE: 1.24 |


4. Datasets
4.1. Traffic Capture
4.2. Surveillance Capture
5. Discussion and Conclusions
Author Contributions
Funding
Institutional Review Board Statement
Informed Consent Statement
Data Availability Statement
Conflicts of Interest
References
- WHO. Global Status Report on Road Safety; WHO: Geneva, Switzerland, 2018; p. 11. [Google Scholar]
- Winkle, T. Safety benefits of automated vehicles: Extended findings from accident research for development, validation, and testing. In Autonomous Driving; Springer: Berlin/Heidelberg, Germany, 2016; pp. 335–364. [Google Scholar]
- European Road Safety Observatory. Traffic Safety Basic Facts; Technical Report; European Road Safety Observatory: Brussels, Belgium, 2012. [Google Scholar]
- Ridel, D.; Rehder, E.; Laure, M.; Stiller, C.; Wolf, D. A Literature Review on the Prediction of Pedestrian Behavior in Urban Scenarios. In Proceedings of the 21st International Coon Intelligent Transportation Systems (ITSC), Maui, HI, USA, 4–7 November 2018. [Google Scholar]
- Ahmed, S.; Huda, M.N.; Rajbhandari, S.; Saha, C.; Elshaw, M.; Kanarachos, S. Pedestrian and Cyclist Detection and Intent Estimation for Autonomous Vehicles: A Survey. Appl. Sci. 2019, 9, 2335. [Google Scholar] [CrossRef] [Green Version]
- Xu, Y.; Piao, Z.; Gao, S. Encoding Crowd Interaction with Deep Neural Network for Pedestrian Trajectory Prediction. In Proceedings of the IEEE/CVF Conference on Computer Vision and Pattern Recognition, Salt Lake City, UT, USA, 18–23 June 2018; pp. 5275–5284. [Google Scholar]
- Ziegler, J.; Bender, P.; Schreiber, M.; Lategahn, H.; Strauss, T.; Stiller, C.; Dang, T.; Franke, U.; Appenrodt, N.; Keller, C.G.; et al. Making Bertha Drive—An Autonomous Journey on a Historic Route. IEEE Intell. Transp. Syst. Mag. 2014, 6, 8–20. [Google Scholar] [CrossRef]
- Guo, C.; Sentouh, C.; Popieul, J.-C.; Haué, J.-B.; Langlois, S.; Loeillet, J.-J.; Soualmi, B.; That, T.N. Cooperation between driver and automated driving system: Implementation and evaluation. Transp. Res. Part F Traffic Psychol. Behav. 2019, 61, 314–325. [Google Scholar] [CrossRef]
- Ortiz, F.M.; Sammarco, M.; Costa, L.H.M.; Detyniecki, M. Vehicle Telematics via Exteroceptive Sensors: A Survey. arXiv 2020, arXiv:2008.12632. [Google Scholar]
- Yole Developpement. MEMS and Sensors for Automotive: Market & Technology Report. 2017. Available online: https://bit.ly/2X5pL70 (accessed on 23 July 2021).
- Sjafrie, H. Introduction to Self-Driving Vehicle Technology; Chapman and Hall/CRC: Boca Raton, FL, USA, 2019. [Google Scholar]
- Meinel, H.H. Evolving automotive radar: From the very beginnings into the future. In Proceedings of the 8th European Conference on Antennas and Propagation (EuCAP 2014), The Hague, The Netherlands, 6–11 April 2014; pp. 3107–3114. [Google Scholar]
- Reina, G.; Johnson, D.; Underwood, J. Radar Sensing for Intelligent Vehicles in Urban Environments. Sensors 2015, 15, 14661–14678. [Google Scholar] [CrossRef] [Green Version]
- Hasch, J. Driving towards 2020: Automotive radar technology trends. In Proceedings of the IEEE MTT-S International Conference on Microwaves for Intelligent Mobility (ICMIM), Heidelberg, Germany, 27–29 April 2015; pp. 1–4. [Google Scholar]
- Kim, S.; Lee, S.; Doo, S.; Shim, D. Moving Target Classification in Automotive Radar Systems Using Convolutional Recurrent Neural Networks. In Proceedings of the 26th European Signal Processing Conference (EUSIPCO), Rome, Italy, 3–7 September 2018; pp. 1482–1486. [Google Scholar]
- Wicks, M.; Rangaswamy, M.; Adve, R.; Hale, T. Space-time adaptive processing: A knowledge-based perspective for airborne radar. IEEE Signal Process. Mag. 2006, 23, 51–65. [Google Scholar] [CrossRef]
- Richards, M.A.; Scheer, J.; Holm, W.A.; Melvin, W.L. Principles of Modern Radar; Scitech Publishing: Raleigh, NC, USA, 2010. [Google Scholar]
- Rohling, H. Radar CFAR Thresholding in Clutter and Multiple Target Situations. IEEE Trans. Aerosp. Electron. Syst. 1983, AES-19, 608–621. [Google Scholar] [CrossRef]
- Ding, Y.; Tang, J. Micro-Doppler Trajectory Estimation of Pedestrians Using a Continuous-Wave Radar. IEEE Trans. Geosci. Remote Sens. 2014, 52, 5807–5819. [Google Scholar] [CrossRef]
- Kulpa, K. The CLEAN type algorithms for radar signal processing. In Proceedings of the Microwaves, Radar and Remote Sensing Symposium, Kiev, Ukraine, 22–24 September 2008; pp. 152–157. [Google Scholar]
- Chen, V.C.; Li, F.; Ho, S.S.; Wechsler, H. Micro-Doppler effect in radar: Phenomenon, model, and simulation study. IEEE Trans. Aerosp. Electron. Syst. 2006, 42, 2–21. [Google Scholar] [CrossRef]
- Ahtiainen, J.; Terho, S.; Koponen, S. Radar based detection and tracking of a walking human. IFAC Proc. Vol. 2010, 43, 437–442. [Google Scholar] [CrossRef]
- Held, P.; Steinhauser, D.; Kamann, A.; Holdgrun, T.; Doric, I.; Koch, A.; Brandmeier, T. Radar-Based Analysis of Pedestrian Micro-Doppler Signatures Using Motion Capture Sensors. In Proceedings of the 2018 IEEE Intelligent Vehicles Symposium (IV), Changshu, Suzhou, China, 26–30 June 2018; pp. 787–793. [Google Scholar]
- Dubey, A.; Santra, A.; Fuchs, J.; Lübke, M.; Weigel, R.; Lurz, F. A Bayesian Framework for Integrated Deep Metric Learning and Tracking of Vulnerable Road Users Using Automotive Radars. IEEE Access 2021, 9, 68758–68777. [Google Scholar] [CrossRef]
- Khomchuk, P.; Stainvas, I.; Bilik, I. Pedestrian motion direction estimation using simulated automotive MIMO radar. IEEE Trans. Aerosp. Electron. Syst. 2016, 52, 1132–1145. [Google Scholar] [CrossRef] [Green Version]
- Gilmartin, M. INTRODUCTION TO AUTONOMOUS MOBILE ROBOTS, by Roland Siegwart and Illah R. Nourbakhsh, MIT Press, 2004, xiii+ 321 pp., ISBN 0-262-19502-X. Robotica 2005, 23, 271–272. [Google Scholar] [CrossRef]
- Zou, C.; He, B.; Zhu, M.; Zhang, L.; Zhang, J. Learning motion field of LiDAR point cloud with convolutional networks. Pattern Recognit. Lett. 2019, 125, 514–520. [Google Scholar] [CrossRef]
- Li, B.; Zhang, T.; Xia, T. Vehicle detection from 3D Lidar using fully convolutional network. In Robotics: Science and Systems, Proceedings of the 2016 Robotics: Science and Systems Conference, Ann Arbor, MI, USA, 18–22 June 2016; University of Michigan: Ann Arbor, MI, USA, 2016. [Google Scholar]
- Wang, H.; Wang, B.; Liu, B.; Meng, X.; Yang, G. Pedestrian recognition and tracking using 3D LiDAR for autonomous vehicle. Robot. Auton. Syst. 2017, 88, 71–78. [Google Scholar] [CrossRef]
- Wang, H.; Lou, X.; Cai, Y.; Chen, L. A 64-line Lidar-based Road obstacle sensing algorithm for intelligent vehicles. Sci. Program. 2018, 2018, 6385104. [Google Scholar] [CrossRef]
- Jung, J.; Che, E.; Olsen, M.J.; Parrish, C. Efficient and robust lane marking extraction from mobile Lidar point clouds. J. Photogramm. Remote Sens. 2019, 147, 1–18. [Google Scholar] [CrossRef]
- Zhao, J.; Li, Y.; Xu, H.; Liu, H. Probabilistic Prediction of Pedestrian Crossing Intention Using Roadside LiDAR Data. IEEE Access 2019, 7, 93781–93790. [Google Scholar] [CrossRef]
- Lewis, D.D. Naive (Bayes) at forty: The independence assumption in information retrieval. In Proceedings of the European Conference on Machine Learning, Chemnitz, Germany, 21–23 April 1998; Springer: Berlin/Heidelberg, Germany, 1998; pp. 4–15. [Google Scholar]
- Wu, J.; Xu, H.; Sun, Y.; Zheng, J.; Yue, R. Automatic Background Filtering Method for Roadside LiDAR Data. Transp. Res. Rec. 2018, 2672, 106–114. [Google Scholar] [CrossRef]
- Liu, K.; Wang, W.; Wang, J. Pedestrian Detection with Lidar Point Clouds Based on Single Template Matching. Electronics 2019, 8, 780. [Google Scholar] [CrossRef] [Green Version]
- Melotti, G.; Asvadi, A.; Premebida, C. CNN-LIDAR pedestrian classification: Combining range and reflectance data. In Proceedings of the IEEE International Conference on Vehicular Electronics and Safety (ICVES), Madrid, Spain, 12–14 September 2018; pp. 1–6. [Google Scholar]
- Wang, J.; Tao, W.; Zheng, Z. LIDAR and vision based pedestrian detection and tracking system. In Proceedings of the IEEE International Conference on Progress in Informatics and Computing (PIC), Nanjing, China, 18–20 December 2015; pp. 118–122. [Google Scholar]
- Granström, K.; Renter, S.; Fatemi, M.; Svensson, L. Pedestrian tracking using Velodyne data—Stochastic optimization for extended object tracking. In Proceedings of the IEEE Intelligent Vehicles Symposium (IV), Dearborn, MI, USA, 11–14 June 2017; pp. 39–46. [Google Scholar]
- Bu, F.; Le, T.; Du, X.; Vasudevan, R.; Johnson-Roberson, M. Pedestrian Planar LiDAR Pose (PPLP) Network for Oriented Pedestrian Detection Based on Planar LiDAR and Monocular Images. IEEE Robot. Autom. Lett. 2020, 5, 1626–1633. [Google Scholar] [CrossRef]
- Völz, B.; Behrendt, K.; Mielenz, H.; Gilitschenski, I.; Siegwart, R.; Nieto, J. A data-driven approach for pedestrian intention estimation. In Proceedings of the IEEE 19th International Conference on Intelligent Transportation Systems (ITSC), Rio de Janeiro, Brazil, 1–4 November 2016; pp. 2607–2612. [Google Scholar]
- Bastien, F.; Lamblin, P.; Pascanu, R.; Bergstra, J.; Goodfellow, I.J.; Bergeron, A.; Bouchard, N.; Bengio, Y. Theano: New features and speed improvements. In Proceedings of the Twenty-Sixth Conference on Neural Information Processing Systems Workshop, Lake Tahoe, NV, USA, 3–8 December 2012. [Google Scholar]
- Dieleman, S.; Schlüter, J.; Raffel, C.; Olson, E.; Sønderby, S.K.; Nouri, D.; Maturana, D.; Thoma, M.; Battenberg, E.; Kelly, J.; et al. Lasagne: First Release. Available online: https://zenodo.org/record/27878#.YY8dFMozY2w (accessed on 7 November 2021).
- Mohammadbagher, E.; Bhatt, N.P.; Hashemi, E.; Fidan, B.; Khajepour, A. Real-time Pedestrian Localization and State Estimation Using Moving Horizon Estimation. In Proceedings of the IEEE 23rd International Conference on Intelligent Transportation Systems (ITSC), Rhodes, Greece, 20–23 September 2020; pp. 1–7. [Google Scholar]
- Guidolini, R.; Scart, L.G.; Jesus, L.F.; Cardoso, V.B.; Badue, C.; Oliveira-Santos, T. Handling Pedestrians in Crosswalks Using Deep Neural Networks in the IARA Autonomous Car. In Proceedings of the International Joint Conference on Neural Networks (IJCNN), Rio de Janeiro, Brazil, 8–13 July 2018; pp. 1–8. [Google Scholar]
- Miller, J.W.; Murphey, Y.L.; Khairallah, F. Camera performance considerations for automotive applications. In Proceedings of the IEEE International Conference on Robotics and Automation (ICRA), New Orleans, LA, USA, 26 April–1 May 2004. [Google Scholar]
- Gressmann, M.; Palm, G.; Löhlein, O. Surround view pedestrian detection using heterogeneous classifier cascades. In Proceedings of the 14th International IEEE Conference on Intelligent Transportation Systems (ITSC), Washington, DC, USA, 5–7 October 2011; pp. 1317–1324. [Google Scholar]
- Cai, Y.; Dai, L.; Wang, H.; Chen, L.; Li, Y.; Sotelo, M.A.; Li, Z. Pedestrian Motion Trajectory Prediction in Intelligent Driving from Far Shot First-Person Perspective Video. IEEE Trans. Intell. Transp. Syst. 2021, 1–16. [Google Scholar] [CrossRef]
- Bar-Shalom, Y.; Li, X.R.; Kirubarajan, T. Estimation with Applications to Tracking and Navigation: Theory Algorithms and Software; John Wiley & Sons: Hoboken, NJ, USA, 2001. [Google Scholar]
- Keller, C.G.; Gavrila, D.M. Will the Pedestrian Cross? A Study on Pedestrian Path Prediction. IEEE Trans. Intell. Transp. Syst. 2013, 15, 494–506. [Google Scholar] [CrossRef] [Green Version]
- Afsar, P.; Cortez, P.; Santos, H. Automatic human trajectory destination prediction from video. Expert Syst. Appl. 2018, 110, 41–51. [Google Scholar] [CrossRef] [Green Version]
- Styles, O.; Guha, T.; Snachez, V.; Kot, A. Multi-Camera Trajectory Forecasting: Pedestrian Trajectory Prediction in a Network of Cameras. In Proceedings of the IEEE/CVF Conference on Computer Vision and Pattern Recognition Workshops (CVPRW), Seattle, WA, USA, 14–19 June 2020; pp. 4379–4382. [Google Scholar]
- Sun, Y.; Zuo, W.; Liu, M. See the Future: A Semantic Segmentation Network Predicting Ego-Vehicle Trajectory with a Single Monocular Camera. IEEE Robot. Autom. Lett. 2020, 5, 3066–3073. [Google Scholar] [CrossRef]
- Dosovitskiy, A.; Fischer, P.; Ilg, E.; Hausser, P.; Hazirbas, C.; Golkov, V.; van der Smagt, P.; Cremers, D.; Brox, T. FlowNet: Learning Optical Flow with Convolutional Networks. In Proceedings of the IEEE International Conference on Computer Vision (ICCV), Washington, DC, USA, 7–13 December 2015; pp. 2758–2766. [Google Scholar]
- Zhou, X.U.; Zheng, J.Q.; Li, P.; Yang, G.Z. ACNN: A Full Resolution DCNN for Medical Image Segmentation. In Proceedings of the IEEE International Conference on Robotics and Automation (ICRA), Paris, France, 31 May–31 August 2020; pp. 8455–8461. [Google Scholar]
- Chen, L.-C.; Papandreou, G.; Kokkinos, I.; Murphy, K.; Yuille, A.L. DeepLab: Semantic Image Segmentation with Deep Convolutional Nets, Atrous Convolution, and Fully Connected CRFs. IEEE Trans. Pattern Anal. Mach. Intell. 2017, 40, 834–848. [Google Scholar] [CrossRef]
- Geiger, A.; Lenz, P.; Urtasun, R. Are we ready for autonomous driving? The KITTI vision benchmark suite. In Proceedings of the IEEE Conference on Computer Vision and Pattern Recognition, Washington, DC, USA, 16–21 June 2012; pp. 3354–3361. [Google Scholar]
- Loukkal, A.; Grandvalet, Y.; Drummond, T.; Li, Y. Driving among Flatmobiles: Bird-Eye-View occupancy grids from a monocular camera for holistic trajectory planning. In Proceedings of the IEEE Winter Conference on Applications of Computer Vision (WACV), Waikola, HI, USA, 5–9 January 2021; pp. 51–60. [Google Scholar]
- Caesar, H.; Bankiti, V.; Lang, A.H.; Vora, S.; Liong, V.E.; Xu, Q.; Krishnan, A.; Pan, Y.; Baldan, G.; Beijbom, O. nuScenes: A Multimodal Dataset for Autonomous Driving. In Proceedings of the IEEE/CVF Conference on Computer Vision and Pattern Recognition (CVPR), Seattle, WA, USA, 16–18 June 2020; pp. 11618–11628. [Google Scholar]
- Bhattacharyya, A.; Fritz, M.; Schiele, B. Long-Term On-board Prediction of People in Traffic Scenes under Uncertainty. In Proceedings of the IEEE/CVF Conference on Computer Vision and Pattern Recognition, Salt Lake City, UT, USA, 18–23 June 2018; pp. 4194–4202. [Google Scholar]
- Chandra, R.; Bhattacharya, U.; Bera, A.; Manocha, D. Traphic: Trajectory prediction in dense and heterogeneous traffic using weighted interactions. In Proceedings of the IEEE/CVF Conference on Computer Vision and Pattern Recognition, Long Beach, CA, USA, 15–20 June 2019; pp. 8483–8492. [Google Scholar]
- Yagi, T.; Mangalam, K.; Yonetani, R.; Sato, Y. Future person localization in first-person videos. In Proceedings of the IEEE Conference on Computer Vision and Pattern Recognition (CVPR), Salt Lake City, UT, USA, 18–23 June 2018; pp. 7593–7602. [Google Scholar]
- Qiu, J.; Lo, F.P.; Gu, X.; Sun, Y.; Jiang, S.; Lo, B. Indoor Future Person Localization from an Egocentric Wearable Camera. In Proceedings of the IEEE/RSJ International Conference On Intelligent Robots and Systems (IROS), Prague, Czech Republic, 27 September–1 October 2021. [Google Scholar]
- Zhong, J.; Sun, H.; Cao, W.; He, Z. Pedestrian Motion Trajectory Prediction with Stereo-Based 3D Deep Pose Estimation and Trajectory Learning. IEEE Access 2020, 8, 23480–23486. [Google Scholar] [CrossRef]
- Meyer, M.; Kuschk, G. Deep Learning Based 3D Object Detection for Automotive Radar and Camera. In Proceedings of the 16th European Radar Conference (EuRAD), Paris, France, 2–4 October 2019; pp. 133–136. [Google Scholar]
- Zhang, Z.; Lu, C.; Li, J.; Xu, Y.; Lu, J.; Li, Z. Prediction of Pedestrian Risky Level for Intelligent Vehicles. In Proceedings of the IEEE Intelligent Vehicles Symposium (IV), Las Vegas, NV, USA, 23 June 2020; pp. 169–174. [Google Scholar]
- WCP [Woodside Capital Partners]. Beyond the Headlights: ADAS and Autonomous Sensing. 2016. Available online: https://secureservercdn.net/198.71.233.189/fzs.2d0.myftpupload.com/wp-content/uploads/2016/12/20160927-Auto-Vision-Systems-Report_FINAL.pdf (accessed on 5 November 2021).
- Hochreiter, S.; Schmidhuber, J. Long short-term memory. Neural Comput. 1997, 9, 1735–1780. [Google Scholar] [CrossRef]
- Sun, L.; Yan, Z.; Mellado, S.M.; Hanheide, M.; Duckett, T. 3DOF Pedestrian Trajectory Prediction Learned from Long-Term Autonomous Mobile Robot Deployment Data. In Proceedings of the IEEE International Conference on Robotics and Automation (ICRA), Brisbane, Australia, 21–25 May 2018; pp. 5942–5948. [Google Scholar]
- Fragkiadaki, K.; Levine, S.; Felsen, P.; Malik, J. Recurrent Network Models for Human Dynamics. In Proceedings of the IEEE International Conference on Computer Vision (ICCV), Santiago, Chile, 7–13 December 2015; pp. 4346–4354. [Google Scholar]
- Alahi, A.; Goel, K.; Ramanathan, V.; Robicquet, A.; Li, F.-F.; Savarese, S. Social LSTM: Human Trajectory Prediction in Crowded Spaces. In Proceedings of the IEEE Conference on Computer Vision and Pattern Recognition (CVPR), Las Vegas, NV, USA, 30 June 2016; pp. 961–971. [Google Scholar]
- Pellegrini, S.; Ess, A.; Schindler, K.; van Gool, L. You’ll never walk alone: Modeling social behavior for multi-target tracking. In Proceedings of the IEEE 12th International Conference on Computer Vision, Kyoto, Japan, 27 September–4 October 2009; pp. 261–268. [Google Scholar]
- Lerner, A.; Chrysanthou, Y.; Lischinski, D. Crowds by example. Comput. Graph. Forum 2007, 26, 655–664. [Google Scholar] [CrossRef]
- Dai, S.; Li, L.; Li, Z. Modeling Vehicle Interactions via Modified LSTM Models for Trajectory Prediction. IEEE Access 2019, 7, 38287–38296. [Google Scholar] [CrossRef]
- Xin, L.; Wang, P.; Chan, C.; Chen, J.; Li, S.E.; Cheng, B. Intention aware long horizon trajectory prediction of surrounding vehicles using dual lstm networks. In Proceedings of the 21st International Conference on Intelligent Transportation Systems (ITSC), Maui, HI, USA, 4–7 November 2018; pp. 1441–1446. [Google Scholar]
- Lee, N.; Choi, W.; Vernaza, P.; Choy, C.B.; Torr, P.H.; Chandraker, M. DESIRE: Distant Future Prediction in Dynamic Scenes with Interacting Agents. In Proceedings of the IEEE Conference on Computer Vision and Pattern Recognition (CVPR), Honolulu, HI, USA, 21–26 July 2017; pp. 2165–2174. [Google Scholar]
- Robicquet, A.; Sadeghian, A.; Alahi, A.; Savarese, S. Learning Social Etiquette: Human Trajectory Understanding in Crowded Scenes. In Computer Vision–ECCV, Proceedings of the Amsterdam, The Netherlands, 11–14 October 2016; Springer: Berlin/Heidelberg, Germany, 2016; Volume 9912. [Google Scholar]
- Zheng, S.; Yue, Y.; Hobbs, J. Generating long-term trajectories using deep hierarchical networks. In Proceedings of the Thirtieth Conference on Neural Information Processing Systems (NIPS), Barcelona, Spain, 5–10 December 2016. [Google Scholar]
- Zhan, E.; Zheng, S.; Yue, Y.; Lucey, P. Generative multi-agent behavioral cloning. In Proceedings of the 35th International Conference on Machine Learning, Stockholm, Sweden, 10–15 July 2018. [Google Scholar]
- Martinez, J.; Black, M.J.; Romero, J. On Human Motion Prediction Using Recurrent Neural Networks. In Proceedings of the IEEE Conference on Computer Vision and Pattern Recognition (CVPR), Honolulu, HI, USA, 21–26 July 2017; pp. 4674–4683. [Google Scholar]
- Hug, R.; Becker, S.; Hübner, W.; Arens, M. Particle-based Pedestrian Path Prediction using LSTM-MDL Models. In Proceedings of the 21st International Conference on Intelligent Transportation Systems (ITSC), Maui, HI, USA, 4–7 November 2018; pp. 2684–2691. [Google Scholar]
- Cordts, M.; Omran, M.; Ramos, S.; Rehfeld, T.; Enzweiler, M.; Benenson, R.; Franke, U.; Roth, S.; Schiele, B. The Cityscapes Dataset for Semantic Urban Scene Understanding. In Proceedings of the IEEE Conference on Computer Vision and Pattern Recognition (CVPR), Las Vegas, NV, USA, 27–30 June 2016; pp. 3213–3223. [Google Scholar]
- Salzmann, T.; Ivanovic, B.; Chakravarty, P.; Pavone, M. Trajectron++: Dynamically Feasible Trajectory Forecasting with Heterogeneous Data. In Computer Vision–ECCV, Proceedings of the 16th European Conference, Glasgow, UK, 23–28 August 2020; Springer: Berlin/Heidelberg, Germany, 2020; Volume 12363. [Google Scholar]
- Xue, H.; Huynh, D.Q.; Reynolds, M. SS-LSTM: A Hierarchical LSTM Model for Pedestrian Trajectory Prediction. In Proceedings of the IEEE Winter Conference on Applications of Computer Vision (WACV), Lake Tahoe, NV, USA, 12–15 March 2018; pp. 1186–1194. [Google Scholar]
- Benfold, B.; Reid, I. Guiding visual surveillance by tracking human attention. In Proceedings of the British Machine Vision Conference (BMVC), London, UK, 7–10 September 2009. [Google Scholar]
- Rehder, E.; Wirth, F.; Lauer, M.; Stiller, C. Pedestrian prediction by planning using deep neural networks. In Proceedings of the 2018 IEEE International Conference on Robotics and Automation (ICRA), Brisbane, Australia, 21–25 May 2018. [Google Scholar]
- Hoermann, S.; Bach, M.; Dietmayer, K. Dynamic Occupancy Grid Prediction for Urban Autonomous Driving: A Deep Learning Approach with Fully Automatic Labeling. In Proceedings of the IEEE International Conference on Robotics and Automation (ICRA), Brisbane, Australia, 21–25 May 2018; pp. 2056–2063. [Google Scholar]
- Zhao, T.; Xu, Y.; Monfort, M.; Choi, W.; Baker, C.; Zhao, Y.; Wang, Y.; Wu, Y.N. Multi-Agent Tensor Fusion for Contextual Trajectory Prediction. In Proceedings of the IEEE/CVF Conference on Computer Vision and Pattern Recognition (CVPR), Long Beach, CA, USA, 15–21 June 2019; pp. 12118–12126. [Google Scholar]
- Colyar, J.; Halkias, J. US Highway 101 Dataset; Tech. Rep. Fhwa-Hrt-07-030; Federal Highway Administration (FHWA): Washington, DC, USA, 2007. [Google Scholar]
- Yi, S.; Li, H.; Wang, X. Pedestrian Behavior Understanding and Prediction with Deep Neural Networks. In Computer Vision–ECCV, Proceedings of the Amsterdam, The Netherlands, 11–14 October 2016; Springer: Cham, Switzerland, 2016; Volume 9905. [Google Scholar]
- Doellinger, J.; Spies, M.; Burgard, W. Predicting Occupancy Distributions of Walking Humans with Convolutional Neural Networks. IEEE Robot. Autom. Lett. 2018, 3, 1522–1528. [Google Scholar] [CrossRef]
- Marchetti, F.; Becattini, F.; Seidenari, L.; Del Bimbo, A. MANTRA: Memory Augmented Networks for Multiple Trajectory Prediction. In Proceedings of the IEEE/CVF Conference on Computer Vision and Pattern Recognition (CVPR), Seattle, WA, USA, 16–18 June 2020; pp. 7141–7150. [Google Scholar]
- Mohamed, A.; Qian, K.; Elhoseiny, M.; Claudel, C. Social-STGCNN: A Social Spatio-Temporal Graph Convolutional Neural Network for Human Trajectory Prediction. In Proceedings of the IEEE/CVF Conference on Computer Vision and Pattern Recognition (CVPR), Seattle, WA, USA, 16–18 June 2020; pp. 14412–14420. [Google Scholar]
- Wang, R.; Cui, Y.; Song, X.; Chen, K.; Fang, H. Multi-information-based convolutional neural network with attention mechanism for pedestrian trajectory prediction. Image Vis. Comput. 2021, 107, 104110. [Google Scholar] [CrossRef]
- Dendorfer, P.; Ošep, A.; Milan, A.; Schindler, K.; Cremers, D.; Reid, I.; Roth, S.; Leal-Taixé, L. MOTChallenge: A Benchmark for Single-Camera Multiple Target Tracking. Int. J. Comput. Vis. 2020, 129, 845–881. [Google Scholar] [CrossRef]
- Goodfellow, I.J.; Pouget-Abadie, J.; Mirza, M.; Xu, B.; Warde-Farley, D.; Ozair, S.; Courville, A.; Bengio, Y. Generative adversarial nets. In Proceedings of the Twenty-Eighth Conference on Neural Information Processing Systems (NIPS), Montreal, QC, Canada, 8–13 December 2014. [Google Scholar]
- Fernando, T.; Denman, S.; Sridharan, S.; Fookes, C. Tracking by Prediction: A Deep Generative Model for Mutli-person Localisation and Tracking. In Proceedings of the IEEE Winter Conference on Applications of Computer Vision (WACV), Lake Tahoe, NV, USA, 12–15 March 2018; pp. 1122–1132. [Google Scholar]
- Gupta, A.; Johnson, J.; Li, F.-F.; Savarese, S.; Alahi, A. Social GAN: Socially Acceptable Trajectories with Generative Adversarial Networks. In Proceedings of the IEEE/CVF Conference on Computer Vision and Pattern Recognition, Salt Lake City, UT, USA, 18–23 June 2018; pp. 2255–2264. [Google Scholar]
- Kosaraju, V.; Sadeghian, A.; Martín-Martín, R.; Reid, I.D.; Rezatofighi, H.; Savarese, S. Social-BiGAT: Multimodal trajectory forecasting using Bicycle-GAN and graph attention networks. In Proceedings of the 33rd International Conference on Neural Information Processing Systems, Vancouver, BC, Canada, 8–14 December 2019; Volume 32. [Google Scholar]
- Amirian, J.; Hayet, J.; Pettré, J. Social Ways: Learning Multi-Modal Distributions of Pedestrian Trajectories with GANs. In Proceedings of the IEEE/CVF Conference on Computer Vision and Pattern Recognition Workshops (CVPRW), Long Beach, CA, USA, 16–17 June 2019; pp. 2964–2972. [Google Scholar]
- Chen, X.; Duan, Y.; Houthooft, R.; Schulman, J.; Sutskever, I.; Abbeel, P. Infogan: Interpretable representation learning by information maximizing generative adversarial nets. In Proceedings of the Advances in neural information processing systems, Barcelona, Spain, 5–10 December 2016; pp. 2172–2180. [Google Scholar]
- Kothari, P.; Alahi, A. Human trajectory prediction using adversarial loss. In Proceedings of the 19th Swiss Transport Research Conference, Ascona, Switzerland, 15–17 May 2019. [Google Scholar]
- Sadeghian, A.; Kosaraju, V.; Hirose, N.; Rezatofighi, H.; Savarese, S. SoPhie: An Attentive GAN for Predicting Paths Compliant to Social and Physical Constraints. In Proceedings of the IEEE/CVF Conference on Computer Vision and Pattern Recognition (CVPR), Long Beach, CA, USA, 15–21 June 2019; pp. 1349–1358. [Google Scholar]
- Hwang, S.; Park, J.; Kim, N.; Choi, Y.; Kweon, I.S. Multispectral pedestrian detection: Benchmark dataset and baseline. In Proceedings of the IEEE Conference on Computer Vision and Pattern Recognition (CVPR), Boston, MA, USA, 7–12 June 2015; pp. 1037–1045. [Google Scholar]
- Dollar, P.; Wojek, C.; Schiele, B.; Perona, P. Pedestrian detection: A benchmark. In Proceedings of the IEEE Conference on Computer Vision and Pattern Recognition, Miami, FL, USA, 20–25 June 2009; pp. 304–311. [Google Scholar]
- Schneider, N.; Gavrila, D.M. Pedestrian Path Prediction with Recursive Bayesian Filters: A Comparative Study. In Proceedings of the German Conference on Pattern Recognition, Saarbrücken, Germany, 3–6 September 2013; Springer: Berlin/Heidelberg, Germany, 2013; Volume 8142. [Google Scholar]
- Choi, Y.; Kim, N.; Hwang, S.; Park, K.; Yoon, J.S.; An, K.; Kweon, I.S. KAIST Multi-Spectral Day/Night Data Set for Autonomous and Assisted Driving. IEEE Trans. Intell. Transp. Syst. 2018, 19, 934–948. [Google Scholar] [CrossRef]
- Rasouli, A.; Kotseruba, I.; Kunic, T.; Tsotsos, J. PIE: A Large-Scale Dataset and Models for Pedestrian Intention Estimation and Trajectory Prediction. In Proceedings of the IEEE/CVF International Conference on Computer Vision (ICCV), Seoul, South Korea, 27 October–3 November 2019; pp. 6261–6270. [Google Scholar]
- Bock, J.; Krajewski, R.; Moers, T.; Runde, S.; Vater, L.; Eckstein, L. The inD Dataset: A Drone Dataset of Naturalistic Road User Trajectories at German Intersections. In Proceedings of the IEEE Intelligent Vehicles Symposium (IV), Las Vegas, NV, USA, 19 October–13 November 2020; pp. 1929–1934. [Google Scholar]
- Strigel, E.; Meissner, D.; Seeliger, F.; Wilking, B.; Dietmayer, K. The Ko-PER intersection laserscanner and video dataset. In Proceedings of the 17th International IEEE Conference on Intelligent Transportation Systems (ITSC), Qingdao, China, 8–11 October 2014; pp. 1900–1901. [Google Scholar]
- Yan, Z.; Duckett, T.; Bellotto, N. Online learning for human classification in 3D LiDAR-based tracking. In Proceedings of the IEEE/RSJ International Conference on Intelligent Robots and Systems (IROS), Vancouver, BC, Canada, 24–28 September 2017; pp. 864–871. [Google Scholar]
- Lidar, V. HDL-64E. 2018. Available online: https://velodynelidar.com (accessed on 30 June 2021).
- Huang, X.; Wang, P.; Cheng, X.; Zhou, D.; Geng, Q.; Yang, R. The ApolloScape Open Dataset for Autonomous Driving and Its Application. IEEE Trans. Pattern Anal. Mach. Intell. 2020, 42, 2702–2719. [Google Scholar] [CrossRef] [PubMed] [Green Version]
- Yu, F.; Chen, H.; Wang, X.; Xian, W.; Chen, Y.; Liu, F.; Madhavan, V.; Darrell, T. BDD100K: A Diverse Driving Dataset for Heterogeneous Multitask Learning. In Proceedings of the IEEE/CVF Conference on Computer Vision and Pattern Recognition (CVPR), Seattle, WA, USA, 16–18 June 2020; pp. 2633–2642. [Google Scholar]
- Chang, M.-F.; Lambert, J.W.; Sangkloy, P.; Singh, J.; Bak, S.; Hartnett, A.; Wang, D.; Carr, P.; Lucey, S.; Ramanan, D.; et al. Argoverse: 3D Tracking and Forecasting with Rich Maps. In Proceedings of the IEEE/CVF Conference on Computer Vision and Pattern Recognition (CVPR), Long Beach, CA, USA, 15–21 June 2019; pp. 8740–8749. [Google Scholar]
- Kesten, R.; Usman, M.; Houston, J.; Pandya, T.; Nadhamuni, K.; Ferreira, A.; Yuan, M.; Low, B.; Jain, A.; Ondruska, P.; et al. Lyft Level 5 av Dataset. 2019. Available online: https://level5.lyft.com/dataset (accessed on 19 May 2020).
- Sun, P.; Kretzschmar, H.; Dotiwalla, X.; Chouard, A.; Patnaik, V.; Tsui, P.; Guo, J.; Zhou, Y.; Chai, Y.; Caine, B.; et al. Scalability in Perception for Autonomous Driving: Waymo Open Dataset. In Proceedings of the IEEE/CVF Conference on Computer Vision and Pattern Recognition (CVPR), Seattle, WA, USA, 14–19 June 2020; pp. 2443–2451. [Google Scholar]
- Patil, A.; Malla, S.; Gang, H.; Chen, Y.-T. The H3D dataset for full surround 3d multi-object detection and tracking in crowded urban scenes. In Proceedings of the IEEE International Conference on Robotics and Automation (ICRA), Montreal, QC, Canada, 20–24 May 2019. [Google Scholar]
- Oh, S.; Hoogs, A.; Perera, A.; Cuntoor, N.; Chen, C.C.; Lee, J.T.; Mukherjee, S.; Aggarwal, J.; Lee, H.; Davis, L. A large-scale benchmark dataset for event recognition in surveillance video. In Proceedings of the IEEE/CVF Conference on Computer Vision and Pattern Recognition (CVPR), Colorado Springs, CO, USA, 20–25 June 2011; pp. 3153–3160. [Google Scholar]
- Awad, G.; Butt, A.; Curtis, K.; Lee, Y.; Fiscus, J.; Godil, A.; Joy, D.; Delgado, A.; Smeaton, A.; Graham, Y.; et al. Benchmarking video activity detection video captioning and matching video storytelling linking and video search. In Proceedings of the Trecvid, Gaithersburg, MD, USA, 13 November 2018. [Google Scholar]
- Brščić, D.; Kanda, T.; Ikeda, T.; Miyashita, T. Person Tracking in Large Public Spaces Using 3-D Range Sensors. IEEE Trans. Hum.-Mach. Syst. 2013, 43, 522–534. [Google Scholar] [CrossRef]
- Ferryman, J.; Shahrokni, A. PETS2009: Dataset and challenge. In Proceedings of the Twelfth IEEE International Workshop on Performance Evaluation of Tracking and Surveillance, Snowbird, UT, USA, 7–9 December 2009; pp. 1–6. [Google Scholar]
- Camara, F.; Bellotto, N.; Cosar, S.; Nathanael, D.; Althoff, M.; Wu, J.; Ruenz, J.; Dietrich, A.; Fox, C.W. Pedestrian Models for Autonomous Driving Part I: Low-Level Models, From Sensing to Tracking. IEEE Trans. Intell. Transp. Syst. 2020, 22, 6131–6151. [Google Scholar] [CrossRef]
- Camara, F.; Bellotto, N.; Cosar, S.; Weber, F.; Nathanael, D.; Althoff, M.; Wu, J.; Ruenz, J.; Dietrich, A.; Markkula, G.; et al. Pedestrian Models for Autonomous Driving Part II: High-Level Models of Human Behavior. IEEE Trans. Intell. Transp. Syst. 2020, 22, 5453–5472. [Google Scholar] [CrossRef]
- Rudenko, A.; Palmieri, L.; Herman, M.; Kitani, K.M.; Gavrila, D.M.; Arras, K.O. Human motion trajectory prediction: A survey. Int. J. Robot. Res. 2020, 39, 895–935. [Google Scholar] [CrossRef]
- Gandhi, T.; Trivedi, M.M. Pedestrian Protection Systems: Issues, Survey, and Challenges. IEEE Trans. Intell. Transp. Syst. 2007, 8, 413–430. [Google Scholar] [CrossRef] [Green Version]
- Sewalkar, P.; Seitz, J. Vehicle-to-Pedestrian Communication for Vulnerable Road Users: Survey, Design Considerations, and Challenges. Sensors 2019, 19, 358. [Google Scholar] [CrossRef] [PubMed] [Green Version]
- Gulzar, M.; Muhammad, Y.; Muhammad, N. A Survey on Motion Prediction of Pedestrians and Vehicles for Autonomous Driving. IEEE Access 2021, 9, 137957–137969. [Google Scholar] [CrossRef]
- Rasouli, A.; Tsotsos, J.K. Autonomous Vehicles That Interact With Pedestrians: A Survey of Theory and Practice. IEEE Trans. Intell. Transp. Syst. 2019, 21, 900–918. [Google Scholar] [CrossRef] [Green Version]


| Performance Aspect | Radar | Lidar | Camera | Fusion (Radar + Lidar + Camera) | Metrics |
|---|---|---|---|---|---|
| Object detection | High | High | Moderate | High | Accuracy |
| Object classification | Low | Moderate | High | High | Accuracy |
| Distance estimation | High | High | Moderate | High | Accuracy |
| Edge detection | Low | High | High | High | Sensitivity |
| Lane tracking | Low | Low | High | High | Linearity |
| Visibility range | High | Moderate | Moderate | High | Resolution |
| Bad weather performance | High | Moderate | Low | High | Accuracy |
| Low illumination | High | High | Moderate | High | Sensitivity |
| Dataset | Type | Year | Sensor | Size | 3D Boxes | No. of Pedestrians | Annotated Frames | Locations | View |
|---|---|---|---|---|---|---|---|---|---|
| UCY [72] | Surveillance | 2007 | RGB Camera | 29.5 min | No | 1456 | No | Nicosia | Bird view |
| The Town-Centre dataset [84] | Surveillance | 2009 | CCTV Camera | - | No | 2200 | Yes | Oxford | Bird view |
| PETS’2009 dataset [121] | Surveillance | 2009 | CCTV Camera | - | No | 4307 | Yes | Reading | Bird view |
| The Caltech Pedestrian Dataset [104] | Traffic | 2009 | RGB Camera | 10 h | No | 2300 | Yes | Los Angeles | Terrestrial |
| ETH [71] | Surveillance | 2009 | RGB Camera | 25 min | No | 750 | Yes | Zurich | Terrestrial |
| VIRAT Video Dataset [118] | Surveillance, Activities | 2011 | Stereo Camera | 29 h | No | - | Yes | USA | Bird view |
| KITTI [56] | Traffic | 2012 | RGB Camera, LIDAR, GPS/IMU | 1.5 h | Yes | 30 | Yes | Karlsruhe | Terrestrial |
| ATC [120] | Surveillance | 2013 | RGB Camera, LiDAR | 24 h | No | 407 | No | Osaka | Bird view |
| Daimler dataset [105] | Traffic | 2013 | RGB Camera | - | No | 68 | Yes | Ulm | Terrestrial |
| Ko-PER [109] | Traffic | 2014 | RGB Camera, LiDAR | 6.2 min | Yes | 38 | Yes | Ulm | Bird view |
| KAIST [106] | Traffic | 2015 | RGB Camera, Infrared Camera | - | No | 1182 | Yes | Seoul | Terrestrial |
| Stanford Drone (SD) [76] | Surveillance | 2016 | RGB Camera | - | No | 3297 | Yes | California | Bird view (drone) |
| Cityscapes [81] | Traffic | 2016 | Stereo Camera, RGB Camera, GPS/IMU | - | Yes | - | Yes | Germany | Terrestrial |
| L-CAS [110] | Traffic | 2017 | RGB Camera, LiDAR | 49 min | Yes | 6140 | Yes | Lincoln | Terrestrial |
| BDD100K dataset [113] | Traffic | 2017 | RGB Camera, GPS/IMU | 1000 h | No | - | Yes | New York, San Francisco | Terrestrial |
| ActEV/VIRAT [119] | Surveillance | 2018 | Stereo Camera | 12 h | No | - | Yes | USA | Bird view |
| ApolloScape dataset [112] | Traffic | 2018 | RGB Camera, LiDAR, GPS/IMU | 2 h | Yes | - | Yes | China | Terrestrial |
| inD dataset [108] | Traffic | 2019 | Camera | 10 h | No | ~4000 | Yes | Aachen | Bird view/drone |
| PIE dataset [107] | Traffic | 2019 | RGB Camera | 6 h | No | 1842 | Yes | Toronto | Terrestrial |
| Argoverse [114] | Traffic | 2019 | RGB Camera, LiDAR, GPS/IMU | 320 h | Yes | 10,726 | Yes | Miami, Pittsburgh | Terrestrial |
| nuScenes [58] | Traffic | 2019 | RGB Camera, LiDAR, GPS/IMU, Radar | 6 h | Yes | 719 | Yes | Boston | Terrestrial |
| Lyft Level 5 [115] | Traffic | 2019 | RGB Camera, LiDAR, GPS/IMU, Radar | 1118 h | Yes | - | Yes | Palo Alto | Terrestrial |
| Waymo [116] | Traffic | 2019 | RGB Camera, LiDAR, GPS/IMU, Radar | 10 h | Yes | - | Yes | USA | Terrestrial |
| H3D [117] | Traffic | 2019 | RGB Camera, LiDAR, GPS/IMU, Radar | 0.77 h | Yes | - | Yes | San Francisco | Terrestrial |
| TRAF [60] | Traffic | 2019 | RGB Camera | - | No | 5 | Yes | - | Terrestrial |
Publisher’s Note: MDPI stays neutral with regard to jurisdictional claims in published maps and institutional affiliations. |
© 2021 by the authors. Licensee MDPI, Basel, Switzerland. This article is an open access article distributed under the terms and conditions of the Creative Commons Attribution (CC BY) license (https://creativecommons.org/licenses/by/4.0/).
Share and Cite
Sighencea, B.I.; Stanciu, R.I.; Căleanu, C.D. A Review of Deep Learning-Based Methods for Pedestrian Trajectory Prediction. Sensors 2021, 21, 7543. https://doi.org/10.3390/s21227543
Sighencea BI, Stanciu RI, Căleanu CD. A Review of Deep Learning-Based Methods for Pedestrian Trajectory Prediction. Sensors. 2021; 21(22):7543. https://doi.org/10.3390/s21227543
Chicago/Turabian StyleSighencea, Bogdan Ilie, Rareș Ion Stanciu, and Cătălin Daniel Căleanu. 2021. "A Review of Deep Learning-Based Methods for Pedestrian Trajectory Prediction" Sensors 21, no. 22: 7543. https://doi.org/10.3390/s21227543
APA StyleSighencea, B. I., Stanciu, R. I., & Căleanu, C. D. (2021). A Review of Deep Learning-Based Methods for Pedestrian Trajectory Prediction. Sensors, 21(22), 7543. https://doi.org/10.3390/s21227543