Microcontroller Implementation of Support Vector Machine for Detecting Blood Glucose Levels Using Breath Volatile Organic Compounds

1
Intelligent Systems Laboratory, Department of Engineering Science, Sonoma State University, Rohnert Park, CA 94928, USA
2
Department of Electrical and Computer Engineering, Miami University, Oxford, OH 45056, USA
*
Author to whom correspondence should be addressed.
Sensors 2019, 19(10), 2283; https://doi.org/10.3390/s19102283
Submission received: 19 March 2019
/
Revised: 14 May 2019
/
Accepted: 15 May 2019
/
Published: 17 May 2019
(This article belongs to the Section Biosensors)
Abstract
:This paper presents an embedded system-based solution for sensor arrays to estimate blood glucose levels from volatile organic compounds (VOCs) in a patient’s breath. Support vector machine (SVM) was trained on a general-purpose computer using an existing SVM library. A training model, optimized to achieve the most accurate results, was implemented in a microcontroller with an ATMega microprocessor. Training and testing was conducted using artificial breath that mimics known VOC footprints of high and low blood glucose levels. The embedded solution was able to correctly categorize the corresponding glucose levels of the artificial breath samples with 97.1% accuracy. The presented results make a significant contribution toward the development of a portable device for detecting blood glucose levels from a patient’s breath.
1. Introduction
In the United States, obesity, diabetes, cardiovascular diseases, and other metabolic disorders have been increasing in prevalence and severity at an extreme rate since the 1990s. In 2000, it was reported that less than 5% of US citizens were recorded to have been diabetic [1]. In 2016, the percentage of diabetic Americans rose 9.3% [2]. It is projected that, by 2030, 15.3% of Americans will have diabetes and that treatment of diabetes will cost the US economy a total of over 600 Billion US dollars per year [3]. With the prevalence of diabetes increasing at such an alarming rate, many new technologies are emerging to better monitor and manage blood glucose level. Among non-invasive glucose monitoring technologies, microwave sensors that are inspired by metamaterials, metasurfaces, nanoparticles, and graphene have shown great potentials in measuring glucose in aqueous solutions with a high sensitivity [4,5,6,7]. Recent research has focused on technologies such as meal detection [8], analysis of glucose in sweat [9], artificial pancreas technologies [10], and correlation between blood glucose levels and compounds present in breath [11,12]. Among these, researchers used variations of electronic-nose technologies to quantify glucose and other compounds. The evolution of electronic-nose application has been a recent trend in biomedical engineering and medical device industry. Several examples of electronic-nose applications include respiratory illness diagnosis [13], detection of cancers [14,15], detection of fungal diseases in harvested blueberries [16], and the general detection of volatile organic compounds (VOCs) in human breath [12]. With the availability of highly sensitive and low-cost VOC sensors, it has become affordable to create sensor-arrays that are able to detect VOCs in breath in parts-per-million (ppm) and even parts-per-billion (ppb) [17]. Refs [18,19] demonstrated the ability of SVM to differentiate between various types of tissues in a medical analysis. Specifically, SVM was trained to detect the difference between regular ovarian tissues and tissues containing ovarian cancer. These developments in sensing technology have made it possible to sense changes in VOCs in breath as changes in blood glucose levels of a diabetes patient.
This study intended to measure artificial breath samples that represent the breath of patients with high and normal blood glucose (BG) levels, and to correctly classify the breath samples represented by each level. Compared to non-invasive methods that measure glucose levels from an aqueous solution, the method presented in this paper measures VOCs in the breath and correlates it with the BG levels. SVM was trained to classify breath samples based on various features from a sensor array consisting of commercially available chemical sensors. The SVM training model was then compiled into a program run on an ATMega microprocessor to classify a breath sample in real time. The microprocessor implementation of the classification can be used to develop a portable biomedical device that can measure blood glucose levels from a patient’s breath sample instead of using a general purpose computer.
2. Design of Experiments
To train and test SVM, two sets of artificial breath samples, each with a unique VOC footprint that represented blood glucose range in a patient with diabetes, were created. One set represented a low BG levels (50–100 mg/dL) and the second set represented a high BG levels (180–240 mg/dL). Published data on diabetes breath analysis were reviewed for VOCs linked to blood glucose levels and their correlated concentrations [20,21,22]. Table 1 shows the breath VOCs that are consistently reported across publications as biomarkers of diabetes. Corresponding VOC concentrations and associated blood glucose levels are also shown. Among these VOCs, we chose acetone and ethanol as the two VOCs for further testing and analysis. This decision was informed by the extensive published work with acetone alone or acetone and ethanol for detecting diabetes from breath. For example, silicon tungsten oxide acetone sensors to estimate BG level is presented in [23]. A platinum functionalized tungsten oxide sensor for sensing acetone in exhaled breath is presented in [24]. Nanotubes and nanoparticles-based sensors for detecting acetone from breath are reported in [25,26]. A polymer-based sensor for detecting acetone and ethanol is reported in [27].
A test system was designed to ensure tests were conducted in a controlled and repeatable manner. The test system contained three 236 mL glass chambers connected to one another with chemical resistant tubing. A tank of ultra-clean air (20% oxygen and 80% nitrogen) was connected to a secondary flow control valve that permitted the air to flow at 0–1.5 L/min. As an effort to introduce carbon dioxide would increase the chamber setup complexity and also because CO does not have an impact on the sensors that are used in the presented study, air without CO was used. The receiving end of the flow control valve was connected to the first chamber, which contained water in which the clean air was percolated to simulate the humidity of a breath sample. Each compound or combination of compounds simulating a BG level was introduced into the second chamber. The sensor array was placed in the third chamber. The sensor array consisted of four commercially obtained VOC sensors. However, the responses from two of the sensors were minimal to the concentration levels used in this study and those responses, when included, did not provide any significant improvement in the SVM training. Thus, data from only two sensors, termed as Sensor-1 and Sensor-2, were utilized and presented in this paper.
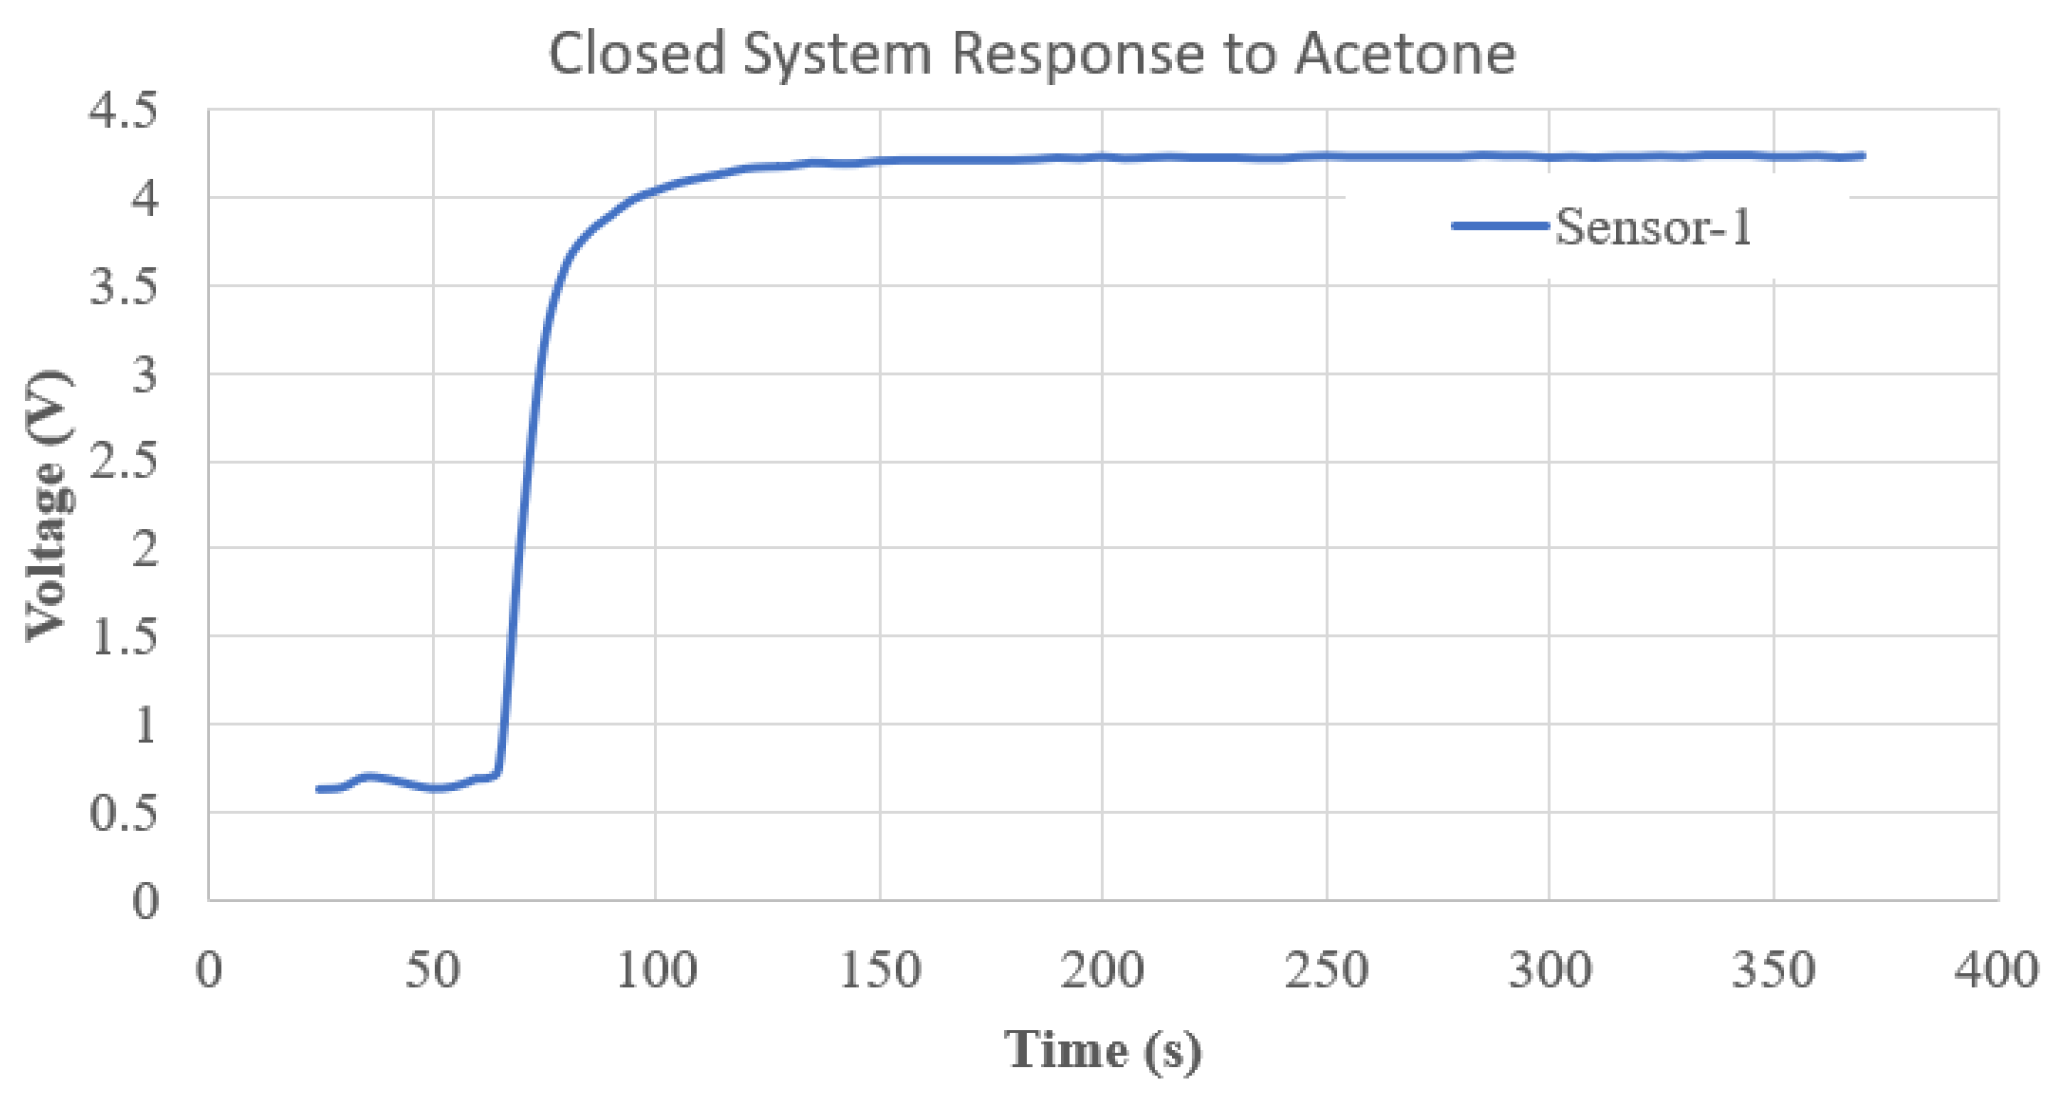
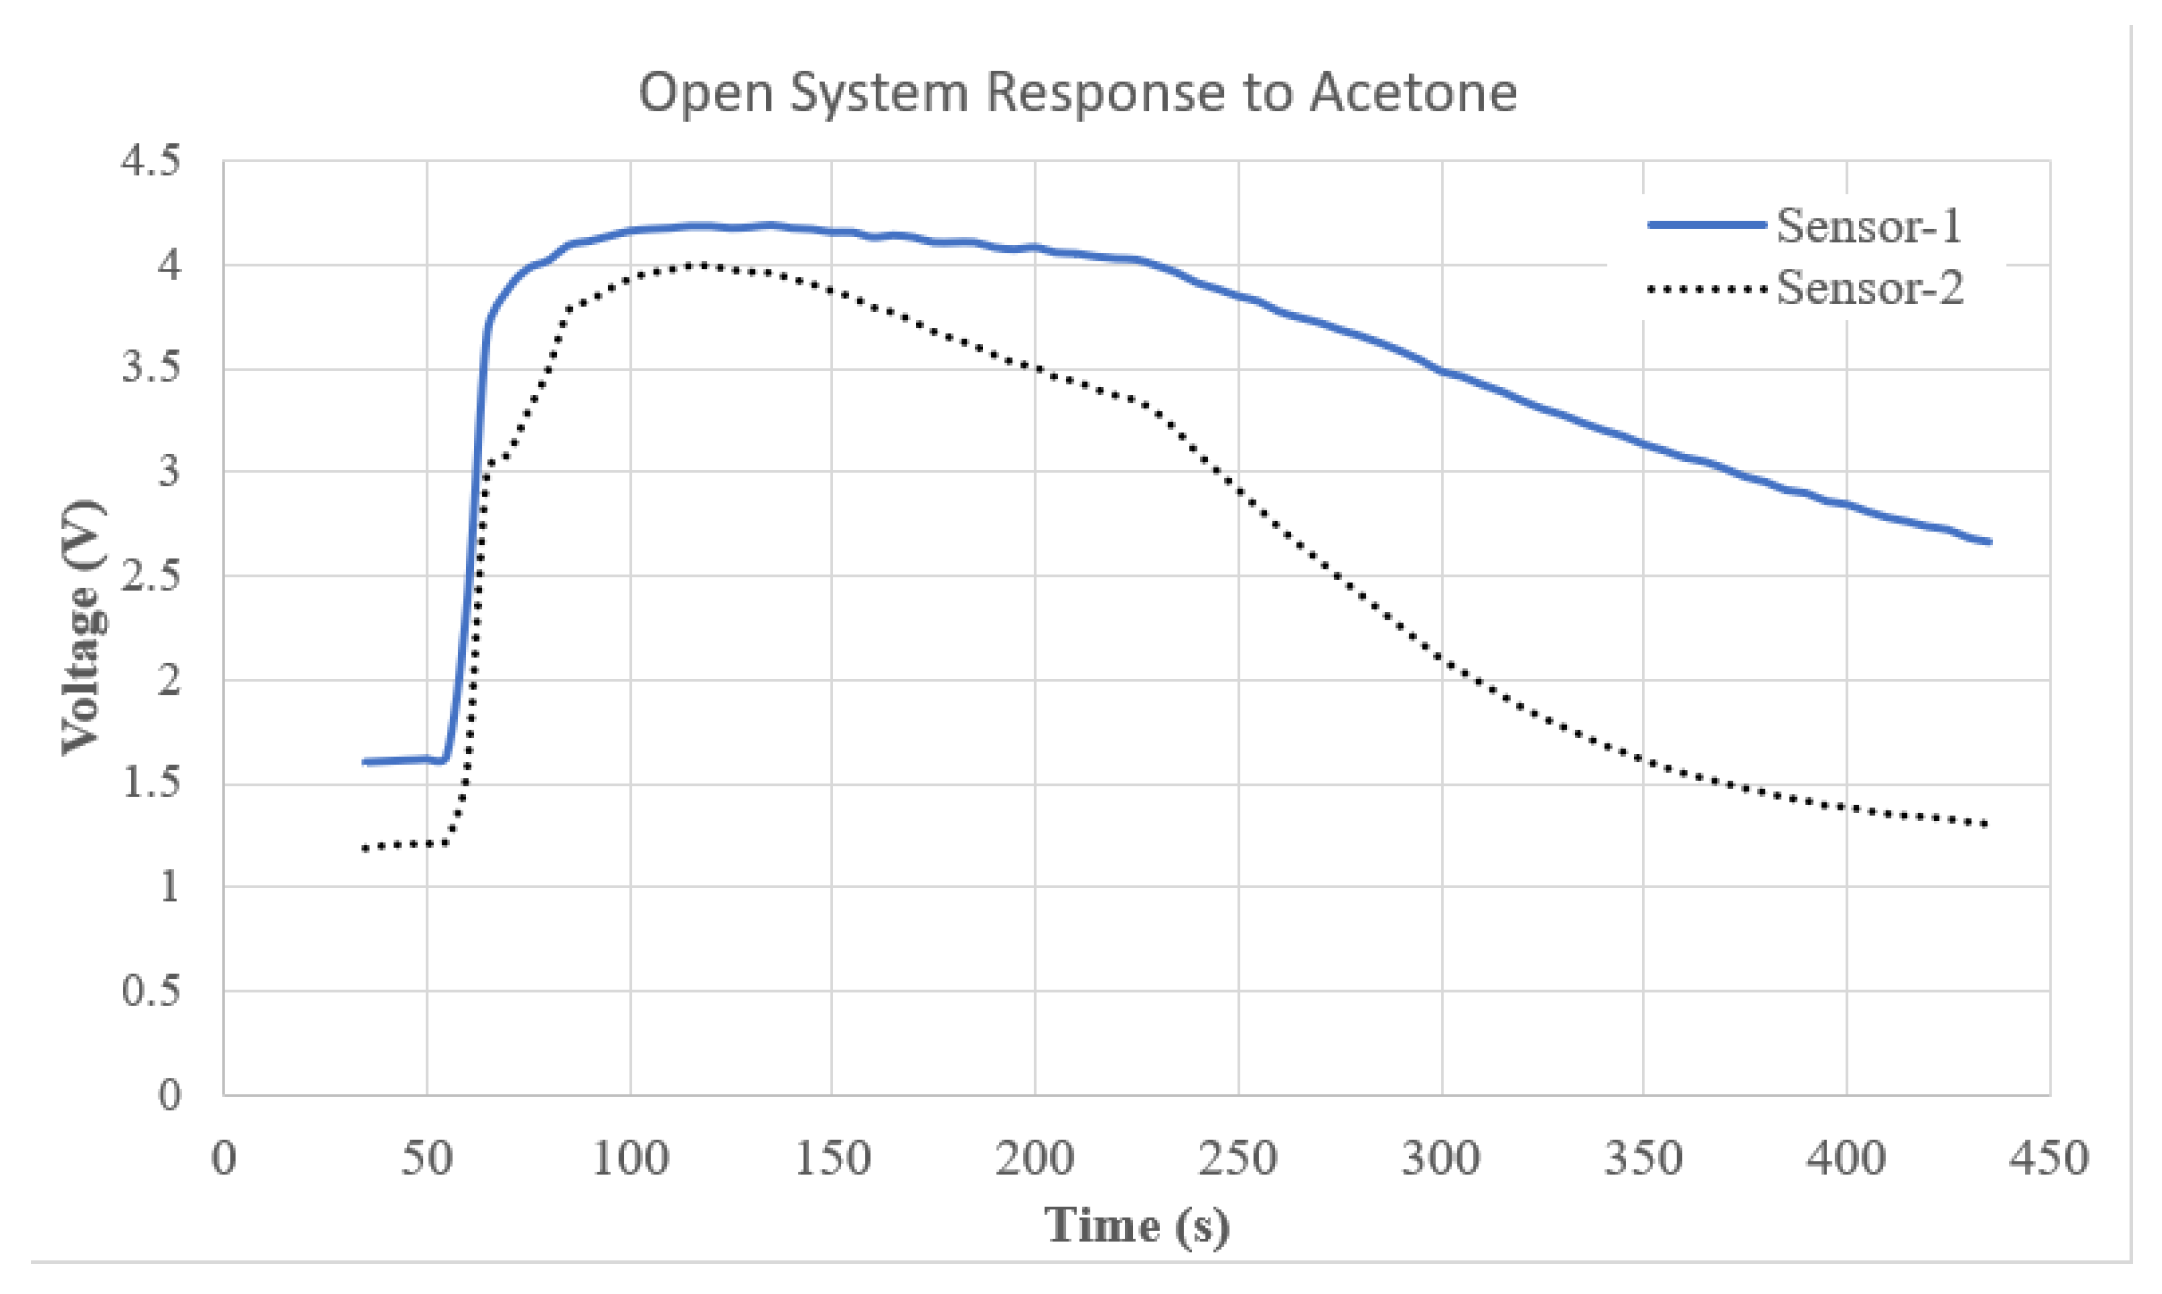
To determine evaporation and diffusion rate for each compound in the chamber, the sensor array was sealed into an air tight chamber after a sample of each acetone or ethanol was introduced separately [28,29]. Figure 1 depicts the response of Sensor-1 to acetone. The result in Figure 1 shows that the sensor began to respond to the acetone 70 s into the experiment. Next, to determine the flow-rate of the system that would yield the maximum quantity of each VOC in the third chamber of the system, where the sensor array would be placed, sensor responses to acetone were measured at a constant air flow (0.5 L/min). Figure 2 shows the response of the sensor array placed in the third chamber when acetone was introduced in the second chamber. This process was repeated for ethanol independently and the results suggest that the peak sensor response for all sensors occurred at the same time as in the acetone test.
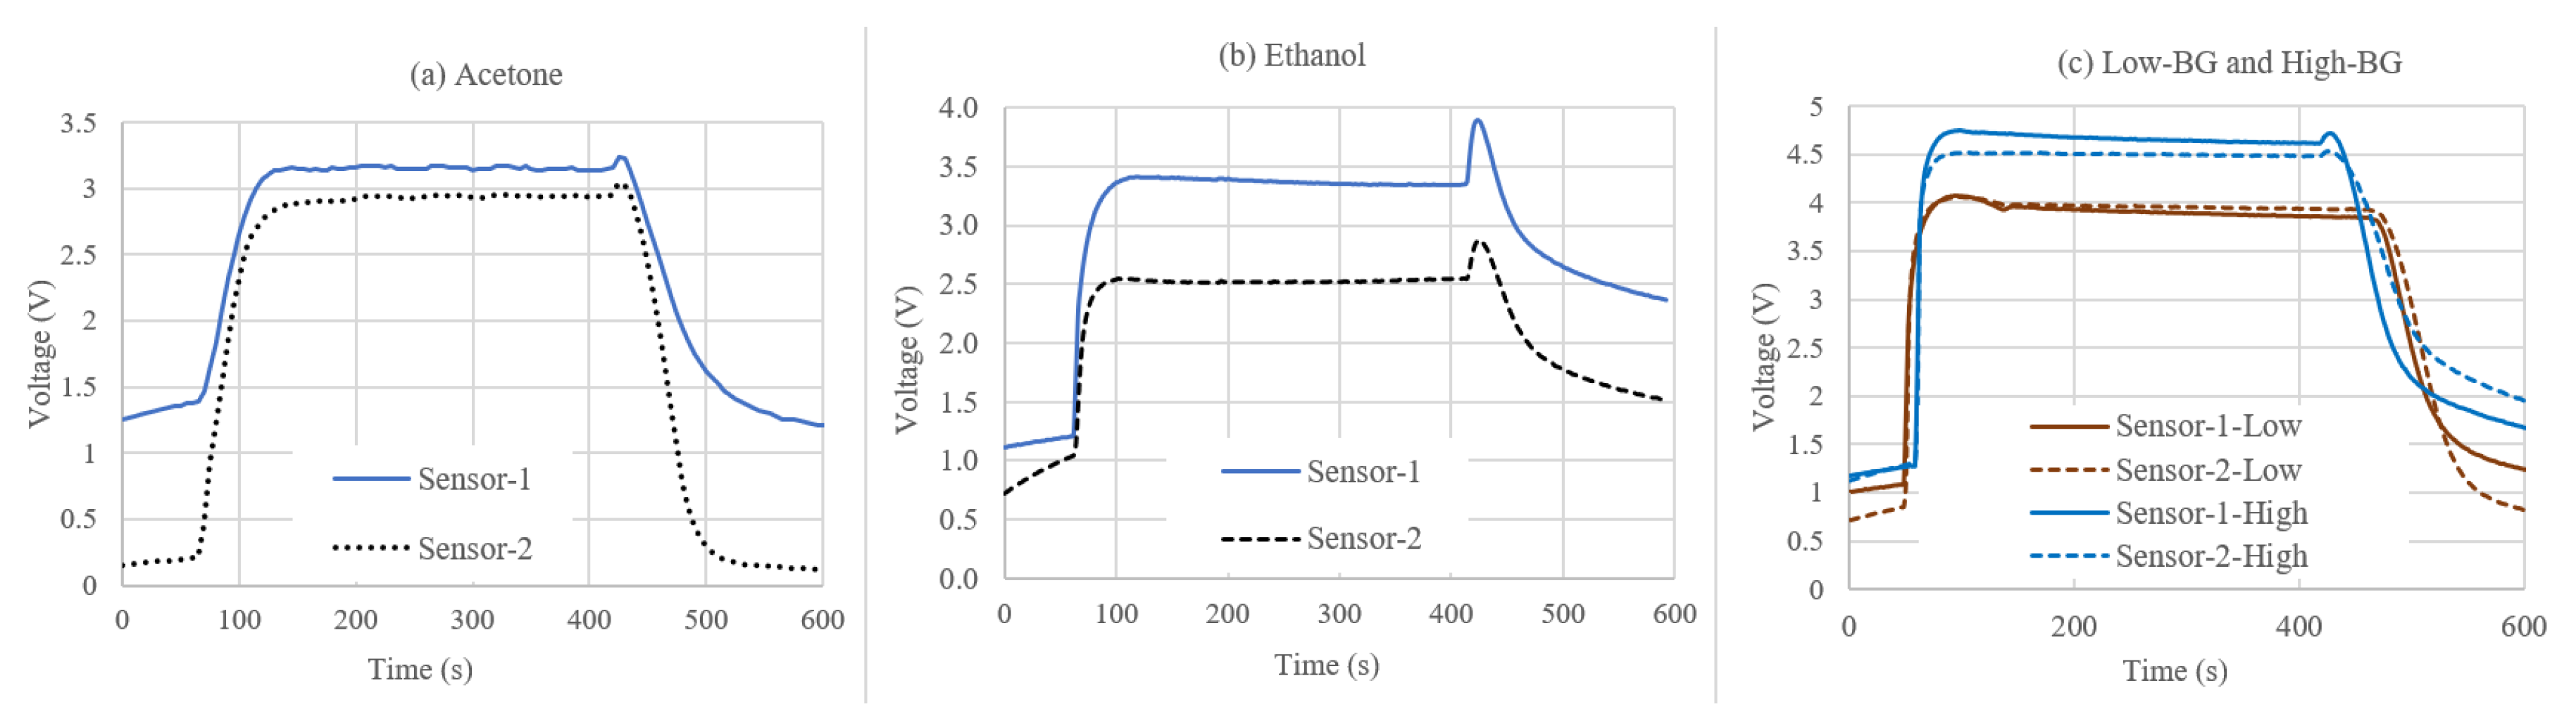
Based on the above results, a consistent flow control method was developed. The timing and flow control are shown in Table 2. Figure 3 shows the response of the two sensors in the sensor array to 1 ppm of acetone introduced using the process shown in Table 2. While we could not find an exact replica of the tests we conducted with these sensors, comparable experiments are reported in [30,31]. In the published work, the sensors are tested with 1 ppm of acetone and the results are comparable to the sensor responses shown in Figure 3. The sensor responses shown in Figure 3 were divided into five segments, as shown in Table 3, based on the timing of sensor responses to the introduction and evacuation of the VOCs.
3. Support Vector Machine
SVM is a machine learning algorithm that has been widely used in published literature for data classification in many areas. For example, SVM has been used to classify tissue samples used for cancer identification [18,19]. SVM was used for this research to evaluate the accuracy of detection of artificial breath samples. The features analyzed by the SVM are straightforward, and a variety of regression techniques or classification techniques could be used. For example, principal component analysis has been used in source classification of indoor air pollutants [32,33]. One could argue that SVM is too sophisticated for this application, but the significance of using SVM to analyze these features is rooted in the portability of this research. The experimental setup used in this research generates a model that can only classify data that are collected using the same setup. A regression-based model would have the same limitations. The benefit of using SVM is that, if this research were continued using human subjects and more sensors, SVM could be trained to achieve the same results that were observed in this experiment, whereas a regression model would have to be restructured entirely to match the new experiment. Thus, the SVM approach for the classification of breath samples makes a greater contribution to the development of a portable biomedical device than a regression approach.
The SVM used in this study was trained to complete a binary classification [34] of artificial breath samples. The presented SVM structure was used in this research because the number of support vectors used in the model required less memory than the data requirements of other machine learning algorithms such as artificial neural networks. SVM requires less memory than the machine learning algorithms discussed in [35]. This makes SVM a better choice for an embedded application with limited storage. The SVM intends to make a distinction between the two diabetes VOC footprints shown in Table 1. The problem in this study required the SVM to generate a two-class solution. The classification function for this problem is defined by Equation (1) where N is the number of support vectors used, and is the kernel function chosen. The input parameters x and are explained when discussing SVM training below. The parameter b is the error offset, is the data scaling factor, and is a dataset that describes the features obtained in testing.
In training SVM, each entry of datum that is entered into Equation (1) is characterized by a class x. The kernel function acts as a transformation that generates support vectors that help classify data in Equation (1). In Equation (2), is the kernel transform operation for each class and is the kernel transform operation for each dataset corresponding to class [34].
The kernel function maps a nonlinear boundary between all data classes in training while using all support vectors to span the input data across many, or an infinite number of dimensions [34]. There are many models that the kernel function can follow. In this study, a radial basis function (RBF) kernel was chosen. The process used to choose a kernel function for this experiment is based on the work of [36]. The RBF kernel model is described mathematically in Equation (3) where x is the class, is the dataset corresponding to that class and is the variance of the testing data [34,36].
The cross-validation method was used to determine the and C parameters used by the kernel function to scale data and define dimensional space so that the SVM could classify the data most accurately [36]. The cross validation method iteratively attempted to classify a dataset using an SVM that was trained with the remaining data, but, in each iteration, parameters and C were varied. This generated different support vectors with each iteration and, therefore, a different accuracy in data classification. The goal of the cross validation method was to determine the values of and C that produced the most accurate results.
4. Results and Discussion
Ten experiments were conducted for each VOC separately, and as a combined footprint for low and high BG levels, as indicated in Table 1. Nine tests of each footprint were used to train the SVM, and one test of each class was used for testing. A cross-validation process example is shown Table 4.
The cross-validation process was performed for all data segments defined in Table 3 for results that were generated by testing where acetone, ethanol, and a combination of acetone and ethanol were introduced into the system. The results of the parameters determined by this process can be seen in Table 5, Table 6 and Table 7.
Based on the results of the cross validation process, it was determined that the steady state section of the data yielded the highest accuracy. In addition, little preprocessing was needed to achieve high accuracy classification results for the steady-state samples. The number of features used in training contributed to classification accuracy; however, variations in the transient sections of the experiment were difficult to quantify. For the training and testing of a low and high blood glucose levels, ten sets of results with a combination of acetone and ethanol were used. The two VOCs were introduced sequentially in the first chamber, each with a concentration corresponding to a high or low blood glucose level, as shown in Table 1. The air flow settings shown in Table 2 were used for these tests. The SVM was trained using every permutation of the nine samples from the low BG class and nine samples from the high BG class with the remaining sample from each class used for testing. Data were collected from the experiment every 5 s during the steady state section of the test defined in Table 3. The SVM was able to classify the data collected in this manor with 97.07% accuracy.
In the presented study, we chose diabetes detection as the target application, however, the developed system could be used for other medical and non-medical applications by replacing the sensors used in this study with appropriate sensors and retraining the SVM algorithm. In this study, we used metal oxide semiconductor (MOS) based VOC sensors. These sensors can be replaced by optical and meta-material based sensors, which have also shown to have high sensitivity for applications in medical diagnosis [37,38,39,40]. For example, ref. [40] presented a meta-surfaces based sensing for detecting diabetes, cancer, and blood oxygen level. These and other types of sensors could be used with the presented algorithm for various applications.
The microcontroller program was designed to recognize data from the steady state portion of the experiment in real time tests [41,42]. The same parameters used in the post-processed results were used in the real-time test. For this experiment, new data were collected for testing, and all ten samples of the high BG class and the low BG class were used to train the SVM. New data were collected in the same manner as collected in testing to ensure accuracy. During the steady state portion of the experiment, data were collected from Sensor-1 and Sensor-2 every 5 s to generate a set of 251 total samples each containing two features, one from each sensor. Six total tests were conducted with the microcontroller classifying the data in real time. Three of the tests introduced acetone and ethanol into the system representing a low BG footprint, and the other three tests introduced acetone and ethanol quantities representing a high BG footprint. The microcontroller classified the two features read at 5-s intervals in real time, indicating whether the data were classified as a high BG footprint or a low BG footprint. Of the 753 two-feature readings collected in this manner, 731 of the reading were classified correctly. The other 22 readings were classified incorrectly. These results suggest that this microcontroller experiment was able to classify low BG and high BG VOC footprints in real time with a 97.1% accuracy.
5. Conclusions
A microcontroller-based solution that can recognize different VOC footprints consistent with the exhaled breath of patients having high or low blood glucose levels has been presented and discussed. Cross-validation processes were used to determine the SVM parameters and to create a model SVM microcontroller solution that recognizes and classifies data. In real time experiments with artificial breath, the trained model was able to classify low and high blood glucose levels with 97.1% accuracy. These results represent significant progress in developing a noninvasive portable device that could measure blood glucose levels from a patient’s breath.
Author Contributions
Conceptualization, S.S. and M.B.; methodology, S.S. and M.B.; validation, S.S. and M.B..; formal analysis, S.S. and M.B.; investigation, S.S. and M.B.; resources, S.S. and M.B.; data curation, S.S. and M.B.; writing—original draft preparation, S.S. and M.B.; writing—review and editing, S.S. and M.B.; visualization, S.S. and M.B.; supervision, S.S.; project administration, S.S.; and funding acquisition, S.S.
Funding
This material is based upon work supported by the National Science Foundation under Grant No. 1502310.
Acknowledgments
The authors would like to thank the Department of Engineering Science at Sonoma State University and the Department of Electrical and Computer Engineering at Miami University for the support and assistance with this work.
Conflicts of Interest
The authors declare no conflict of interest. The funder had no role in the design of the study; in the collection, analyses, or interpretation of data; in the writing of the manuscript, or in the decision to publish the results.
Abbreviations
The following abbreviations are used in this manuscript:
| VOC | Volatile Organic Compound |
| SVM | Support Vector Machine |
| ppm | Parts-Per-Million |
| ppb | Parts-Per-Billion |
| BG | Blood Glucose |
References
- Center for Disease Control and Prevention. 2017 Statistics on Diabetes. Available online: http://www.cdc.gov/diabetes/statistics/prev/national/gifpersons.htm (accessed on 4 August 2017).
- CDC Featres—Diabetes Latest. 2017. Available online: https://www.cdc.gov/features/diabetesfactsheet (accessed on 4 August 2017).
- Rowley, W.; Bezold, C.; Arikan, Y.; Byrne, E.; Krohe, S. Diabetes 2030: Insights from Yesterday, Today, and Future Trends. Popul. Health Manag. 2017, 20, 6–12. [Google Scholar] [CrossRef] [Green Version]
- Islam, M.T.; Hoque, A.; Almutairi, A.F.; Asmin, N. Left-Handed Metamaterial-Inspired Unit Cell for S-Band Glucose Sensing Application. Sensors 2019, 19, 169. [Google Scholar] [CrossRef]
- Spada, L.L.; Spooner, C.; Haq, S.; Hao, Y. Curvilinear MetaSurfaces for Surface Wave Manipulation. Sci. Rep. 2019, 9, 3107. [Google Scholar] [CrossRef]
- Liberal, I.; Li, Y.; Engheta, N. Reconfigurable Epsilon-Near-Zero Metasurfaces via Photonic Doping. Nanophotonics 2018, 7, 1117–1127. [Google Scholar] [CrossRef]
- Vakil, A.; Engheta, N. Transformation Optics Using Graphene. Science 2011, 332, 1291–1294. [Google Scholar] [CrossRef] [PubMed]
- Samadi, S.; Turksoy, K.; Hajizadeh, I.; Feng, J.; Sevil, M.; Cinar, A. Meal Detection and Carbohydrate Estimation Using Continuous Glucose Sensor Data. IEEE J. Biomed. Heath Inform. 2017, 21, 619–627. [Google Scholar] [CrossRef]
- Olarte, O.; Chilo, J.; Pelegri-Sebastia, J. Glucose Detection in Human Sweat Using and Electronic Nose. In Proceedings of the 35th Annual International Conference of the IEEE EMBS, Osaka, Japan, 3–7 July 2013; Universiteit Brussels: Brussels, Belgium, 2013; pp. 1462–1465. [Google Scholar]
- Shichiri, M.; Yamasaki, Y.; Kawamori, R.; Hakui, N.; Abe, H. Wearable Artificial Endocrine Pancreas with Needle-Type Glucose Sensor. Lancet 1982, 320, 1129–1131. [Google Scholar] [CrossRef]
- Rydosz, A. A Negative Correlation between Blood Glucose and Acetone Measured in Healthy and Type 1 Diabetes Mellitus Patient Breath. J. Diabetes Sci. Technol. 2015, 9, 881–884. [Google Scholar] [CrossRef]
- Righettoni, M.; Schmid, A.; Amann, A.; Pratsinis, S. Correlations between blood glucose and breath components from portable gas sensors and PTR-TOF-MS. J. Breath Res. 2013, 7, 037110. [Google Scholar] [CrossRef]
- Gardner, J.; Shin, H.; Hines, E. An electronic nose system to diagnose illness. Sens. Actuators B Chem. 2000, 70, 19–24. [Google Scholar] [CrossRef]
- Peng, G.; Hakim, M.; Broza, Y.; Billan, S.; Abdah-Bortnyak, R.; Kuten, A.; Tisch, U.; Haick, H. Detection of lung, breast, colorectal, and prostate cancers from exhaled breath using a single array of nanosensors. Br. J. Cancer 2010, 103, 542–551. [Google Scholar] [CrossRef] [Green Version]
- Mazzone, P.; Hammel, J.; Dweik, R.; Na, J.; Czich, C.; Laskowski, D.; Mekhail, T. Diagnosis of lung cancer by the analysis of exhaled breath with a colorimetric sensor array. Thorax 2007, 62, 565–568. [Google Scholar] [CrossRef] [Green Version]
- Li, C.; Krewer, G.; Ji, P.; Scherm, H.; Kays, S. Gas sensor array for blueberry fruit disease detection and classification. Postharvest Biol. Technol. 2010, 55, 144–149. [Google Scholar] [CrossRef]
- Minh, T.; Oliver, S.; Ngo, J.; Flores, R.; Midyett, J.; Meinardi, S.; Carlson, M.; Rowland, F.; Blake, D.; Galassetti, P. Nonivasive measurement of plasma glucose from exhaled breath in healthy and type 1 diabetic subjects. AJP Endocrinol. Metab. 2011, 300, E1166–E1175. [Google Scholar] [CrossRef]
- Furey, T.; Cristianini, N.; Duffy, N.; Bednarski, D.; Schummer, M.; Haussler, D. Support vector machine classification and validation of cancer tissue samples using microarray expression data. Bioinformatics 2000, 16, 906–914. [Google Scholar] [CrossRef] [Green Version]
- Savitzky, A.; Golay, M. Smoothing and Differentiation of Data by Simplified Least Squares Procedures. Anal. Chem. 1964, 36, 1627–1639. [Google Scholar] [CrossRef]
- Turner, C.; Walton, C.; Hoashi, S.; Evans, M. Breath in Type I diabetes mellitus patients during hypoglycaemic clamps. J. Breath Res. 2009, 3, 046004. [Google Scholar] [CrossRef] [PubMed]
- Wang, C.; Mbi, A.; Shepherd, M. A Study on Breath Acetone in Diabetic Patients Using a Cavity Ringdown Breath Analyzer: Exploring Correlations of Breath Acetone with Blood Glucose and Glycohemogloving A1C. IEEE Sens. J. 2010, 10, 54–63. [Google Scholar] [CrossRef]
- Galassetti, P.; Novak, B.; Nemet, D.; Rose-Gottron, C.; Cooper, D.; Meinardi, S.; Newcomb, R.; Zaldivar, F.; Blake, D. Breath Ethanol and Acetone as Indicators of Serum Glucose Levels: An Initial Report. Diabetes Technol. Ther. 2005, 7, 115–123. [Google Scholar] [CrossRef] [PubMed] [Green Version]
- Righettoni, M.; Tricoli, A.; Pratsinis, S.E. Si:WO3 Sensors for Highly Selective Detection of Acetone for Easy Diagnosis of Diabetes by Breath Analysis. Anal. Chem. 2010, 82, 3581–3587. [Google Scholar] [CrossRef]
- Choi, S.-J.; Lee, I.; Jang, B.-H.; Youn, D.-Y.; Ryu, W.-H.; Park, C.O.; Kim, I.-D. Selective Diagnosis of Diabetes Using Pt-Functionalized WO3 Hemitube Networks as a Sensing Layer of Acetone in Exhaled Breath. Anal. Chem. 2012, 85, 1792–1796. [Google Scholar] [CrossRef]
- Salehia, S.; Nikan, E.; Khodadadi, A.A.; Mortazavi, Y. Highly Sensitive Carbon Nanotubes–SnO2 Nanocomposite Sensor for Acetone Detection in Diabetes Mellitus Breath. Sens. Actuators B Chem. 2014, 205, 261–267. [Google Scholar] [CrossRef]
- Shin, J.; Choi, S.-J.; Lee, I.; Youn, D.-Y.; Park, C.O.; Lee, J.-H.; Tuller, H.L.; Kim, I.-D. Thin-Wall Assembled SnO2 Fibers Functionalized by Catalytic Pt Nanoparticles and Their Superior Exhaled-Breath-Sensing Properties for the Diagnosis of Diabetes. Adv. Funct. Mater. 2012, 23, 2357–2367. [Google Scholar] [CrossRef]
- Daneshkhah, A.; Shrestha, S.; Siegel, A.; Varahramyan, K.; Agarwal, M. Cross-Selectivity Enhancement of Poly(Vinylidene Fluoride-Hexafluoropropylene)-Based Sensor-Array for detecting Acetone and Ethanol. Sensors 2017, 17, 595. [Google Scholar] [CrossRef]
- Abate, P.; Rodriguez, V.; Macchi, R. Evaporation of solvent in one-bottle adhesives. J. Dent. 2000, 28, 437–440. [Google Scholar] [CrossRef]
- Li, H.; Zhan, H.; Fu, S.; Liu, M.; Chai, X. Rapid determination of mathanol in black liquors by full evaporation headspace gas chromatography. J. Chromatogr. A 2007, 1175, 133–136. [Google Scholar] [CrossRef]
- Netchaev, A.D. Selective Detection of Volatile Organic Compounds Using Metal Oxide Sensor Arrays. Ph.D. Thesis, The University of Southern Mississippi, Hattiesburg, MS, USA, May 2015. [Google Scholar]
- Itoh, T.; Akamatsu, T.; Tsuruta, A.; Shin, W. Selective Detection of Target Volatile Organic Compounds in Contaminated Humid Air Using a Sensor Array with Principal Component Analysis. Sensors 2017, 17, 1662. [Google Scholar] [Green Version]
- Chen, Y.-T.; Shrestha, S. Source Classification of Indoor Air Pollutants Using Principal Component Analysis for Smart Home Monitoring Applications. In Proceedings of the 2018 IEEE International Conference on Electro/Information Technology (EIT), Rochester, MI, USA, 3–5 May 2018; pp. 129–133. [Google Scholar]
- Chen, Y.-T.; Samborsky, Z.; Shrestha, S. Electronic Nose for Ambient Detection and Monitoring. In Proceedings of the SPIE Commercial + Scientific Sensing and Imaging, Anaheim, CA, USA, 26–30 April 2017; Volume 10251, pp. 1–9. [Google Scholar]
- Hsu, M.; A Practical Guide to Support Vector Machines. Department of Computer Science, National Taipei, Taiwan. June 2016. Available online: https://www.csie.ntu.edu.tw/cjlin/papers/guide/guide.pdf (accessed on 20 June 2017).
- Yu, K.-H.; Beam, A.L.; Kohane, I.S. Artificial Intelligence in Healthcare. Nat. Biomed. Eng. 2018, 2, 719–731. [Google Scholar] [CrossRef] [PubMed]
- Belousov, A.; Verzakov, S.; von Frese, J. Applicational aspects of support vector machines. J. Chemom. 2002, 16, 482–489. [Google Scholar] [CrossRef]
- Iovine, R.; Spada, L.L.; Vegni, L. Optical Properties of Modified Nanorod Particles for Biomedical Sensing. IEEE Trans. Magn. 2014, 50, 1–4. [Google Scholar] [CrossRef]
- Engheta, N. Circuits with Light at Nanoscales: Optical Nanocircuits Inspired by Metamaterials. Science 2007, 317, 1698–1702. [Google Scholar] [CrossRef] [PubMed] [Green Version]
- Liu, Y.; Hao, Y.; Li, K.; Gong, S. Radar Cross Section Reduction of a Microstrip Antenna Based on Polarization Conversion Metamaterial. IEEE Antennas Wirel. Propag. Lett. 2015, 15, 80–83. [Google Scholar] [CrossRef]
- Spada, L.L. Metasurfaces for Advanced Sensing and Diagnostics. Sensors 2019, 19, 355. [Google Scholar] [CrossRef]
- Github. radzilu/Arduino-SVM. 2017. Available online: https://github.com/radzilu/Arduino-SVM (accessed on 19 August 2017).
- Ghang, C.-C.; Lin, C.-J. LIBSVM: A library for support vector machines. ACM Trans. Intell. Syst. Technol. 2011, 2, 27. Available online: http://www.csie.ntu.edu.tw/cjlin/libsvm (accessed on 20 June 2017).
Figure 1.
Response of Sensor-1 to acetone over time in an air-tight chamber.

Figure 2.
Responses of Sensor-1 and Sensor-2 placed in the third chamber of the system to acetone introduced in the second chamber at 0.5 L/min.
Figure 2.
Responses of Sensor-1 and Sensor-2 placed in the third chamber of the system to acetone introduced in the second chamber at 0.5 L/min.

Figure 3.
Sample sensor array responses showing results for: (a) acetone; (b) ethanol; and (c) mixed compounds representing low and high blood glucose levels. The spikes in (b) seen at the end of steady state and beginning of system clearing cycle were due to the residual ethanol in the VOC chamber, which was transported to sensor array chamber. This also indicated a slower ethanol evaporation.


| Compound | Low BG Level | High BG Level |
|---|---|---|
| Acetone | 1–3 ppm | 5–7 ppm |
| Methyl Nitrate | 1 ppm | 3 ppm |
| Ethanol | 0–20 ppb | 35–50 ppb |
| Methanol | 0 ppb | 1 ppb |
Table 2.
Timing and flow control for the chamber.
| Time (min) | Action | Air Flow Rate |
|---|---|---|
| t = 0–5 | Clean System | 1.5 L/min |
| t = 5–6 | Introduce Chem. | 0 L/min |
| t = 6–6:45 | Blow Chem. to Sensor | 0.5 L/min |
| t = 6:45–12 | Steady State Response | 0 L/min |
| t = 12–15 | Clear System | 1.5 L/min |
Table 3.
Sensor response feature segments.
| Feature | Time Segment (s) |
|---|---|
| Baseline | 0–50 |
| Rise | 65–85 |
| Steady State | 150–400 |
| Fall | 450–500 |
| Late Fall | 500–600 |
Table 4.
Cross-validation process example for acetone.
| Acetone | = | = | = | = | = |
|---|---|---|---|---|---|
| C = | 100% | 82% | 64% | 50% | 50% |
| C = | 82% | 82% | 63% | 50% | 50% |
| C = | 59% | 50% | 50% | 50% | 50% |
| C = | 68% | 59% | 50% | 50% | 50% |
| C = | 68% | 59% | 50% | 50% | 50% |
| C = | 68% | 59% | 50% | 50% | 50% |
Table 5.
Cross validation results for acetone.
| Acetone | Baseline | Rise | Steady State | Fall | Late Fall |
|---|---|---|---|---|---|
| C | |||||
| Accuracy | 100% | 73% | 100% | 77% | 78% |
Table 6.
Cross validation results for ethanol.
| Acetone | Baseline | Rise | Steady State | Fall | Late Fall |
|---|---|---|---|---|---|
| C | |||||
| Accuracy | 100% | 60% | 100% | 100% | 100% |
Table 7.
Cross validation results for a mixture of acetone and ethanol.
| Acetone | Baseline | Rise | Steady State | Fall | Late Fall |
|---|---|---|---|---|---|
| C | |||||
| Accuracy | 64% | 60% | 100% | 100% | 76% |
© 2019 by the authors. Licensee MDPI, Basel, Switzerland. This article is an open access article distributed under the terms and conditions of the Creative Commons Attribution (CC BY) license (http://creativecommons.org/licenses/by/4.0/).
Share and Cite
MDPI and ACS Style
Boubin, M.; Shrestha, S. Microcontroller Implementation of Support Vector Machine for Detecting Blood Glucose Levels Using Breath Volatile Organic Compounds. Sensors 2019, 19, 2283. https://doi.org/10.3390/s19102283
AMA Style
Boubin M, Shrestha S. Microcontroller Implementation of Support Vector Machine for Detecting Blood Glucose Levels Using Breath Volatile Organic Compounds. Sensors. 2019; 19(10):2283. https://doi.org/10.3390/s19102283
Chicago/Turabian StyleBoubin, Matthew, and Sudhir Shrestha. 2019. "Microcontroller Implementation of Support Vector Machine for Detecting Blood Glucose Levels Using Breath Volatile Organic Compounds" Sensors 19, no. 10: 2283. https://doi.org/10.3390/s19102283
Note that from the first issue of 2016, this journal uses article numbers instead of page numbers. See further details here.