A Multi-Sensor Matched Filter Approach to Robust Segmentation of Assisted Gait


Abstract
1. Introduction
2. Materials and Methods
2.1. System Overview
2.2. Experimental Protocol
2.3. Data Analysis
3. Gait Segmentation and Assessment
3.1. Multi-Sensor Fusion Gait Segmentation Algorithm
3.2. Algorithm Evaluation
3.3. System Verification (Pilot)
4. Results
4.1. Stride Variability
4.2. Stride Classification
4.3. Algorithm Precision
5. Discussion
6. Conclusions
Author Contributions
Funding
Acknowledgments
Conflicts of Interest
References
- Orces, C.H.; Lorenzo, C. Prevalence and Determinants of Falls among Older Adults in Ecuador: An Analysis of the SABE I Survey. Diabetes Metab. Syndr. Clin. Res. Rev. 2018, 12, 147–153. [Google Scholar] [CrossRef] [PubMed]
- Florence, C.S.; Bergen, G.; Atherly, A.; Burns, E.; Stevens, J.; Drake, C. Medical Costs of Fatal and Nonfatal Falls in Older Adults. J. Am. Geriatr. Soc. 2018, 66, 693–698. [Google Scholar] [CrossRef] [PubMed]
- Haddad, Y.K.; Bergen, G.; Florence, C.S. Estimating the Economic Burden Related to Older Adult Falls by State. J. Public Health Manag. Pract. 2018. [Google Scholar] [CrossRef] [PubMed]
- Wade, J.; Beccani, M.; Myszka, A.; Bekele, E.; Valdastri, P.; Flemming, P.; De Riesthal, M.; Withrow, T.; Sarkar, N. Design and implementation of an instrumented cane for gait recognition. In Proceedings of the IEEE International Conference on Robotics and Automation, Seattle, WA, USA, 26−30 May 2015; pp. 5904–5909. [Google Scholar]
- Houry, D.; Florence, C.; Baldwin, G.; Stevens, J.; McClure, R. The CDC Injury Center’s Response to the Growing Public Health Problem of Falls Among Older Adults. Am. J. Lifestyle Med. 2016, 10, 74–77. [Google Scholar] [CrossRef] [PubMed]
- Boutaayamou, M.; Brüls, O.; Denoël, V.; Schwartz, C.; Demonceau, M.; Garraux, G.; Verly, J.G. Segmentation of gait cycles using foot-mounted 3D accelerometers. In Proceedings of the IEEE International Conference on 3D Imaging, Liege, Belgium, 14–15 December 2015; pp. 1–7. [Google Scholar]
- Delahunt, E.; Monaghan, K.; Caulfield, B. Altered neuromuscular control and ankle joint kinematics during walking in subjects with functional instability of the ankle joint. Am. J. Sports Med. 2006, 34, 1970–1976. [Google Scholar] [CrossRef] [PubMed]
- Pavel, M.; Hayes, T.; Tsay, I.; Erdogmus, D.; Paul, A.; Larimer, N.; Jimison, H.; Nutt, J. Continuous assessment of gait velocity in Parkinson’s disease from unobtrusive measurements. In Proceedings of the IEEE International Conference on Neural Engineering, Kohala, HI, USA, 2–5 May 2007; pp. 700–703. [Google Scholar]
- Shrader, M.W.; Bhowmik-Stoker, M.; Jacofsky, M.C.; Jacofsky, D.J. Gait and stair function in total and resurfacing hip arthroplasty: A pilot study. Clin. Orthop. Relat. Res. 2009, 467, 1476–1484. [Google Scholar] [CrossRef] [PubMed]
- Verghese, J.; Lipton, R.B.; Hall, C.B.; Kuslansky, G.; Katz, M.J.; Buschke, H. Abnormality of Gait as a Predictor of Non-Alzheimer’s Dementia. N. Engl. J. Med. 2002, 347, 1761–1768. [Google Scholar] [CrossRef] [PubMed]
- Gillain, S.; Warzee, E.; Lekeu, F.; Wojtasik, V.; Maquet, D.; Croisier, J.L.; Salmon, E.; Petermans, J. The value of instrumental gait analysis in elderly healthy, MCI or Alzheimer’s disease subjects and a comparison with other clinical tests used in single and dual-task conditions. Ann. Phys. Rehabil. Med. 2009, 52, 453–474. [Google Scholar] [CrossRef] [PubMed]
- Salarian, A.; Russmann, H.; Vingerhoets, F.J.G.; Dehollain, C.; Blanc, Y.; Burkhard, P.R.; Aminian, K. Gait assessment in Parkinson’s disease: Toward an ambulatory system for long-term monitoring. IEEE Trans. Biomed. Eng. 2004, 51, 1434–1443. [Google Scholar] [CrossRef] [PubMed]
- Greene, B.R.; Foran, T.G.; Mcgrath, D.; Doheny, E.P.; Burns, A.; Caulfield, B. A Comparison of Algorithms for Body-Worn Sensor Based Spatio-Temporal Gait Parameters to the GAITRite Electronic Walkway. J. Appl. Biomech. 2012, 28, 349–355. [Google Scholar] [CrossRef] [PubMed]
- Haji Ghassemi, N.; Hannink, J.; Martindale, C.F.; Gaßner, H.; Müller, M.; Klucken, J.; Eskofier, B.M. Segmentation of Gait Sequences in Sensor-Based Movement Analysis: A Comparison of Methods in Parkinson’s Disease. Sensors 2018, 18, 145. [Google Scholar] [CrossRef] [PubMed]
- Yang, G.; Tan, W.; Jin, H.; Zhao, T.; Tu, L. Review wearable sensing system for gait recognition. Cluster Comput. 2018. [Google Scholar] [CrossRef]
- Greene, B.R.; McGrath, D.; O’Neill, R.; O’Donovan, K.J.; Burns, A.; Caulfield, B. An adaptive gyroscope-based algorithm for temporal gait analysis. Med. Biol. Eng. Comput. 2010, 48, 1251–1260. [Google Scholar] [CrossRef] [PubMed]
- Taborri, J.; Palermo, E.; Rossi, S.; Cappa, P. Gait Partitioning Methods: A Systematic Review. Sensors 2016, 16. [Google Scholar] [CrossRef] [PubMed]
- Gill, S.; Hearn, J.; Powell, G.; Scheme, E. Design of a multi-sensor IoT-enabled assistive device for discrete and deployable gait monitoring. In Proceedings of the IEEE International Conference on Healthcare Innovations and Point of Care Technologies, Bethesda, MD, USA, 6–8 November 2017; pp. 216–220. [Google Scholar]
- Attal, F.; Amirat, Y.; Chibani, A.; Mohammed, S. Automatic Recognition of Gait phases Using a Multiple Regression Hidden Markov Model. IEEE/ASME Trans. Mechatron. 2018, 4435, 1–11. [Google Scholar] [CrossRef]
- Martinez-Hernandez, U.; Dehghani-Sanij, A.A. Adaptive Bayesian inference system for recognition of walking activities and prediction of gait events using wearable sensors. Neural Netw. 2018, 102, 107–119. [Google Scholar] [CrossRef] [PubMed]
- Martinez-Hernandez, U.; Dehghani-Sanij, A.A. Probabilistic identification of sit-to-stand and stand-to-sit with a wearable sensor. Pattern Recognit. Lett. 2018. [Google Scholar] [CrossRef]
- Hegde, N.; Bries, M.; Swibas, T.; Melanson, E.; Sazonov, E. Automatic Recognition of Activities of Daily Living utilizing Insole Based and Wrist Worn Wearable Sensors. IEEE J. Biomed. Health Inform. 2017, 22. [Google Scholar] [CrossRef] [PubMed]
- Nygård, L.; Starkhammar, S. The use of everyday technology by people with dementia living alone: Mapping out the difficulties. Aging Ment. Health 2007, 11, 144–155. [Google Scholar] [CrossRef] [PubMed]
- Mitschke, C.; HeB, T.; Milani, T.L. Which Method Detects Foot Strike in Rearfoot and Forefoot Runners Accurately when Using an Inertial Measurement Unit? Appl. Sci. 2017, 7, 986. [Google Scholar] [CrossRef]
- Hundza, S.; Hook, W.; Harris, C. Accurate and reliable gait cycle detection in Parkinson’s disease. IEEE Trans. Neural Syst. Rehabil. Eng. 2013, 22, 127–137. [Google Scholar] [CrossRef] [PubMed]
- Yoneyama, M.; Kurihara, Y.; Watanabe, K.; Mitoma, H. Accelerometry-Based Gait Analysis and Its Application to Parkinson’s Disease Assessment—Part 1: Detection of Stride Event. IEEE Trans. Neural Syst. Rehabil. Eng. 2014, 22, 613–622. [Google Scholar] [CrossRef] [PubMed]
- Crea, S.; Donati, M.; De Rossi, S.; Oddo, C.; Vitiello, N. A Wireless Flexible Sensorized Insole for Gait Analysis. Sensors 2014, 14, 1073–1093. [Google Scholar] [CrossRef] [PubMed]
- Sabatini, A.M.; Mannini, A. Ambulatory assessment of instantaneous velocity during walking using inertial sensor measurements. Sensors 2016, 16. [Google Scholar] [CrossRef] [PubMed]
- Boutaayamou, M.; Schwartz, C.; Stamatakis, J.; Denoël, V.; Maquet, D.; Forthomme, B.; Croisier, J.; Macq, B.; Verly, J.G.; Garraux, G.; et al. Development and validation of an accelerometer-based method for quantifying gait events. Med. Eng. Phys. 2015, 37, 226–232. [Google Scholar] [CrossRef] [PubMed]
- Formento, P.C.; Acevedo, R.; Ghoussayni, S.; Ewins, D. Gait event detection during stair walking using a rate gyroscope. Sensors 2014, 14, 5470–5485. [Google Scholar] [CrossRef] [PubMed]
- Gouwanda, D.; Gopalai, A.A. A robustreal-time gaiteventdetection using wirelessgyroscope and itsapplication on normal and alteredgaits. Med. Eng. Phys. 2015, 37, 219–225. [Google Scholar] [CrossRef] [PubMed]
- Iso, T.; Yamazaki, K. Gait analyzer based on a cell phone with a single three-axis accelerometer. In Proceedings of the 8th conference on human-computer interaction with mobile devices and services, Helsinki, Finland, 12–15 September 2006; pp. 141–144. [Google Scholar]
- Jarchi, D.; Yang, G.-Z. Singular Spectrum Analysis for Gait Patterns. In Proceedings of the IEEE International Conference on Body Sensor Networks, Cambridge, MA, USA, 6–9 May 2013. [Google Scholar]
- Jarchi, D.; Pope, J.; Lee, T.K.M.; Tamjidi, L.; Mirzaei, A.; Sanei, S. A Review on Accelerometry Based Gait Analysis and Emerging Clinical Applications. IEEE Rev. Biomed. Eng. 2018, 11, 177–194. [Google Scholar] [CrossRef] [PubMed]
- Taborri, J.; Rossi, S.; Palermo, E.; Cappa, P. A HMM distributed classifier to control robotic knee module of an active orthosis. In Proceedings of the IEEE International Conference on Rehabilitation Robotics, Singapore, 11–14 August 2015. [Google Scholar]
- Mayagoitia, R.E.; Nene, A.V.; Veltink, P.H. Accelerometer and rate gyroscope measurement of kinematics: An inexpensive alternative to optical motion analysis systems. J. Biomech. 2002, 35, 537–542. [Google Scholar] [CrossRef]
- Tong, K.; Granat, M.H. A practical gait analysis system using gyroscopes. Med. Eng. Phys. 1999, 21, 87–94. [Google Scholar] [CrossRef]
- Rosenberg, L.; Kottorp, A.; Winblad, B.; Nygård, L. Perceived difficulty in everyday technology use among older adults with or without cognitive deficits. Scand. J. Occup. Ther. 2009, 16, 216–226. [Google Scholar] [CrossRef] [PubMed]
- Dang, D.C. Walking Distance Estimation Using Walking Canes with Inertial Sensors. Sensors 2018, 18, 230. [Google Scholar] [CrossRef] [PubMed]
- Sprint, G.; Member, S.; Cook, D.J.; Weeks, D.L. Quantitative Assessment of Lower Limb and Cane Movement with Wearable Inertial Sensors. In Proceedings of the IEEE-EMBS International Conference on Biomedical and health Informatics, Las Vegas, NV, USA, 24–27 February 2016; pp. 418–421. [Google Scholar]
- Culmer, P.R.; Brooks, P.C.; Strauss, D.N.; Ross, D.H.; Levesley, M.C.; Connor, R.J.O.; Bhakta, B.B. An Instrumented Walking Aid to Assess and Retrain Gait. IEEE/ASME Trans. Mechatron. 2014, 19, 141–148. [Google Scholar] [CrossRef]
- Boyles, R.W. Mechanical Design of an Instrumented Cane for Gait Prediction by Physical Therapists. Master’s Thesis, Vanderbilt University, Nashville, TN, USA, December 2015. [Google Scholar]
- Wu, W.; Au, L.; Jordan, B.; Stathopoulos, T.; Batalin, M.; Kaiser, W.; Vahdatpour, A.; Sarrafzadeh, M.; Fang, M.; Chodosh, J. The SmartCane System: An Assistive Device for Geriatrics. In Proceedings of the ICST 3rd International Conference on Body Area Networks, Tempa, AZ, USA, 13–17 March 2008. [Google Scholar]
- Jiang, S.; Wang, X.; Kyrarini, M.; Gräser, A. A Robust Algorithm for Gait Cycle Segmentation. In Proceedings of the IEEE 25th European Signal Processing Conference, Kos, Greece, 28 August–2 September 2017; pp. 31–35. [Google Scholar]
- Ying, H.; Silex, C.; Schnitzer, A.; Leonhardt, S.; Schiek, M. Automatic Step Detection in the Accelerometer Signal. In Proceedings of the 4th International Workshop on Wearable and implantable Body Sensor Networks, Aachen, Germany, 26–28 March 2007; pp. 80–85. [Google Scholar]
- Wang, K.; Delbaere, K.; Brodie, M.A.D.; Lovell, N.H.; Kark, L.; Lord, S.R.; Redmond, S.J.; Member, S. Differences Between Gait on Stairs and Flat Surfaces in Relation to Fall Risk and Future Falls. IEEE J. Biomed. Health Inform. 2017, 21, 1479–1486. [Google Scholar] [CrossRef] [PubMed]
- Panahandeh, G.; Mohammadiha, N.; Leijon, A.; Handel, P. Continuous hidden markov model for pedestrian activity classification and gait analysis. IEEE Trans. Instrum. Meas. 2013, 62, 1073–1083. [Google Scholar] [CrossRef]
- Sekine, M.; Tamura, T.; Akay, M.; Fujimoto, T.; Togawa, T.; Fukui, Y. Discrimination of walking patterns using wavelet-based fractal analysis. IEEE Trans. Neural Syst. Rehabil. Eng. 2002, 10, 188–196. [Google Scholar] [CrossRef] [PubMed]
- Barth, J.; Oberndorfer, C.; Pasluosta, C.; Schülein, S.; Gassner, H.; Reinfelder, S.; Kugler, P.; Schuldhaus, D.; Winkler, J.; Klucken, J.; et al. Stride segmentation during free walk movements using multi-dimensional subsequence dynamic time warping on inertial sensor data. Sensors 2015, 15, 6419–6440. [Google Scholar] [CrossRef] [PubMed]
- Wu, Y.; Cai, S.; Lu, M.; Zhong, Z.; He, J.; Zheng, F.; Xu, F.; Shi, L.; Xia, C. A Gait Cadence Measurement Method Based on Match Filter and Turns Detection for Human Locomotion Monitoring. In Proceedings of the IEEE-EMBS International Conference on Biomedical and Health Informatics, Hong Kong, China, 5–7 January 2012; pp. 1–4. [Google Scholar]
- Hausdorff, J.M.; Schaafsma, J.D.; Balash, Y.; Bartels, A.L.; Gurevich, T.; Giladi, N. Impaired regulation of stride variability in Parkinson’s disease subjects with freezing of gait. Exp. Brain Res. 2003, 149, 187–194. [Google Scholar] [CrossRef] [PubMed]
- Kumar, R.; Roe, M.C.; Scremin, O.U. Methods for estimating the proper length of a cane. Arch. Phys. Med. Rehabil. 1995, 76, 1173–1175. [Google Scholar] [CrossRef]
- Agostini, V.; Balestra, G.; Knaflitz, M. Segmentation and Classification of Gait Cycles. IEEE Trans. Neural Syst. Rehabil. Eng. 2014, 22, 946–952. [Google Scholar] [CrossRef] [PubMed]


| Condition | Detail |
|---|---|
| Flat Surface | 52 m on a flat surface |
| Upstairs | up 1 flight of stairs (20 steps) |
| Downstairs | down 1 flight of stairs (20 steps) |
| Flat-Upstairs-Flat | 26 m on a flat surface, up 1 flight of stairs (20 steps), and another 26 m on a flat surface |
| Flat-Downstairs-Flat | 26 m on a flat surface, down 1 flight of stairs (20 steps), and another 26 m on a flat surface |
| Uphill | 78 m on a paved sidewalk, uphill |
| Downhill | 78 m on a paved sidewalk, downhill |
| Abbreviation | Detail |
|---|---|
| MSMF | The proposed multi-sensor matched filter algorithm |
| GPD | Gyroscope peak detection algorithm |
| GPD-O | Gyroscope peak detection algorithm (a specific optimal threshold selected per participant and per terrain) |
| GPD-IFS | Gyroscope peak detection algorithm (individual flat surface threshold—an optimal threshold calculated specifically from a flat surface walk for each individual participant) |
| GPD-UFS | Gyroscope peak detection algorithm (universal flat surface threshold—a mean threshold from flat surface walking across all participants) |
| GPD-U | Gyroscope peak detection algorithm (universal threshold—a single mean threshold from all terrains from all participants) |
| True Positive | False Positive | |
|---|---|---|
| MSMF vs. GPD-O | p = 0.4 | p < 0.001 |
| MSMF vs. GPD-IFS | p < 0.001 | p < 0.001 |
| MSMF vs. GPD-UFS | p < 0.001 | p < 0.001 |
| MSMF vs. GPD-U | p < 0.001 | p < 0.001 |
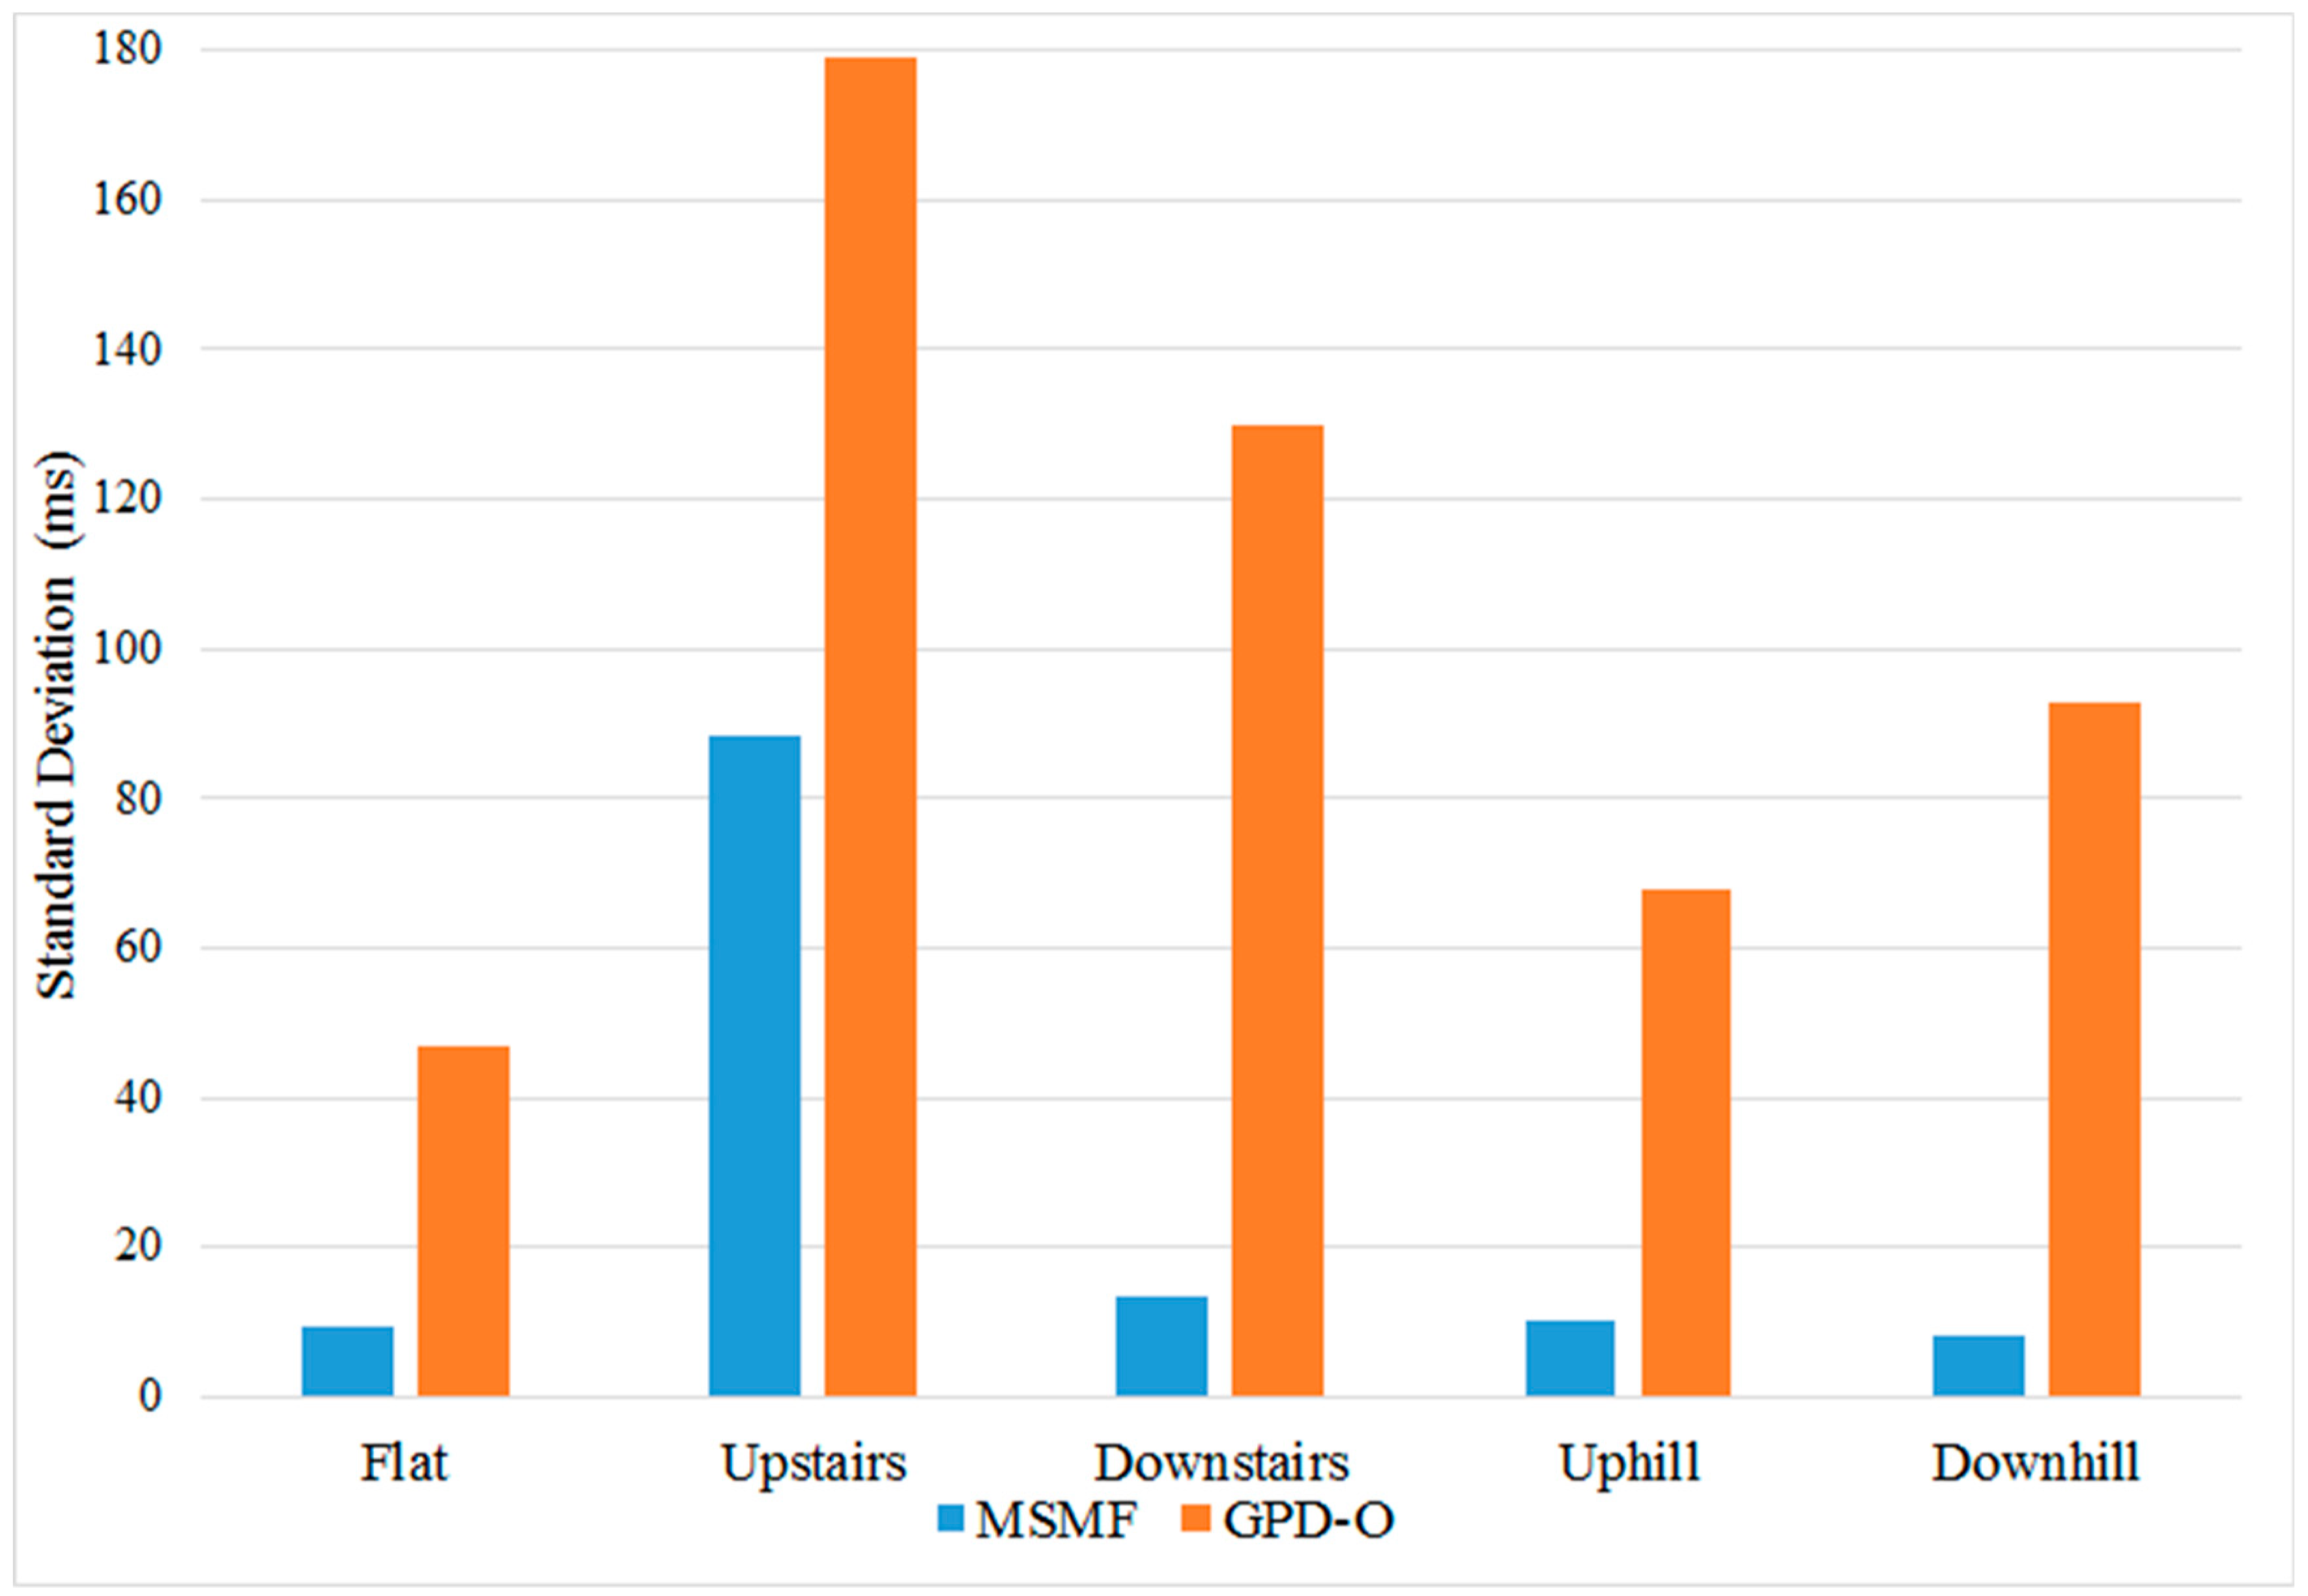
| Flat Surface (Mean ± SD) | Upstairs (Mean ± SD) | Downstairs (Mean ± SD) | Uphill (Mean ± SD) | Downhill (Mean ± SD) | |
|---|---|---|---|---|---|
| MSMF | 10.1 ± 9.2 | 72.1 ± 88.3 | 36.7 ± 13.5 | 8.8 ± 10.3 | 11.4 ± 8 |
| GPD-O | −41.6 ± 46.8 | 32.1 ± 179.1 | 99.7 ± 129.8 | −38.9 ± 67.9 | −34.9 ± 92.9 |
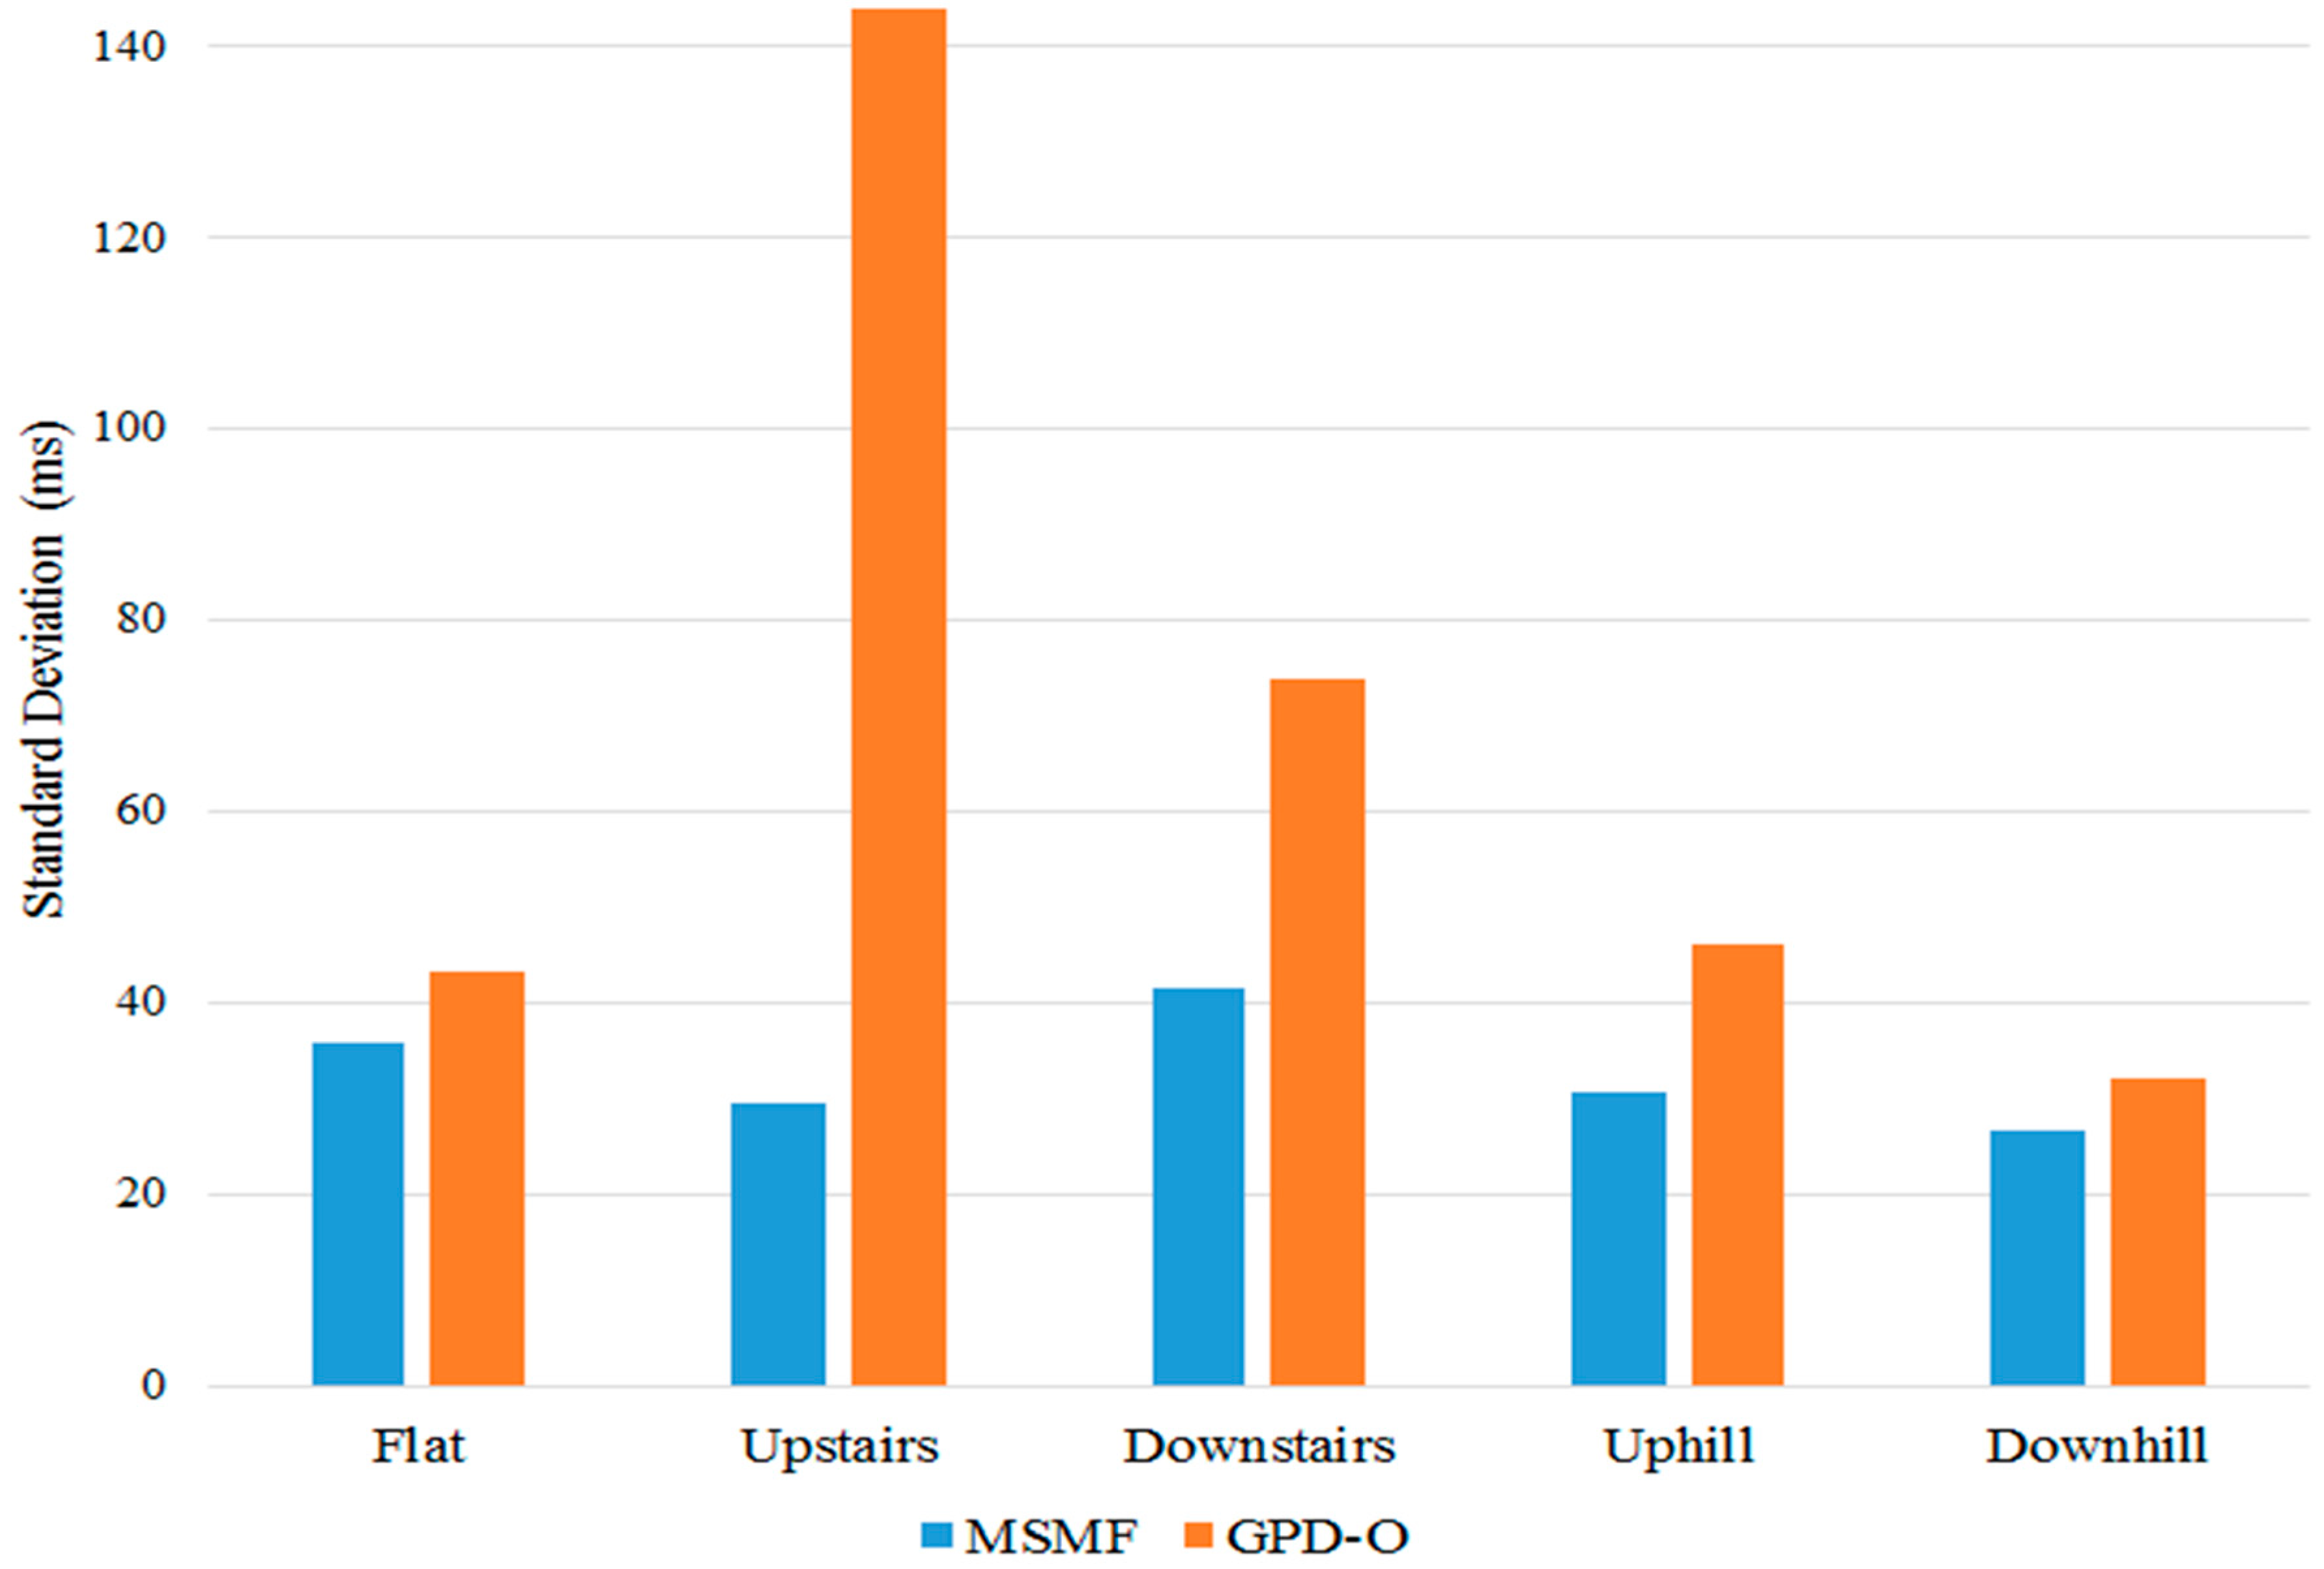
| Flat Surface (mean ± SD) | Upstairs (mean ± SD) | Downstairs (mean ± SD) | Uphill (mean ± SD) | Downhill (mean ± SD) | |
|---|---|---|---|---|---|
| MSMF | −45.2 ± 35.7 | −9.3 ± 29.5 | −71.2 ± 41.6 | −20.6 ± 30.7 | −35.6 ± 26.7 |
| GPD-O | 42.2 ± 43.2 | −108.8 ± 144 | 1.92 ± 73.7 | 37.7 ± 46.1 | 64.7 ± 32 |
© 2018 by the authors. Licensee MDPI, Basel, Switzerland. This article is an open access article distributed under the terms and conditions of the Creative Commons Attribution (CC BY) license (http://creativecommons.org/licenses/by/4.0/).
Share and Cite
Gill, S.; Seth, N.; Scheme, E. A Multi-Sensor Matched Filter Approach to Robust Segmentation of Assisted Gait. Sensors 2018, 18, 2970. https://doi.org/10.3390/s18092970
Gill S, Seth N, Scheme E. A Multi-Sensor Matched Filter Approach to Robust Segmentation of Assisted Gait. Sensors. 2018; 18(9):2970. https://doi.org/10.3390/s18092970
Chicago/Turabian StyleGill, Satinder, Nitin Seth, and Erik Scheme. 2018. "A Multi-Sensor Matched Filter Approach to Robust Segmentation of Assisted Gait" Sensors 18, no. 9: 2970. https://doi.org/10.3390/s18092970
APA StyleGill, S., Seth, N., & Scheme, E. (2018). A Multi-Sensor Matched Filter Approach to Robust Segmentation of Assisted Gait. Sensors, 18(9), 2970. https://doi.org/10.3390/s18092970