Simple and Label-Free Fluorescent Detection of Melamine Based on Melamine–Thymine Recognition

1
Edible and Medicinal Fungi Research Center, Yangtze University, Jingzhou 434025, China
2
College of Life Science, Yangtze University, Jingzhou 434025, China
*
Author to whom correspondence should be addressed.
Sensors 2018, 18(9), 2968; https://doi.org/10.3390/s18092968
Submission received: 31 July 2018
/
Revised: 28 August 2018
/
Accepted: 2 September 2018
/
Published: 6 September 2018
(This article belongs to the Special Issue Label-Free Biosensors)
Abstract
:In the past few years, melamine has been illegally added into dairy products to increase the apparent crude protein levels. If humans or animals drink the milk adulteration of melamine, it can form insoluble melamine–cyanurate crystals in their kidneys which causes kidney damage or even death. In the present work, we constructed a simple and label-free fluorescent method for melamine detection based on melamine-thymine recognition. SYBR Green I was utilized as a reporter for this method as it did not require any modification or expensive equipment. In the absence of melamine, polythymine DNA was digested by Exo I, which caused a decrease in the fluorescence signal. In the presence of melamine, the polythymine DNA was able to fold into a double chain structure, however this was done with the help of T-melamine-T mismatches to prevent degradation. Then, the SYBR Green I combined with the double-stranded DNA to result in an intense fluorescence signal. The limit of detection in this method was 1.58 μM, which satisfied the FDA standards. This method also had a good linear relationship within the range of 10–200 μM. In addition, this new method has a good selectivity to distinguish melamine from the component of milk. As a result, we developed a simple and highly selectivity method for melamine detection.
1. Introduction
Melamine (2,4,6-triamino-1,3,5-triazine) is a small organic compound widely used in the production of plastics, fertilizer, resins and other products [1,2]. In the past few years, melamine has been illegally added into dairy products to increase the apparent crude protein levels. This is because the standard method for protein level in food is the Kjeldahl method, which is done by measuring nitrogen content, and the nitrogen content of melamine (66% by mass) is much higher than protein (~16%). If humans or animals drink the milk adulteration of melamine, it can form insoluble melamine–cyanurate crystals in their kidneys which causes kidney damage or even death [3,4,5]. In 2008, melamine caused several infant deaths and thousands of people had kidney failures in China [6,7]. As a result, many countries have formulated regulations on the maximum content limits of melamine in food, especially milk products. The Federal Food and Drug Administration (FDA) has defined a limitation of melamine as 2.5 ppm (19.8 μM) for non-infant products and 1 ppm (7.9 μM) for infant milk products [8,9]. Therefore, sensitive and selective detection melamine is very important for people’s health.
Thus far, many methods and techniques have been designed to detect melamine [10]. Traditional melamine detection methods include high performance liquid chromatography (HPLC) [11], gas chromatography-mass spectrometry (GC-MS) [12], liquid chromatography-mass spectrometry (LC-MS) [13] and capillary electrophoresis (CE) [14]. These instrumental analytical methods can achieve high sensitivity and selectivity. However, expensive instrumentation, skilled manpower, and complex sample pretreatment are usually required, which greatly limit their utility in routine melamine determination. Recently, a number of detection methods have been developed to detect melamine based on gold nanoparticles [15,16,17,18], electrochemical signal [19,20], and immunoassay approaches [21,22] to overcome the above-mentioned problems. However, synthesis or modification of gold nanoparticles and electrode are often tedious and costly. Moreover, melamine being a semi-antigenic substance makes preparation of specific antibodies a difficult process. Thus, it is essential to design a simple, convenient and sensitive strategy for melamine determination.
Recently, some papers have reported that melamine can form T-melamine-T mismatches in oligonucleotides by triple hydrogen bonding with thymine base [23,24,25,26]. Furthermore, SYBR Green I can exhibit a dramatic enhancement upon binding to double-stranded DNA [27,28]. In addition, Exonuclease I (Exo I) is a single strand exonuclease which catalyzes the removal of nucleotides from single-stranded DNA in the 3′ to 5′ direction [29,30]. Inspired by these reports, we proposed a simple and label-free fluorescent detection of melamine that could be developed by the combination of T-melamine-T mismatches, SYBR Green I and Exo I.
2. Materials and Methods
2.1. Materials
The synthetic oligonucleotides DNA purified by PAGE was obtained from Shanghai Sangon Biological Engineering Technology & Services Co., Ltd. (Shanghai, China). SYBR Green I was purchased from Solarbio Science & Technology Co., Ltd. (Beijing, China). Melamine, lactose, glucose, sucrose, CaCl2, CuCl2, FeCl3, KCl, MgCl2, MnCl2, vitamin B2 and vitamin C were purchased from Sinopharm Chemical Reagent Co., Ltd. (Beijing, China). Exonuclease I was purchased from Takara Biotechnology Co. Ltd. (Dalian, China). All chemicals were analytical reagent. The water used was purified by Millipore (Burlington, MA, USA) Milli-Q (18 MΩ/cm). Stock solution of oligonucleotides (100 μM) was prepared by deionized water. Before used, the oligonucleotides solution was diluted to the required concentration with deionized water.
2.2. Fluorometric Analysis
All fluorescence measurements were performed on a F-7000 spectrometer (Hitachi, Tokyo, Japan). The instrument settings were as follows: λEX = 495 nm (bandpass 5 nm), λEM from 505 nm to 700 nm (bandpass 5 nm) and the photomultiplier tube (PMT) detector voltage = 500 V.
The sensitivity of this method was performed as follows. First, different concentrations of melamine were added into 1× Exo I buffer containing 500 nM polythymine DNA. Then, the mixture was incubated at 37 °C for 2 h to ensure that DNA and melamine were fully bind. Second, 2.5 U Exo I was added and incubated at 37 °C for 0.5 h, then it was heated up to 80 °C for 15 min to deactivate Exo I. Finally, 1× SYBR Green I was added and incubated at room temperature for 20 min, before the fluorescence measurements were taken. The fluorescence signal change was calculated with the formula Y = F/F0, where F0 and F were the area under curve of the emission spectra in the absence and presence of melamine, respectively.
The selectivity of this method was performed using the same procedure as in the sensitivity test, in the presence 40 μM melamine and 400 μM interfering materials.
2.3. Detection of Melamine in Milk Sample
Raw milk samples were pretreated before detection. First, 5 mL of raw milk was placed into a 50 mL centrifuge tube and 15 mL trichloroacetic acid was added. Second, the solution was mixed with a vortex for 10 min and centrifuged at 4500 r/min for 10 min to deposit protein. Third, the supernatant was collected and adjusted to pH 7.0 by 6 M NaOH. Finally, the supernatant was filtered into a new centrifuge tube through a 0.22 µm membrane. The obtained solution was used for detection according to the method in Section 2.2.
3. Results
3.1. Detection Principle
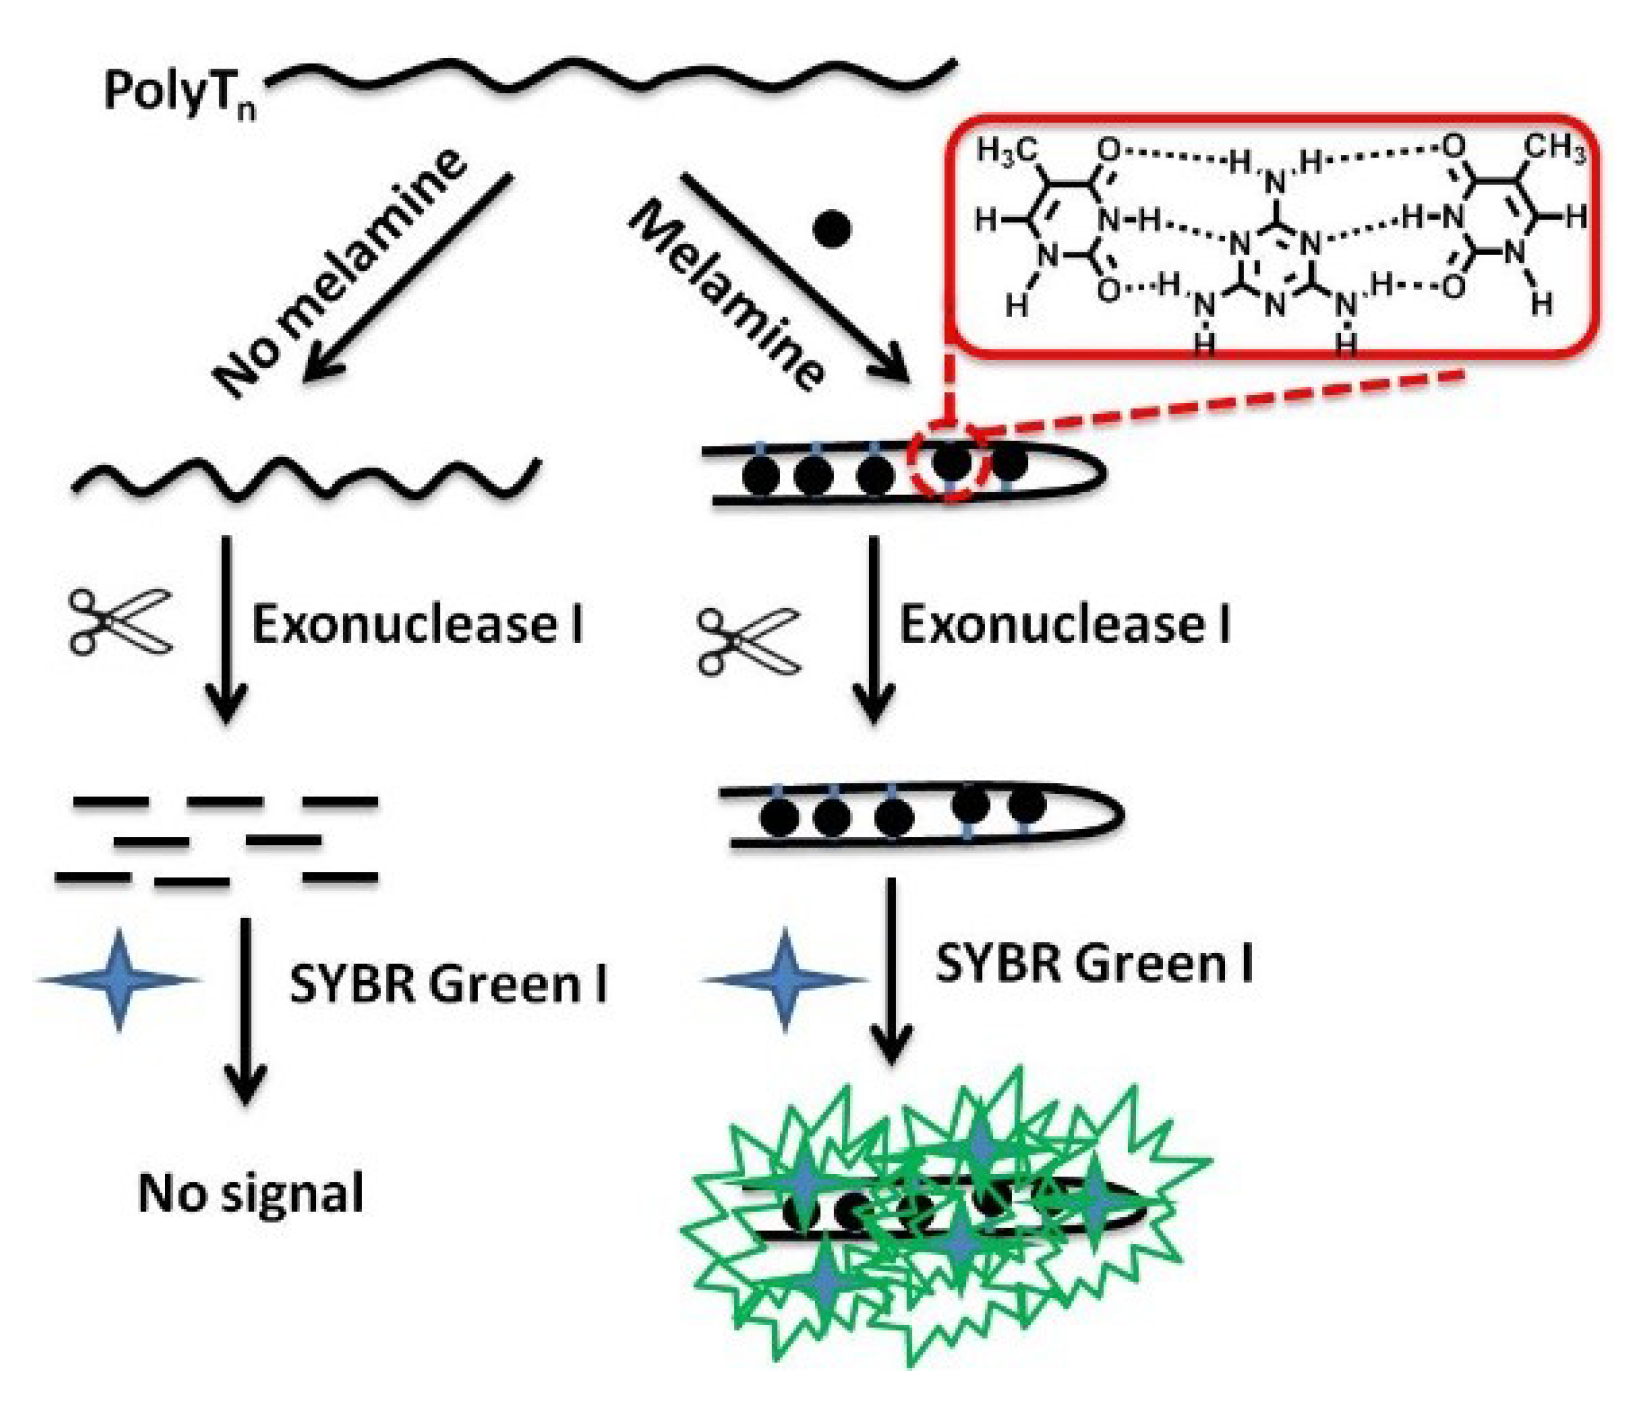
The principle of the proposed strategy for melamine detection was illustrated in Figure 1. First, polythymine DNA was designed. In the absence of melamine, polythymine DNA was digested by Exo I because it existed as a single strand of DNA. When the SYBR Green I was added, no fluorescent signals were detected. In the presence of melamine, the polythymine DNA could fold into a double chain structure, however T-melamine-T mismatches was used prevent degradation. Then, the SYBR Green I combined with the double-stranded DNA to result in an intense fluorescence signal.
3.2. Optimize the Length of Polythymine DNA
In the first place, different length polythymine DNA (polyT8, polyT24, polyT32, polyT36, polyT40) were initially screened by comparison the fluorescence signal change (F/F0) (Figure 2). F and F0 were the area under curve of the emission spectra in the presence and absence of melamine, respectively. This signal change gradually increased with the length of the DNA up to 36 T. Then, F/F0 had a slight fall as the DNA length increased to 40 T. So, polyT36 was selected so as to guarantee better effect of measurement and save some cost.
3.3. The Sensitivity of Our Proposed Strategy
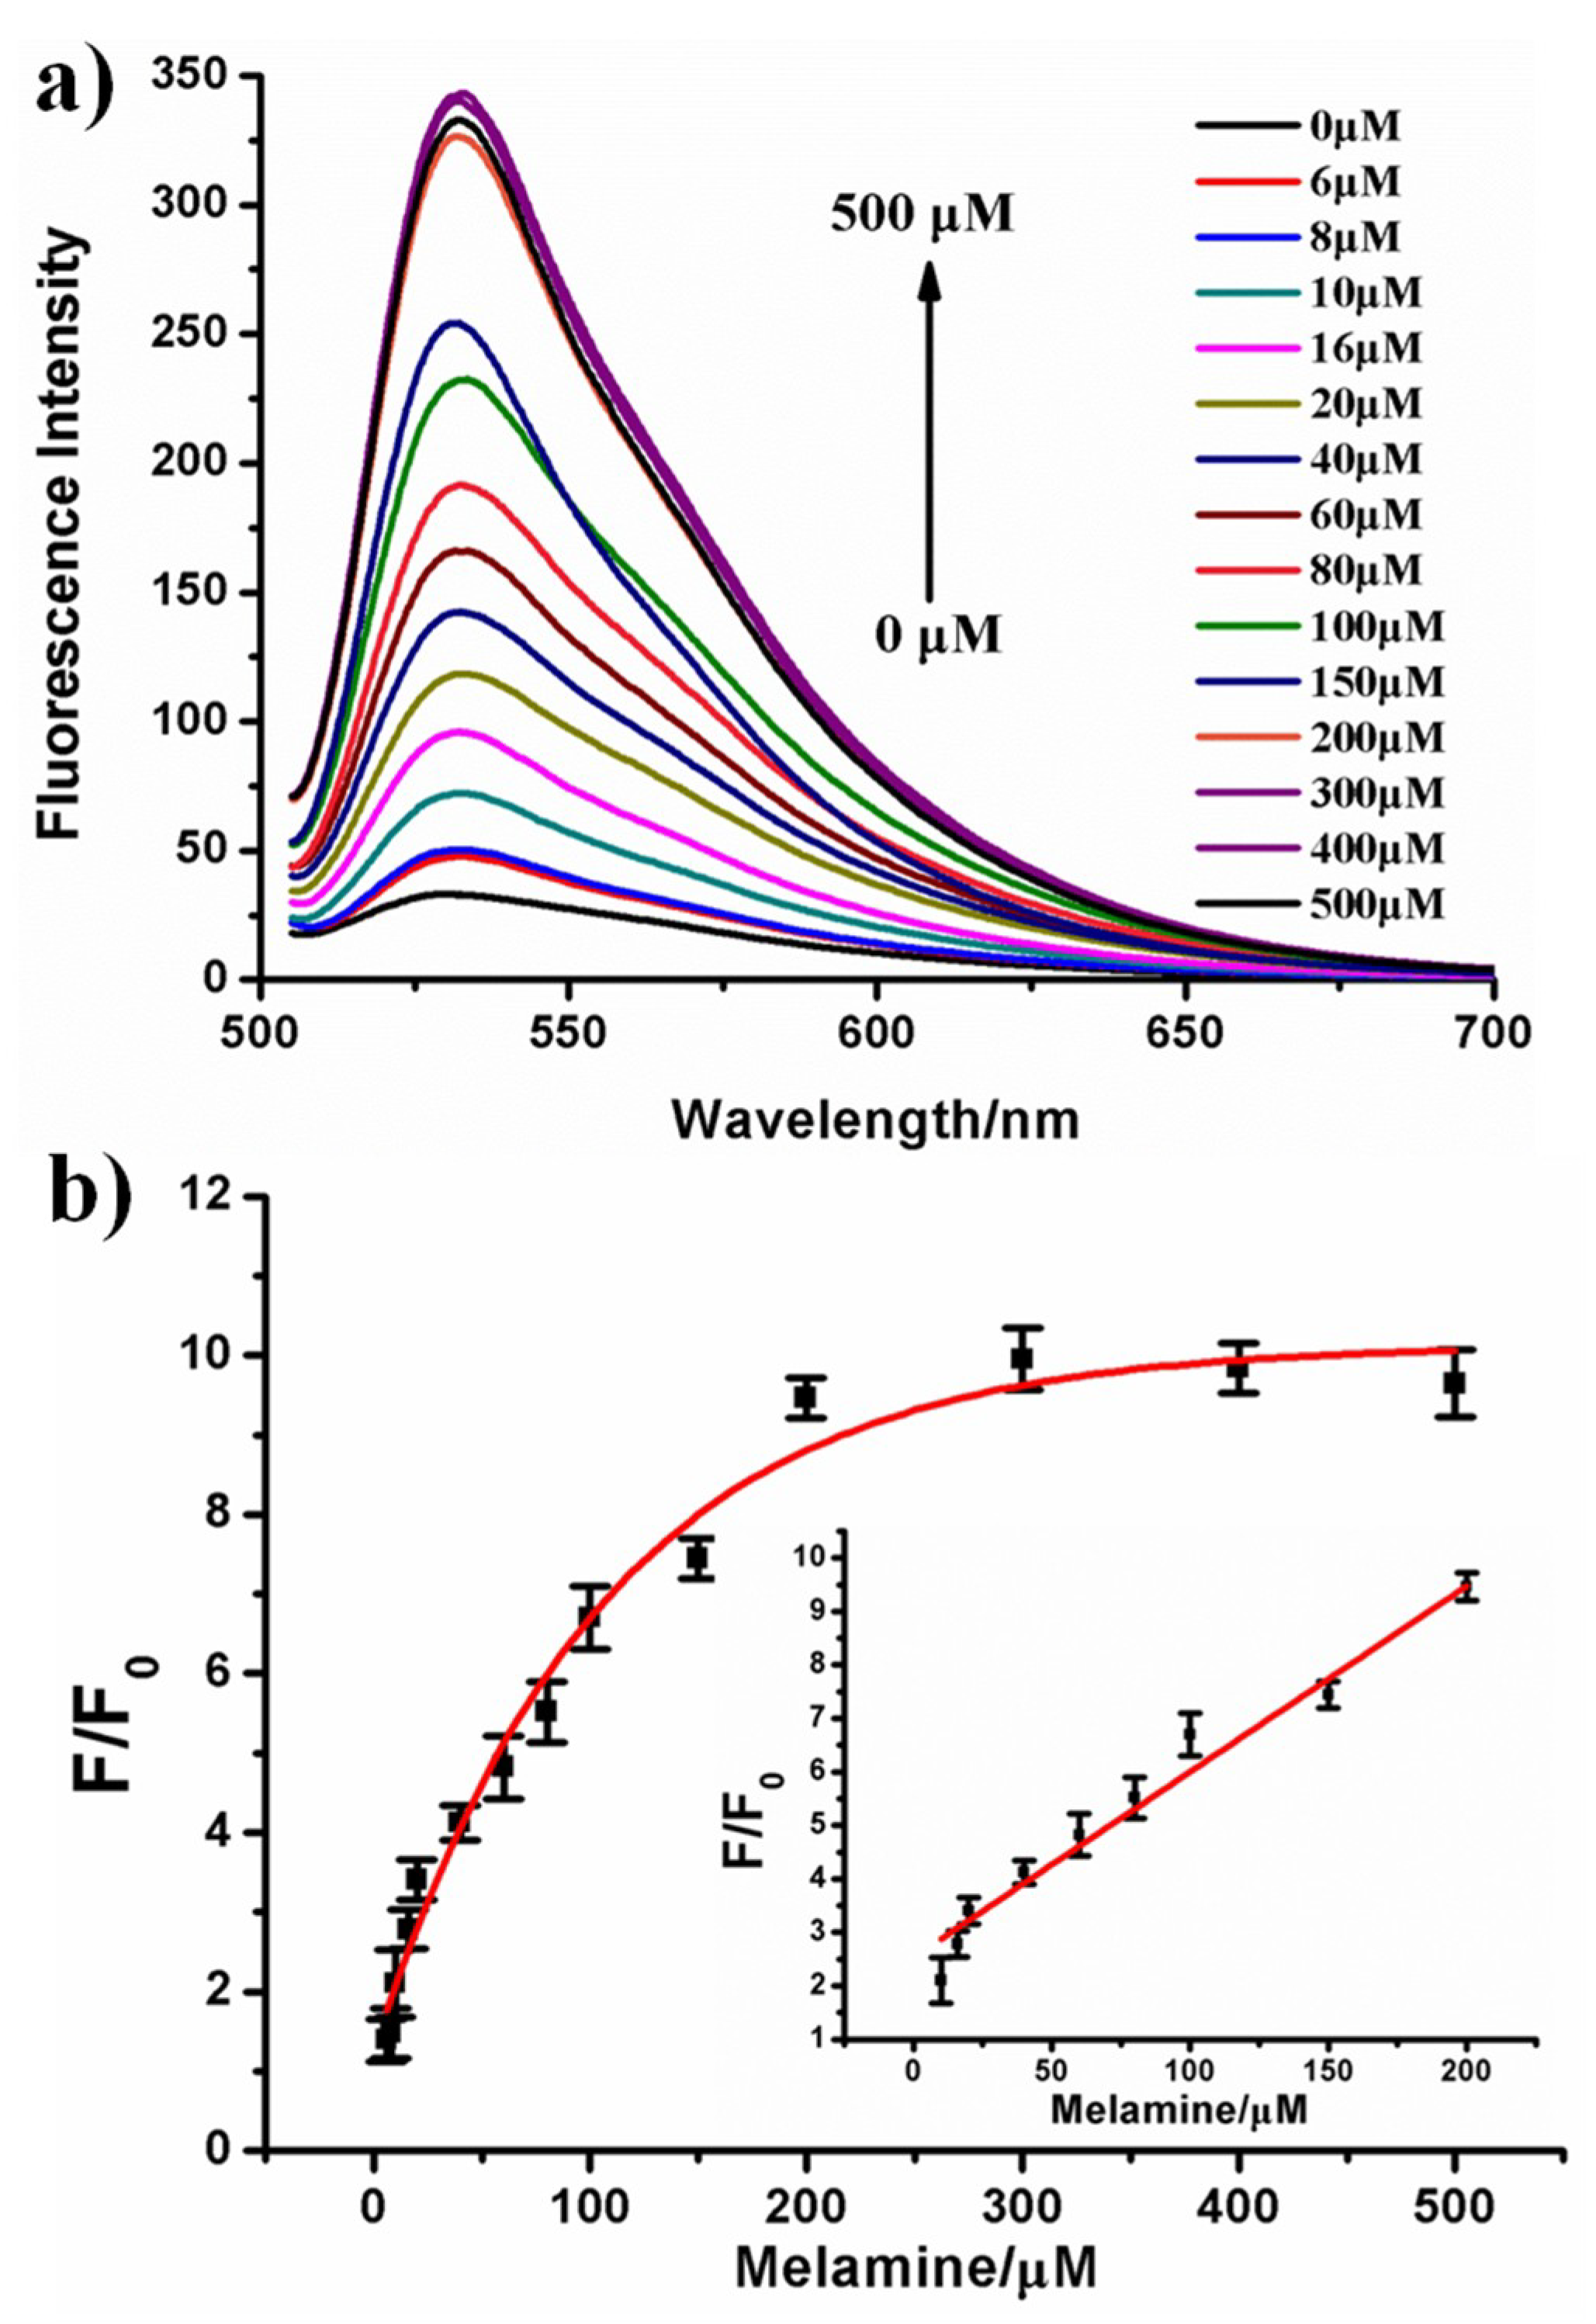
Subsequently, the sensitivity of the proposed strategy was measured using different concentrations of melamine. As shown in Figure 3a, with the increase in concentration of melamine, the fluorescence signal intensity also gradually increased. Even at 6 μM melamine concentration, the fluorescence signal change was still clearly observed to increase from 32.7 to 45.6. This concentration (6 μM) was lower than the maximum safety limit in infant milk products (7.9 μM) set by the FDA. With the melamine concentration increased to 200 μM, the fluorescence signal had a 9.5-fold increase (from 32.7 to 309.8). This result indicated that double stranded DNA structure was highly associated with the concentration of melamine. Then, the signal change (F/F0) were studied in the presence of varying melamine concentrations (Figure 3b). The results showed that the calibration curve matched the dose-response curve (R2 = 0.976). In addition, the signal change (F/F0) exhibited a linear correlation within the melamine concentration range from 10 to 200 μM. The regression equation was Y = 2.5308 + 0.0347X (R2 = 0.978), where Y and X represented the signal change (F/F0) and the concentration of melamine, respectively (inset in Figure 3b). The limit of detection (LOD) was estimated to be 1.58 μM, this was based on 3 times the standard deviation of a blank response. Such a limit was lower than the maximum safety limit set by the FDA for non-infant-formula products (19.8 μM).
3.4. The Selectivity of Our Proposed Strategy
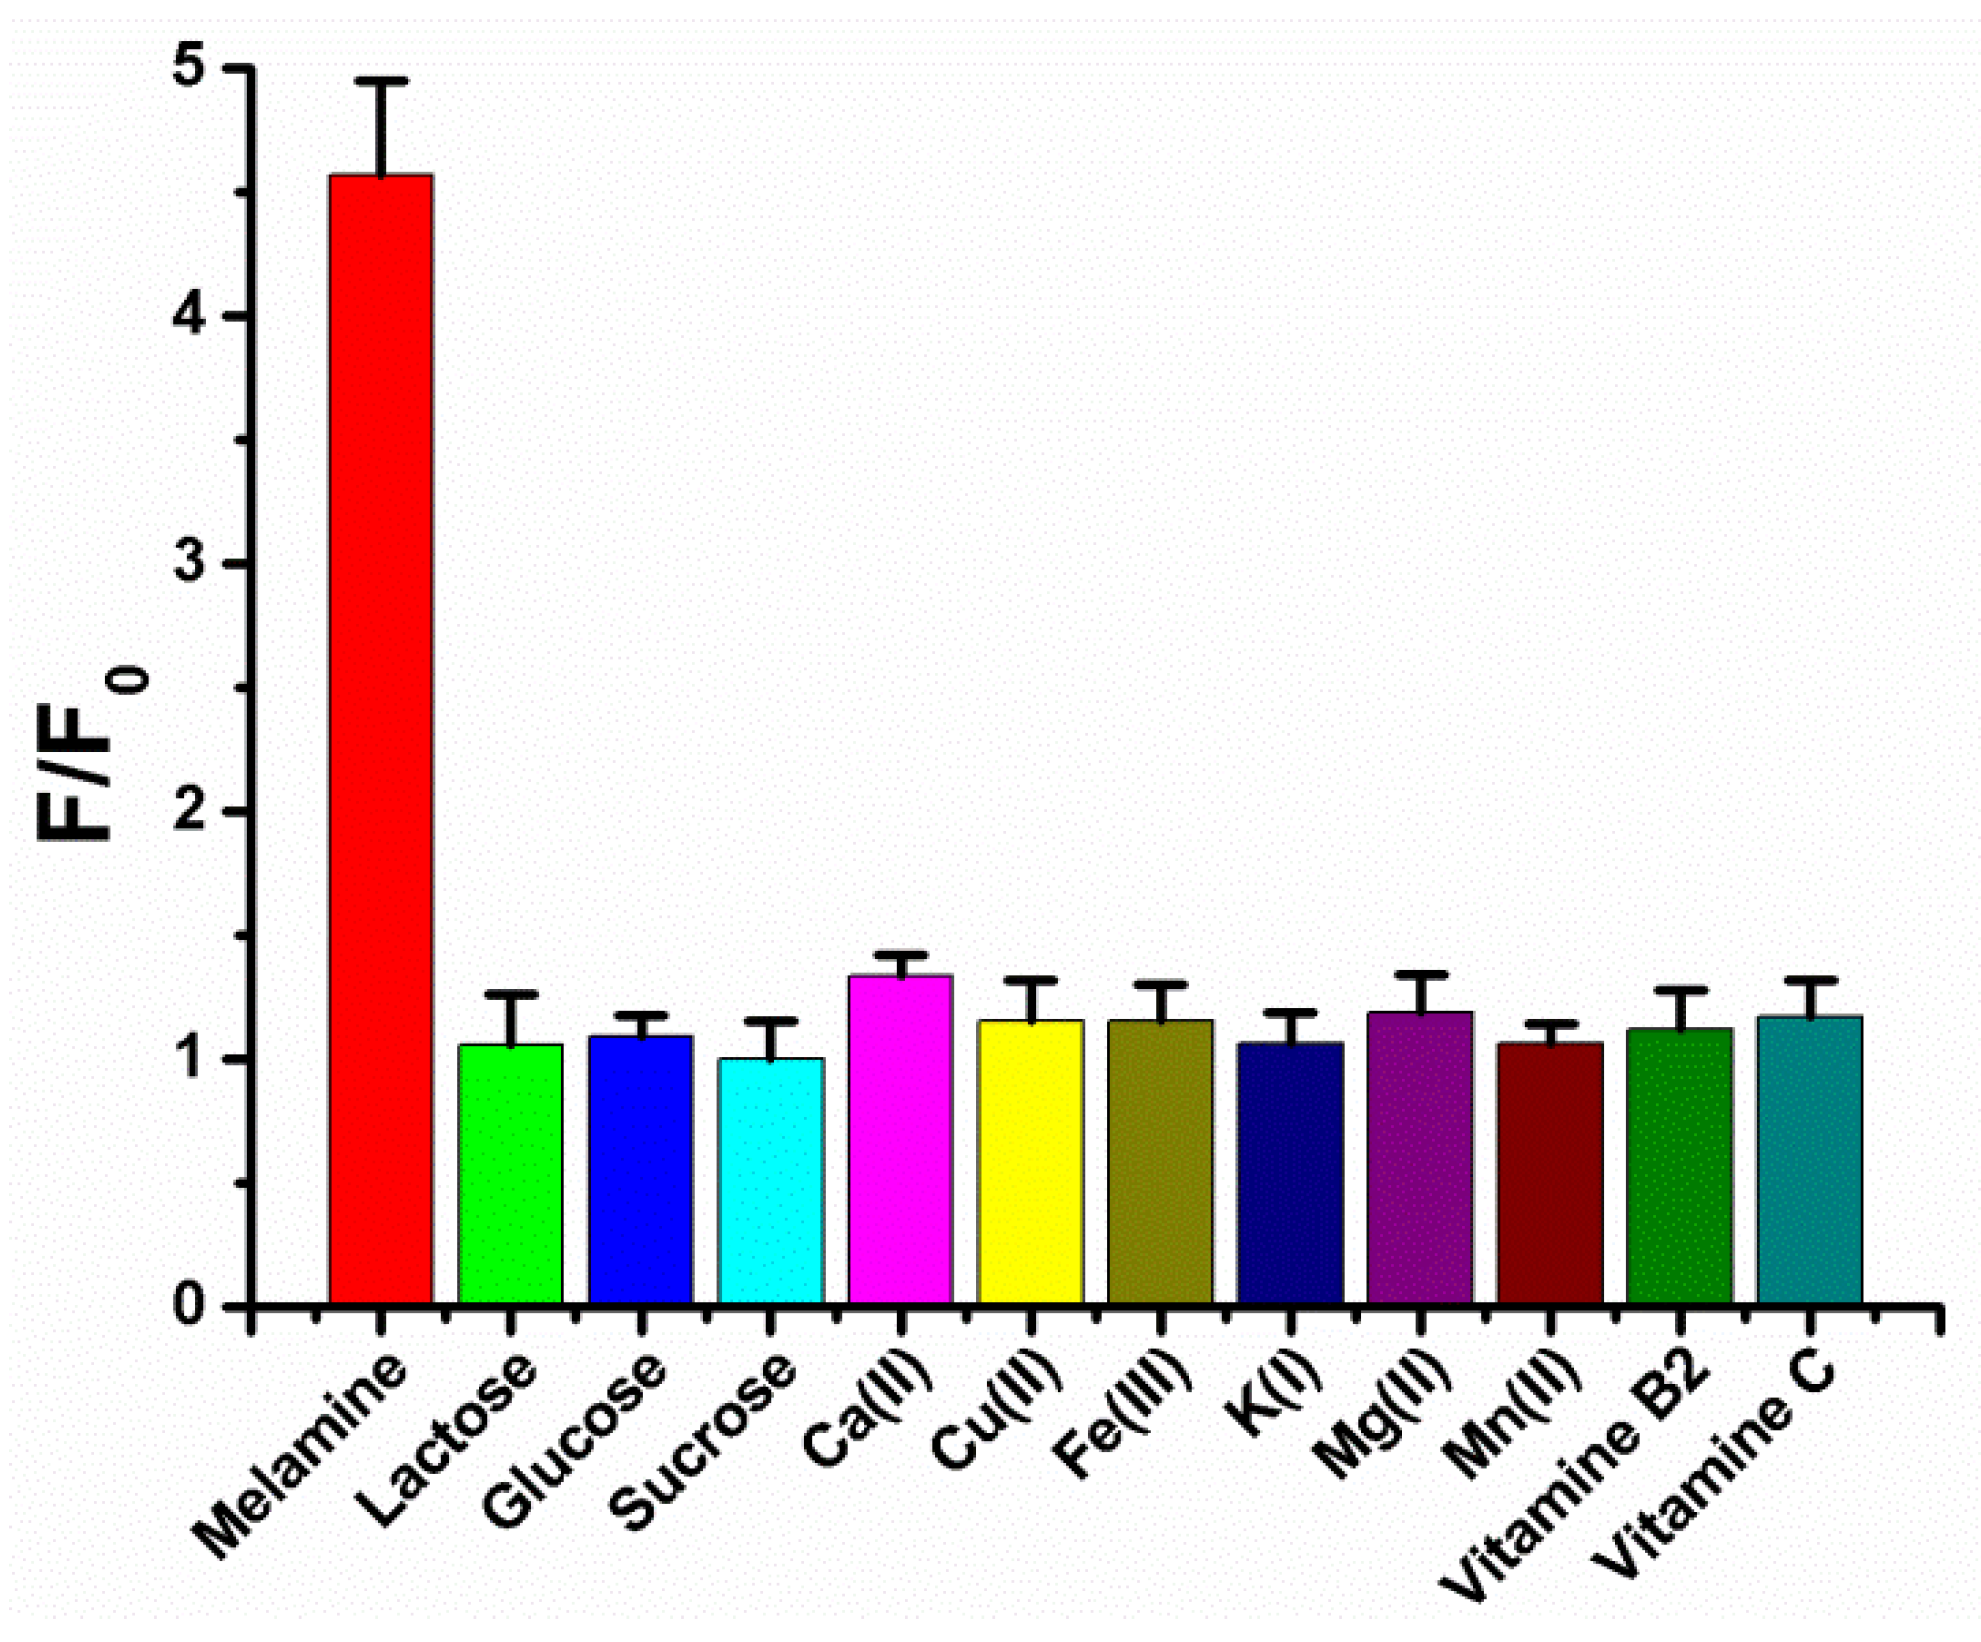
Additionally, the interference of the component of milk was an important factor used to consider if the new method can be used to determine melamine in whole milk. The selectivity of our proposed strategy was evaluated in the presence of lactose, glucose, sucrose, Ca2+, Cu2+, Fe3+, K+, Mg2+, Mn2+, vitamin B2 and vitamin C. The result in Figure 4 showed that melamine exhibited the highest signal change (F/F0) and interfering materials were almost negligible even if the concentrations were 10 times higher than melamine. We conclude that there was only weak affinity between interfering materials and polythymine DNA by few or no hydrogen bond formation. These results show that the strategy had a good selectivity towards melamine. This result was also consistent with other reported methods [16,23] which was based on melamine–thymine recognition to detect melamine.
3.5. The Real Sample Analysis in Milk Samples
With the ideal sensitivity and selectivity, the applicability of this method to real milk samples was examined. Because the melamine-milk sample was not obtained in hand, we took the spiked milk to evaluate the reliability as other papers [15,16,18,26]. Standard addition method was used on three standard milk samples and the final melamine concentrations were obtained as 20, 80, 150 μM. After the pretreatment of milk samples, the concentrations of melamine were detected using the proposed method. The experimental results are shown in Table 1 and the recovery of our method ranged in between 99.17–109.75%. These results clearly revealed that the proposed approach might have a potential practical application to measure the melamine in raw milk samples.
4. Conclusions
In the present work, we developed a simple and label-free fluorescent method for melamine detection based on melamine-thymine recognition. SYBR Green I was utilized as a reporter for this method as it did not require any modification or expensive equipment. The limit of detection in our method was 1.58 μM, which satisfied the FDA standards. In addition, this method had a good selectivity to distinguish melamine from the component of milk. As a result, the method has great potential to be applied in bioanalytical researches and food safety detection.
Author Contributions
H.Y. performed most of the experiments; B.D. conceived and designed the experiments; J.W. analyzed the data; Y.W. and L.L. contributed reagents/materials/analysis tools; H.Y. and Q.W. wrote the paper.
Acknowledgments
The research was supported by the Science and Technology Research Project from Hubei Provincial Education Department (Q20181321), the Yangtze Fund for Youth Teams of Science and Technology Innovation (2016cqt02).
Conflicts of Interest
The authors declare no conflict of interest.
References
- Chan, E.Y.; Griffiths, S.M.; Chan, C.W. Public-health risks of melamine in milk products. Lancet 2008, 372, 1444–1445. [Google Scholar] [CrossRef]
- Fodey, T.L.; Thompson, C.S.; Traynor, I.M.; Haughey, S.A.; Kennedy, D.G.; Crooks, S.R.H. Development of an Optical Biosensor Based Immunoassay to Screen Infant Formula Milk Samples for Adulteration with Melamine. Anal. Chem. 2011, 83, 5012–5016. [Google Scholar] [CrossRef] [PubMed]
- Sun, J.R.; Zhang, X.C.; Cao, Y.N.; Zhao, Q.L.; Bao, E.D.; Lv, Y.J. Ovarian Toxicity in Female Rats after Oral Administration of Melamine or Melamine and Cyanuric Acid. PLoS ONE 2016, 11, e0149063. [Google Scholar] [CrossRef] [PubMed]
- Dalal, R.P.; Goldfarb, D.S. Melamine-related kidney stones and renal toxicity. Nat. Rev. Nephrol. 2011, 7, 267–274. [Google Scholar] [CrossRef] [PubMed]
- Chen, K.C.; Liao, C.W.; Cheng, F.P.; Chou, C.C.; Chang, S.C.; Wu, J.H.; Zen, J.M.; Chen, Y.T.; Liao, J.W. Evaluation of Subchronic Toxicity of Pet Food Contaminated with Melamine and Cyanuric Acid in Rats. Toxicol. Pathol. 2009, 37, 959–968. [Google Scholar] [CrossRef] [PubMed] [Green Version]
- Ingelfinger, J.R. Melamine and the global implications of food contamination. N. Engl. J. Med. 2008, 359, 2745–2748. [Google Scholar] [CrossRef] [PubMed]
- Mauer, L.J.; Chernyshova, A.A.; Hiatt, A.; Deering, A.; Davis, R. Melamine detection in infant formula powder using near- and mid-infrared spectroscopy. J. Agric. Food Chem. 2009, 57, 3974–3980. [Google Scholar] [CrossRef] [PubMed]
- Gu, C.M.; Lan, T.; Shi, H.C.; Lu, Y. Portable Detection of Melamine in Milk Using a Personal Glucose Meter Based on an in Vitro Selected Structure-Switching Aptamer. Anal. Chem. 2015, 87, 7676–7682. [Google Scholar] [CrossRef] [PubMed]
- Gu, C.M.; Xiang, Y.; Guo, H.L.; Shi, H.C. Label-free fluorescence detection of melamine with a truncated aptamer. Analyst 2016, 141, 4511–4517. [Google Scholar] [CrossRef] [PubMed]
- Rovina, K.; Siddiquee, S. A review of recent advances in melamine detection techniques. J. Food Compos. Anal. 2015, 43, 25–38. [Google Scholar] [CrossRef]
- Ehling, S.; Tefera, S.; Ho, I.P. High-performance liquid chromatographic method for the simultaneous detection of the adulteration of cereal flours with melamine and related triazine by-products ammeline, ammelide, and cyanuric acid. Food Addit. Contam. 2007, 24, 1319–1325. [Google Scholar] [CrossRef] [PubMed]
- Miao, H.; Fan, S.; Wu, Y.N.; Zhang, L.; Zhou, P.P.; Li, J.G.; Chen, H.J.; Zhao, Y.F. Simultaneous determination of melamine, ammelide, ammeline, and cyanuric acid in milk and milk products by gas chromatography-tandem mass spectrometry. Biomed. Environ. Sci. 2009, 22, 87–94. [Google Scholar] [CrossRef]
- Chang, C.Y.; Liao, H.K.; Juo, C.G.; Chen, S.H.; Chen, Y.J. Improved analysis of membrane protein by PVDF-aided, matrix-assisted laser desorption/ionization mass spectrometry. Anal. Chim. Acta 2006, 556, 237–246. [Google Scholar] [CrossRef] [PubMed]
- Cook, H.A.; Klampfl, C.W.; Buchberger, W. Analysis of melamine resins by capillary zone electrophoresis with electrospray ionization-mass spectrometric detection. Electrophoresis 2005, 26, 1576–1583. [Google Scholar] [CrossRef] [PubMed]
- Li, L.; Li, B.X.; Cheng, D.; Mao, L.H. Visual detection of melamine in raw milk using gold nanoparticles as colorimetric probe. Food Chem. 2010, 122, 895–900. [Google Scholar] [CrossRef]
- Yun, W.; Li, H.; Chen, S.Q.; Tu, D.W.; Xie, W.Y.; Huang, Y. Aptamer-based rapid visual biosensing of melamine in whole milk. Eur. Food Res. Technol. 2014, 238, 989–995. [Google Scholar] [CrossRef]
- Qi, W.J.; Wu, D.; Ling, J.; Huang, C.Z. Visual and light scattering spectrometric detections of melamine with polythymine-stabilized gold nanoparticles through specific triple hydrogen-bonding recognition. Chem. Commun. 2010, 46, 4893–4895. [Google Scholar] [CrossRef] [PubMed]
- Zheng, H.R.; Li, Y.; Xu, J.Y.; Bie, J.X.; Liu, X.; Guo, J.J.; Luo, Y.L.; Shen, F.; Sun, C.Y.; Yu, Y.L. Highly Sensitive Aptamer-Based Colorimetric Detection of Melamine in Raw Milk with Cysteamine-Stabilized Gold Nanoparticles. J. Nanosci. Nanotechnol. 2017, 17, 853–861. [Google Scholar] [CrossRef] [PubMed]
- Zhai, C.; Qiang, W.; Sheng, J.; Lei, J.; Ju, H. Pretreatment-free fast ultraviolet detection of melamine in milk products with a disposable microfluidic device. J. Chromatogr. A 2010, 1217, 785–789. [Google Scholar] [CrossRef] [PubMed]
- Cao, H.; Hu, X.; Hu, C.; Zhang, Y.; Jia, N. A novel solid-state electrochemiluminescence sensor for melamine with Ru(bpy)3(2+)/mesoporous silica nanospheres/Nafion composite modified electrode. Biosens. Bioelectron. 2013, 41, 911–915. [Google Scholar] [CrossRef] [PubMed]
- Yin, W.; Liu, J.; Zhang, T.; Li, W.; Liu, W.; Meng, M.; He, F.; Wan, Y.; Feng, C.; Wang, S.; et al. Preparation of monoclonal antibody for melamine and development of an indirect competitive ELISA for melamine detection in raw milk, milk powder, and animal feeds. J. Agric. Food Chem. 2010, 58, 8152–8157. [Google Scholar] [CrossRef] [PubMed]
- Zhou, Y.; Li, C.Y.; Li, Y.S.; Ren, H.L.; Lu, S.Y.; Tian, X.L.; Hao, Y.M.; Zhang, Y.Y.; Shen, Q.F.; Liu, Z.S.; et al. Monoclonal antibody based inhibition ELISA as a new tool for the analysis of melamine in milk and pet food samples. Food Chem. 2012, 135, 2681–2686. [Google Scholar] [CrossRef] [PubMed]
- Huang, H.; Li, L.; Zhou, G.H.; Liu, Z.H.; Ma, Q.; Feng, Y.Q.; Zeng, G.P.; Tinnefeld, P.; He, Z.K. Visual detection of melamine in milk samples based on label-free and labeled gold nanoparticles. Talanta 2011, 85, 1013–1019. [Google Scholar] [CrossRef] [PubMed]
- Ai, K.L.; Liu, Y.L.; Lu, L.H. Hydrogen-Bonding Recognition-Induced Color Change of Gold Nanoparticles for Visual Detection of Melamine in Raw Milk and Infant Formula. J. Am. Chem. Soc. 2009, 131, 9496–9497. [Google Scholar] [CrossRef] [PubMed]
- Zeng, Y.Y.; Pratumyot, Y.; Piao, X.J.; Bong, D. Discrete Assembly of Synthetic Peptide-DNA Triplex Structures from Polyvalent Melamine-Thymine Bifacial Recognition. J. Am. Chem. Soc. 2012, 134, 832–835. [Google Scholar] [CrossRef] [PubMed]
- Leng, X.Q.; Tu, Y.Q.; Wu Y., P.; W, Y.; Liu, S.; Pei, Q.Q.; Cui, X.J.; Huang, J.D. Exonuclease III-aided recycling amplification of proximity ligation assay using thymine-melamine-thymine triplex structure for ultrasensitive fluorometric determination of melamine. Food Control 2018, 92, 325–330. [Google Scholar] [CrossRef]
- Hu, H.; Zhang, J.Y.; Ding, Y.; Zhang, X.F.; Xu, K.L.; Hou, X.D.; Wu, P. Modulation of the Singlet Oxygen Generation from the Double Strand DNA-SYBR Green I Complex Mediated by T-Melamine-T Mismatch for Visual Detection of Melamine. Anal. Chem. 2017, 89, 5101–5106. [Google Scholar] [CrossRef] [PubMed]
- Chen, J.Y.; Ji, X.H.; He, Z.K. Smart Composite Reagent Composed of Double-Stranded DNA-Templated Copper Nanoparticle and SYBR Green I for Hydrogen Peroxide Related Biosensing. Anal. Chem. 2017, 89, 3988–3995. [Google Scholar] [CrossRef] [PubMed]
- Chen, X.L.; Li, T.T.; Tu, X.Q.; Luo, L. Label-free fluorescent aptasensor for thrombin detection based on exonuclease I assisted target recycling and SYBR Green I aided signal amplification. Sens. Actuators B Chem. 2018, 265, 98–103. [Google Scholar] [CrossRef]
- Cai, Q.Y.; Ge, J.; Xu, H.H.; Zhang, L.; Hu, Y.L.; Huang, Z.M.; Li, Z.H. A label-free aptasensor for highly sensitive ATP detection by using exonuclease I and oligonucleotide-templated fluorescent copper nanoparticles. Anal. Methods 2017, 9, 2710–2714. [Google Scholar] [CrossRef]
Figure 1.
Schematic illustration of the simple and label-free fluorescent method for melamine based on melamine–thymine recognition.
Figure 1.
Schematic illustration of the simple and label-free fluorescent method for melamine based on melamine–thymine recognition.

Figure 2.
The fluorescence signal change (F/F0) under different length polythmine DNA. where F0 and F were the area under curve of the emission spectra in the absence and presence of 500 μM melamine, respectively. Error bars were estimated from at least three independent measurements.
Figure 2.
The fluorescence signal change (F/F0) under different length polythmine DNA. where F0 and F were the area under curve of the emission spectra in the absence and presence of 500 μM melamine, respectively. Error bars were estimated from at least three independent measurements.
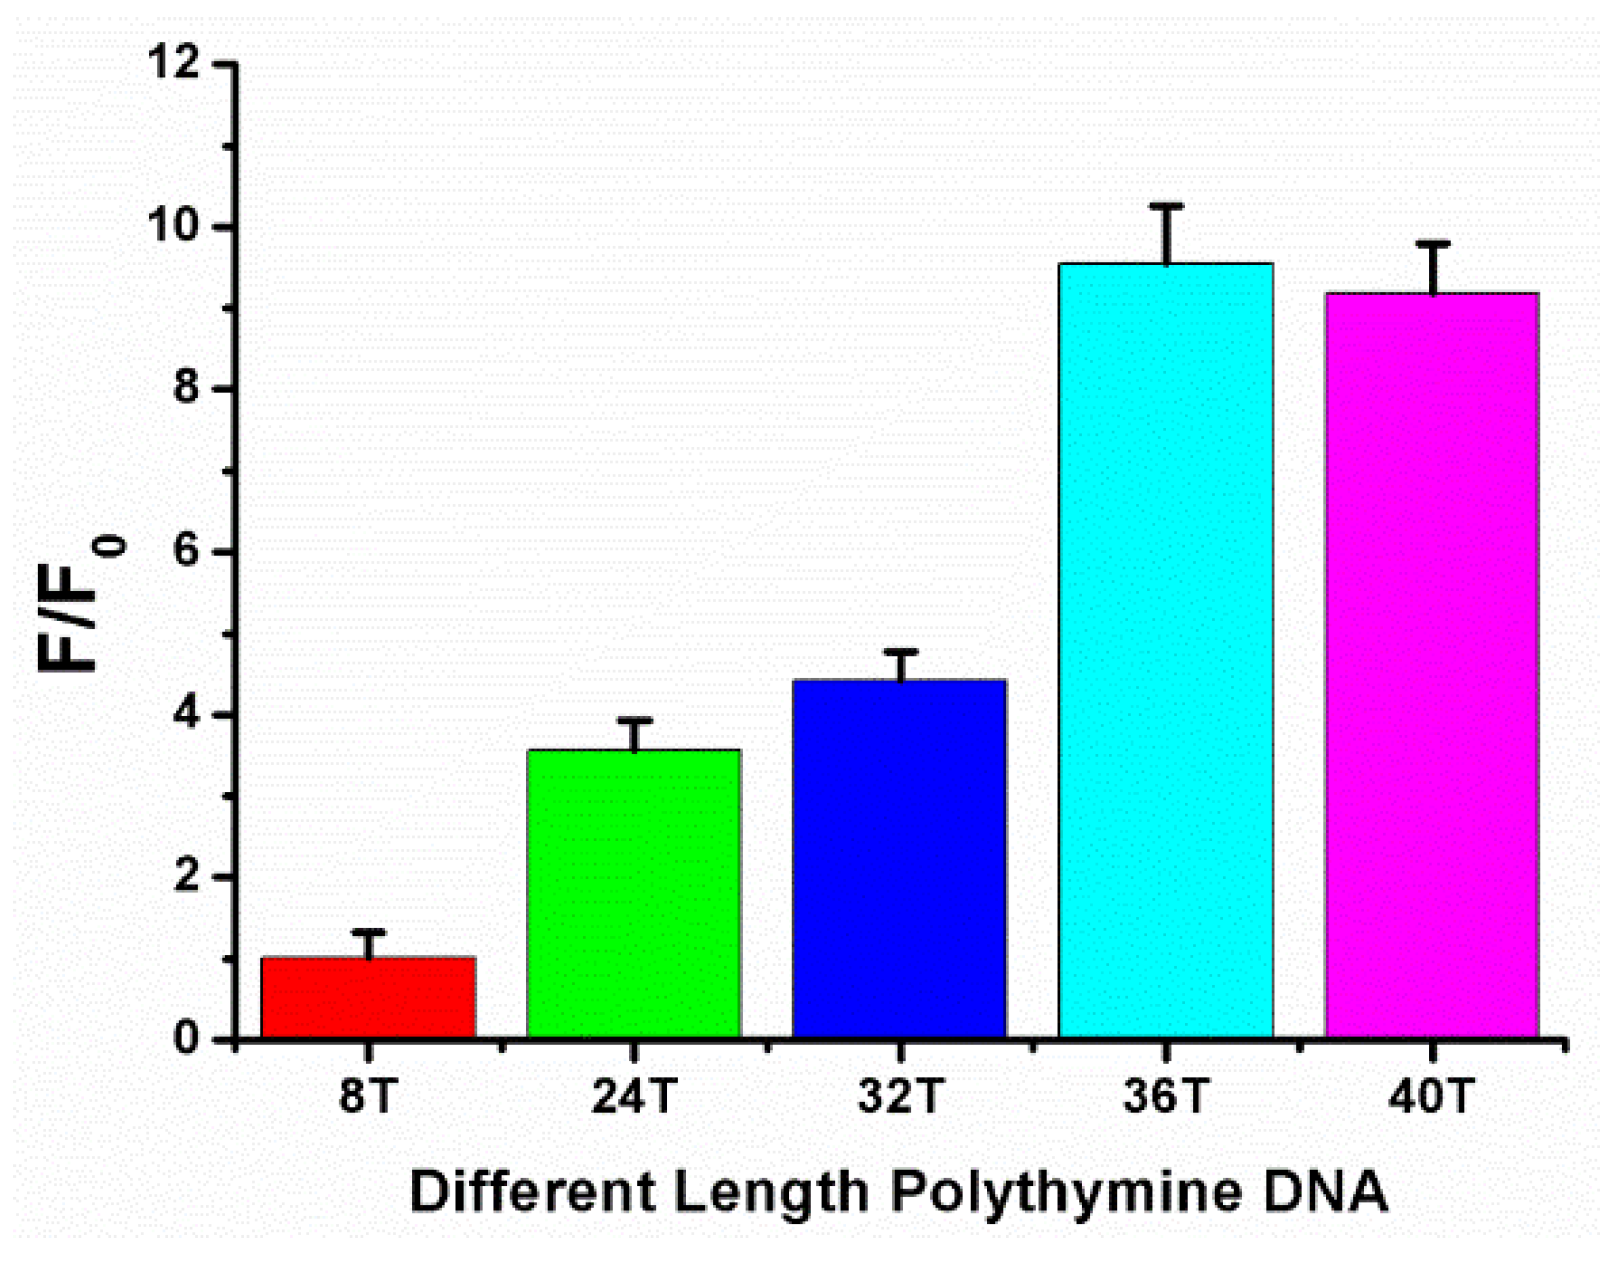
Figure 3.
(a) The fluorescence emission spectra in the presence of difference melamine concentrations. (b) The fluorescence intensity signal change F/F0 for melamine concentrations ranging from 6 to 500 μM, which matched the dose-response curve. Inset: the signal change matched a linear relationship at concentrations of 10–200 μM. F0 and F are the area under curve of the emission spectra in the absence and presence of melamine, respectively. Error bars were estimated from at least three independent measurements.

Figure 4.
The selectivity of our method was evaluated in the presence 40 μM melamine and 400 μM interfering materials. Error bars are estimated from at least three independent measurements.
Figure 4.
The selectivity of our method was evaluated in the presence 40 μM melamine and 400 μM interfering materials. Error bars are estimated from at least three independent measurements.

Table 1.
Determination of melamine in milk samples using the proposed method.
| Sample Number | Melamine Added (μM) | Melamine Detected (μM) | Recovery (%) |
|---|---|---|---|
| 1 | 20 | 21.95 ± 2.21 | 109.75 |
| 2 | 80 | 86.12 ± 5.09 | 107.65 |
| 3 | 150 | 148.76 ± 8.43 | 99.17 |
© 2018 by the authors. Licensee MDPI, Basel, Switzerland. This article is an open access article distributed under the terms and conditions of the Creative Commons Attribution (CC BY) license (http://creativecommons.org/licenses/by/4.0/).
Share and Cite
MDPI and ACS Style
Yang, H.; Wang, J.; Wu, Q.; Wang, Y.; Li, L.; Ding, B. Simple and Label-Free Fluorescent Detection of Melamine Based on Melamine–Thymine Recognition. Sensors 2018, 18, 2968. https://doi.org/10.3390/s18092968
AMA Style
Yang H, Wang J, Wu Q, Wang Y, Li L, Ding B. Simple and Label-Free Fluorescent Detection of Melamine Based on Melamine–Thymine Recognition. Sensors. 2018; 18(9):2968. https://doi.org/10.3390/s18092968
Chicago/Turabian StyleYang, Hualin, Jiujun Wang, Qinghua Wu, Yun Wang, Li Li, and Baomiao Ding. 2018. "Simple and Label-Free Fluorescent Detection of Melamine Based on Melamine–Thymine Recognition" Sensors 18, no. 9: 2968. https://doi.org/10.3390/s18092968
Note that from the first issue of 2016, this journal uses article numbers instead of page numbers. See further details here.