Article

Rapid and Sensitive Determination of Vanillin Based on a Glassy Carbon Electrode Modified with Cu2O-Electrochemically Reduced Graphene Oxide Nanocomposite Film

1
School of Chemistry and Biological Engineering, Changsha University of Science & Technology, Changsha 410114, China
2
Hunan Key Laboratory of Biomedical Nanomaterials and Devices, School of Life Sciences and Chemistry, Hunan University of Technology, Zhuzhou 412007, China
*
Author to whom correspondence should be addressed.
Co-first author, same contribution.
Sensors 2018, 18(9), 2762; https://doi.org/10.3390/s18092762
Submission received: 30 July 2018 / Revised: 18 August 2018 / Accepted: 18 August 2018 / Published: 22 August 2018
(This article belongs to the Section Chemical Sensors)

Abstract

:
A facile cuprous oxide nanoparticles functionalized electro-reduced graphene oxide modified glassy carbon electrode (denoted as Cu2O NPs-ERGO/GCE) was fabricated via a simple physical adsorption and electrochemical reduction approach. Cyclic voltammetry and second-order derivative linear scan voltammetry were used to investigate the electrocatalysis oxidation of vanillin on the Cu2O NPs-ERGO/GCE. The compound yielded a well-defined voltammetric response in 0.1 M H2SO4 at 0.916 V (vs. saturated calomel electrode (SCE)). A linear calibration graph was obtained in the concentration range of 0.1 μM to 10 μM and 10 μM to 100 μM, while the detection limit (S/N = 3) is 10 nM. In addition, the Cu2O NPs-ERGO/GCE presented well anti-interference ability, stability, and reproducibility. It was used to detect vanillin sensitively and rapidly in different commercial food products, and the results were in agreement with the values obtained by high performance liquid chromatography.

1. Introduction

Vanillin is a phenolic aldehyde and the primary component of the extract of the vanilla bean with the molecular formula C8H8O3 (4-hydroxy-3-methoxybenzaldehyde). Its natural fragrance is attractive and pleasing. It has been widely used as an additive in the food industry. Synthetic vanillin, as an alternative, is now used more often than the natural one as a flavoring agent in foods, beverages, and pharmaceuticals. This compound is applied to contribute to the fragrance of commercial foods such as ice cream, pudding, cookies, beverages, chocolate, and custard [1]. However, studies have shown that vanillin can cause headaches, vomiting, and nausea when ingesting large amounts of this flavor enhancer, and may affect kidney and liver functions [1]. Consequently, the development of vanillin detection methods in foods that are simple and reliable is very important and valuable because of food safety. Until now, several methods for determining vanillin have been described and involve the use of high-performance liquid chromatography [2], gas chromatography [3], thin layer chromatography [4], capillary electrophoresis [5], UV-visible (vis) spectrophotometry [6], and chemiluminometry [7]. However, most of the above methods require highly complex instruments and involve time consuming sample pretreatment processes. As a result of some merits of fast response, high sensitivity, simple operation, and low cost, electrochemical methods have been tried and developed for the detection of vanillin. However, although the molecule is electrooxidizable, there are few studies on the voltammetric determination of vanillin. The main cause is the problem of fouling and regeneration of the electrode surface. An effective way to overcome these obstacles is electrode modification. Some chemically modified electrodes have been reported [1,8,9,10,11,12,13,14,15,16]. The performance of these sensors is heavily dependent on the modified materials. Therefore, the exploration of new materials for the fast and accurate detection of vanillin is greatly demanded.
Nowadays, various nanostructured materials have been developed to improve the performance of electrochemical sensors. Graphene in particular, which is two-dimensional single-layer graphite, has recently received great attention because of its extraordinary performance [17]. Currently, sensors modified with graphene/metal oxides have been widely reported [18,19]. Cuprous oxide (Cu2O) is a p-type semiconductor that is considered to be an attractive and promising material because of its relatively narrow band gap (2.0–2.2 eV), low cost, and non-toxic nature. In previous studies, Cu2O was successfully used to modify electrode surface to enhance the response signals of H2O2 [20,21], glucose [21,22,23], dopamine [24,25,26], herbicide paraquat [27], l-tyrosine [28], and NO2 [29]. As far as we know, the electrochemical detection of vanillin using a Cu2O modified electrode is still missing. However, Cu2O nanoparticles are easy to aggregate, which greatly limits its application in electrochemical sensors. How to reduce the aggregation of Cu2O nanoparticles has become an urgent problem for researchers. Cu2O-reduced graphene oxide nanocomposites have been prepared by Xu et al. [20] using physical adsorption, in situ reduction, and one-pot synthesis. The composites were dispersed in 0.1% Nafion solution and modified on glassy carbon electrode by dropping coating method. The non-enzymatic hydrogen peroxide sensor was constructed. Zhang et al. [24] successfully prepared Cu2O/graphene nanocomposites by the solvothermal method. The modified electrode showed good electrocatalytic effect on dopamine. The linear range is 0.1 to 10 µM, and the detection limit is 10 nM. Cu2O microparticles and polyvinyl pyrrolidone functionalized graphene nanosheets (micro-Cu2O/PVP-GNs) modified glassy carbon-rotating disk electrode (GC-RDE) were prepared by Ye et al. [27]. The sensitive and selective detection of herbicide paraquat was carried out using the excellent catalytic performance of Cu2O and GNs. However, the above graphene (GR) based composites require more synthetic steps. Green synthesis of Cu2O–GR composite for electrochemical detection of vanillin has not been reported.
In this paper, an efficient, inexpensive, and rapid technique was presented to prepare Cu2O NPs–graphene composite via a simple physical adsorption and electrochemical reduction approach. Generally, GR can be synthesized on a large scale by chemical reduction of graphene oxide (GO). In the laborious process, excessive and toxic reducing agents such as hydrazine hydrate and sodium borohydride will contaminate the resulting materials. Compared with the chemical reduction methods, this method is simple, non-toxic, time-saving, and green. Because of its enhanced catalytic activity and high adsorption capacity, the prepared Cu2O nanoparticles functionalized electro-reduced graphene oxide modified glassy carbon electrode (NPs-ERGO/GCE) can be used as an effective electrochemical sensor for sensitive determination of vanillin. For further confirmation of the feasibility of practical application, the vanillin contents in some commercial food products were also determined.

2. Experiment

2.1. Chemical and Solutions

Graphite, hydrazine hydrate solution (80 wt%), cupric sulfate (CuSO4·5H2O), and vanillin were supplied by Sinopharm Chemical Reagent Co., Ltd., Shanghai, China. H2O2 solution (30 wt%) and polyvinyl pyrrolidone (PVP) was purchased from Aladdin (Shanghai, China). Vanillin was dissolved in 5% (v/v) ethanol aqueous solution to prepare a 1.0 × 10⁻³ M standard stock solution, preserved at 4 °C, and protected from daylight when not in use. Working solutions of lower concentrations were prepared by appropriate dilution of the stock solution. The buffer solution and standard solution were prepared by double distilled water. All chemicals are analytical grade and used as received.

2.2. Apparatus

All the electrochemical measurements were measured on a CHI 660E Electrochemical Workstation (Chenhua Instrument Co. Ltd., Shanghai, China) and a Model JP-303E Polarographic Analyzer (Chengdu Instrument Factory, Chengdu, China). A conventional three-electrode system was employed throughout, consisting of a Cu2O NPs-ERGO/GCE (3 mm inner diameter) as working electrode, a Pt wire counter electrode, and a saturated calomel reference electrode (SCE).
Solution pH values were measured using a digital pHs-3c Model pH meter (Shanghai Leichi Instrument Factory, Shanghai, China). The morphology of the samples was obtained on a scanning electron microscopy (EVO10, Carl Zeiss Jena GmbH, Jena, Germany). High performance liquid chromatography (HPLC) was conducted on Waters model 510 system (Waters Ltd., Milford, MA, USA) including a 250 mm × 4.6 mm Kromasil 100-5C18 column, using aqueous acetic acid (1%, v/v)–acetonitrile (85:15, v/v) as mobile phase with a flow rate of 0.6 mL min−1, and equipped with a Waters 2487 dual λ absorbance UV/Vis detector (Waters Ltd., Milford, MA, USA).

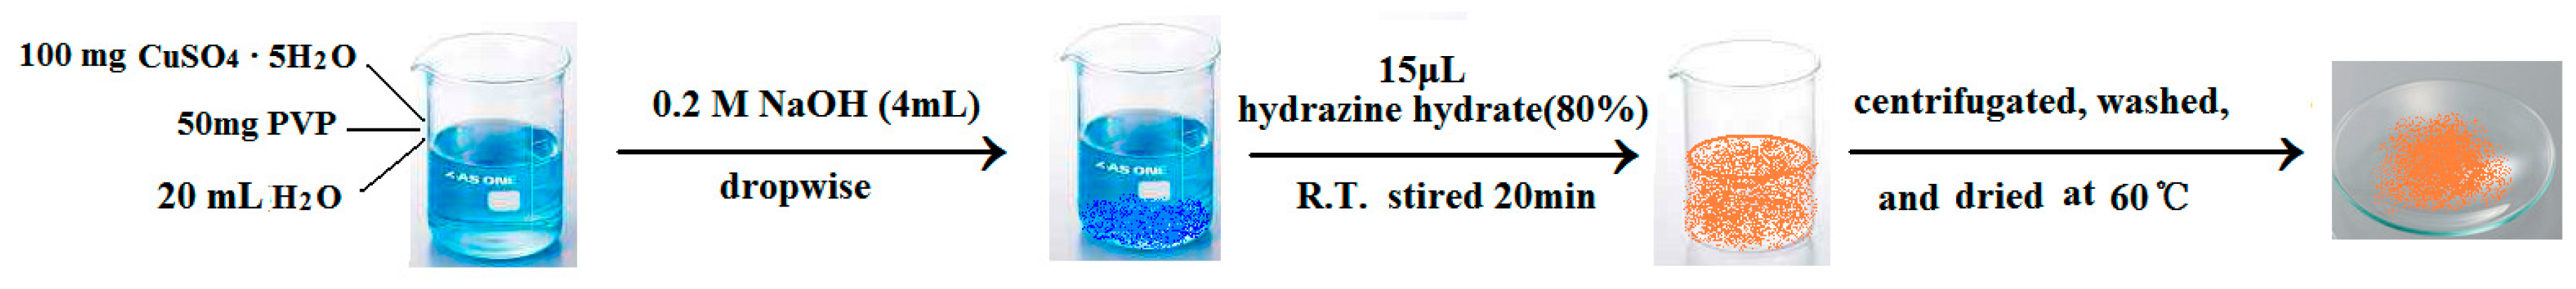
2.3. Synthesis of Cuprous Oxide

Cuprous oxide nanoparticles (Cu2O NPs) were prepared according to a previous method [20]. Typically, 100 mg CuSO4·5H2O and 50 mg PVP was added in 20 mL double distilled water under stirring. Then, 0.2 M NaOH (4 mL) was added dropwise, and blue precipitate came into being. Finally, 15 μL of hydrazine hydrate solution (80 wt%) was added to the mixture and stirred at room temperature for 20 min to form a brick-red suspension. The solid product was separated from the solution by centrifugation, washed with absolute ethanol and water, and dried under vacuum condition of 60 °C. The synthesis route for Cu2O NPs can be illustrated as Scheme 1.

2.4. Preparation of Cu2O–GO Nanocomposite

According to our previous report [25,26,30,31], natural graphite powder is oxidized to graphite oxide using a modified Hummers method. Then, 10 mg graphite oxide was dispersed into 10 mL double distilled water and exfoliated to GO by ultrasonication for 2 h. The unexfoliated graphite oxide was removed by centrifuging at 6000 rpm for 30 min. For preparation of Cu2O NPs–GO composite, 1.0 mg Cu2O NPs was dispersed into 20 mL GO colloid and then sonicated for about 2 h to give a stable and homogeneous suspension.

2.5. Fabrication of Electrochemical Sensor

Before modification, bare GCE was polished to mirror-like by 0.3 μm alumina slurry, and then the GCE was washed with anhydrous alcohol and water successively by ultrasonication for 3 min, respectively, and dried in N2 blowing. Then, 5 μL of Cu2O NPs–GO was dropped on the freshly prepared pure GCE surface. After drying under ambient condition, the GO film was reduced in a pH 6.0 phosphate buffer at a constant potential of −1.2 V for 120 s, and the Cu2O NPs-ERGO/GCE was obtained. GO/GCE, Cu2O NPs/GCE, ERGO/GCE, and Cu2O NPs-GO/GCE were also prepared with the similar procedures for comparison.

2.6. Electrochemical Measurements

Voltammetric measurements were conducted in a 10 mL electrochemical cell containing a desired concentration of vanillin in 0.1 M H2SO4. Cyclic voltammograms were measured between +0.50 V and +1.15 V at a scan rate of 0.1 V s–1. Second-order derivative linear sweep voltammograms were performed from +0.0 V to +1.2 V at a scan rate of 0.1 V s−1, after accumulation at 0.0 V for 90 s. When measuring sample solution by second-order derivative linear sweep voltammetry, the background subtraction was employed in order to avoid the distortion of the signal.

3. Results and Discussion

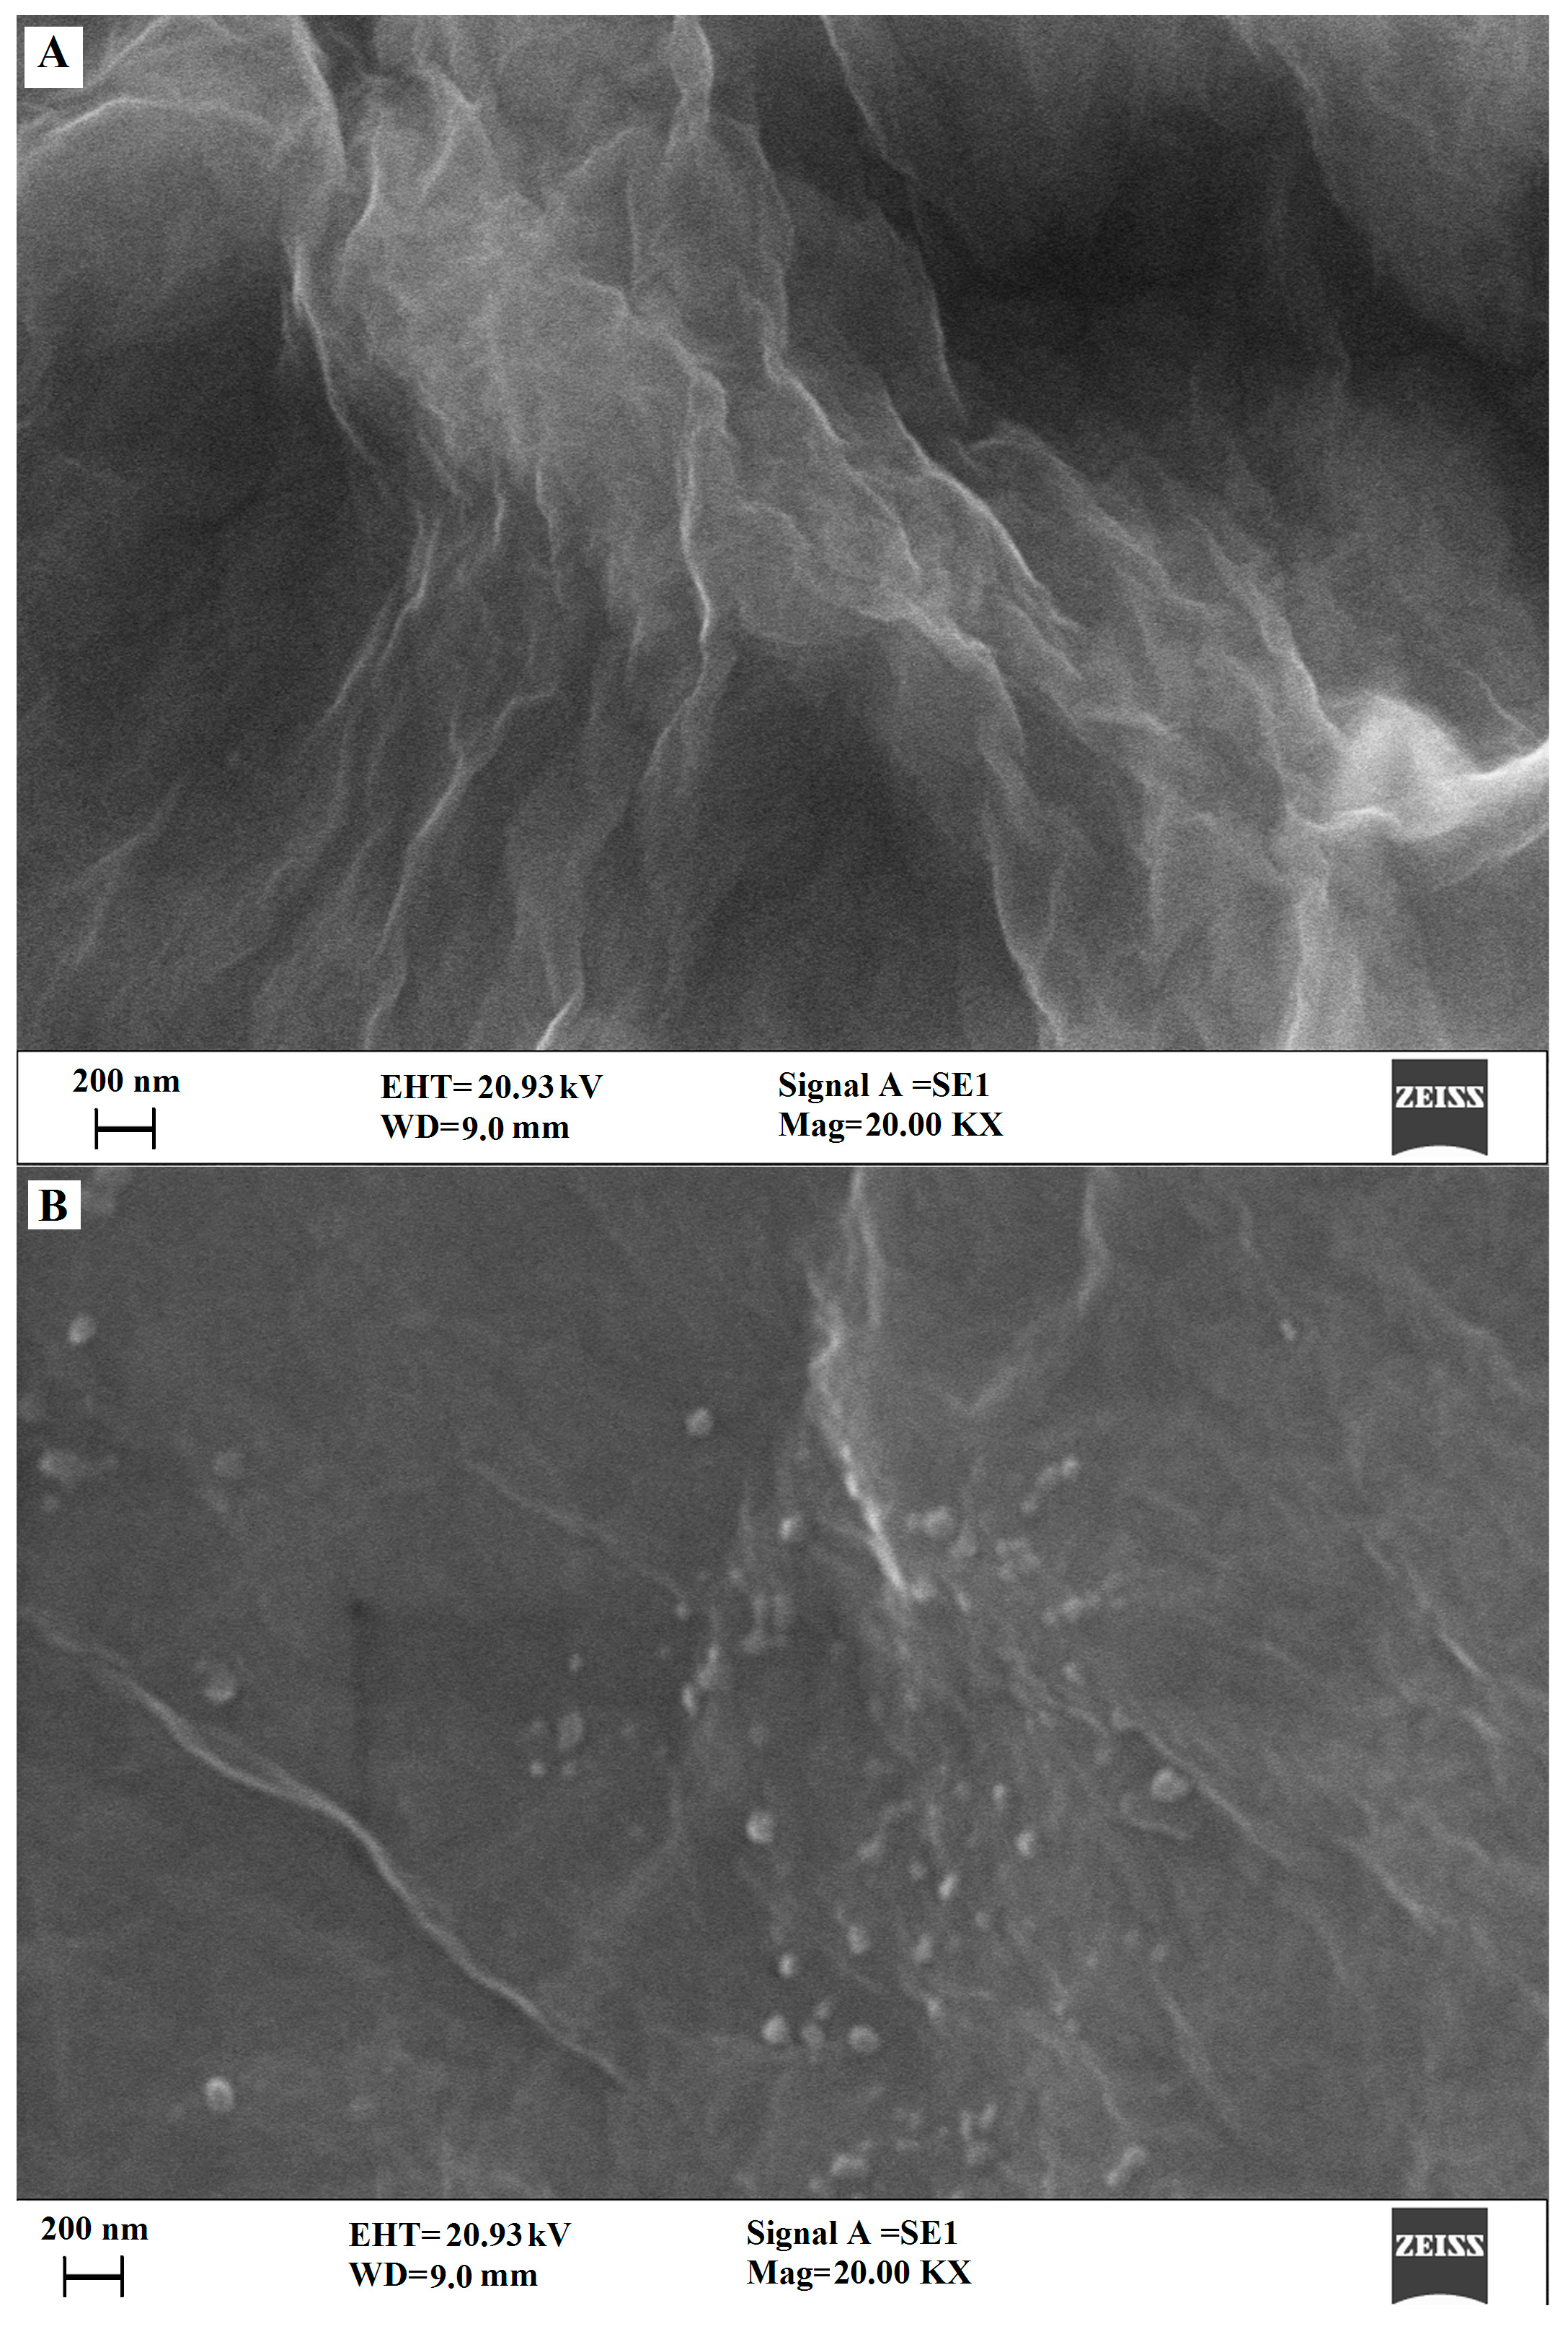
3.1. Characterization of the GO and Cu2O-ERGO Nanocomposites

The morphologies of GO and Cu2O-ERGO nanocomposites were investigated by scanning electron microscopy (SEM). Figure 1A shows the SEM image of GO film. The nanosheets show abundantly wrinkle and crumple-like surface structure, indicating successful preparation of GO. Figure 1B shows the SEM image of Cu2O-ERGO nanocomposites produced by the physical adsorption and electrochemical reduction approach. As can be seen, large numbers of Cu2O nanoparticles were decorated on a thin film of ERGO, and no particles scattered out of the supports, indicating a strong interaction between graphene support and particles. The average diameter of these particles was about 50–100 nm and most of these particles had a spherical outline. Highly dispersed Cu2O on supports with larger surface areas enabled better catalytic activity and sensor sensitivity.

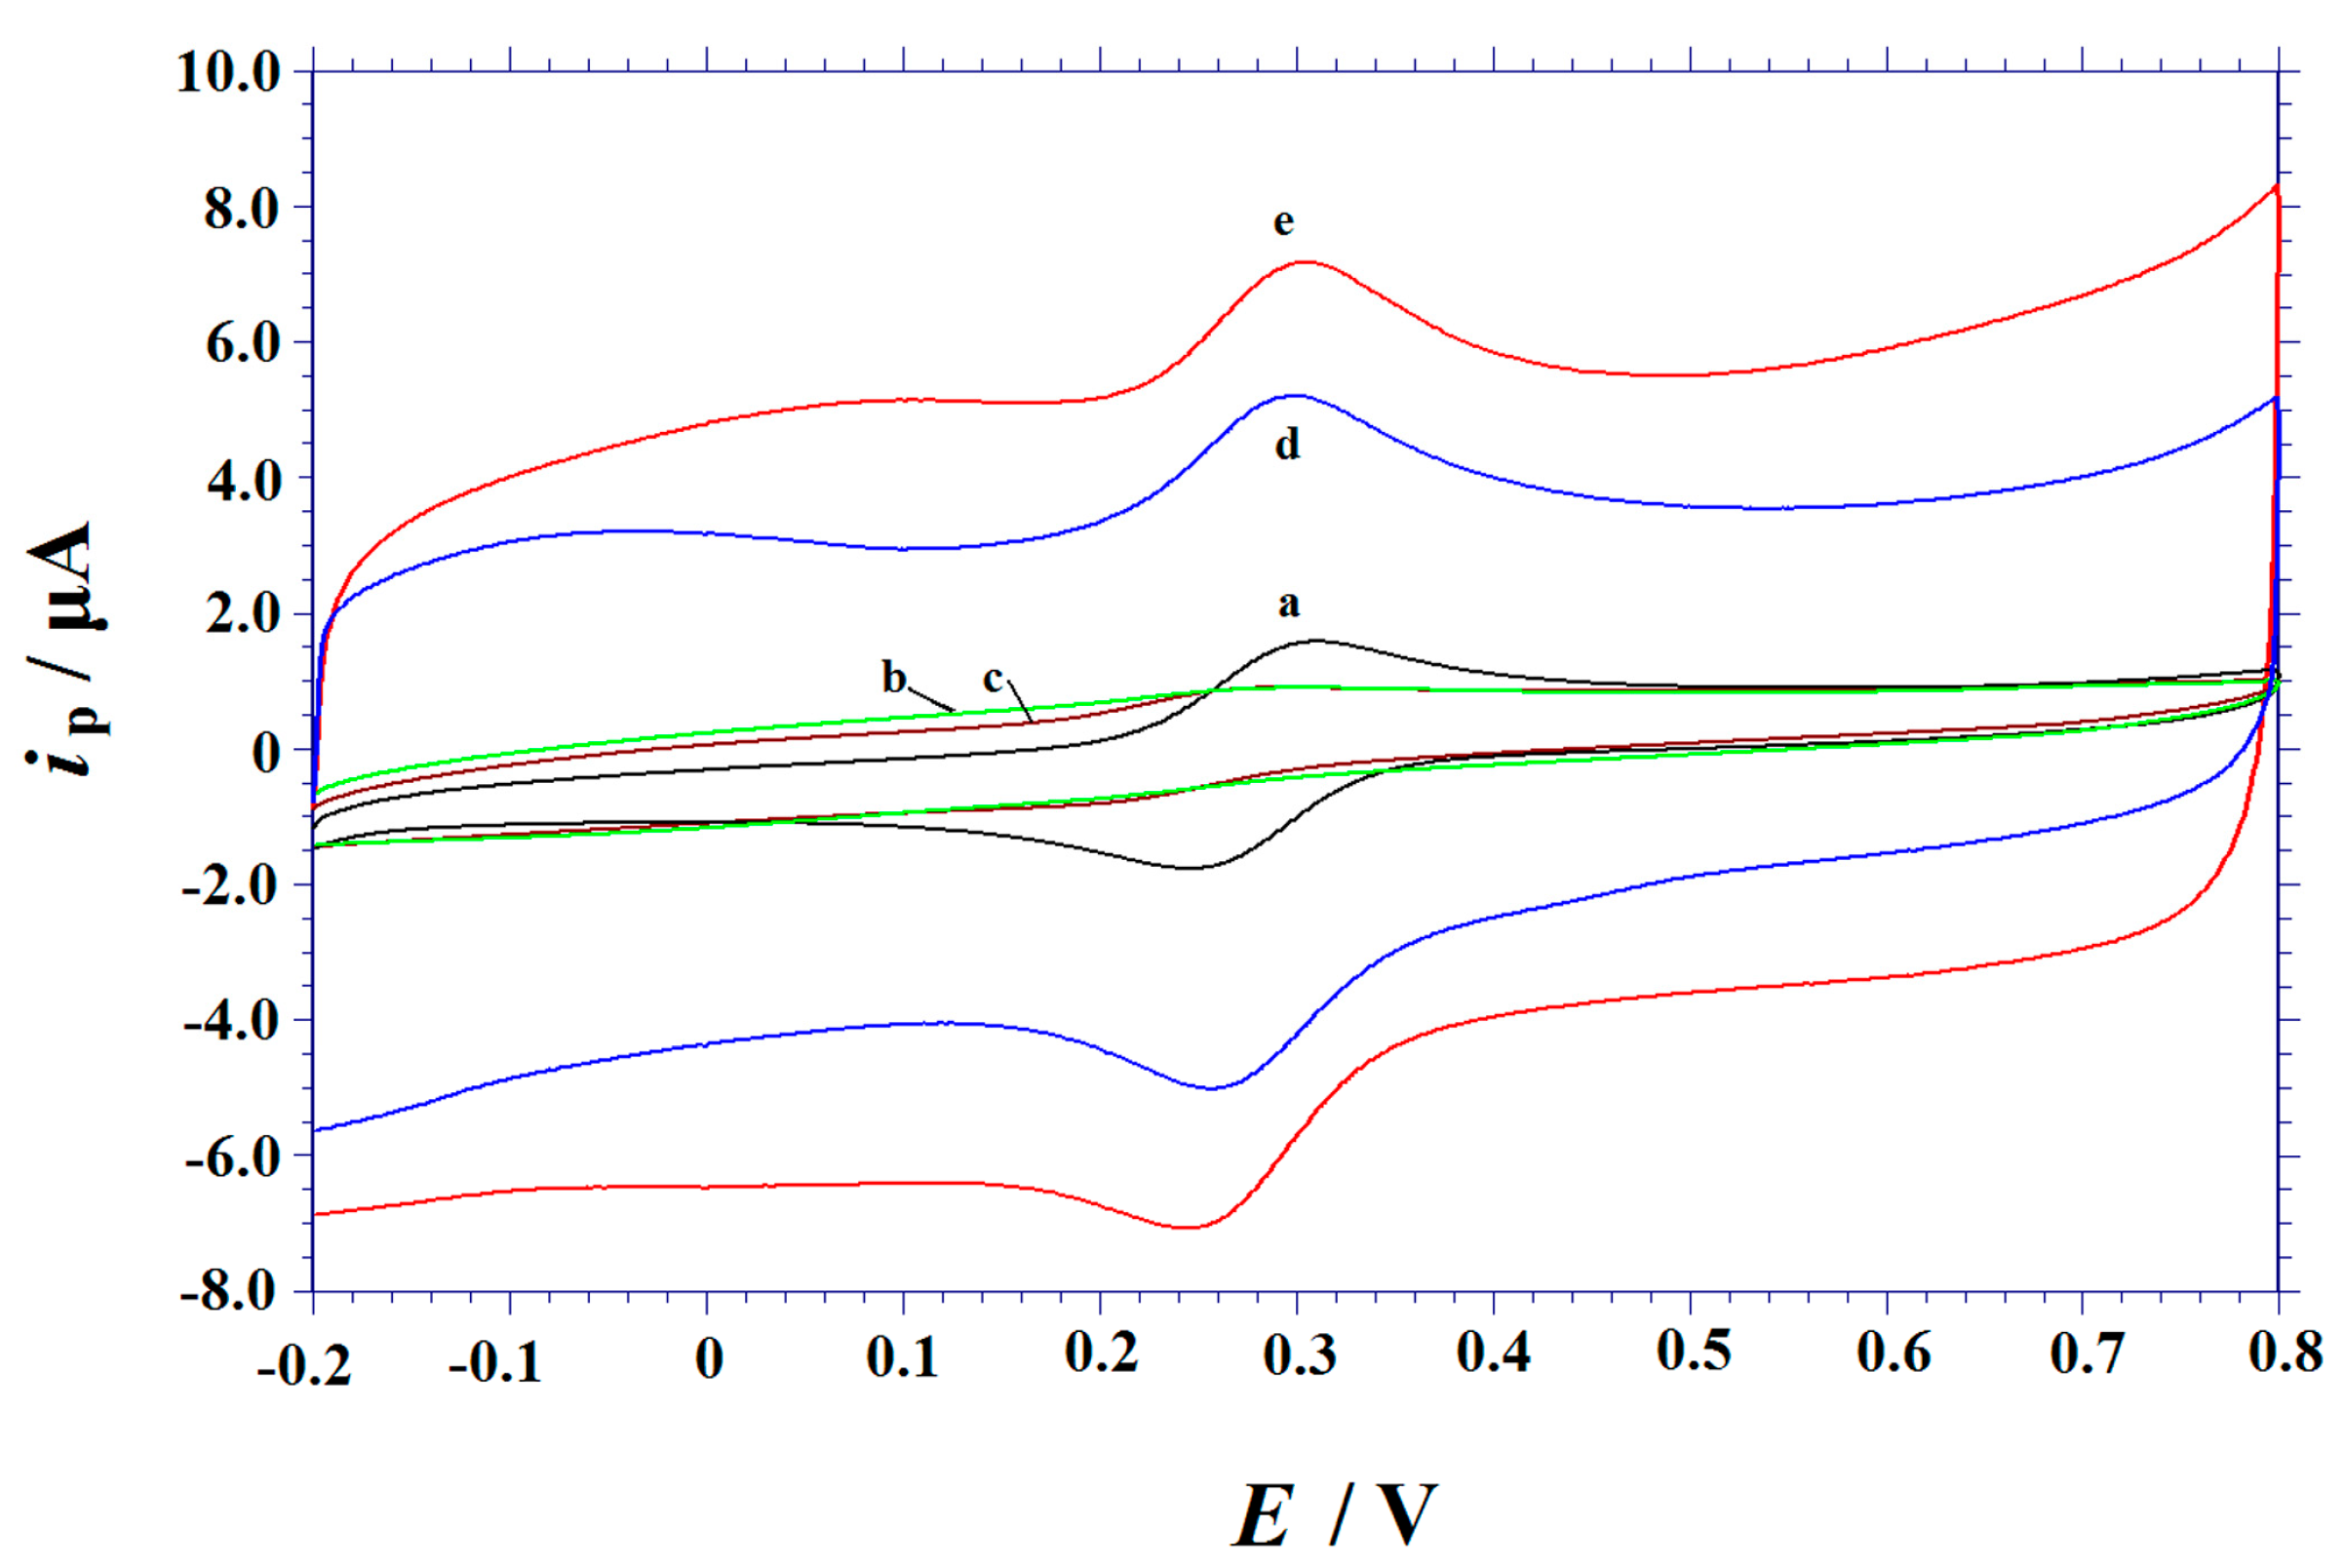
3.2. Electrochemical Characterization of Modified Electrodes

The surface status and the barrier of different modified electrodes were monitored by cyclic voltammetry using ferricyanide as redox probe, and the corresponding cyclic voltammograms were shown in Figure 2. There is a pair of Fe(CN)63−/4− reversible redox peaks on bare GCE. The peak potentials were Epa = 0.308 V, Epc = 0.245 V, and the peak currents were ipa = 14.01 μA and ipc = 15.22 μA (curve a). On the Cu2O NPs/GCE, the redox peak currents of [Fe(CN)6]3−/4− declined greatly. This is because Cu2O NPs are easily agglomerated and have poor conductivity, which hinders electron transfer (curve b). A significant decrease in redox peak current was also observed on GO/GCE due to the weak conductivity of GO (curve c). On the ERGO/GCE, the redox peak currents of the [Fe(CN)6]3−/4− were improved dramatically with the ΔEp value decreased to 42 mV (curve d). This may be a result of the large specific surface area and high electrical conductivity of ERGO, which increases the concentration of Fe(CN)63−/4− on the electrode surface and promotes the electron transfer rate. When using Cu2O NPs-ERGO/GCE, the currents were further increased (curve e), indicating synergistic effect of both Cu2O NPs and ERGO, which improves the electron transfer of Fe(CN)63−/4− at the electrode surface.

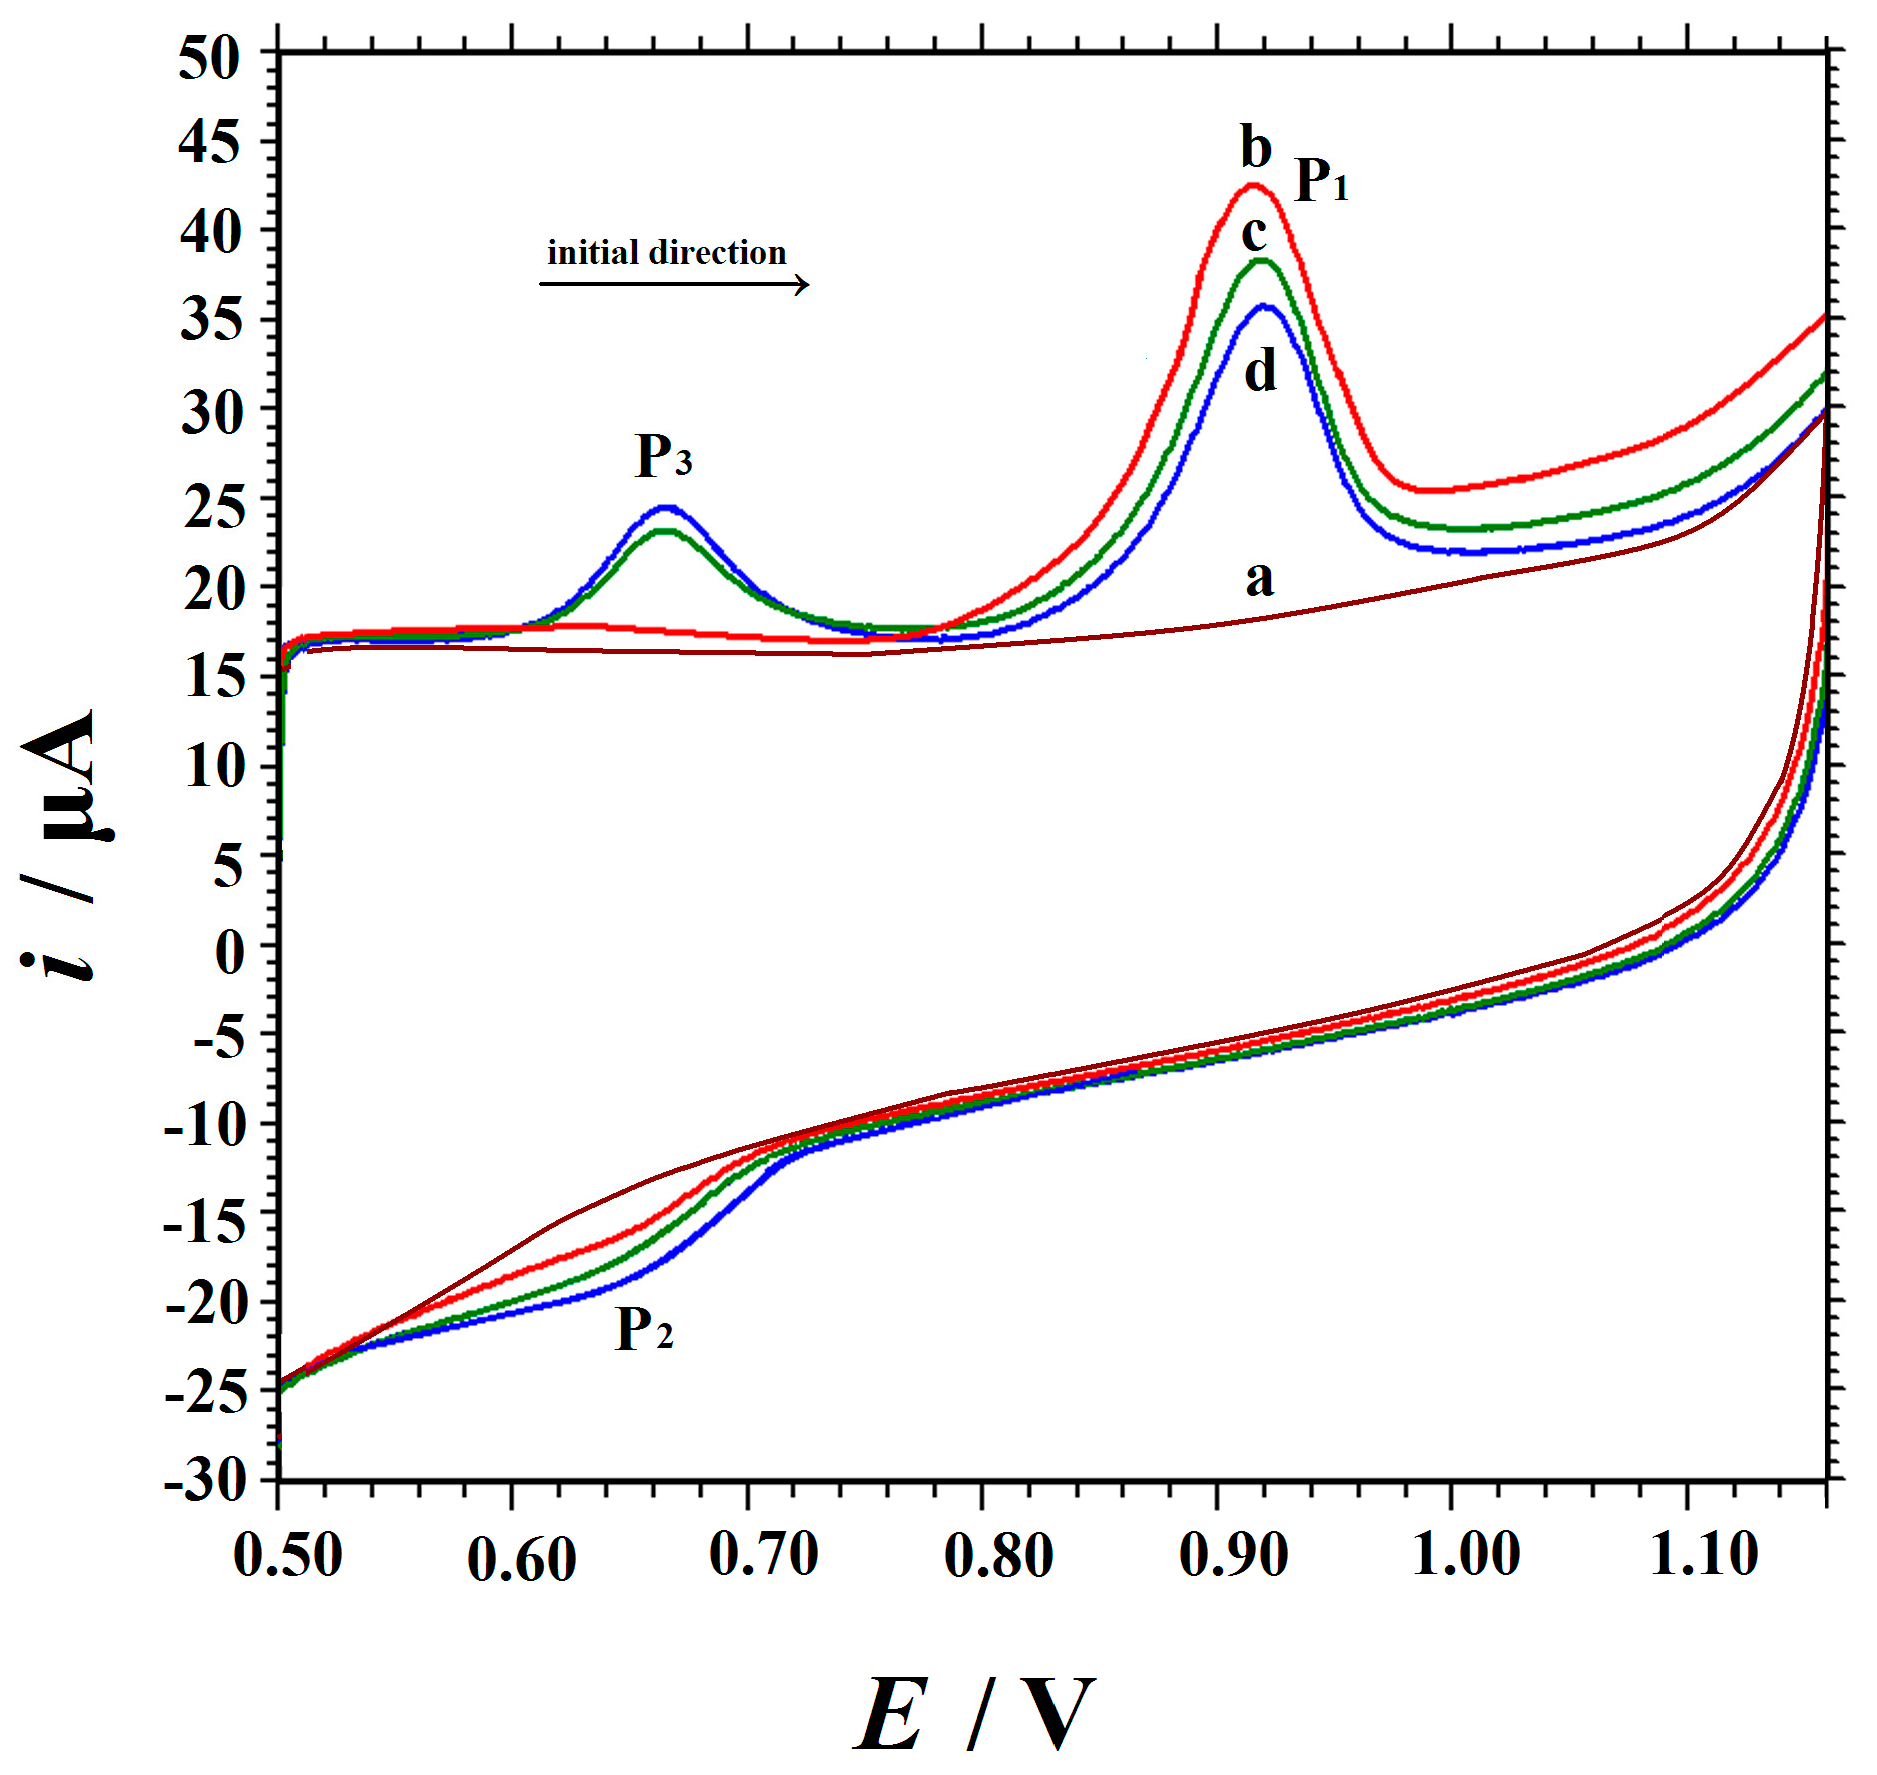
3.3. Electrocatalytic Activity of Cu2O NPs-ERGO/GCE Towards Vanillin

Second-order derivative linear sweep voltammetry is a widely used electrochemical method for enhancing sensitivity and specificity in quantitative detection [32,33]; hence, the sensing performance of Cu2O NPs-ERGO/GCE towards vanillin was evaluated by second-order derivative linear sweep voltammetry. Figure 3 illustrates the second-order derivative linear sweep voltammetric curves of 10 μM vanillin in 0.1 M H2SO4 on GCE (curve a), GO/GCE (curve b), Cu2O NPs/GCE (curve c), Cu2O NPs-GO/GCE (curve d), ERGO/GCE (curve e), and Cu2O NPs-ERGO/GCE (curve f) with a scan rate of 0.10 V s−1. As shown in Figure 3, after 90 s accumulation at the potential of 0.0 V, a weak oxidation peak (1.102 μA V−2) is observed at GCE with a peak potential of about 0.952 V. While the peak current recorded at GO/GCE is much lower (0.5938 μA V−2) than that obtained at bare GCE, the oxidation potential shifted positively to 0.986 V, suggesting the retarded electron transfer due to the poor conductivity of GO. The peak current of vanillin increased (i = 1.242 μA V−2) at the Cu2O NPs/GCE under the same conditions. The catalytic effect of Cu2O NPs is not obvious. The main reason may be the easy aggregation of Cu2O NPs. Meanwhile, vanillin yielded an anodic peak at 0.946 V on the Cu2O NPs-GO/GCE and the according peak current increased to 1.351 μA V−2. After reducing at −1.2 V for 120 s, the peak current of vanillin increased greatly (10.62 μA V−2) at the ERGO/GCE, a shift towards less positive peak potential (0.920 V) can also be observed. Both the decrease in over-potential and the enhancement in oxidation current may be the result of the unique properties of ERGO such as high specific surface area and excellent conductivity. For Cu2O NPs-ERGO/GCE, the peak current increases further (24.43 μA V−2) as compared with ERGO/GCE, the peak potential of vanillin shifts more negatively to 0.912 V and its peak shape becomes sharp. These phenomena may be attributed to the synergetic effect between Cu2O NPs and ERGO. It confirmed that Cu2O NPs-ERGO/GCE has much higher electrocatalytic activity towards the oxidation of vanillin.

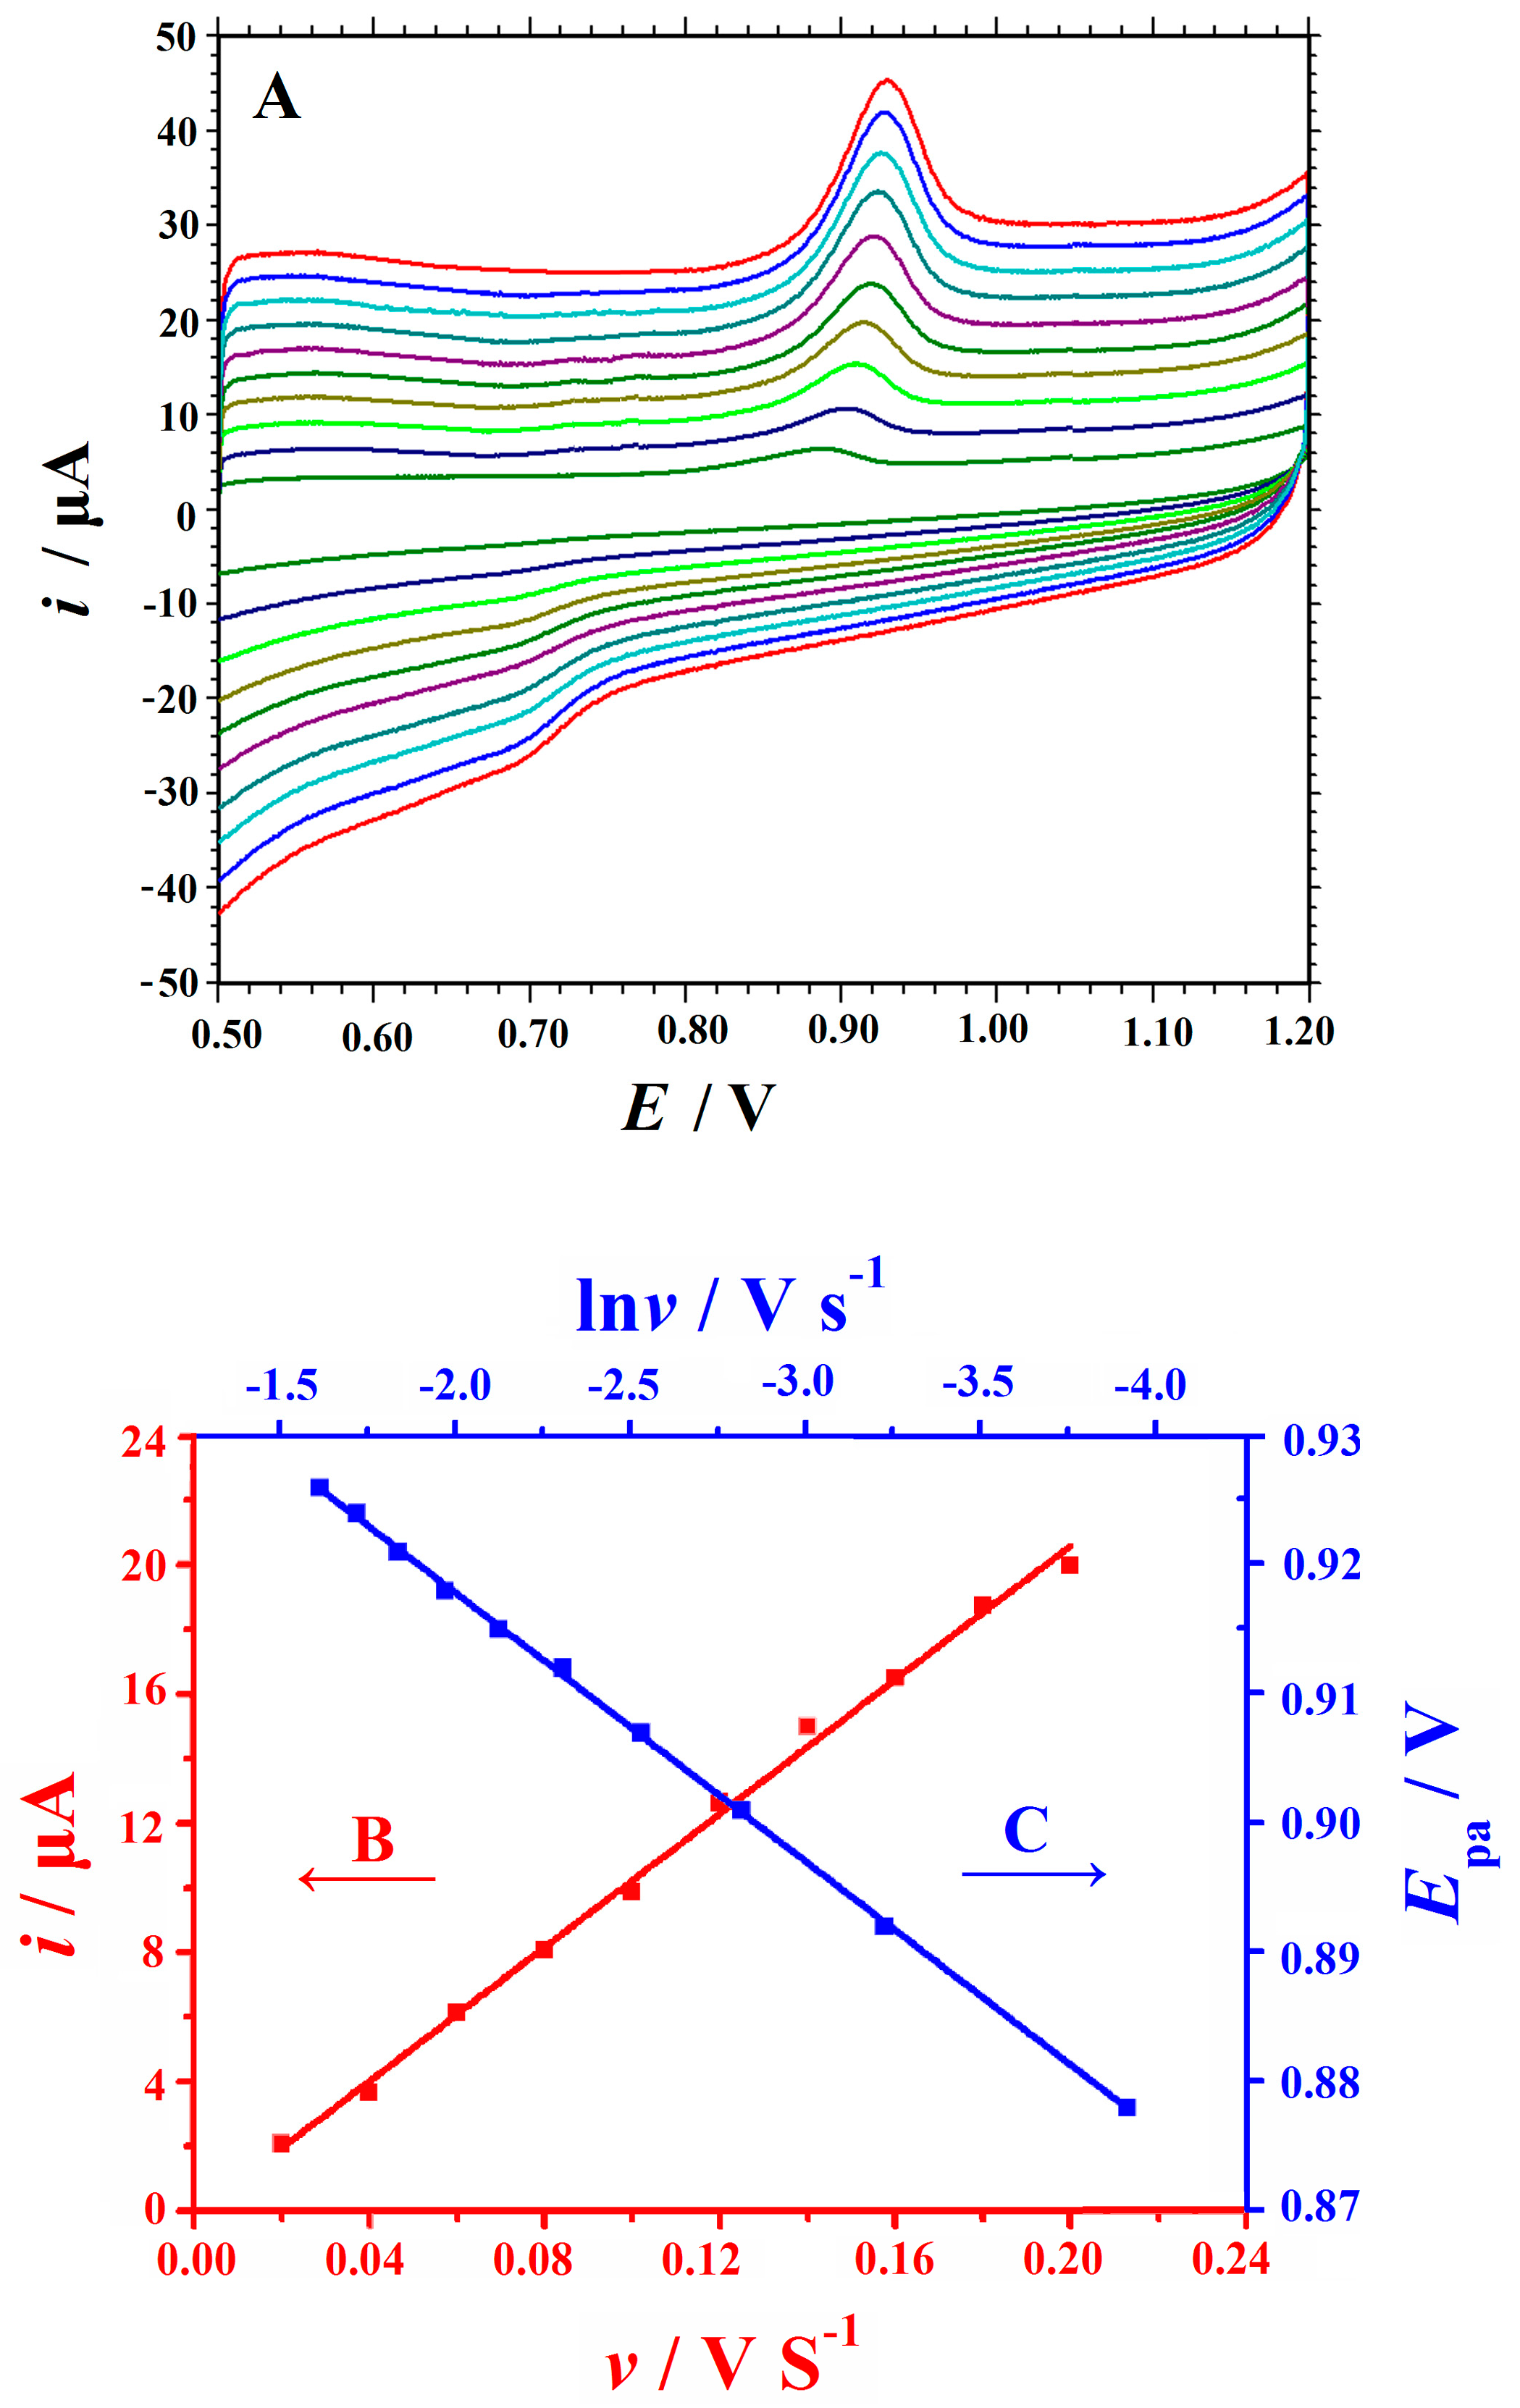
3.4. Cyclic Voltammetric Behaviors

Cyclic voltammetry (CV) is the most widely used technique for acquiring qualitative information about the electrochemical reactions. Figure 4 displays the CV responses on Cu2O NPs-ERGO/GCE in the absence and presence of 10 μM vanillin. As shown in Figure 4, no electrochemical response was observed at the Cu2O NPs-ERGO/GCE in the blank H2SO4 solution, indicating that the modified electrode was a non-electrochemically active species over the selected potential range. After the addition of 10 μM vanillin, an oxidation peak (P1) was observed on Cu2O NPs-ERGO/GCE at 0.920 V attributed to the oxidation of vanillin, and a reduction peak (P2) at 0.650 V was also observed in the reverse scan. In addition to P1, another oxidation peak (P3) at 0.662 V was observed during the subsequent scan, and formed a redox couple with peak P2. Simultaneously, compared with that of the first scan, the peak current of P1 decreased signally in the subsequent scans, while the redox couple (P2/P3) increased at the expense of peak P1, implying that the product of vanillin by irreversible oxidation remained on or near the surface of the modified electrode and was reduced during the cathodic sweep. The electrochemical behavior of vanillin was consistent with some previous reports [14,15,16].
CV was utilized to study the effect of scan rate on vanillin oxidation at Cu2O NPs-ERGO/GCE. The voltammograms were recorded at various scan rates of 0.02 to 0.2 V s–1 in the presence of 10 μM vanillin as shown in Figure 5A. The results demonstrated that Epa changes positively with both the ipa increase and the scanning rate increases. This phenomenon is consistent with the characteristics of an irreversible reaction. As shown in Figure 5B, there is a good linear relationship between peak current and scan rate over the range studied. The linear regression equation can be expressed as ipa (A) = 103.66v (V s−1) − 0.1335 (R = 0.9983), indicating that the oxidation of vanillin follows the electron transfer process of adsorption control. By plotting logi vs. logv, a straight line with the linear regression equation of log ipa (μA) = 1.0182 log v (V s−1) + 2.0261 (R = 0.9984) was obtained. The slope is very close to 1.0, which further confirms the oxidation of vanillin is an adsorption-controlled process. Moreover, in Figure 5C, a plot of Epa versus Neperian logarithm of v (ln v) also presents a linear relationship, and the linear regression equation is Epa (V) = 0.0208 ln v (V s1) + 0.9594 (R = 0.9997). According to Laviron’s theory [34], α was assumed as 0.5 for a totally irreversible electrode reaction process [35]. In this work, RT/(αnF) is equal to 0.0208, the calculated number of electrons is about 2.0, which was in accordance with, and exactly the same as, the currently accepted electrooxidation mechanism of vanillin [14,15,16].

3.5. Chronocoulometry Study

The electrochemically effective surface areas of the bare GCE and Cu2O NPs-ERGO/GCE was investigated and compared by chronocoulometry using 0.1 mM K3[Fe(CN)6] as model complex. The plots of Qt and Qt1/2 were shown in Figure S1 (Electronic Supplementary Material (ESM)). Equation (1) is given by Anson [36] as follows:
Q = 2nFAcD1/2π−1/2t1/2 + Qdl + Qads
Based on this, the surface area of working electrode A could be calculated to be 0.07276 and 0.2362 cm2 for GCE and Cu2O NPs-ERGO/GCE by the slope of the linear relationship between Q and t1/2 (the diffusion coefficient D of K3[Fe(CN)6] is 7.6 × 10⁻⁶ cm2 s−1 [37]). The results showed that the effective surface area of the modified electrode was obviously increased, it would increase the adsorption capacity of vanillin and lead to enhance the current response.
The adsorption capacity Γs of vanillin at Cu2O-ERGO/GCE can also be calculated by chronocoulometry. As depicted in Figure 6, after point-by-point background subtraction, the charge Q was linear with t1/2 with a slope of 1.710 × 10⁻⁵ C s−1/2 and Qads of 1.182 × 10⁻⁵ C. The adsorption capacity Γs was calculated to be 2.59 × 10⁻¹⁰ mol cm−2 according to the equation of Qads = nFAΓs.

3.6. Optimization of Analytical Parameters

3.6.1. Effect of Supporting Electrolytes

The effect of different types of supporting electrolytes on the oxidation peak current of 10 μM vanillin at Cu2O-ERGO/GCE was studied. Phosphate buffer (pH 3.0–8.0), HAc–NaAc buffer (pH 4.0–6.0), HAc–NH4Ac buffer (pH 4.0–6.0), (CH2)6N4–HCl buffer (pH 4.0–6.0), H2SO4, HNO3, HCl, and KCl (each 0.1 M) were tested. It was found that the highest peak current was observed in H2SO4. Furthermore, the effect of different acid concentrations on the oxidation of vanillin was also investigated when the concentrations ranges from 0.01 M to 0.5 M. The results showed that the oxidation peak current of vanillin increased gradually with increasing H2SO4 concentration from 0.01 M to 0.1 M, further beyond the H2SO4 concentration range, the peak current conversely decreased. Consequently, 0.1 M H2SO4 was chosen for the subsequent optimizing experiments as the best supporting electrolyte.

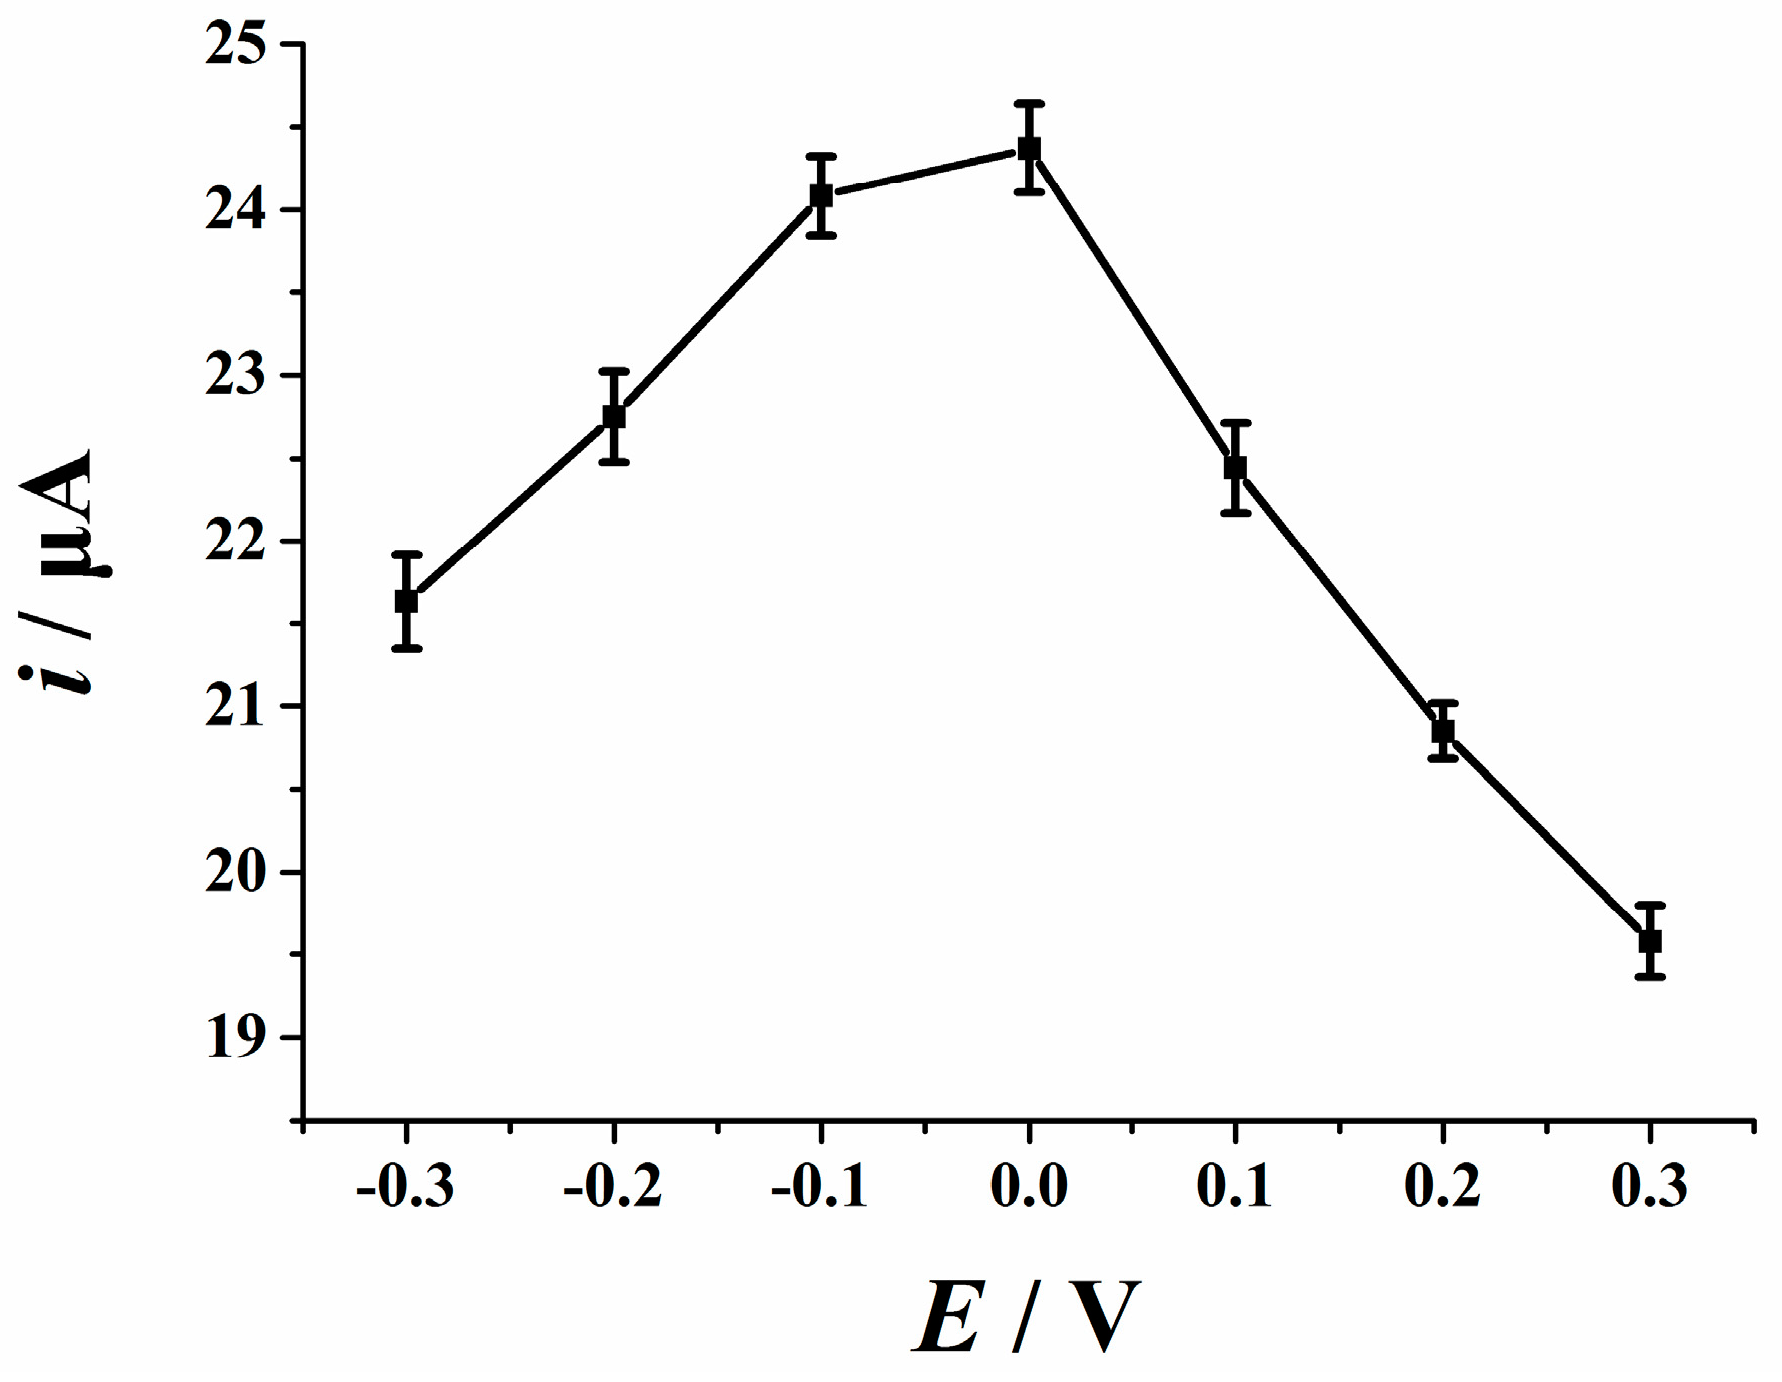
3.6.2. Accumulation Potential and Time

The relationship between peak current and scan rate described in Section 2.3 showed that the rate-determining step is under adsorption control in the process of vanillin oxidation. Therefore, accumulation can enrich the content of vanillin on the surface of the electrode, thus significantly improving the sensitivity of the determination. The oxidation peak currents of 10 μM vanillin at different accumulative potentials were studied and determined by linear scanning voltammetry. Figure 7 demonstrated that when the accumulative potential changed in the range from 0.30 to 0.0 V, the peak current increased significantly, but decreased under more negative accumulation potentials. Therefore, the accumulative potential of 0.0 V was chosen as the best accumulative potential for the determination of vanillin.
The effect of accumulation time on the peak current of vanillin with a fixed accumulation potential of 0.0 V was investigated. As shown in Figure 8, with the extension of the accumulative time, the oxidation peak current of vanillin gradually increases in the 0−90 s range. However, when the accumulative time exceeds 90 s, the oxidation peak current decreases slightly. This phenomenon might be the result of the supersaturated adsorption of vanillin on the electrode surface, resulting in a certain degree of passivation of Cu2O NPs-ERGO/GCE, thus blocking the electron transfer and reducing the response of the modified electrode. Considering two sides of sensitivity and working efficiency, the optimum accumulation time of 90 s was employed.

3.7. Analytic Properties

3.7.1. Repeatability, Reproducibility, and Stability

The repeatability, reproducibility, and stability of the developed sensor were evaluated by second-order derivative linear sweep voltammetry. The most attractive feature with the use of Cu2O NPs-ERGO/GCE for vanillin detection is the easy renewal of electrode surface for the next use. After each measurement, the electrode surface can be renewed by two simple successive voltammetric sweeps from 0.0 V to 1.2 V in 0.1 M potassium biphthalate solution. Seven measurements of 10 μM vanillin on a single electrode yielded a relative standard deviation (RSD) of 1.6% (Table S1 (ESM)). As for the reproducibility (intersensors), six electrodes were fabricated to detect vanillin in the above solution. The RSD was 4.8% (Table S2 (ESM)), indicating that the Cu2O NPs-ERGO/GCE had acceptable reproducibility for analytical applications. The storage stability of the sensor was investigated. The results found that the current response was almost the same by daily use during seven days. After 14 days of storage, only about 7.3% of leakage was found (Table S3 (ESM)).

3.7.2. Interference Studies

To investigate the anti-interference of Cu2O NPs-ERGO/GCE, potential interfering substances were added, such as glucose (1.0 mM), fructose (1.0 mM), sucrose (1.0 mM), ascorbic acid (1.0 mM), citric acid (1.0 mM), oxalic acid (1.0 mM), lactic acid (1.0 mM), tartaric acid (1.0 mM), caffeine (1.0 mM), theophylline (1.0 mM), cholesterol (1.0 mM), and uric acid (0.1 mM), and the results are summarized in Table S4 (ESM). It can be found that no significant interference for the detection of 10 μM vanillin was observed from those compounds. However, because of the very similar nature and chemical structure of ethyl vanillin and vanillin, a one-fold amount of ethyl vanillin showed serious interference. The inorganic ions commonly coexisting in real samples were also tested. The results suggest that 100-fold concentration of K+, Na+, Mg2+, Ca2+, Zn2+, Al3+, Cl, SO42−, and PO43− has no influence on the detection of 10 μM vanillin. The results showed that the sensor has good selectivity for analysis of vanillin and provides feasibility for real sample analysis.

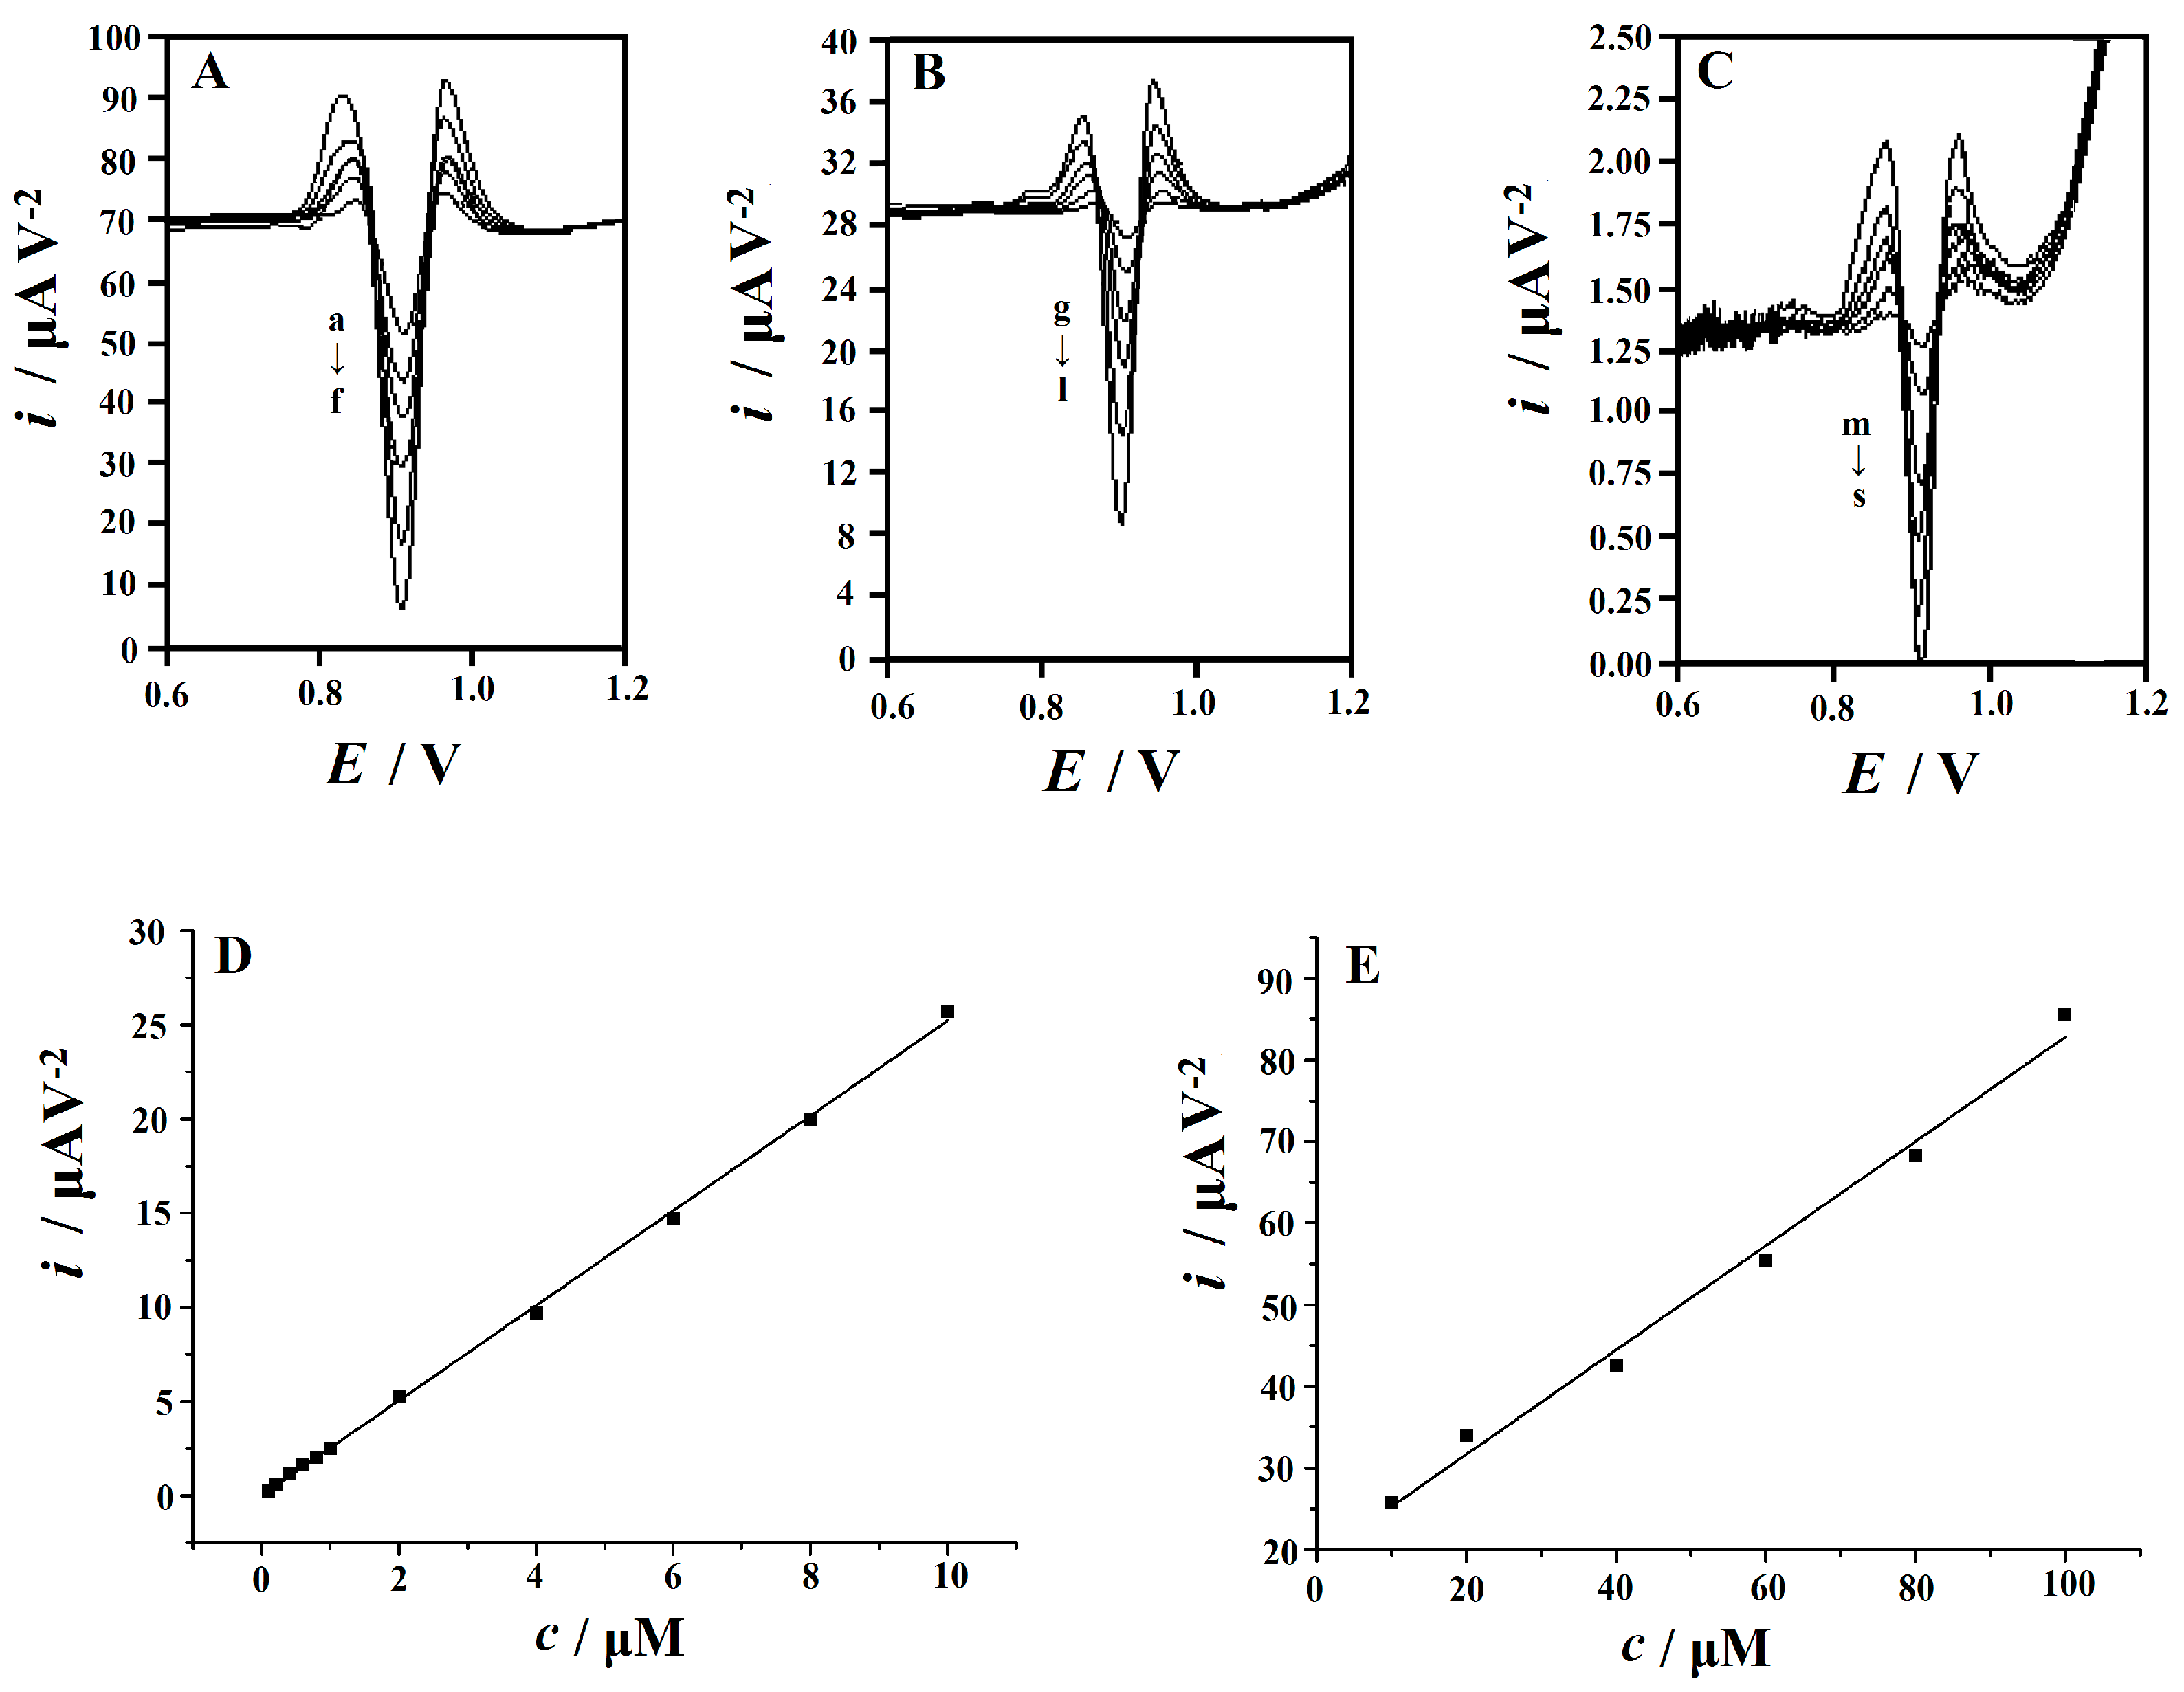
3.7.3. Calibration and Limit of Detection

Figure 9 shows the second-order derivative linear sweep voltammetric curves of various concentrations of vanillin on the Cu2O NPs-ERGO/GCE. The peak current increased linearly with increment of vanillin concentration in the range of 0.1 μM–10 μM and 10 μM–100 μM. The linear regression equation was expressed as i (μA V−2) = 2.5222c (μM) + 0.0076 and i (μA V−2) = 0.6394c (μM) + 18.889 with correlation coefficient R = 0.9995 and 0.9953, respectively. The detection limit was 10 nM (S/N = 3). Table 1 provides a detailed comparison of the properties of different modified electrodes reported for the determination of vanillin. As shown in Table 1, the linear dynamic range reported in our work is wider than most of the previous reports [1,8,9,10,11,14,15]. Although the limit of detection in this work is higher than the Ag-Pd bimetallic nanoparticles-decorated graphene oxide modified glassy carbon electrode (Ag-Pd/GO/GCE) [13] and manganese dioxide nanoflowers-graphene oxide modified glassy carbon electrode [14], this method has made significant progress in simplifying electrode preparation, saving time and reducing costs.

3.7.4. Analytical Applications

In order to evaluate the potential application of this newly-developed method in actual sample analysis, the content of vanillin was determined in different foods such as biscuit, chocolate, candy, and custard. These samples were purchased from a local market and pretreated according to our previous report [16]. Each pretreated sample solution was transferred to a voltammetric cell and analyzed in the day of preparation according to the above-described procedure. Table 2 presented the determination results for four parallel measurements, which were measured by the standard addition method. The recoveries of vanillin standard added into the samples were in the range of 96.3–101.2%, indicating that this method has good accuracy. For comparison, high performance liquid chromatography (HPLC) was used as a reference method to determine the content of vanillin in these samples. As displayed in Table 2, the results obtained by this method are the same as those obtained by HPLC method. The results proved that the modified electrode has good analytical performance and can be a feasible sensor for detecting vanillin in commercial food samples.

4. Conclusions

In this work, a homogeneous dispersion was obtained by dispersing cuprous oxide nanoparticles into graphene oxide solution, and a uniform cast film of Cu2O NPs-ERGO was achieved via electroreduction method. Compared with bare GCE and ERGO/GCE, the oxidation peak current of vanillin was significantly increased and the oxidation overpotential was decreased at the Cu2O NPs-ERGO/GCE. The electrochemical behavior of vanillin on the modified electrode is an absorption-controlled process, involving two electrons with two proton transfers. The peak current was linearly related to the concentration of vanillin, ranging from 0.1 μM–10 μM and 10 μM–100 μM, and the detection limit was 10 nM (S/N = 3). The prepared Cu2O NPs-ERGO/GCE not only had strong catalytic activity for vanillin oxidation, but also provided significant quantitatively reproducible analytical performance. This newly developed method has some obvious advantages such as simplicity, quick response, high sensitivity, and low cost.

Supplementary Materials

The following are available online at https://www.mdpi.com/1424-8220/18/9/2762/s1.

Author Contributions

J.N. and J.W. conceived and designed the experiments; J.N., X.L. and M.W. performed the experiments; D.L., J.N., and J.W. analyzed the data; J.N., Q.H., and J.W. contributed reagents/materials/analysis tools; J.N. and Q.H. wrote the paper; All authors read and approved the final manuscript.

Funding

The work was supported by the NSFC (No. 21505005 and 61703152), Hunan Provincial Natural Science Foundation (No. 2018JJ2424 and 2018JJ3134), the National Key R&D Program of China (2017YFC1600306), and the Huxiang Youth Talent Support Program (2015RS4051), the key Project of Department of Education of Guangdong Province (2016GCZX008) and Project of Science and Technology Plan in Zhuzhou (201706-201806).

Conflicts of Interest

The authors declare no conflict of interest.

References

  1. Yardım, Y.; Gülcan, M.; Sentürk, Z. Determination of vanillin in commercial food product by adsorptive stripping voltammetry using a boron-doped diamond electrode. Food Chem. 2013, 141, 1821–1827. [Google Scholar] [CrossRef] [PubMed]
  2. Waliszewski, K.N.; Pardio, V.T.; Ovando, S.L. A simple and rapid HPLC technique for vanillin determination in alcohol extract. Food Chem. 2006, 101, 1059–1062. [Google Scholar] [CrossRef]
  3. Goodner, K.L.; Jella, P.; Rouseff, R.L. Determination of vanillin in orange, grapefruit, tangerine, lemon, and lime juices using GC–Olfactometry and GC–MS/MS. J. Agric. Food Chem. 2000, 48, 2882–2886. [Google Scholar] [CrossRef] [PubMed]
  4. Gerasimov, A.V.; Gornova, N.V.; Rudometova, N.V. Determination of vanillin and ethylvanillin in vanilla flavorings by planar (thin-layer) chromatography. J. Anal. Chem. 2003, 58, 677–684. [Google Scholar] [CrossRef]
  5. Ohashi, M.; Omae, H.; Hashida, M.; Sowa, Y.; Imai, S. Determination of vanillin and related flavor compounds in cocoa drink by capillary electrophoresis. J. Chromatogr. A 2007, 1138, 262–267. [Google Scholar] [CrossRef] [PubMed]
  6. Ni, Y.; Zhang, G.; Kokot, S. Simultaneous spectrophotometric determination of maltol, ethyl maltol, vanillin and ethyl vanillin in foods by multivariate calibration and artificial neural networks. Food Chem. 2005, 89, 465–473. [Google Scholar] [CrossRef]
  7. Timotheou-Potamia, M.; Calokerinos, A.C. Chemiluminometric determination of vanillin in commercial vanillin products. Talanta 2007, 71, 208–212. [Google Scholar] [CrossRef] [PubMed]
  8. Shang, L.; Zhao, F.; Zeng, B. Sensitive voltammetric determination of vanillin with an AuPd nanoparticlesgraphene composite modified electrode. Food Chem. 2014, 151, 53–57. [Google Scholar] [CrossRef] [PubMed]
  9. Zheng, D.; Hu, C.; Gan, T.; Dang, X.; Hu, S. Preparation and application of a novel vanillin sensor based on biosynthesis of Au–Ag alloy nanoparticles. Sens. Actuators B 2010, 148, 247–252. [Google Scholar] [CrossRef]
  10. Bettazzi, F.; Palchetti, I.; Sisalli, S.; Mascini, M. A disposable electrochemical sensor for vanillin detection. Anal. Chim. Acta 2006, 555, 134–138. [Google Scholar] [CrossRef]
  11. Peng, J.; Hou, C.; Hu, X. A graphene-based electrochemical sensor for sensitive detection of vanillin. Int. J. Electrochem. Sci. 2012, 7, 1724–1733. [Google Scholar]
  12. Kong, D.; Shen, S.; Yu, H.; Wang, J.; Chen, N. Chemical modification of multi-walled carbon nanotubes by tetraaminophthalocyaninatocobalt for the electrocatalytic oxidation of vanillin. Chin. J. Inorg. Chem. 2010, 26, 817–821. [Google Scholar]
  13. Li, J.; Feng, H.; Li, J.; Jiang, J.; Feng, Y.; He, L.; Qian, D. Bimetallic Ag-Pd nanoparticles-decorated graphene oxide: A fascinating three-dimensional nanohybrid as an efficient electrochemical sensing platform for vanillin determination. Electrochim. Acta 2015, 176, 827–835. [Google Scholar] [CrossRef]
  14. Huang, L.; Hou, K.; Jia, X.; Pan, H.; Du, M. Preparation of novel silver nanoplates/graphene composite and their application in vanillin electrochemical detection. Mater. Sci. Eng. C 2014, 38, 39–45. [Google Scholar] [CrossRef] [PubMed]
  15. Gan, T.; Shi, Z.; Deng, Y.; Sun, J.; Wang, H. Morphology-dependent electrochemical sensing properties of manganese dioxide–graphene oxide hybrid for guaiacol and vanillin. Electrochim. Acta 2014, 147, 157–166. [Google Scholar] [CrossRef]
  16. Deng, P.; Xu, Z.; Zeng, R.; Ding, C. Electrochemical behavior and voltammetric determination of vanillin based on an acetylene black paste electrode modified with graphene–polyvinylpyrrolidone composite film. Food Chem. 2015, 180, 156–163. [Google Scholar] [CrossRef] [PubMed]
  17. Ratinac, K.R.; Yang, W.; Gooding, J.J.; Thordarson, P.; Braet, F. Graphene and related materials in electrochemical sensing. Electroanalysis 2011, 23, 803–826. [Google Scholar] [CrossRef]
  18. Yang, J.; Strickler, J.R.; Gunasekaran, S. Indium tin oxide-coated glass modified with reduced graphene oxide sheets and gold nanoparticles as disposable working electrodes for dopamine sensing in meat samples. Nanoscale 2012, 4, 4594–4602. [Google Scholar] [CrossRef] [PubMed]
  19. Rossmeisl, J.; Qu, Z.-W.; Zhu, H.; Kroes, G.-J.; Nørskov, J.K. Electrolysis of water on oxide surfaces. J. Electroanal. Chem. 2007, 607, 83–89. [Google Scholar] [CrossRef]
  20. Xu, F.; Deng, M.; Li, G.; Chen, S.; Wang, L. Electrochemical behavior of cuprous oxide–reduced graphene oxide nanocomposites and their application in nonenzymatic hydrogen peroxide sensing. Electrochim. Acta 2013, 88, 59–65. [Google Scholar] [CrossRef]
  21. Li, Y.; Zhong, Y.; Zhang, Y.; Weng, W.; Li, S. Carbon quantum dots/octahedral Cu2O nanocomposites for non-enzymatic glucose and hydrogen peroxide amperometric sensor. Sens. Actuators B 2015, 206, 735–743. [Google Scholar] [CrossRef]
  22. Cao, H.; Yang, A.; Li, H.; Wang, L.; Li, S.; Kong, J.; Bao, X.; Yang, R. A non-enzymatic glucose sensing based on hollow cuprous oxidenanospheres in a Nafion matrix. Sens. Actuators B 2015, 214, 169–173. [Google Scholar] [CrossRef]
  23. Yuan, B.; Xu, C.; Liu, L.; Zhang, Q.; Ji, S.; Pi, L.; Zhang, D.; Huo, Q. Cu2O/NiOx/graphene oxide modified glassy carbon electrode for the enhanced electrochemical oxidation of reduced glutathione and nonenzyme glucose sensor. Electrochim. Acta 2013, 104, 78–83. [Google Scholar] [CrossRef]
  24. Zhang, F.; Li, Y.; Gu, Y.; Wang, Z.; Wang, C. One-pot solvothermal synthesis of a Cu2O/Graphene nanocomposite and its application in an electrochemical sensor for dopamine. Microchim. Acta 2011, 173, 103–109. [Google Scholar] [CrossRef]
  25. He, Q.; Liu, J.; Liu, X.; Li, G.; Deng, P.; Liang, J. Preparation of Cu2O-Reduced Graphene Nanocomposite Modified Electrodes towards Ultrasensitive Dopamine Detection. Sensors 2018, 18, 199. [Google Scholar] [CrossRef] [PubMed]
  26. He, Q.; Liu, J.; Liu, X.; Li, G.; Chen, D.; Deng, P.; Liang, J. Fabrication of Amine-Modified Magnetite-Electrochemically Reduced Graphene Oxide Nanocomposite Modified Glassy Carbon Electrode for Sensitive Dopamine Determination. Nanomaterials 2018, 8, 194. [Google Scholar] [CrossRef] [PubMed]
  27. Ye, X.; Gu, Y.; Wang, C. Fabrication of the Cu2O/polyvinyl pyrrolidone-graphene modified glassy carbon-rotating disk electrode and its application for sensitive detection of herbicide paraquat. Sens. Actuators B 2012, 173, 530–539. [Google Scholar] [CrossRef]
  28. Zhang, X.; Wang, G.; Gu, A.; Wu, H.; Fang, B. Preparation of porous Cu2O octahedron and its application as L-Tyrosine sensors. Solid State Commun. 2008, 148, 525–528. [Google Scholar] [CrossRef]
  29. Shishiyanu, S.T.; Shishiyanu, T.S.; Lupan, O.I. Novel NO2 gas sensor based on cuprous oxide thin films. Sens. Actuators B 2006, 113, 468–476. [Google Scholar] [CrossRef]
  30. He, Q.; Liu, J.; Liang, J.; Liu, X.; Li, W.; Liu, Z.; Ding, Z.; Tuo, D. Towards Improvements for Penetrating the Blood–Brain Barrier—Recent Progress from a Material and Pharmaceutical Perspective. Cells 2018, 7, 24. [Google Scholar] [CrossRef] [PubMed]
  31. Deng, P.; Xu, Z.; Feng, Y. Acetylene black paste electrode modified with graphene as the voltammetric sensor for selective determination of tryptophan in the presence of high concentrations of tyrosine. Mater. Sci. Eng. C 2014, 35, 54–60. [Google Scholar] [CrossRef] [PubMed]
  32. Li, Y.; Long, H.; Zhou, F. Determination of trace tin by catalytic adsorptive cathodic stripping voltammetry. Anal. Chim. Acta 2005, 554, 86–91. [Google Scholar] [CrossRef]
  33. Li, Y.; Xie, H.; Zhou, F. Alizarin violet modified carbon paste electrode for the determination of trace silver(I) by adsorptive voltammetry. Talanta 2005, 67, 28–33. [Google Scholar] [CrossRef] [PubMed]
  34. Laviron, E. Adsorption, autoinhibition and autocatalysis in polarography and in linear potential sweep voltammetry. J. Electroanal. Chem. Interfacial Electrochem. 1974, 52, 355–393. [Google Scholar] [CrossRef]
  35. Yin, H.; Cui, L.; Chen, Q.; Shi, W.; Ai, S.; Zhu, L.; Lu, L. Amperometric determination of bisphenol A in milk using PAMAM–Fe3O4 modified glassy carbon electrode. Food Chem. 2011, 125, 1097–1103. [Google Scholar] [CrossRef]
  36. Anson, F. Application of potentiostatic current integration to the study of the adsorption of cobalt(III)-(ethylenedinitrilo tetraacetate) on mercury electrodes. Anal. Chem. 1964, 36, 932–934. [Google Scholar] [CrossRef]
  37. Adams, R. Electrochemistry at Solid Electrodes; Marcel Dekker: New York, NY, USA, 1969. [Google Scholar]
Scheme 1. The synthesis of Cuprous oxide (Cu2O) nanoparticles. PVP—polyvinyl pyrrolidone. (R.T.: Room Temperature).
Sensors 18 02762 sch001
Figure 1. Scanning electron microscopy (SEM) images of (A) GO and (B) cuprous oxide functionalized electroreduced graphene oxide (Cu2O-ERGO) nanocomposite.
Sensors 18 02762 g001
Figure 2. Cyclic voltammograms of 5 mM K3[Fe(CN)6] in 1.0 M KCl for different electrodes: (a) bare glassy carbon electrode (GCE), (b) Cu2O/GCE, (c) GO/GCE, (d) ERGO/GCE, and (e) Cu2O-ERGO/GCE. Scan rate: 0.1 V s−1.
Sensors 18 02762 g002
Figure 3. Second-order derivative linear sweep voltammograms of 10 μM vanillin in 0.1 M H2SO4 solution obtained at different electrodes: (a) GCE, (b) GO/GCE, (c) Cu2O nanoparticles (NPs)/GCE, (d) Cu2O NPs-GO/GCE, (e) ERGO/GCE, and (f) Cu2O NPs-ERGO/GCE. Accumulation potential: 0.0 V, accumulation time: 90 s, scan rate: 0.1 V s−1.
Sensors 18 02762 g003
Figure 4. Cyclic voltammetry (CV) curves obtained at Cu2O NPs-ERGO/GCE in the absence of vanillin (curve a) and in the presence of 10 μM vanillin in 0.1 M H2SO4. (Curve bd: continuous sweep cycles, bd: 1st–3rd).
Sensors 18 02762 g004
Figure 5. (A) CV curves of 10 μM vanillin at Cu2O NPs-ERGO/GCE with different scan rates in 0.1 M H2SO4. From inner to outer: 0.02, 0.04, 0.06, 0.08, 0.10, 0.12, 0.14, 0.16, 0.18, and 0.20 V s−1, respectively; the plots for (B) the dependence of peak currents (ipa) on the scan rates (v) and (C) the relationship between peak potentials (Epa) and Neperian logarithms of scan rates (ln v).
Sensors 18 02762 g005
Figure 6. (A) Chronocoulometric curves for Cu2O-ERGO/GCE in 0.1 M H2SO4 solution in absence of (a) and in present of (b) 0.1 mM vanillin. (B) Plot of Qt1/2 derived from chronocoulometric curves for Cu2O-ERGO/GCE (background subtracted).
Sensors 18 02762 g006
Figure 7. The effects of accumulation potential on the oxidation of 10 µM vanillin in 0.1 M H2SO4 solution at Cu2O NPs-ERGO/GCE. Accumulation time: 90 s, scan rate: 0.1 V s−1. Error bars represent SD, n = 3.
Sensors 18 02762 g007
Figure 8. The effects of accumulation time on the oxidation of 10 µM vanillin in 0.1 M H2SO4 solution at Cu2O NPs-ERGO/GCE. Accumulation potential: 0.0 V, scan rate: 0.1 V s−1. Error bars represent SD, n = 3.
Sensors 18 02762 g008
Figure 9. Second-order derivative linear scan voltammograms obtained at Cu2O-ERGO/GCE in 0.1 M H2SO4 solution containing different concentrations of vanillin. (A) From a to f: 10, 20, 40, 60, 80, 100 μM; (B) From g to l: 1, 2, 4, 6, 8, 10 μM; (C) from m to s: 0.1, 0.2, 0.4, 0.6, 0.8, 1.0 μM; (D) plot of the oxidation peak currents as a function of vanillin concentrations: 0.1−10 μM (E); plot of the oxidation peak currents as a function of vanillin concentrations: 10–100 μM. Accumulation potential: 0.0 V, accumulation time: 90 s, scan rate: 0.1 V s−1.
Sensors 18 02762 g009
Table 1. Comparison with other electrochemical methods for the determination of vanillin.
Electrochemical SensorsTechniqueSupporting ElectrolyteLinear Range/μMCorrelation
Coefficient
Sensitivity
(μA/μM)
Detection Limit/μMReferences
a BDD electrodei SWV0.1 M PBS, pH 2.53.3–980.9990.5984 (μA mL μg−1)0.16[1]
b AuPd-graphene/GCEj DPV0.1 M PBS, pH 7.00.1−7 and 10−400.996 and 0.9990.113 and 0.01250.02[2]
c CDA/Au–AgNPs/GCEAmperometry0.1 M PBS, pH 2.00.2−50--0.04[9]
disposable screen-printed electrodeSWV0.1 M PBS, pH 7.45−4000.99940.02650.4[10]
graphene/GCEDPVNa2HPO4
C6H8O7 buffer, pH 5.0
0.6−480.99960.15230.056[11]
d MWCNTs-TAPcCo/GCESWV0.1 M PBS, pH 7.24.2−50000.99930.047250.44[12]
e Ag-Pd/GO/GCEDPV0.1 M PBS, pH 6.00.02–450.99330.57330.005[13]
f Ag NPs/GN/GCESWV0.1 M PBS, pH 6.982−1000.9980.9590.332[14]
g MFG/GCEDPVB–R buffer
(pH 1.81)
0.03−80.9950.57330.0015[15]
h GR-PVP/ABPEDerivative Voltammetry0.1 M H3PO40.02−2.0,
2.0−40,
40−100
0.9985,
0.9959,
0.9985
0.1714;
0.0805;
0.0269
0.01[16]
Cu2O-ERGO/GCEDerivative Voltammetry0.1 M H2SO40.1−10; 10−1000.9995
0.9953
2.5222; 0.63940.01This work
a Boron-doped diamond electrode; b Au-Pd nanoparticles−graphene composite modified glassy carbon electrode; c cellulose diacetate/Au–Ag alloy nanoparticlesmodified glassy carbon electrode; d multi-walled carbon nanotubes chemically modified by 2,9,16,23-tetraaminophthalocyaninatocobalt modified glassy carbon electrode; e Ag-Pd bimetallic nanoparticles–decoratedgraphene oxide modified glassy carbon electrode; f novel silver nanoplates/graphene compositemodified glassy carbon electrode; g manganese dioxidenanoflowers–graphene oxidemodified glassy carbon electrode; h graphene–polyvinylpyrrolidone composite filmmodified glassy carbon electrode; i square-wave voltammetry; j differential pulse voltammetry.
Table 2. Determination of vanillin in food samples (n = 4). HPLC—high performance liquid chromatography.
Sample aFound b/μMAdded/μMTotal Found b/μMRecovery/%Content b/μg g−1Content Determined by HPLC b/μg g−1
Biscuit0.84(±0.04)0.801.61(±0.03)96.325.56(±1.10)25.34 (±1.24)
Chocolate6.18(±0.24)6.0012.25(±0.11)101.2188.04(±7.17)187.81 (±6.86)
Candy1.27(±0.06)1.002.25(±0.17)98.038.64(±1.72)38.95(±1.54)
custard5.32(±0.22)5.0010.16(±0.47)96.8161.87(±6.69)161.52 (±5.70)
a All samples were collected from local supermarkets. b Average ± confidence interval, the confidence level is 95%.

