2. Materials and Methods
The method proposed for stand-off detection of alcohol in the air exhaled by humans is based on the absorption of a monochromatic electromagnetic radiation (laser beam) tuned to the absorption band of the alcohol.
Intensity of the radiation beam that goes through an absorbing medium
(with no saturation) can be described by Beer–Lamber law in the following form:
where:
(W)—intensity of the beam entering the medium.
(dm3∙g−1∙cm−1)—volume-mass absorption coefficient of the medium.
(g∙dm−3)—mass concentration of the medium.
(cm)—thickness of the medium.
(Hz)—frequency of radiation.
If the absorbing medium is the alcohol exhaled by a person its mass concentration is spatially inhomogeneous and it changes with time , thus , where and are space coordinates.
Usually the laser beam cross section is much smaller than the absorbing medium. Thus, the mass concentration of the medium can be considered as constant in
plane perpendicular to the propagation direction of the beam
and
can be replaced by
. The average mass concentration of the medium
can be expressed as:
Thus, the Equation (1) takes the form:
To eliminate the impact of the environment on the intensity of the laser beam absorbed by the medium, a second laser beam with wavelength close to but outside of the absorption band of the absorbing medium should be applied. The intensities of both laser beams that go through the absorbing medium
(monitoring beam) and
(reference beam) can be expressed as:
where:
(W)—intensity of the monitoring beam entering the medium.
(W)—intensity of the reference beam entering the medium.
(dm3∙g−1∙cm−1)—volume-mass absorption coefficient of the medium for the monitoring beam.
(dm3∙g−1∙cm−1)—volume-mass absorption coefficient of the medium for the reference beam.
To effectively compare the transmission of the laser beams by the absorbing medium, the intensities of both beams entering the medium should be the same. Such situation can be achieved by normalization of
to
. Thus, the expression for normalized
can be written as:
where:
Working with a linear detector, the intensities
and
can be replaced by generated signals
and
. Thus normalized
and
can be described by the following equations:
where:
The coefficient can be determined by measuring and without the absorbing medium. Then, and , hence .
To effectively detect the alcohol in exhaled air the relative difference of the signals
and
can be utilized and for laser sources characterized by high long-term power stability it can be expressed as:
In case if there is no alcohol and , however if there is alcohol and . For a given concentration of alcohol the value of can be increased by increasing applying lasers operating at appropriate wavelengths or by increasing applying multiple transition of the laser beams through the absorbing medium.
The problem is that in real environment the concentration changes very much in time which is caused by the exhalation and gusts of air. The changes are stochastic and, because of exponential relation, have strong impact on . A stable situation is only possible when . However, the fluctuations of can be utilized to detect the alcohol in exhaled air. From Equation (11) the value of depends on , thus the higher fluctuation of the higher fluctuations of . In turn, fluctuations of depend on alcohol concentration in the exhaled air and are higher for higher alcohol concentration. The value of fluctuation of for subsequent measurements can be expressed by its standard deviation . Thus, for higher alcohol concentration one can expect higher .
Lasers available on the market, that can be used for the described application, are usually characterized by limited long-term power stability. It leads to the situation when the coefficient
, determined at the beginning of the measurements for a situation without the absorbing medium, becomes invalid with the passing of time. Thus, the relative difference of the signals
, calculated using Equation (11) is incorrect. The problem can be solved by replacing the coefficient
by
according to the following equation:
and are signals and measured and averaged over a period in which the changes of the laser power are small in comparison to the changes of alcohol concentration (alcohol concentration changes should be faster than laser power changes).
Therefore, the normalized signal from the detector
can be written as:
Therefore, the relative difference of the signals
and
, for subsequent measurements in the defined period, can be expressed as:
Because the value of are determined for signals and that can be measured with the presence of absorbing medium the value of can be positive as well as negative for different measurements (oscillates around zero). However, the changes of the concentration still have the impact on it as in case of Equation (11). It means that the standard deviation of the distribution of , for subsequent measurements in the defined period, can be utilized to detect the alcohol in the exhaled air.
3. Experiment and Results
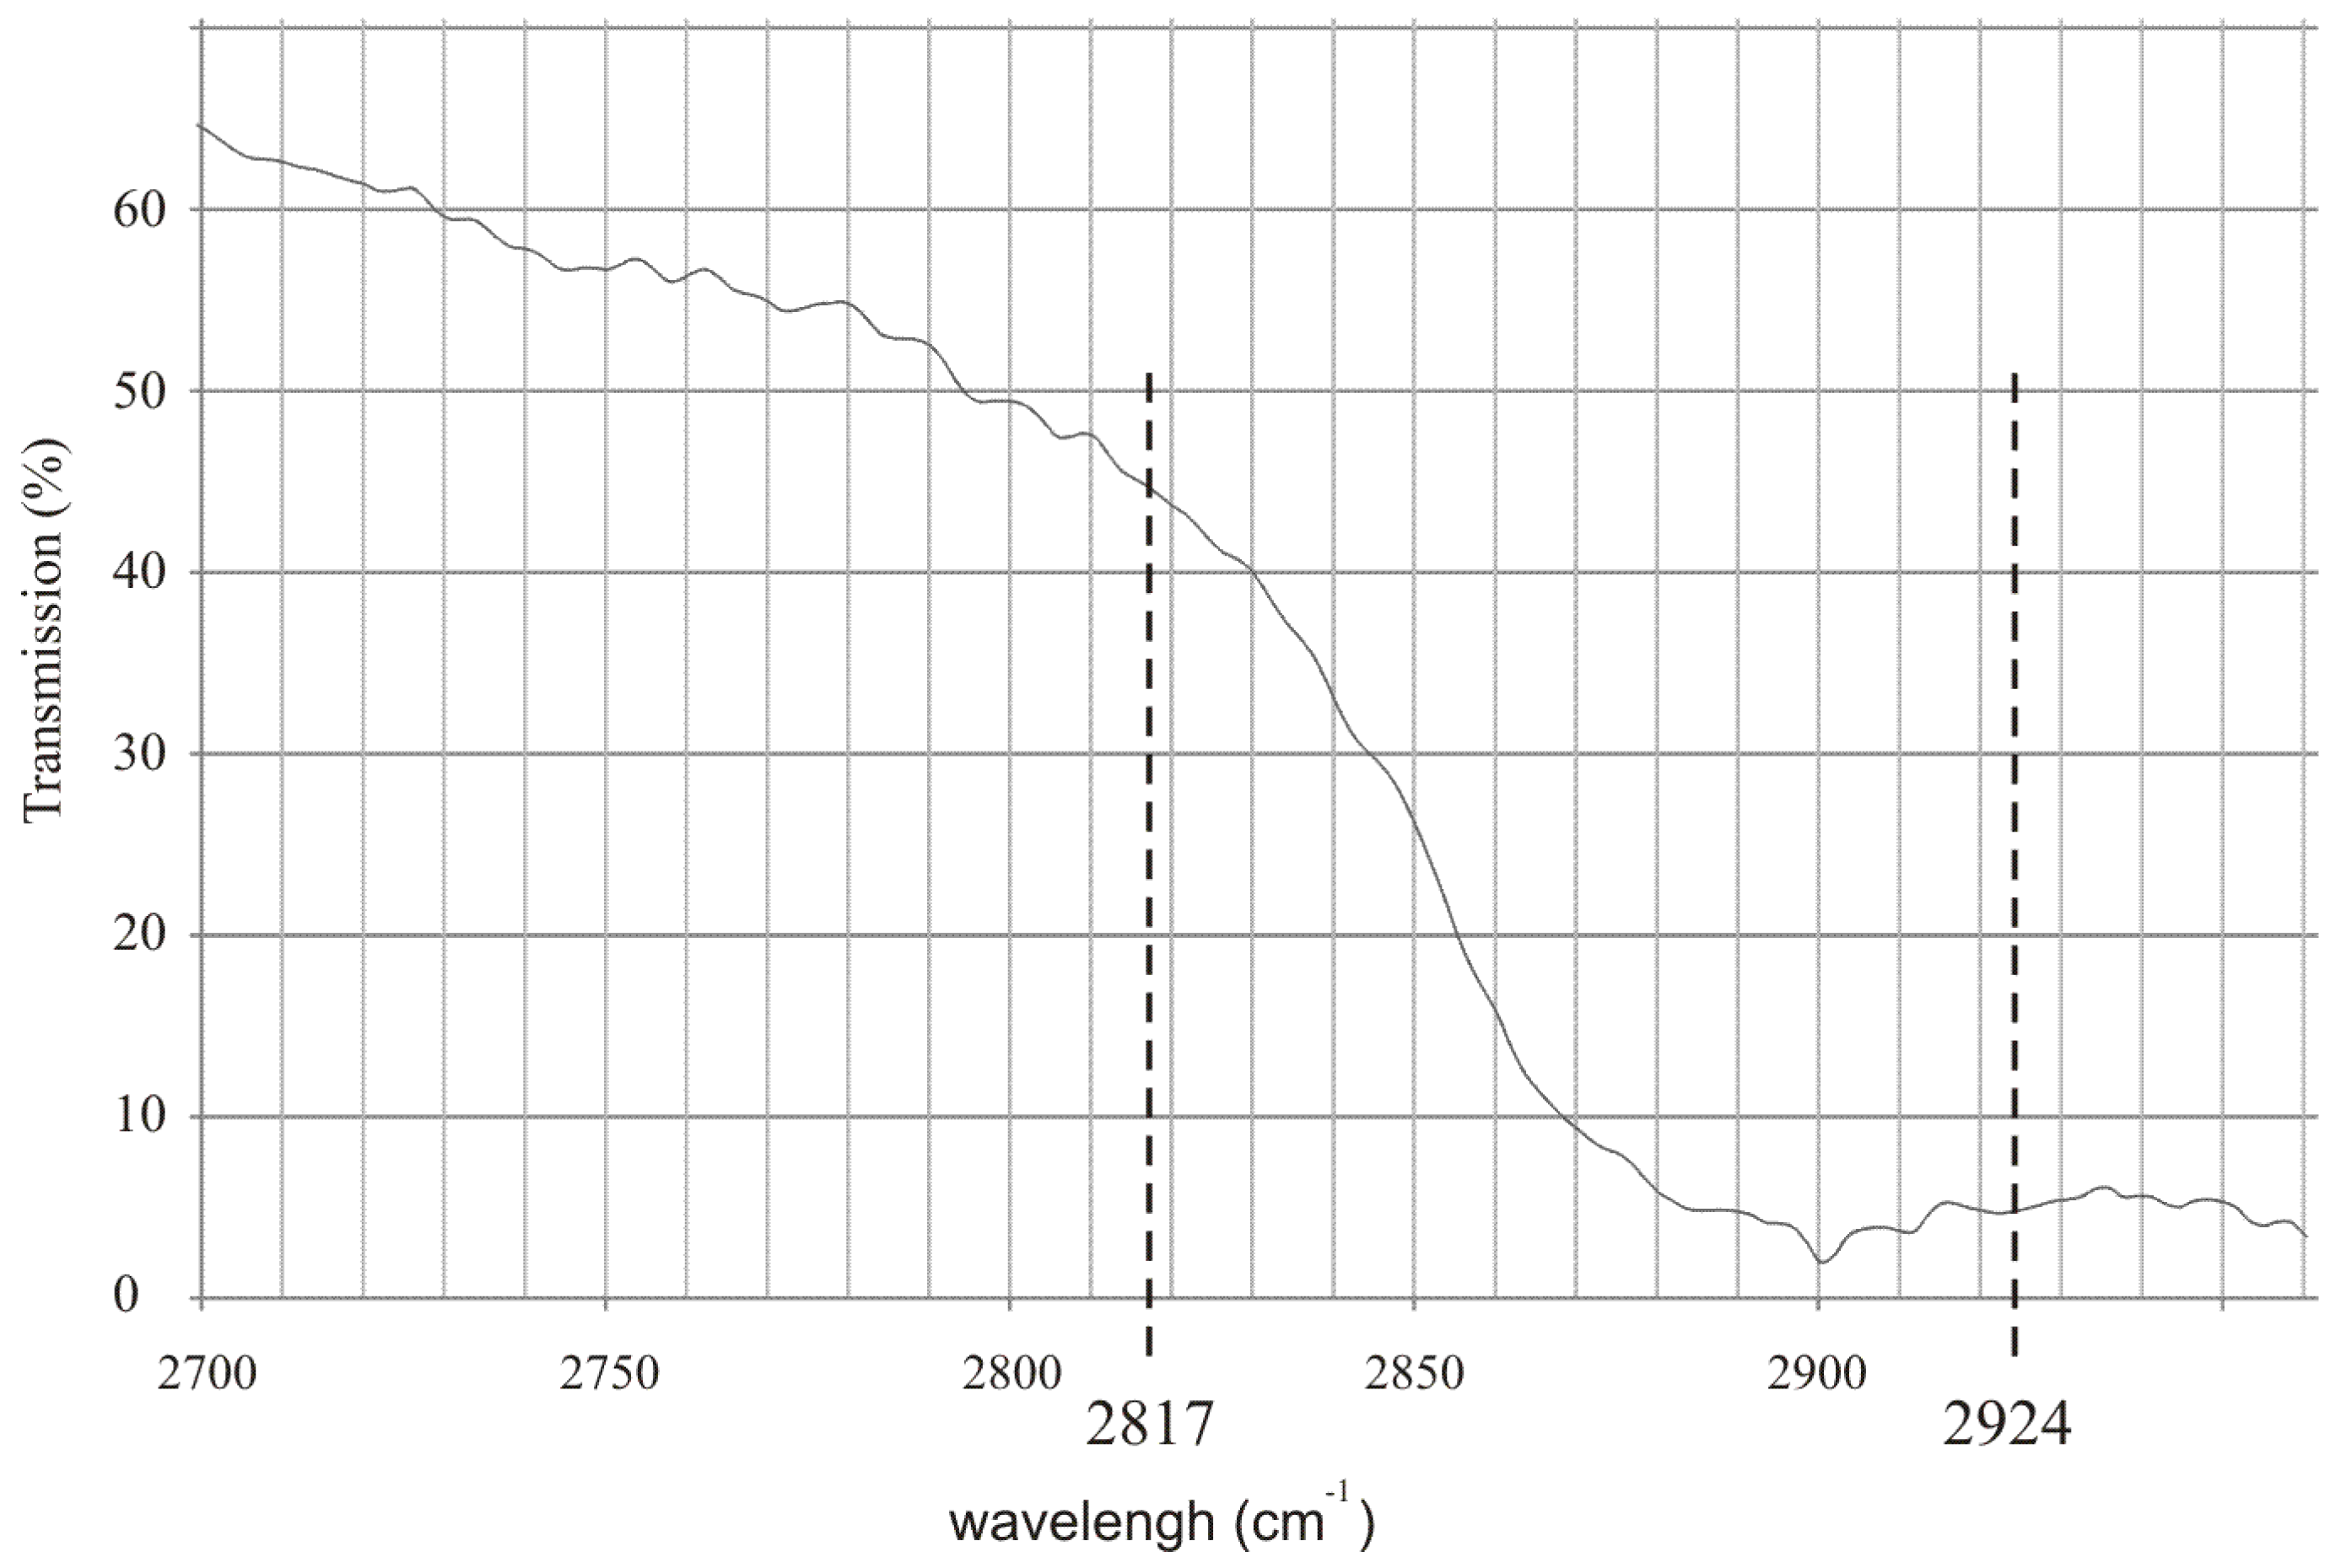
To effectively detect alcohol in the exhaled air, lasers that operate at appropriate wavelengths must be selected. Commercially available inter-band cascade lasers operating at 3.42 µm (2924 cm
−1) and 3.55 µm (2817 cm
−1) seem to be an excellent choice. In
Figure 1 the experimental transmission spectrum of the rectified spirit along with the wavelengths of the mentioned lasers are presented. It is shown that the difference between absorption coefficient of the alcohol at both wavelengths is relatively high which is desirable for effective detection.
The experimental setup used for investigation of alcohol detection in the air exhaled by humans is presented in
Figure 2. The radiation beam from the laser source was directed by the plane mirror
(diameter 12.7 mm) to the multiple reflection system consisting of seven small plane mirrors
(diameter 12.7 mm) and one big concave mirror
(diameter 40 mm, focal length 6 m). The mirrors
were mounted on the disc
and could be independently adjusted. After 16 transitions through the multiple reflection system the beam was reflected by the plane mirror
(diameter 12.7 mm) and was absorbed by the detector
. The signals from the detector were transmitted to the data analysis unit consisting of a custom-built electronic board and a computer. The air containing alcohol was blown into the multiple reflection system by the simulator of a drunken person that consisted of an air pump and a cistern containing a water solution of alcohol. The pump pumped the air of volume 0.5 l with a frequency of 20 times per minute through the cistern. The air going out from the cistern contained alcohol vapors with concentration that depended on the concentration of alcohol in water solution. The exact value of the alcohol vapors concentration was measured by a commercially available professional breathalyzer A2.0/04 produced by AWAT company (Warsaw, Poland).
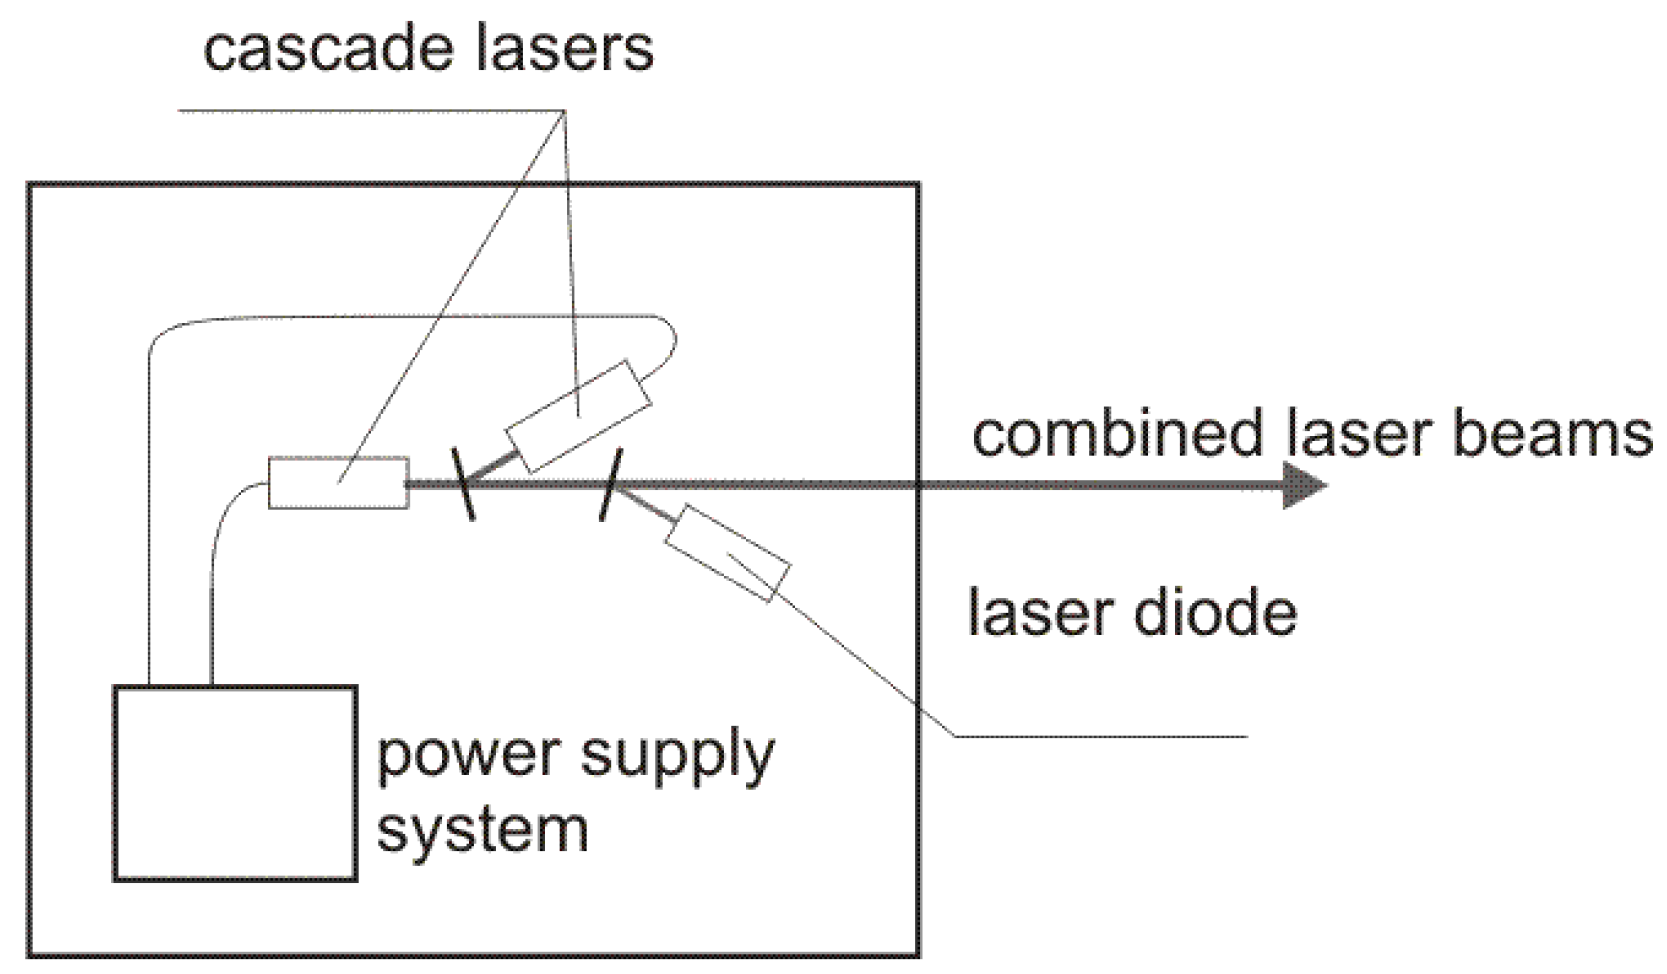
The diagram of the laser source is presented in
Figure 3. Two inter-band cascade lasers IF3420CM1 i IF3550CM1 operating at 3.42 µm and 3.55 µm wavelength with output power of ~20 mW developed by Thorlabs (Newton, NJ, USA) were used. The lasers were modulated with the frequency of 50 and 80 kHz, respectively. The duty cycle of the modulation was 50%. The beams of the cascade lasers were combined into one single beam by a plane-parallel plate. To enable an effective alignment of the experimental setup a laser diode operating at red wavelength was also integrated into the laser source by second plane-parallel plate.
A custom-built detector HgCdTe developed by VIGO System (Warsaw, Poland) was used. The signal from the detector was transmitted to the custom-built electronic board developed by INTSOL (Warsaw, Poland) company where it was sampled with the frequency of 1.25 GHz. Every 5 ms the signal with the same period of 5 ms was analyzed by a computer (FFT analysis) and the amplitudes at the lasers modulation frequency were calculated. The values of these amplitudes were registered by the computer in the period of 3.5 s giving 700 different values of the amplitudes for each laser.
The main experiment was preceded by investigation of the laser power stability of the cascade lasers. Every minute 700 values of the amplitudes of the signal at the lasers modulation frequency were calculated and averaged. The results are presented in
Table 1 where
and
are averaged amplitudes of the signal for lasers operating at 3.42 µm and 3.55 µm, respectively. The values are expressed in relative units (r.u.) using only 8 significant digits. These values are proportional to the signals from the detector.
Relatively slight changes of the laser powers may seem to be negligible for most applications, however for the detection of slight changes of the alcohol vapor transmission they may be indeed important.
In the experiment four water solution with different concentration of alcohol were investigated. The exact concentration of alcohol was measured by the breathalyzer. For each alcohol concentration three independent measurements, when the alcohol vapors were blown into the multiple reflection system, were done. To determine the
coefficient, before each measurement, additional three measurements when the alcohol vapours were not blown into the multiple reflection system were carried out. The results are presented in
Table 2, where numbers 01, 02 and 03 represent the results without the alcohol vapors while numbers 1, 2 and 3 represent the results with the alcohol vapors. The symbols in the table represent:
c—concentration of alcohol vapors in the air blown into the multiple reflection system.
—amplitude averaged over 700 values for laser operating at 3.42 µm wavelength.
—amplitude averaged over 700 values for laser operating at 3.55 µm wavelength.
—calculated for the situation when the alcohol vapors were not blown into the multiple reflection system.
—relative difference of the amplitudes calculated according to Equation (11) and averaged over 700 values.
—value of averaged over three measurements.
—standard deviation of .
—relative standard deviation of for three measurements.
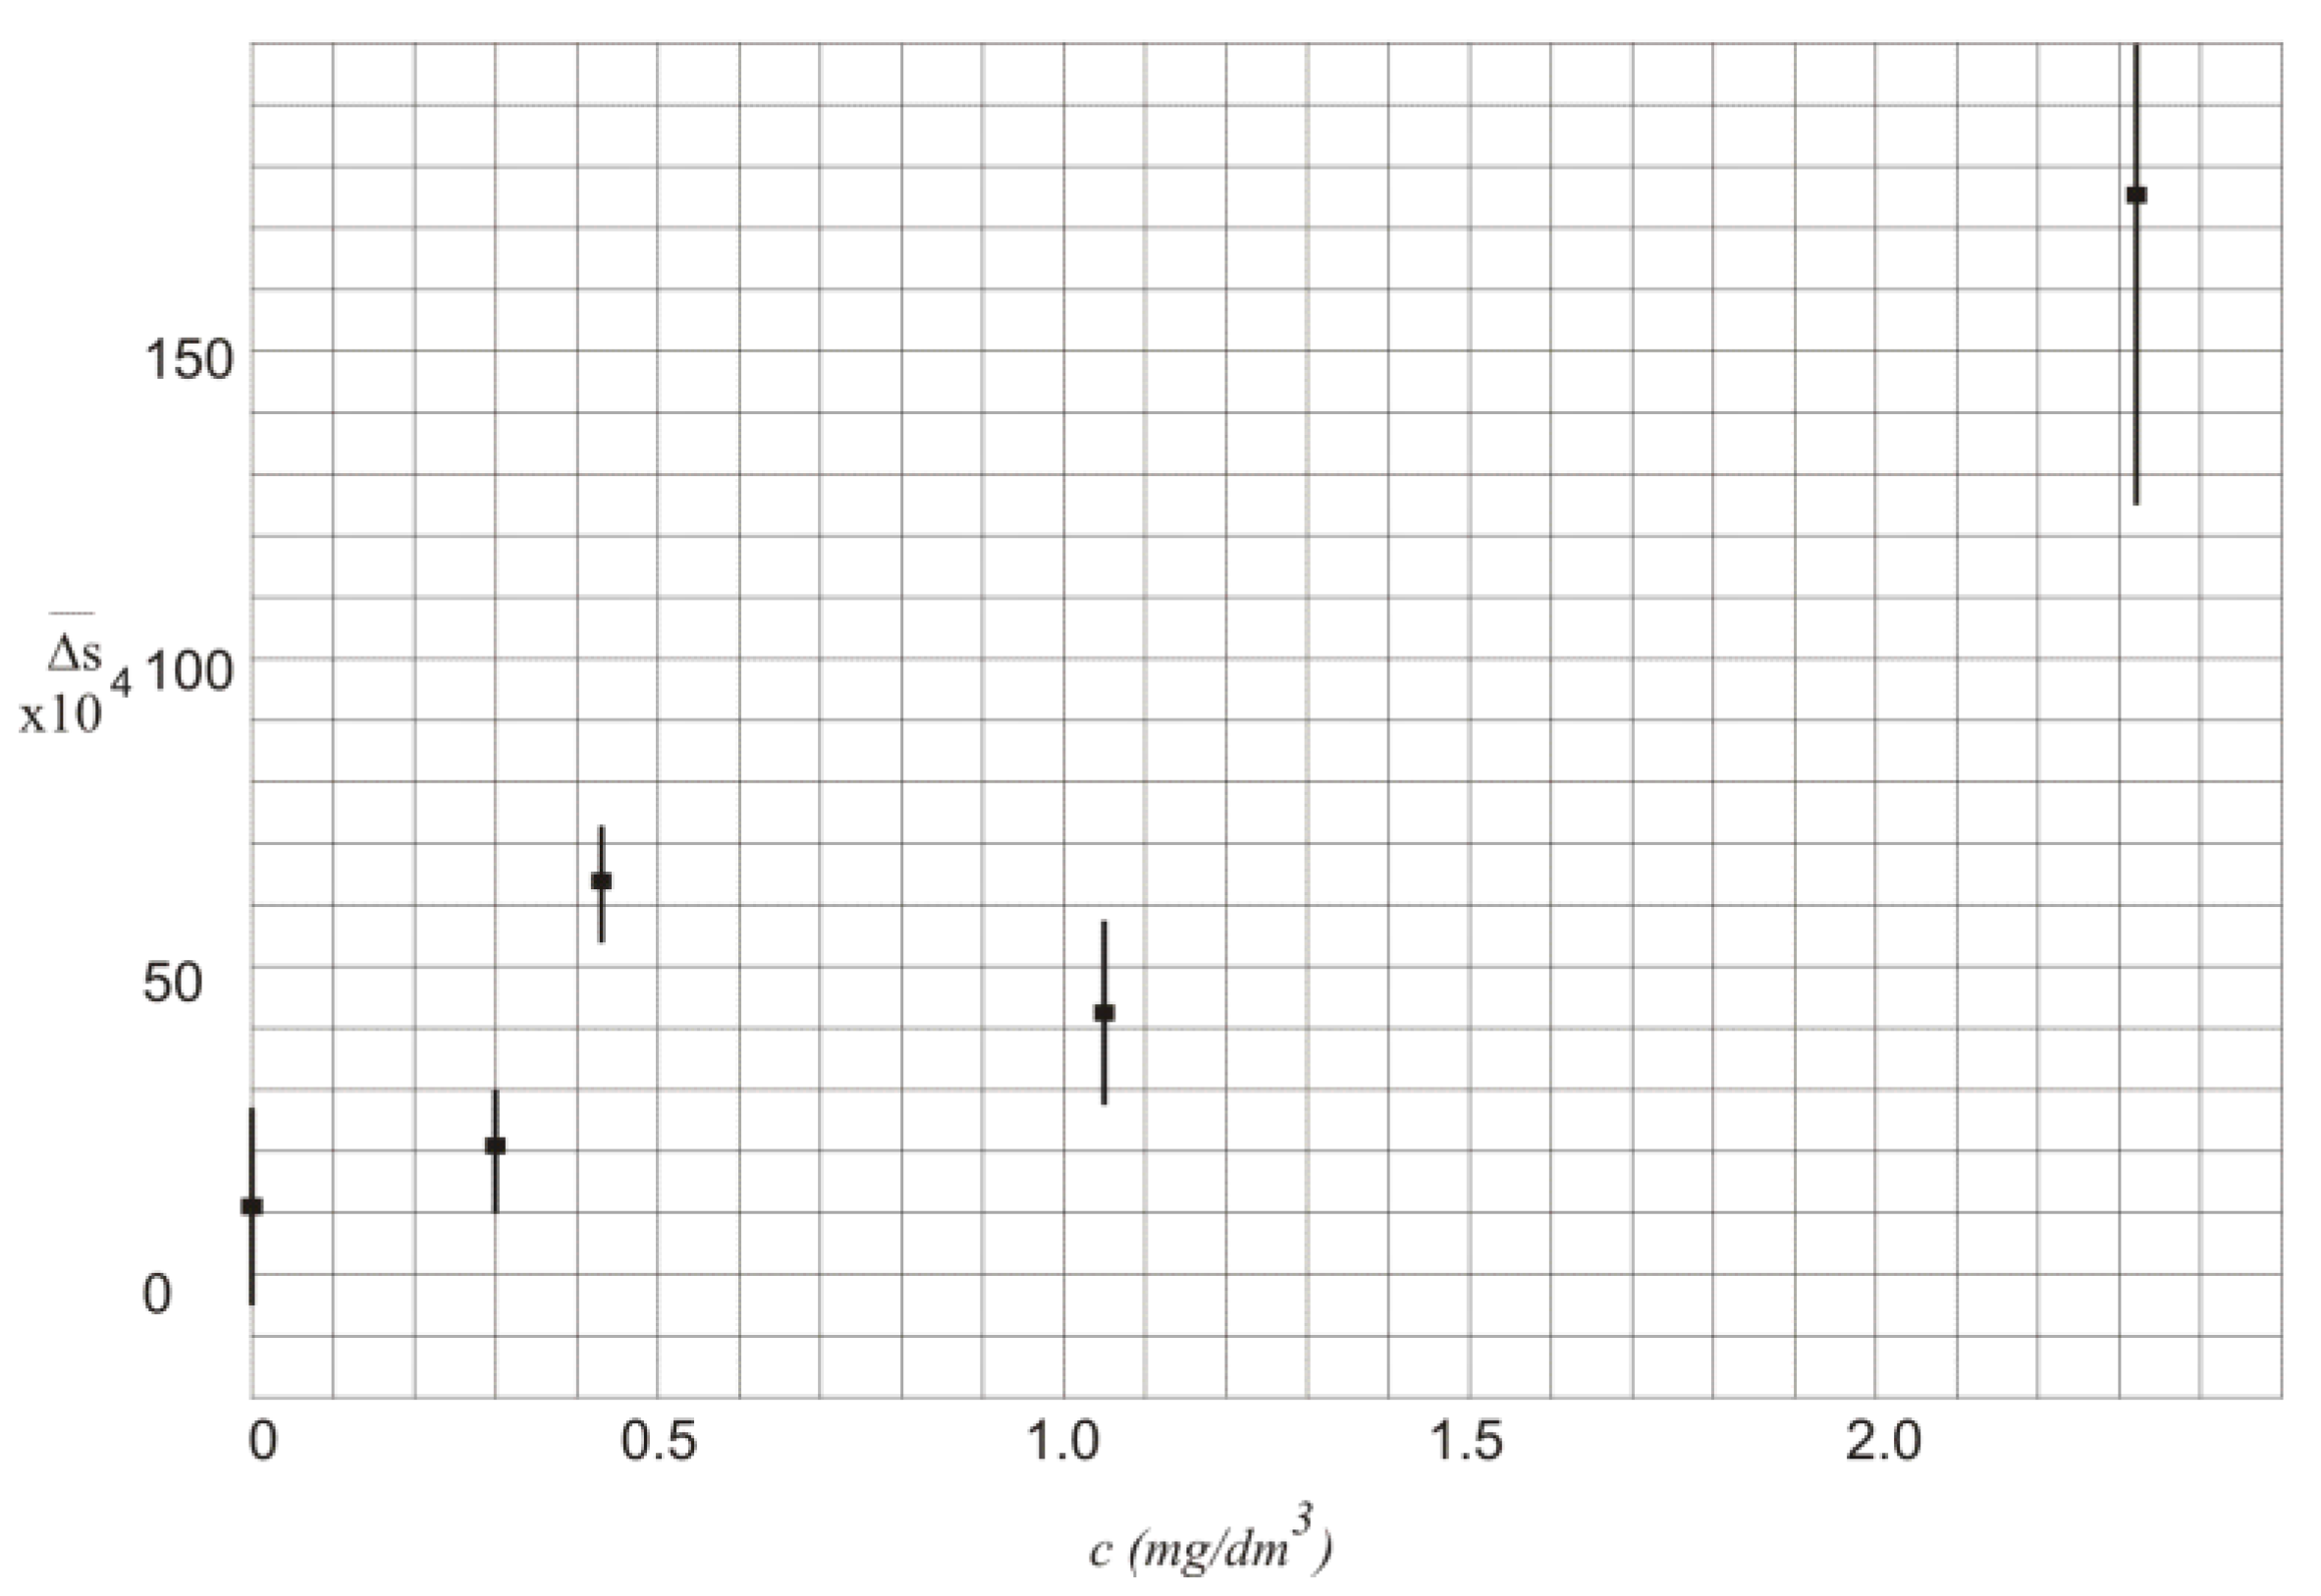
The values of
in function of alcohol concentration
c along with the standard deviation
are also presented in
Figure 4.
In
Table 2 and
Figure 4 the values of
are characterized by high standard deviation that mainly results from instability of the laser powers. Thus, the measurement of the exact value of the alcohol concentration is not possible.
Using the same 700 values of amplitudes of signals
and
, as in
Table 2, the values of relative difference of the signals
were calculated according to the Equation (14). For calculated values of
standard deviation
was estimated. The results of calculations are presented in
Table 3, where:
—relative difference of the amplitudes calculated according to Equation (14) and averaged over 700 values.
—for the situation when the alcohol vapours were blown into the multiple reflection system.
—standard deviation of .
—value of averaged over three measurements.
—standard deviation of .
—relative standard deviation of .
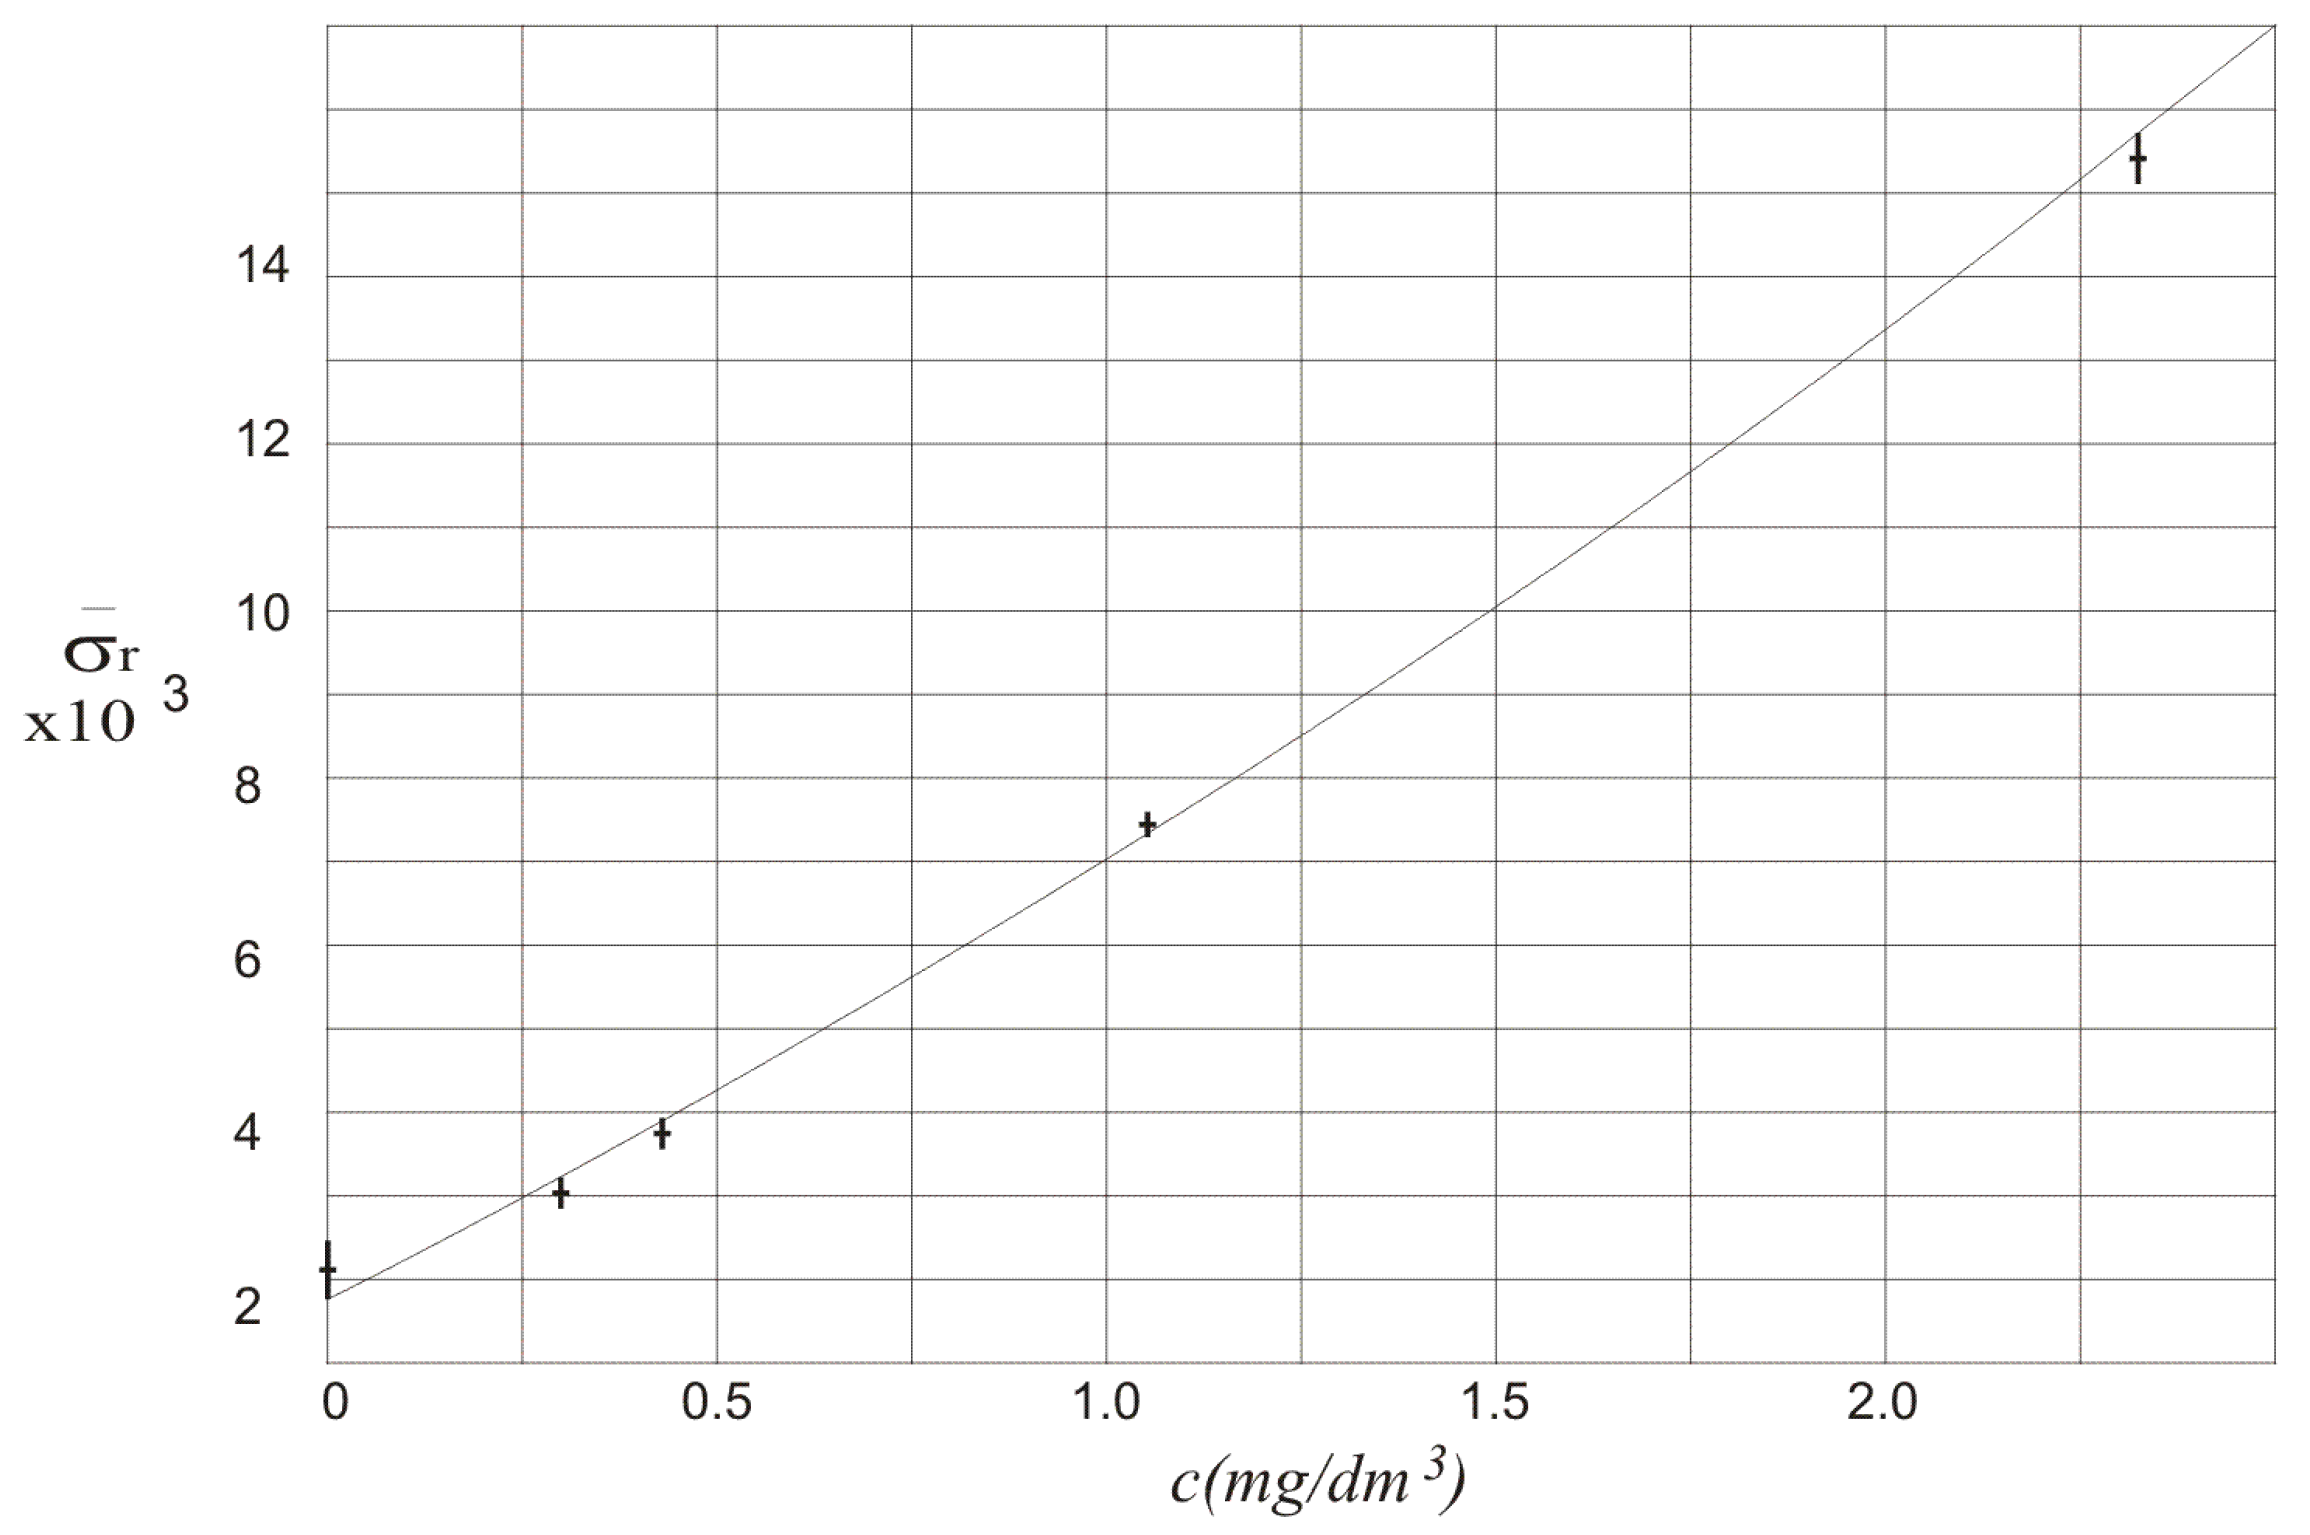
The results of calculation of
in function of alcohol concentration
c are also presented in
Figure 5. The relation between
and alcohol concentration is almost linear. The standard deviation of the relative difference of the amplitudes of the measured signals
and
can be used to show that there is alcohol in the air blown into the multiple reflection system. It can even show what is the concentration of the alcohol. It should be noticed that
for three independent measurements is not higher than 8%.
4. Concept of the Final Device
Using the analysis and experimental results presented in
Section 2 and
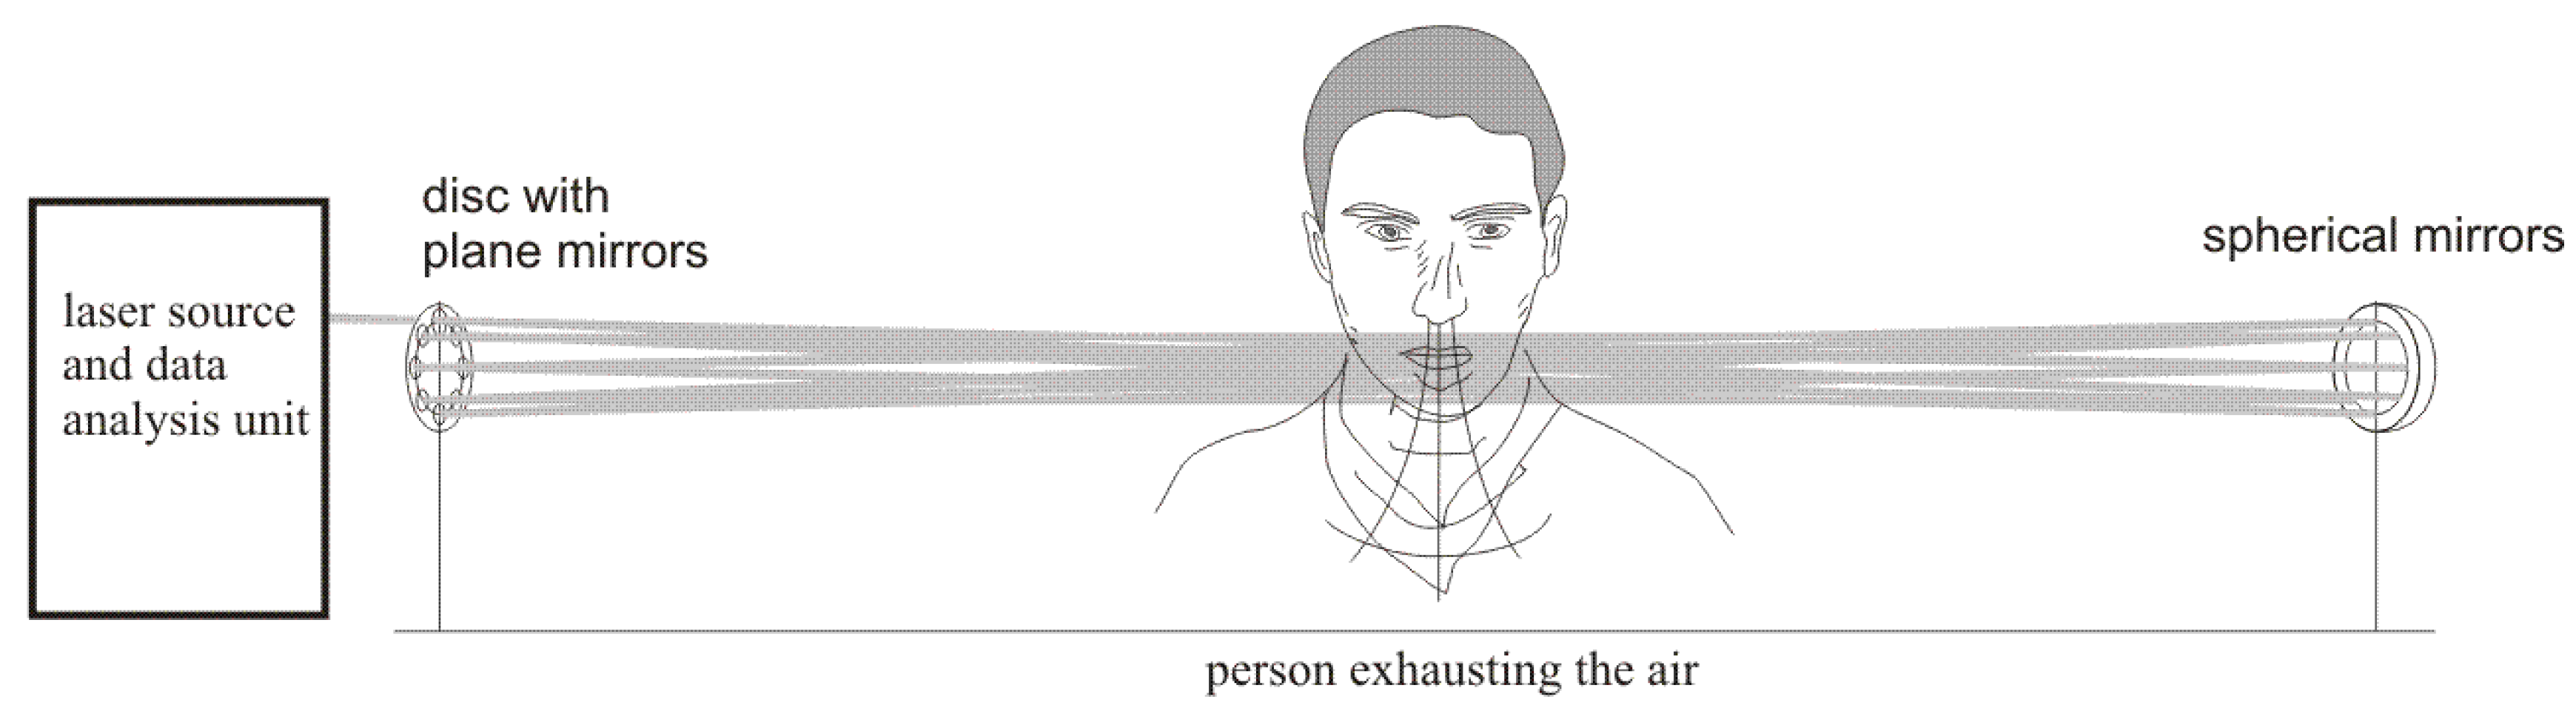
Section 3, a special device can be developed that could be able to detect the alcohol in the air exhaled by humans. The diagram of proposed device is shown in
Figure 6.
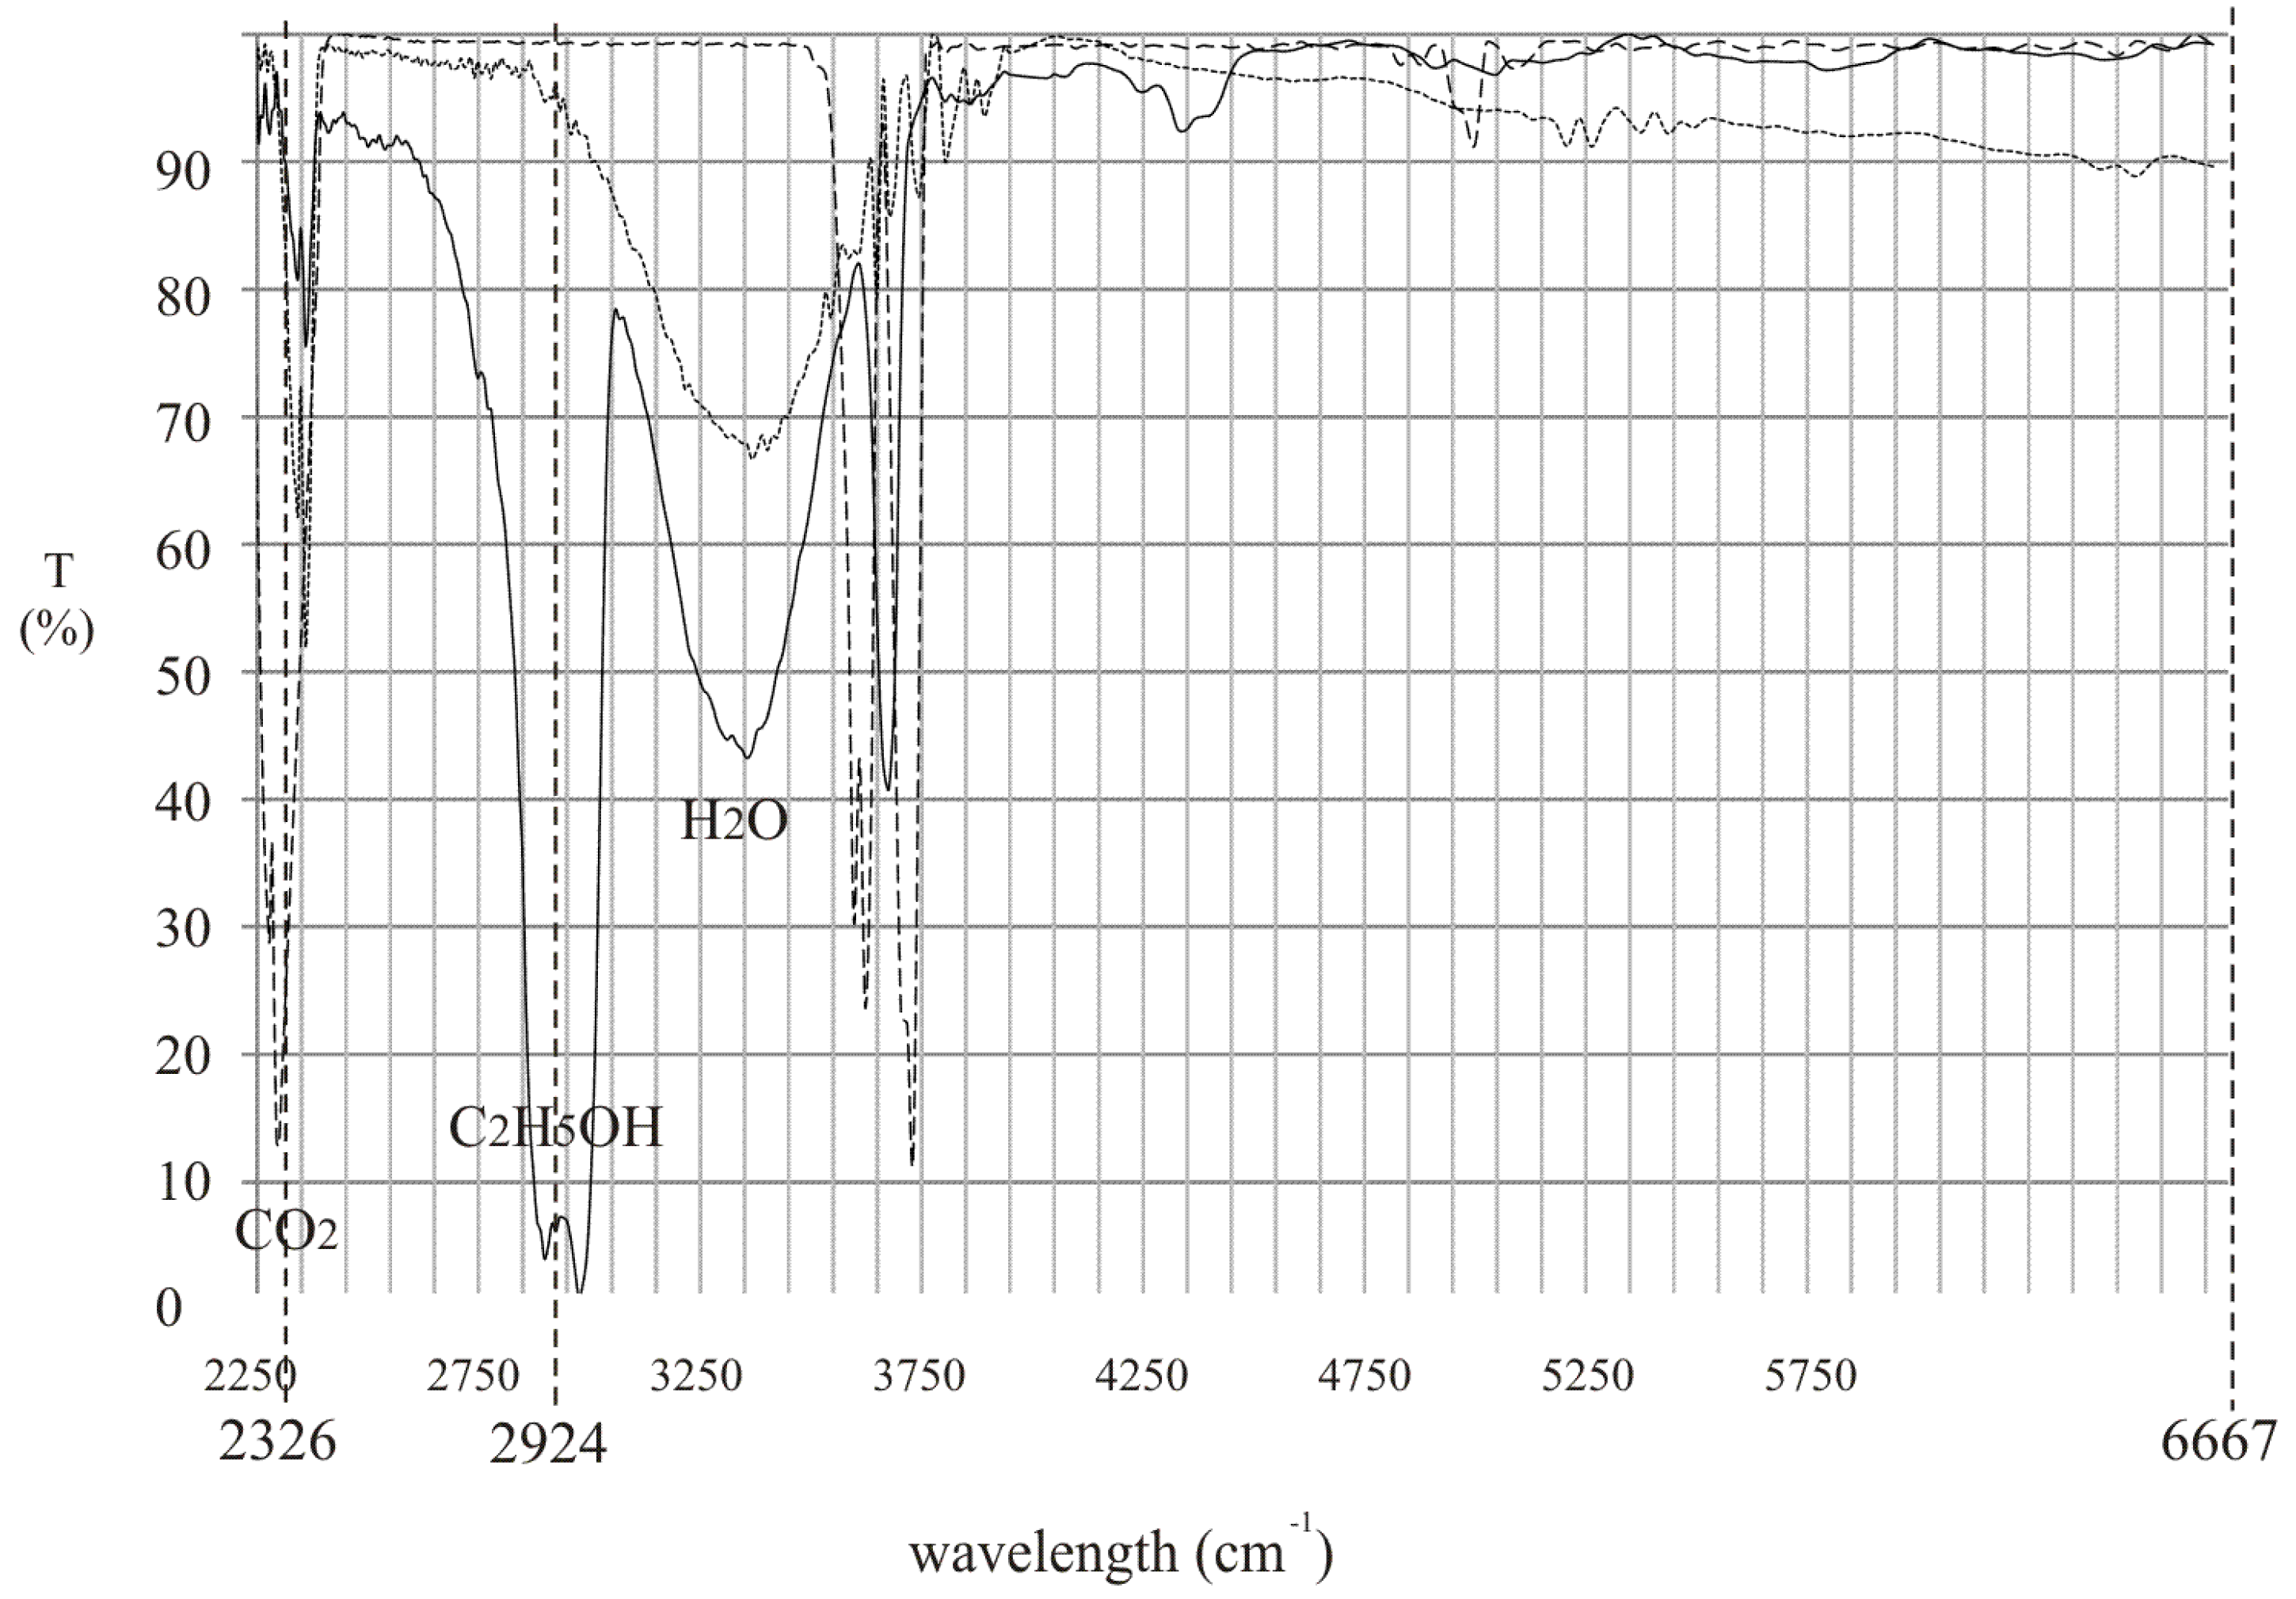
To make the proposed device more useful, it should also be able to detect if the person is breathing during the measurements. This problem was already solved and described in patent [
14]. Carbon dioxide or water vapor present in the exhaled air, showing that the person is breathing, can be utilized. They can be detected in an analogous way as alcohol. To do this an additional laser source should be used operating at wavelength absorbed by CO
2 or H
2O. The relation between the transmission spectrum of the mentioned substances and alcohol along with the wavelength of laser sources is shown in
Figure 7.
In the proposed device two inter-band cascade lasers operating at 3.42 µm (2924 cm−1) and 4.3 µm (2326 cm−1) and laser diode operating at 1.5 µm (6667 cm−1) can be used. The working principle can be described using the analysis presented in chapter 2.
Designating the amplitudes of the measured signals at wavelength 3.42 µm, 4.3 µm and 1.5 µm by
,
and
, respectively, the following equations can be written:
where:
is the relative difference of the amplitude of the reference signal and the amplitude of the normalized signal absorbed by alcohol .
is the relative difference of the amplitude of the reference signal and the amplitude of the normalized signal absorbed by CO2 .
The expressions for
and
are following:
where
,
,
are amplitudes of the signals for lasers operating at 3.42 µm, 4.3 µm and 1.5 µm wavelength, respectively, averaged over a time in which the changes of the laser powers are small in comparison to the changes of alcohol concentration.
The device should calculate and over a period in which the changes of the laser power are small in comparison to the changes of alcohol concentration. Based on the calculated and their standard deviation and should be estimated. These values of and should be compared with their values calculated for the situation when there is no air exhaled by a person (the relative difference of the amplitudes of the signals are then and and their standard deviations are and ). Relatively high difference between and proves that the analysed air is exhaled by humans and the difference between and shows that there is alcohol in the exhaled air.
It should be noticed that the electromagnetic interference as well as other environmental factors may have some impact on the results of measurements. Therefore, the device should be calibrated for a specific working conditions.


