1. Introduction
Because of the increasing advances in technology, smart systems are increasingly being used. These systems allow technicians, administrators, and managers to monitor and control the performance of devices from a safe distance. The monitoring system is very important when working in the field of three phase systems; some users and companies use smart monitoring software programs [
1,
2,
3,
4]. These programs are installed on the user’s smartphone or company computers to allow employers to make decisions if there is an error.
The main objective of this paper is to create a smart monitoring system based on an intelligent control system [
5,
6,
7,
8,
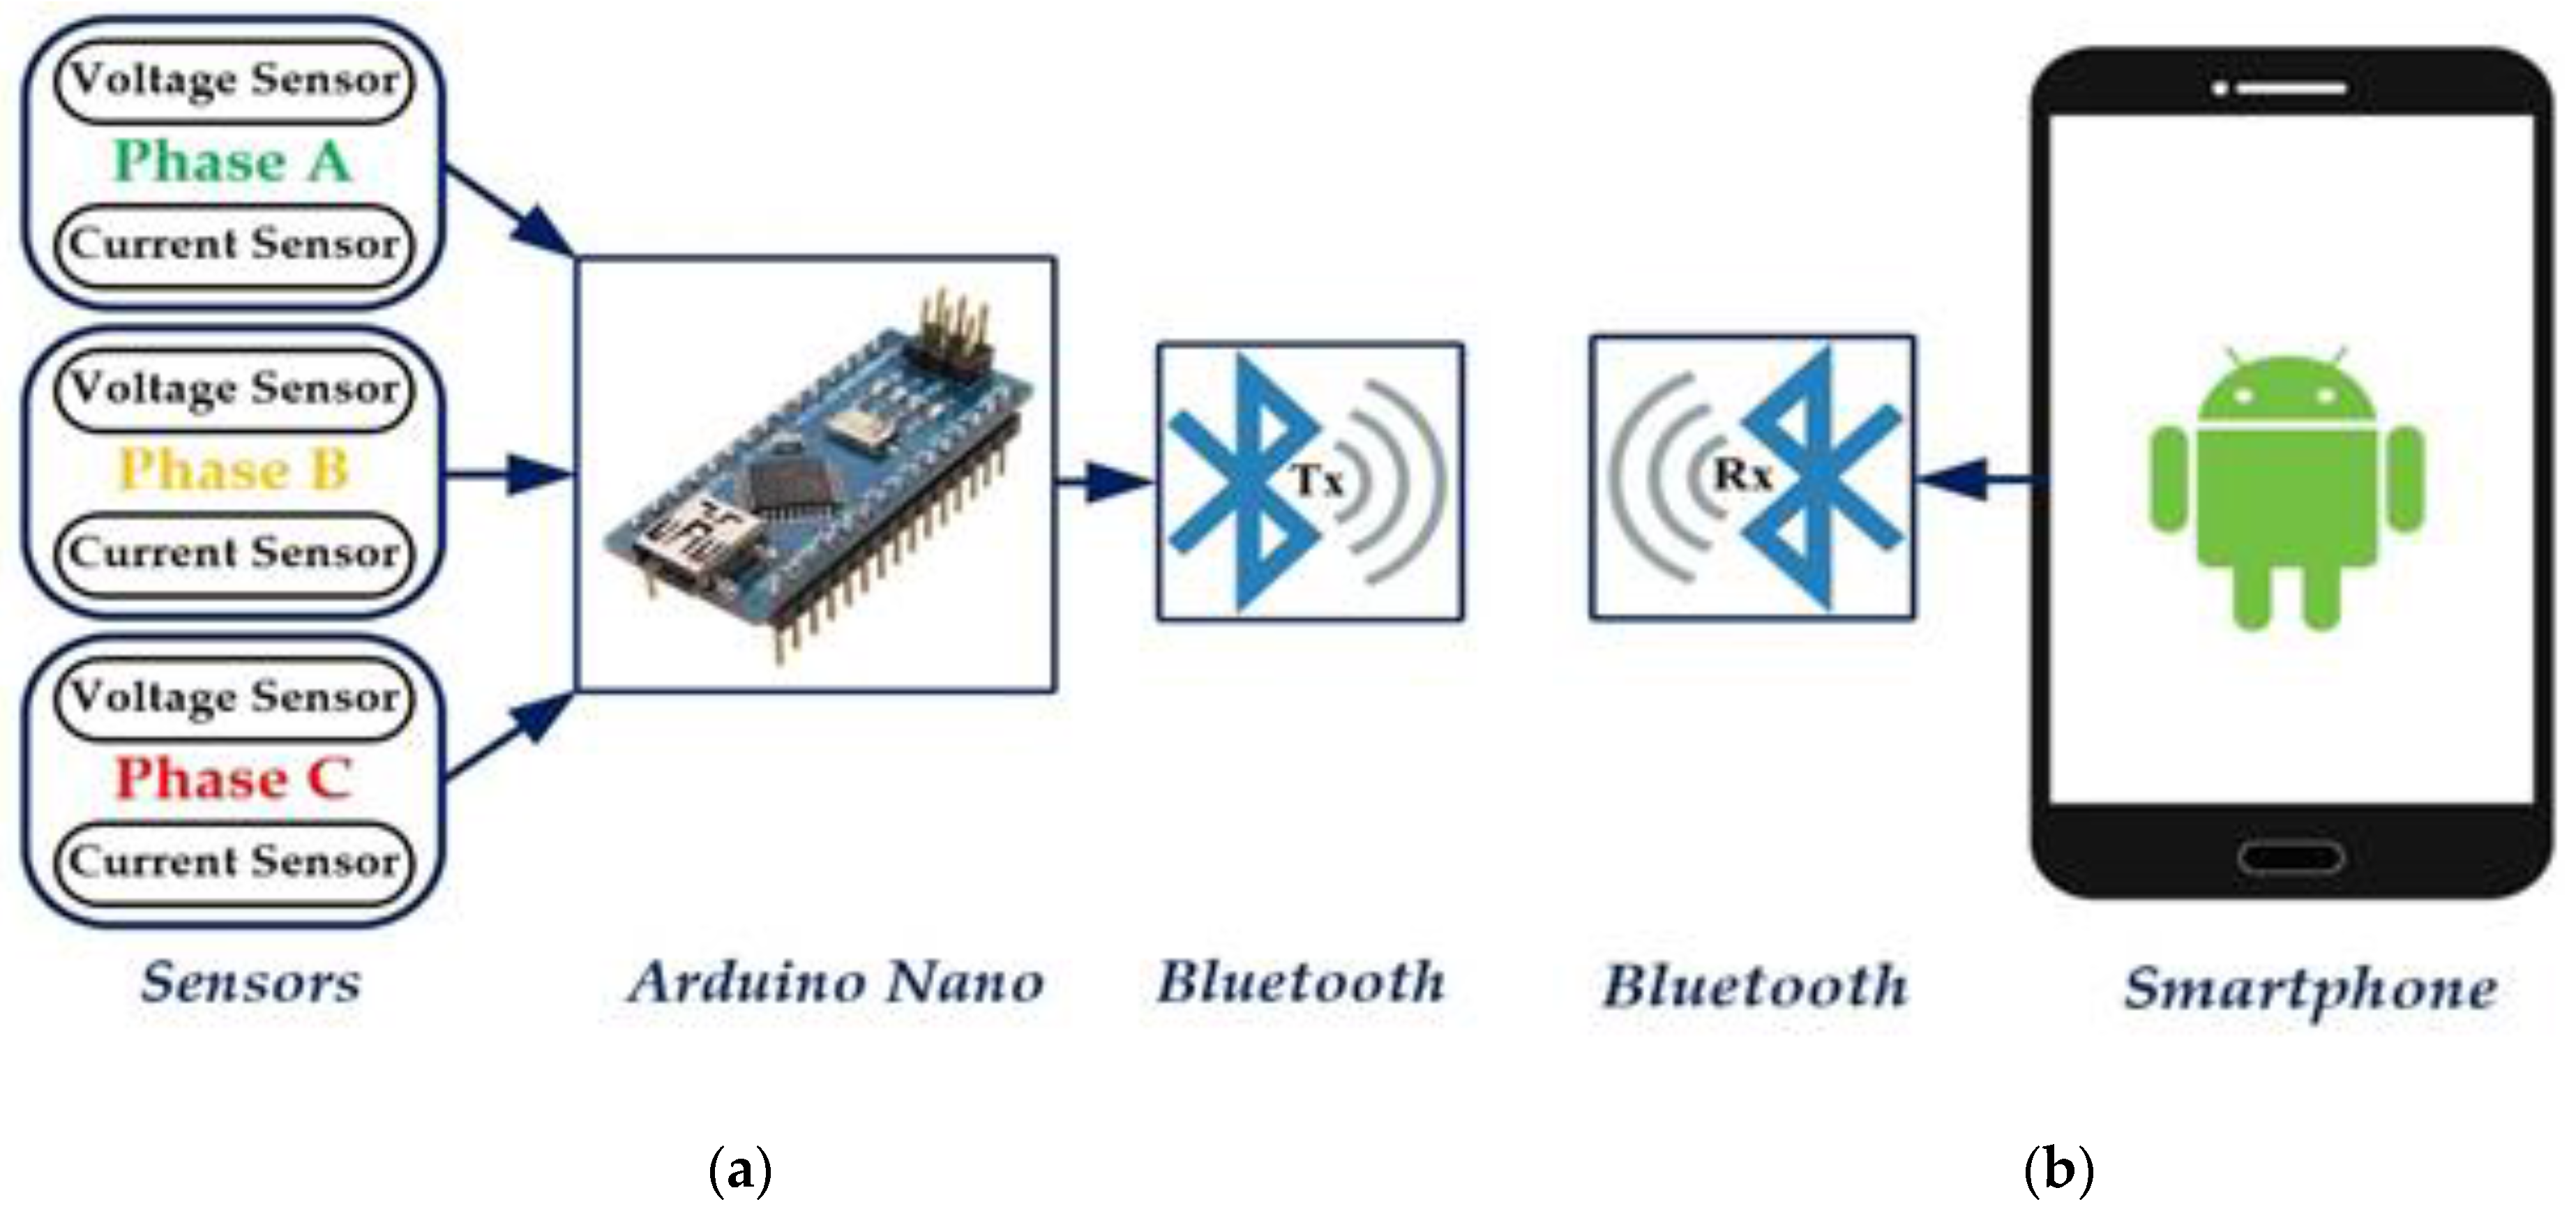
9]. The proposed system is called a smart voltage and current monitoring system or SVCMS. The SVCMS is designed to monitor the performance of a three phase grid by measuring voltage and current. The SVCMS design consists of two parts; the first is the control system shown in
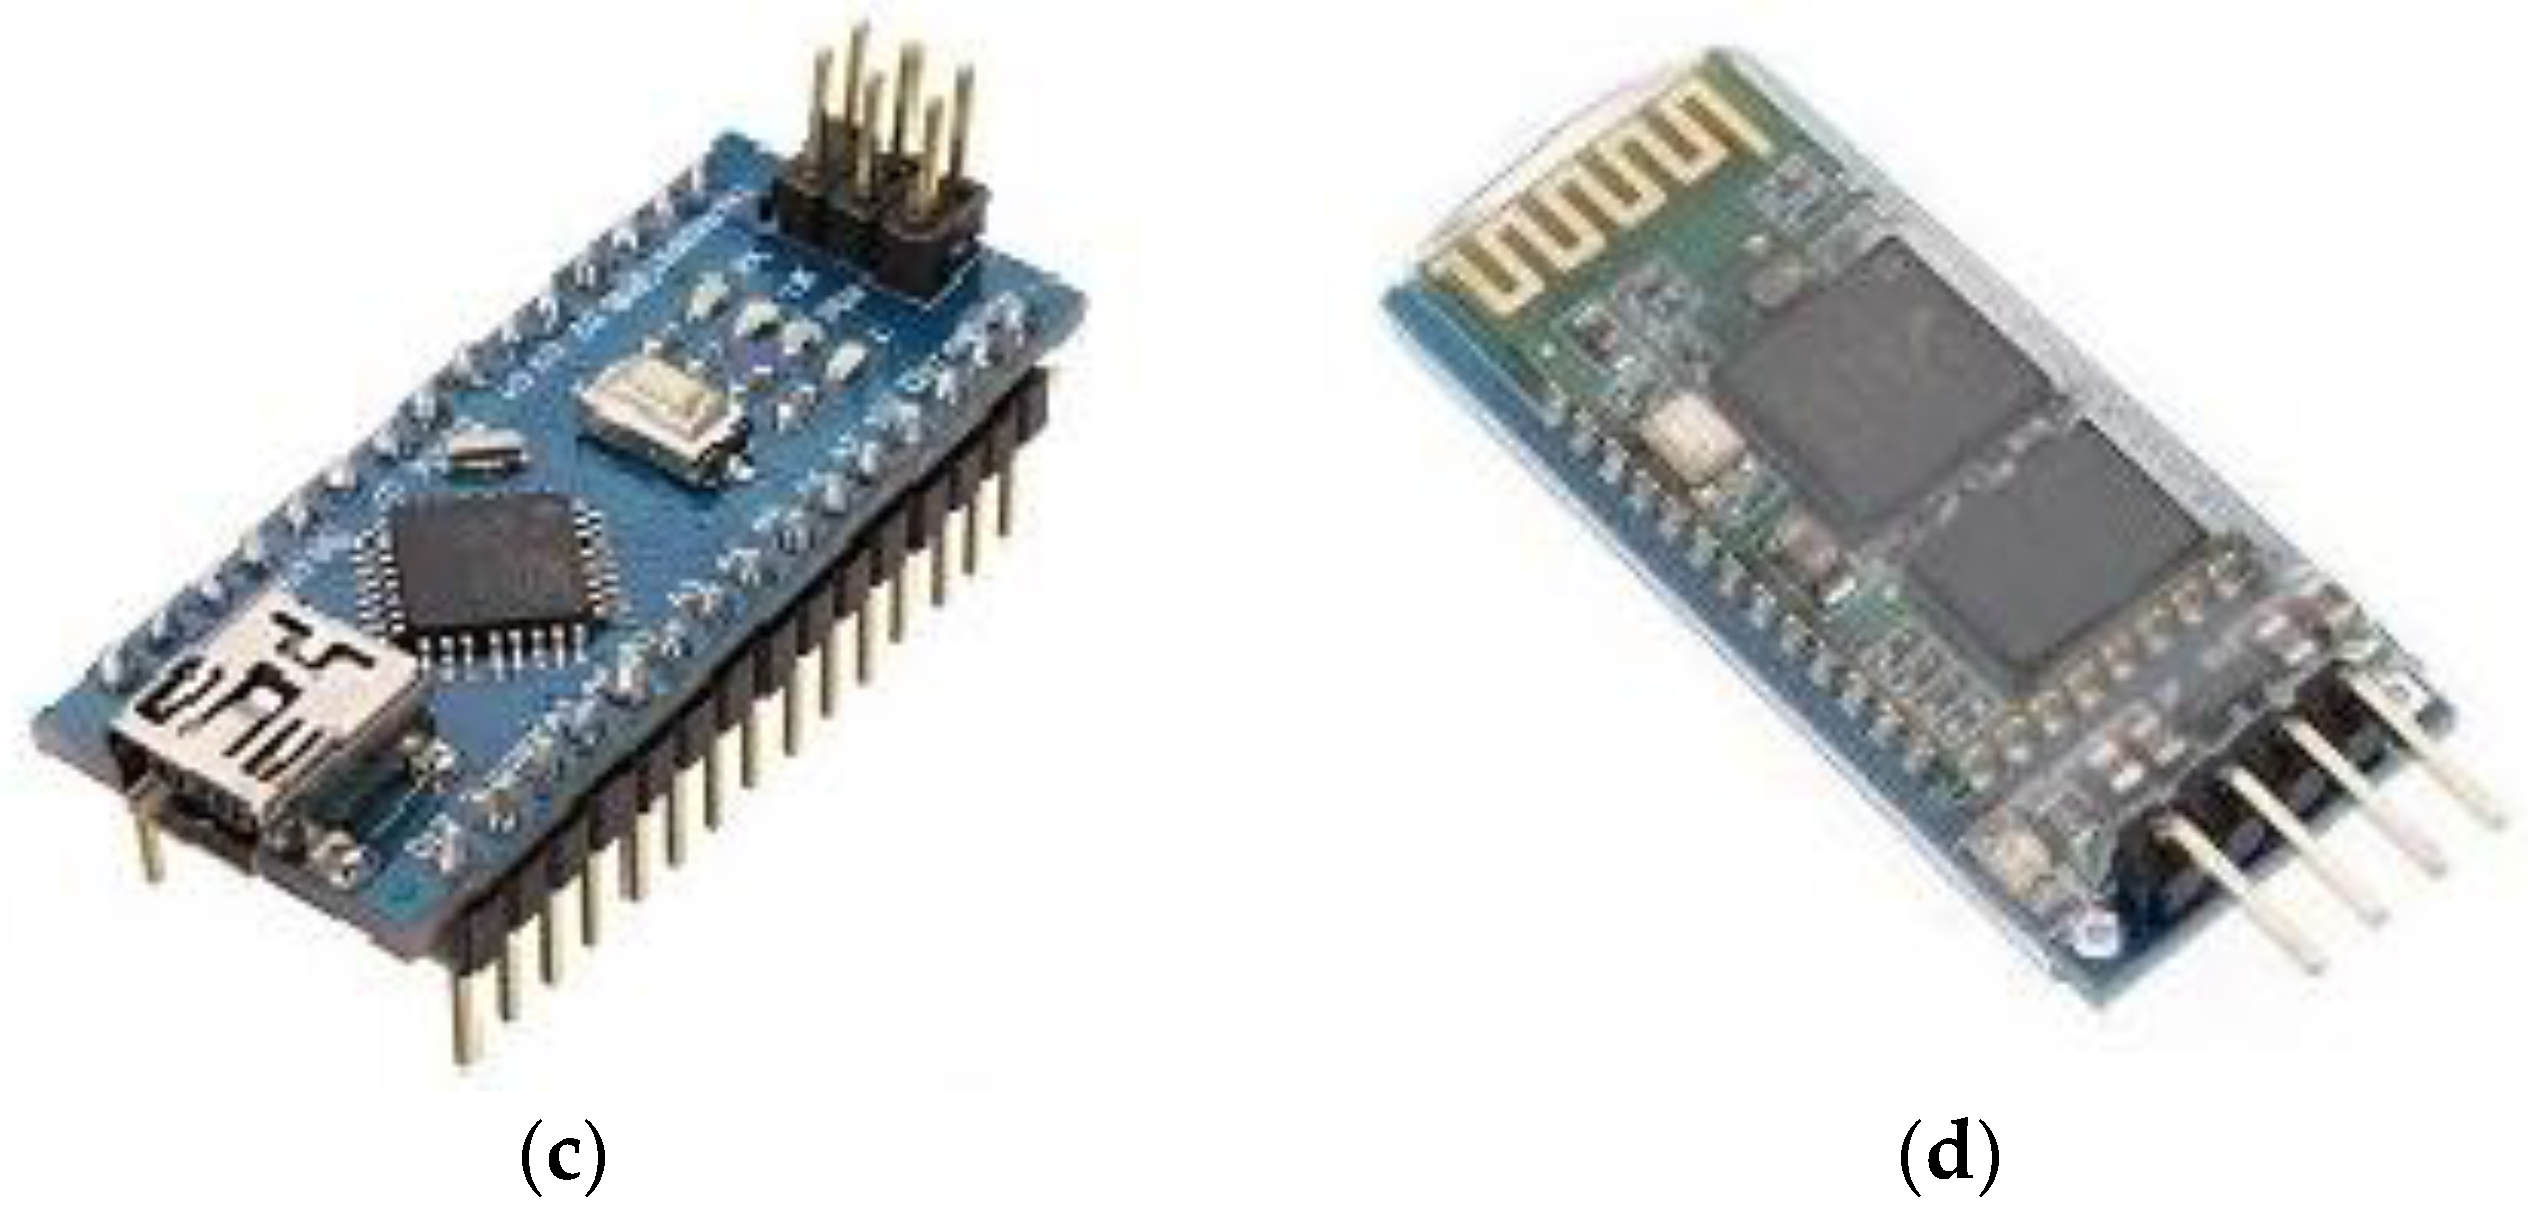
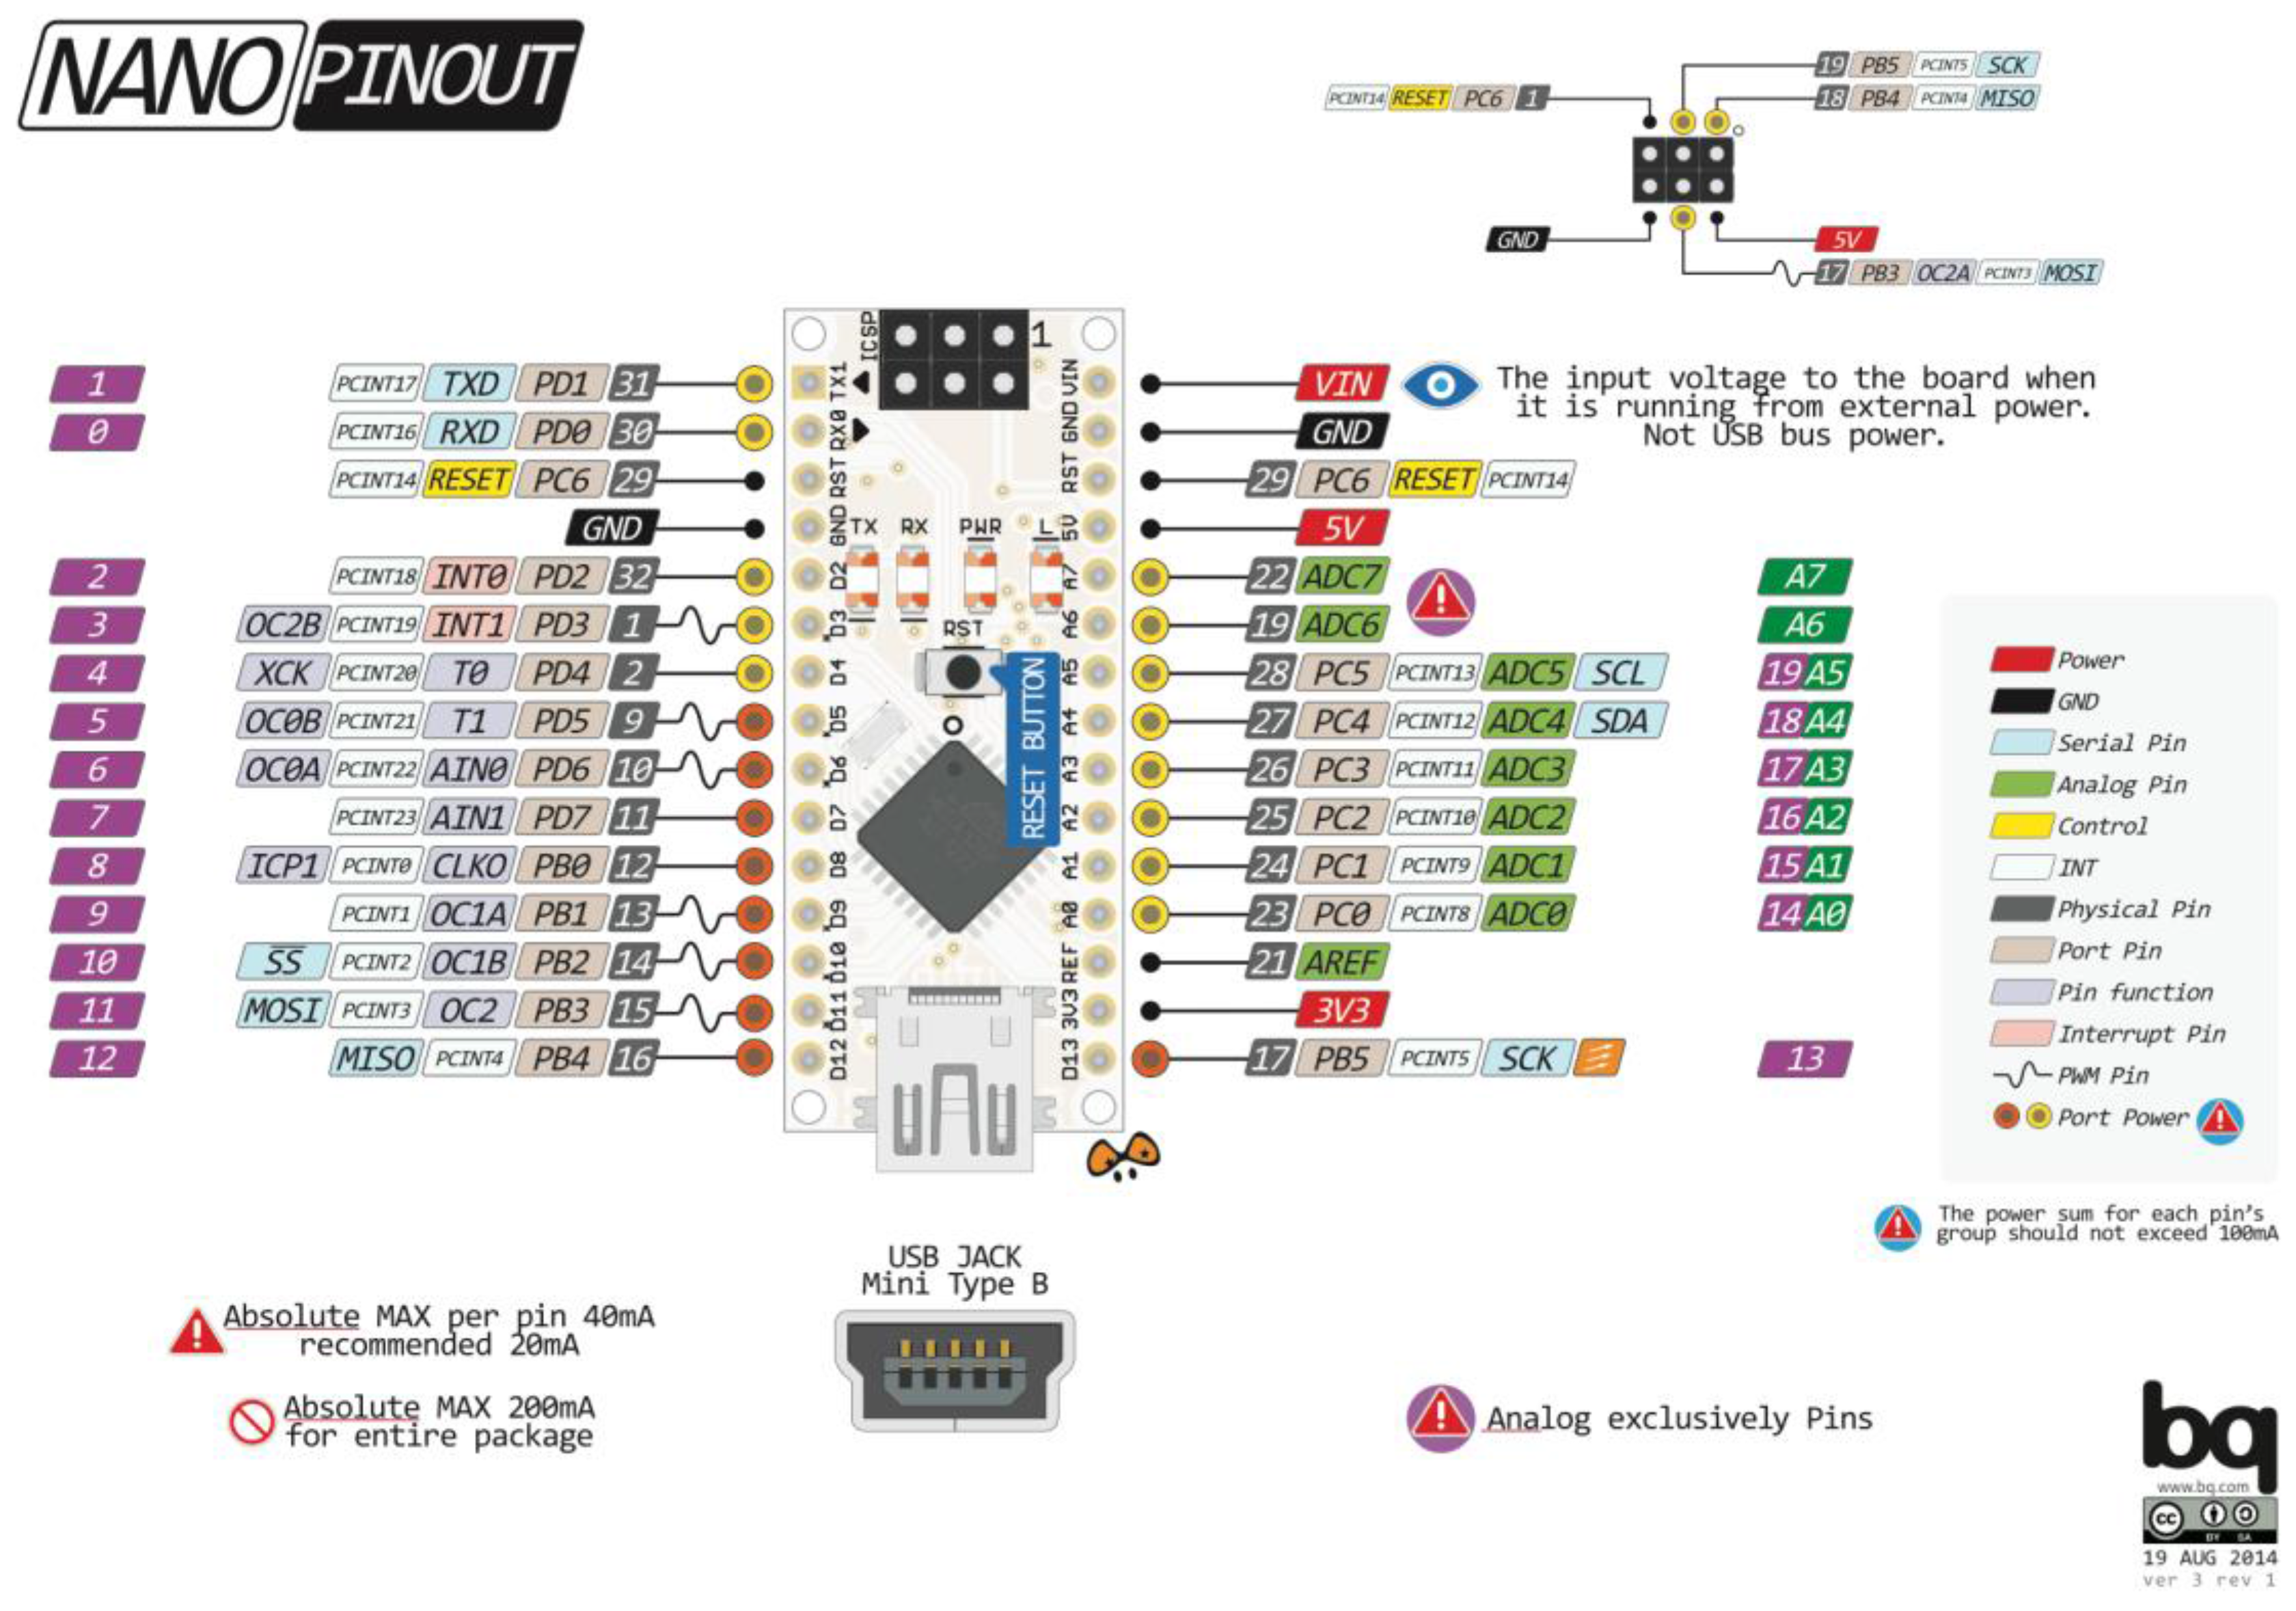
Figure 1a. This system has been designed using the Arduino Nano V3.0 as a microcontroller to read and calculate the RMS voltage and current from sensor units [
10,
11]. The Arduino Nano V3.0 is an open source platform that is very cheap, flexible, and has special-purpose data processing capabilities [
12]. Similar applications have been proposed for previous versions of this microcontroller [
9,
13,
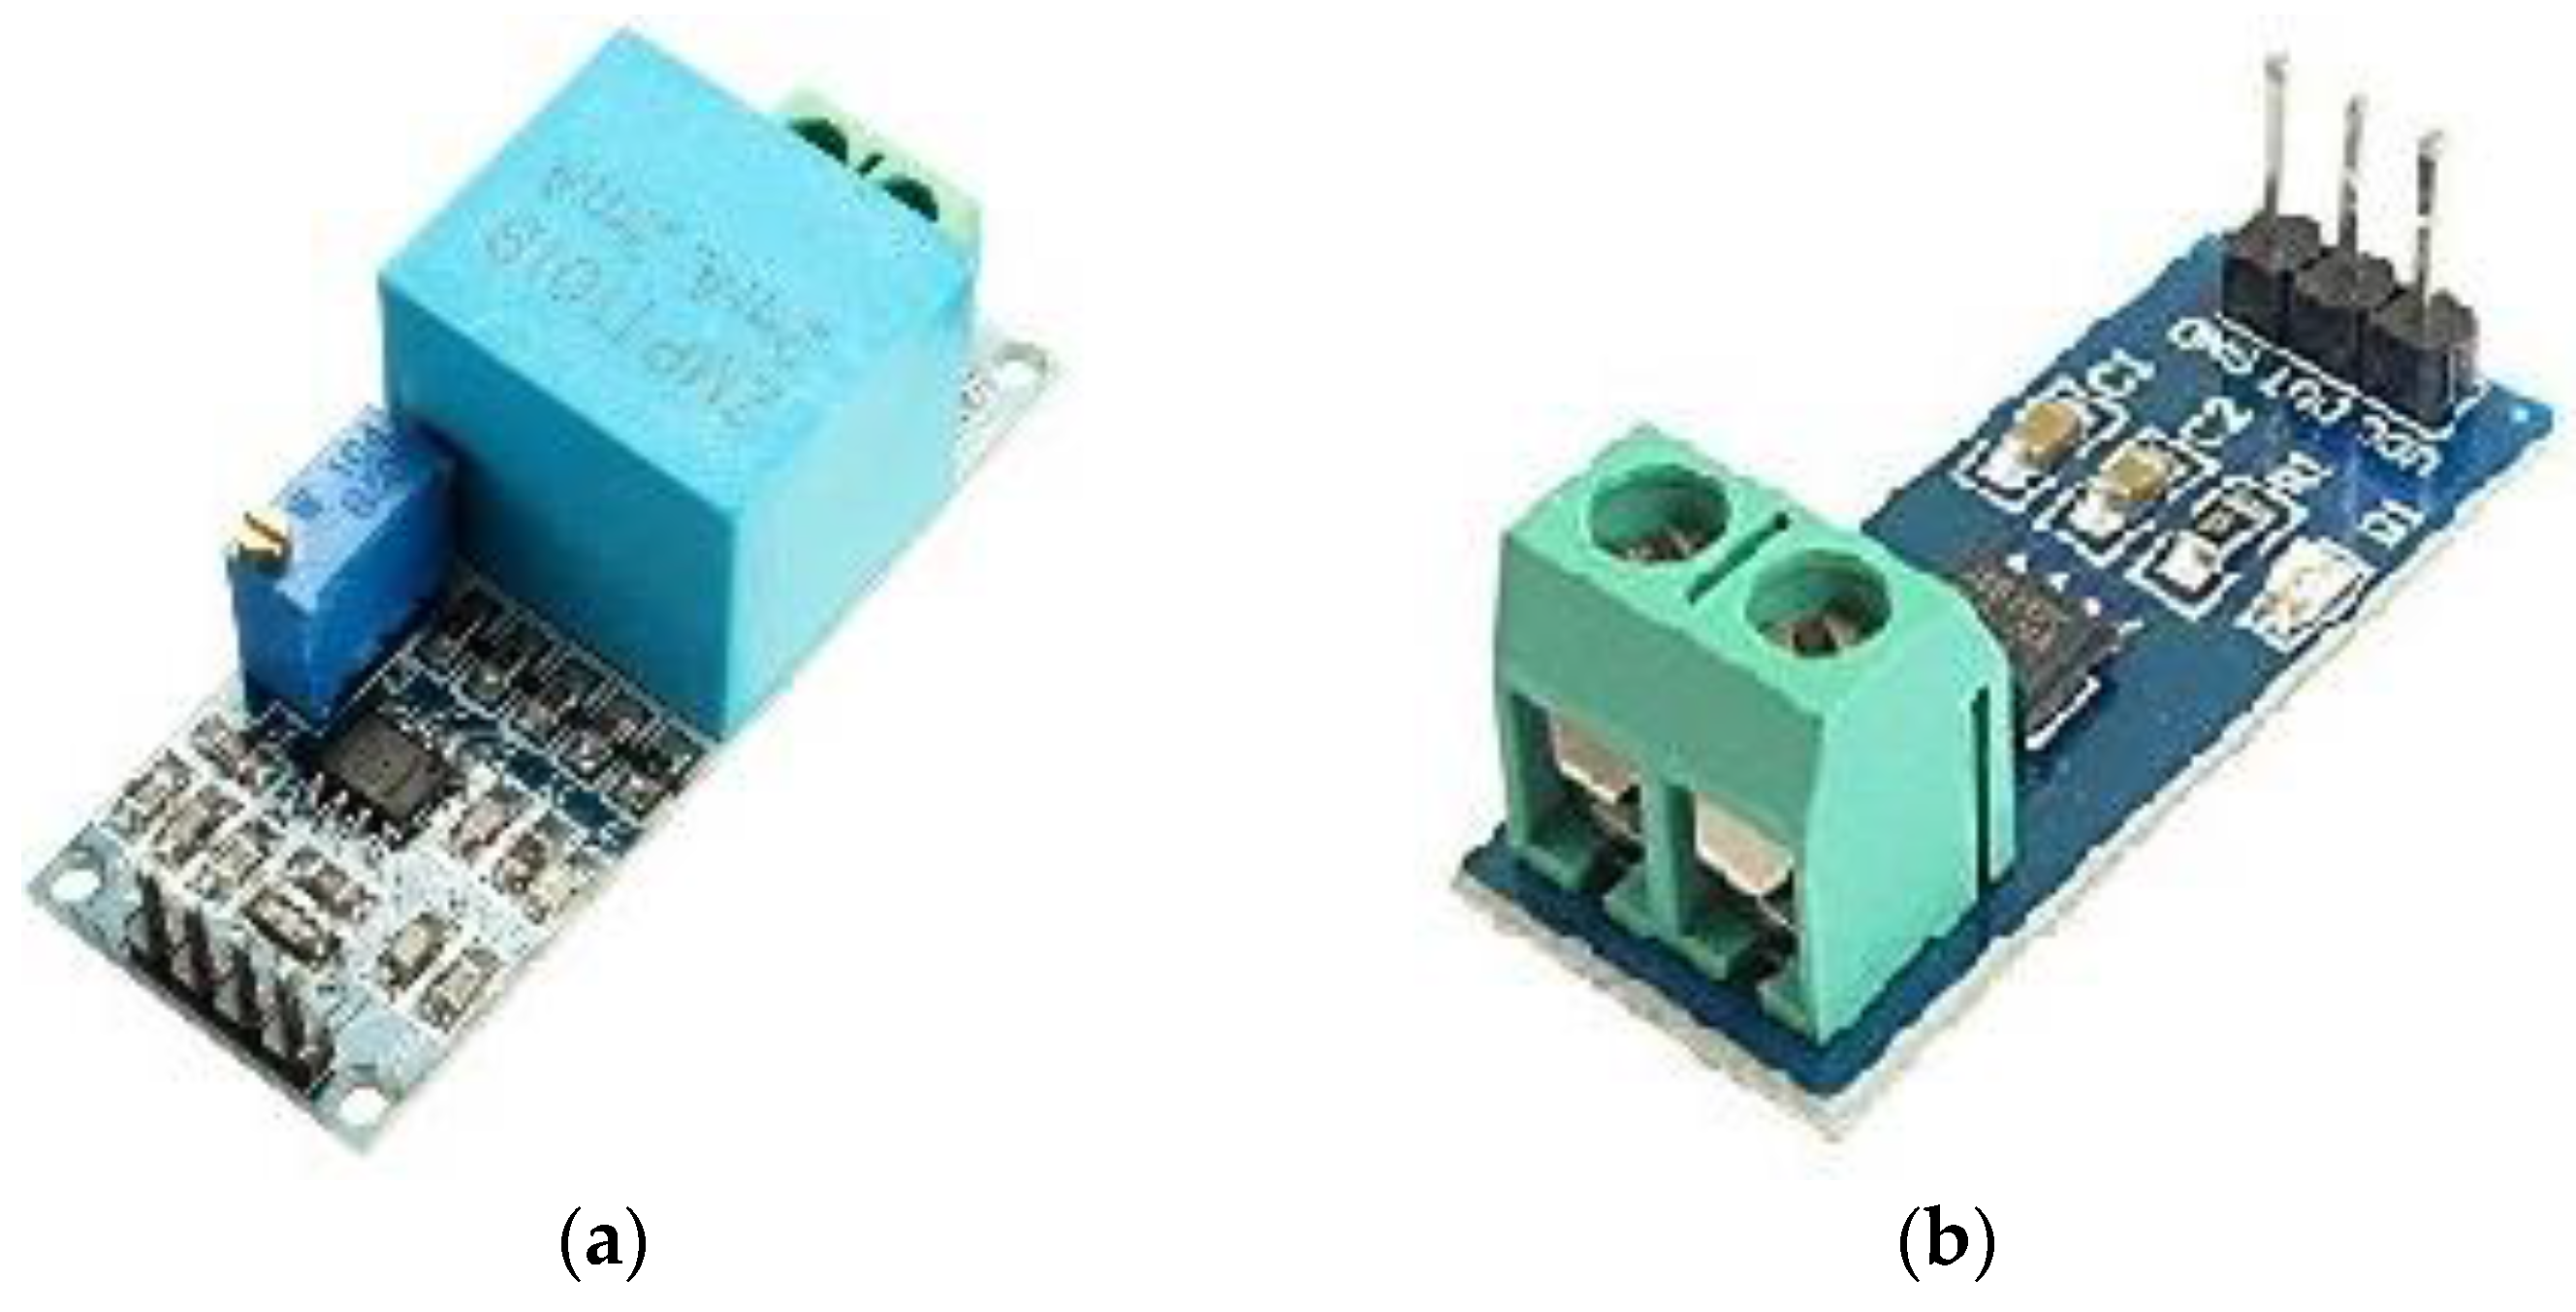
14]. The voltage sensor unit design is based on the ZMPT101B current transformer (Interplus Industry Co. Ltd., Shenzhen, China) and it amplifies the signals using a LM358 IC (Texas Instruments, Dallas, TX, USA) [
15,
16]. The current sensor unit is designed based on an ACS712 chip (Allegro Microsystems, Worcester, MA, USA) [
17]. Both voltage and current units are isolated, very cheap, and easy to use. The last part in the control system is the Bluetooth HC-05 (Guangzhou HC Information Technology Co. Ltd., Guangzhou, China) [
18,
19]. This Bluetooth HC-05, is one of several types of wireless communication [
20] (ZigBee, Wi-Fi, etc.) unit placed between the control system and the end user (monitoring system).
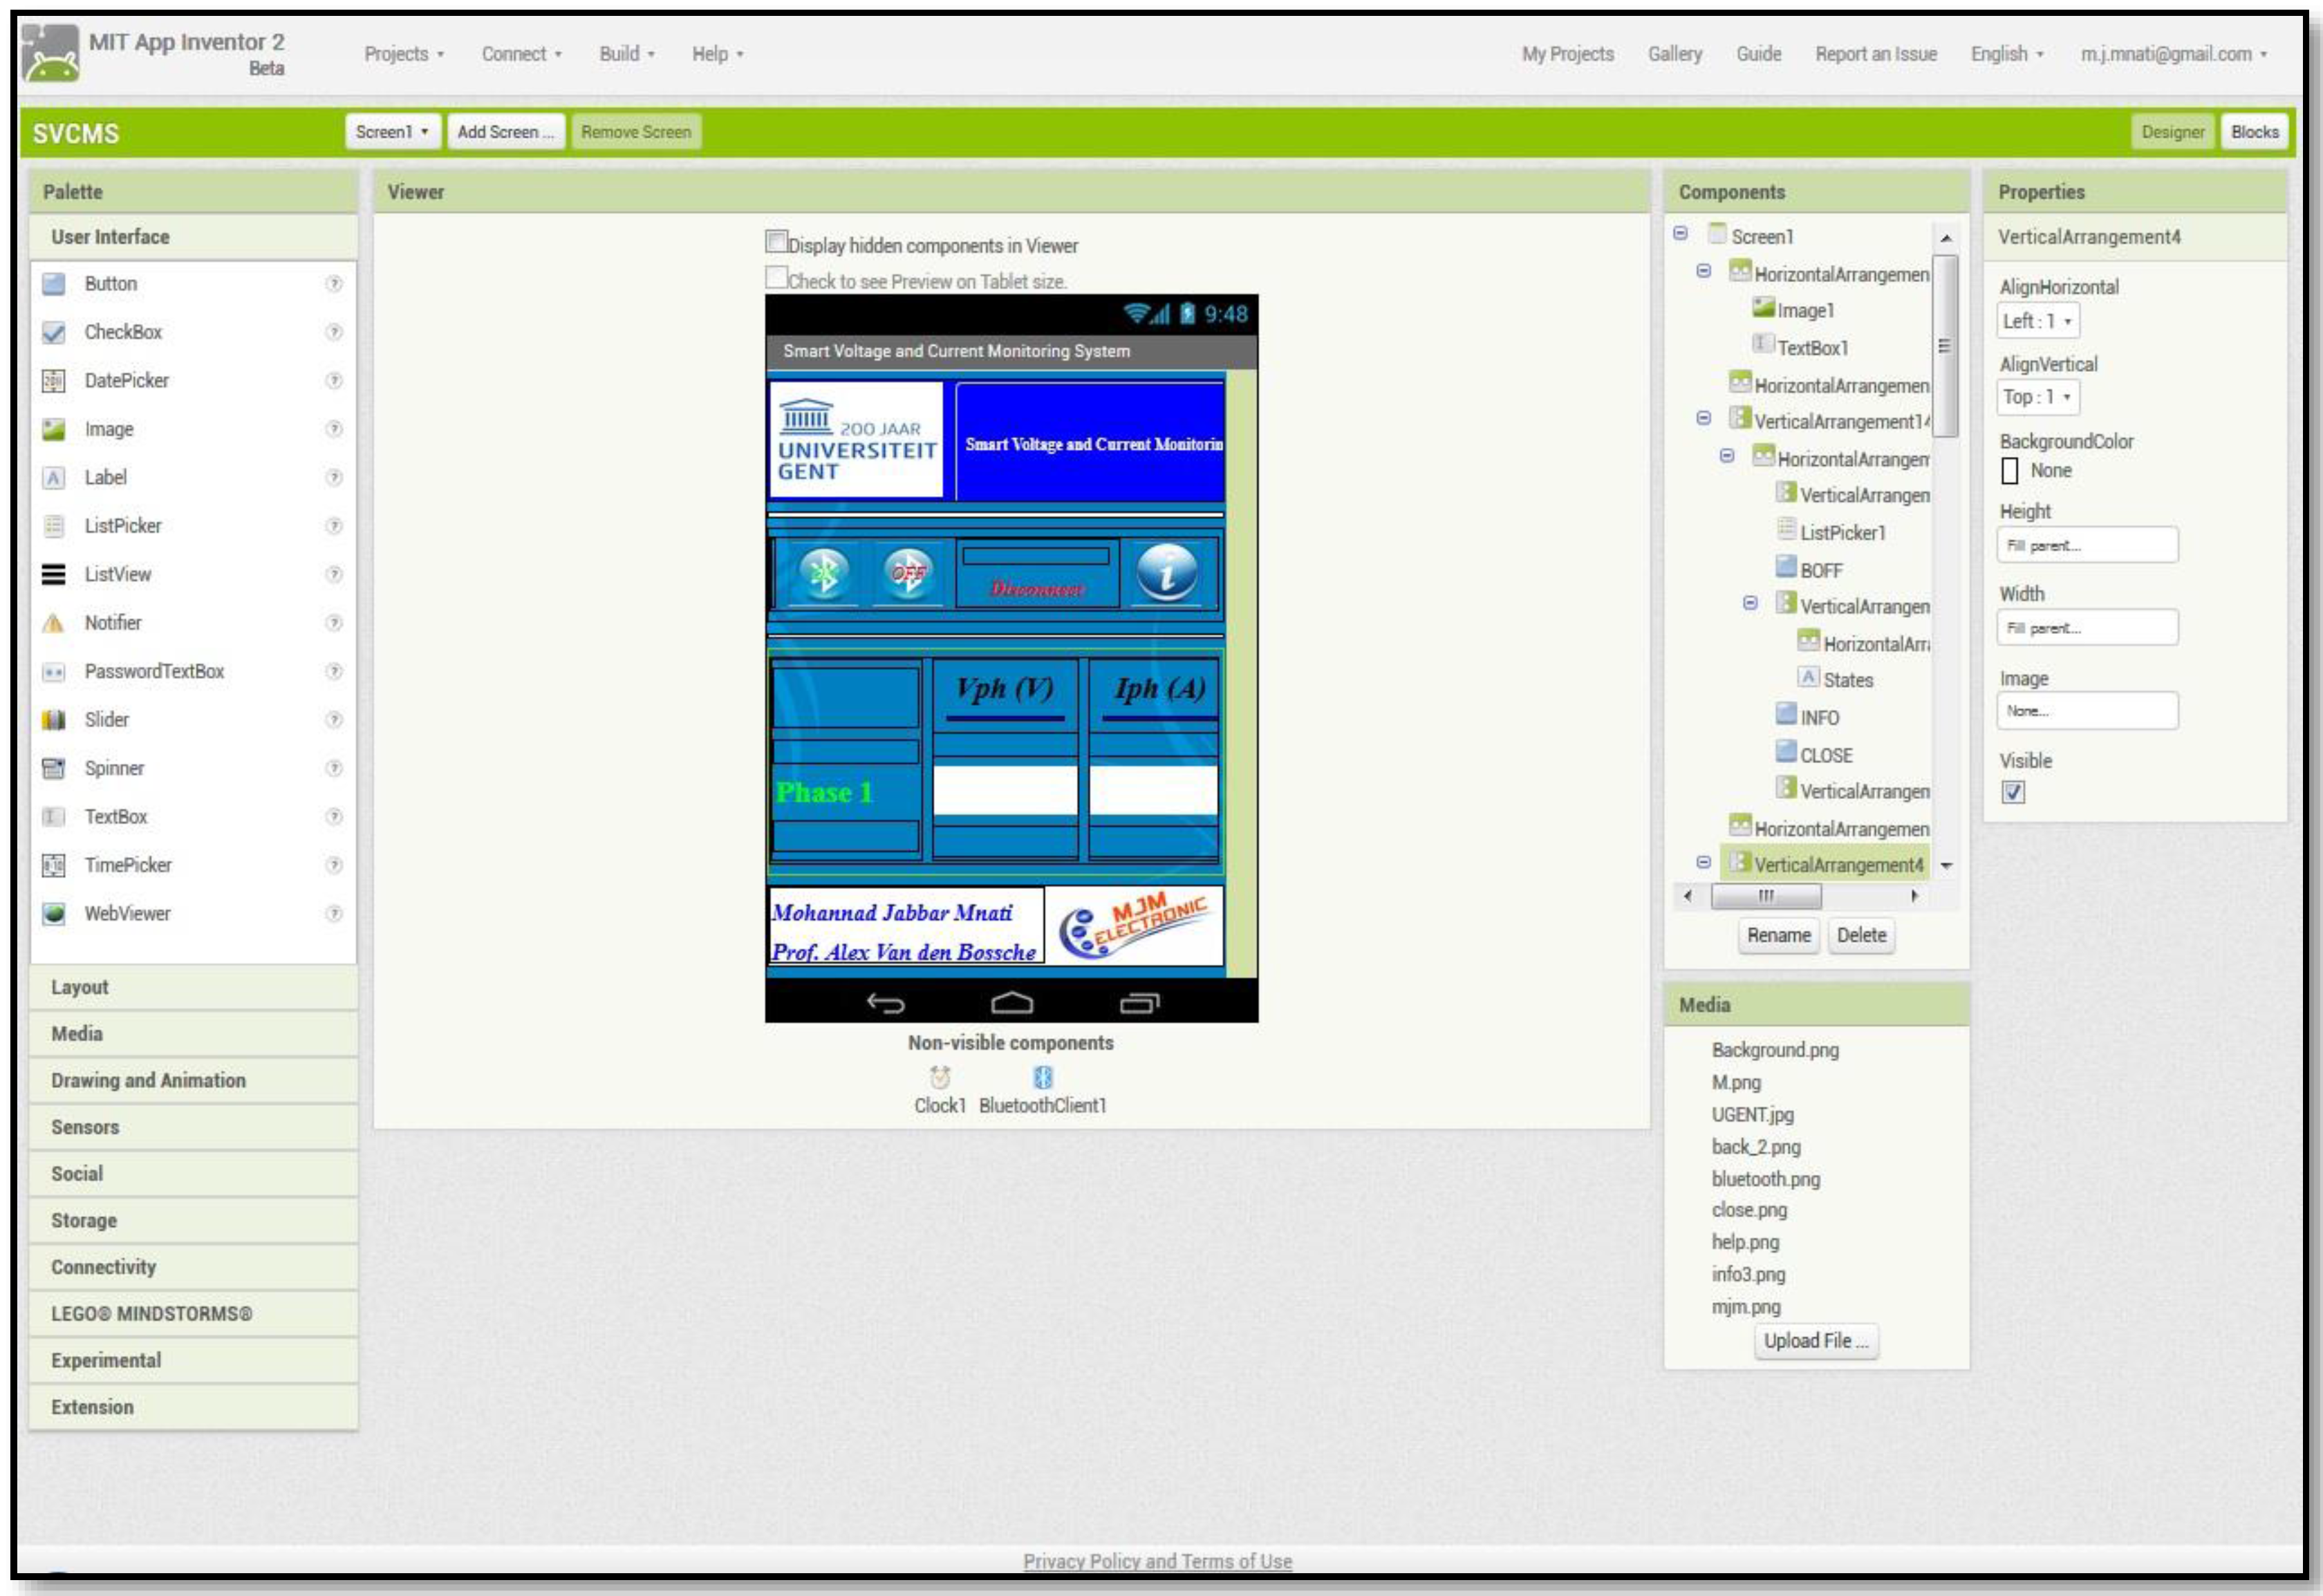
The second part of the SVCMS, seen in
Figure 1b, is the monitoring system or monitoring application that is installed on a tablet or smartphone device. This application monitors the data (three phase voltage and current) received from the microcontroller. This paper uses a new application designed using MIT App Inventor 2, an open source platform from Google, that can be used to design different types of applications that can be implemented of Android smartphones or tablets [
21,
22,
23,
24].
The aim of this work was to design and implement a low cost and safe three phase measuring system and to design a smartphone application to monitor the data received from the three phase measuring system. The SVCMS has been designed to measure three phase voltages and currents for all three phase systems that have a line to ground voltage of less than 250 VAC with a current value of less than 30 A. The rest of the paper is organised as follows:
Section 2 presents the relevant related research,
Section 3 presents the SVCMS design of both hardware and software in detail,
Section 4 discusses the practical hardware and software system results, and finally,
Section 5 presents conclusions and suggests further work.
2. Related Work
This section discusses the system which has been designed and compares it with some related work in the same area, such as similar studies using different techniques, like different types of voltage and current sensors, wireless communication technology, type of microcontroller, and monitoring systems.
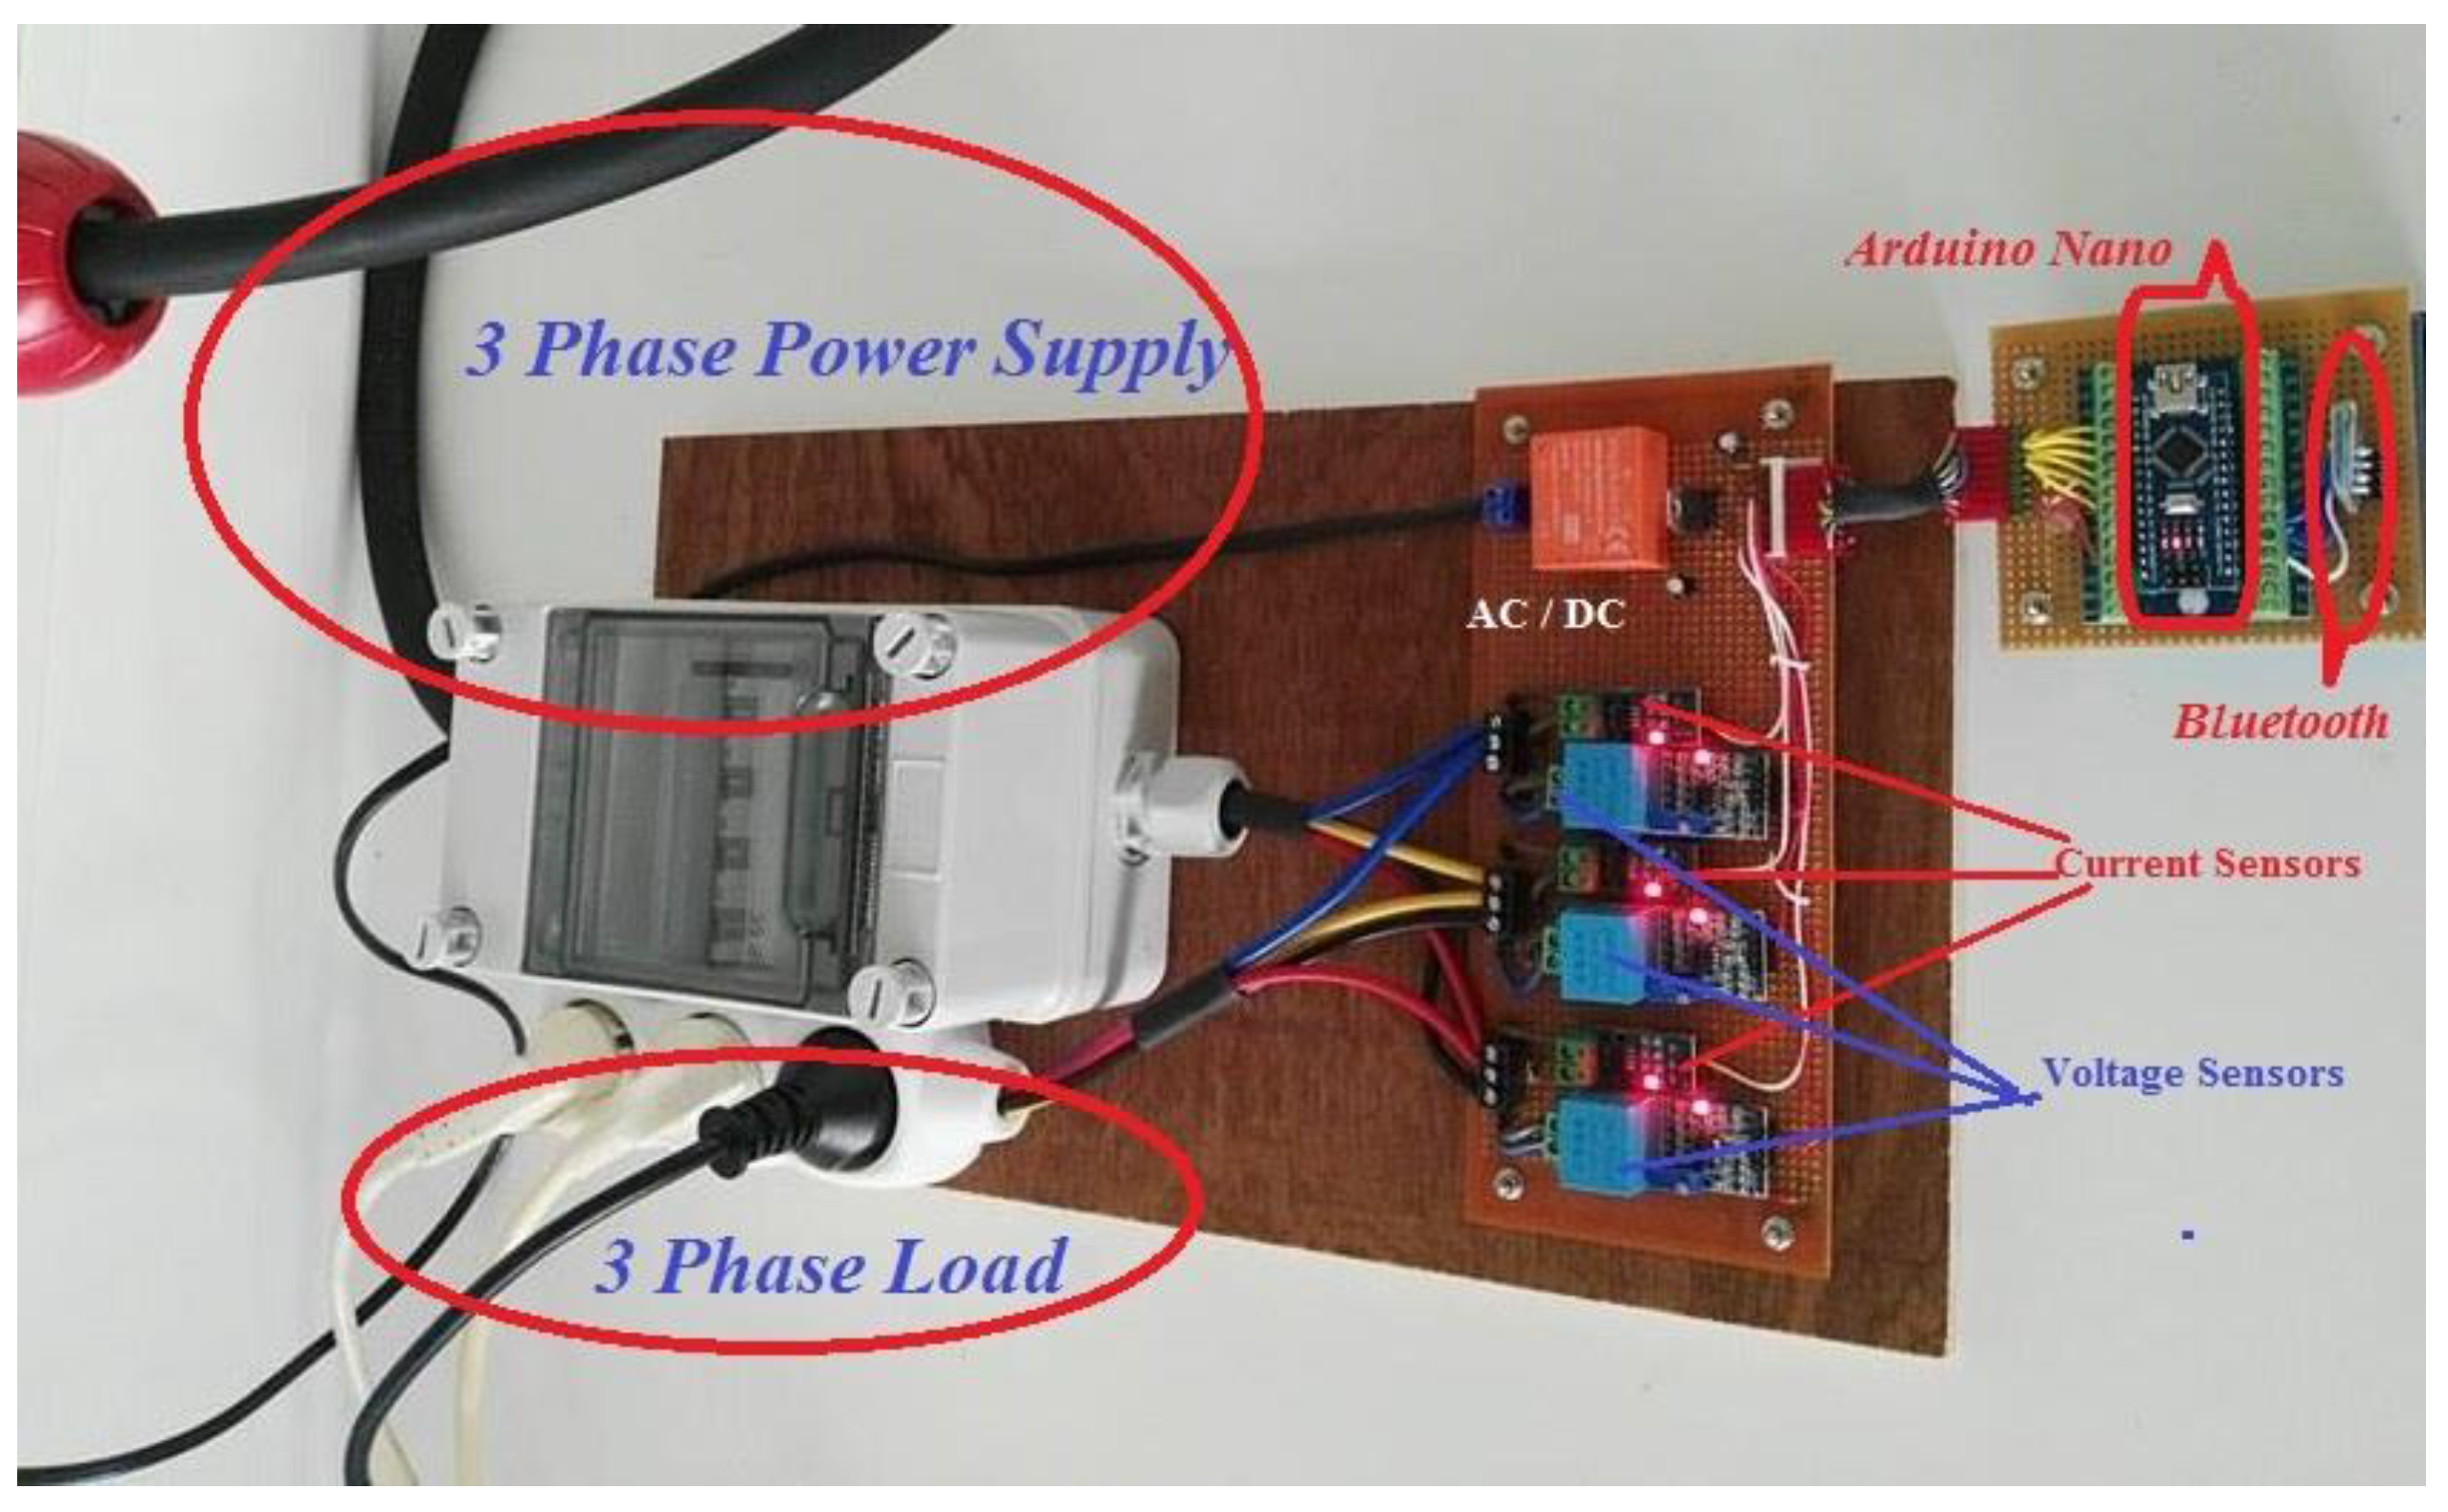
The SVCMS that has been designed in this research consists of voltage and current sensors for a three phase system, an Arduino Nano V3.0 microcontroller (electronics_lee Co. Ltd, Wuxi, China), Bluetooth HC-05 as the wireless communication system, and a new Android smartphone application designed to monitor the measured values.
Table 1 shows a list of the devices used in other proposals in this area.
4. Discussion and Results
There are more methods for controlling and monitoring a three phase circuit depending on the controller or the type of display for the results of the voltage and current. In this paper, a new method for monitoring and displaying the three phase system is given; this method is called the smart voltage and current monitoring system, or SVCMS, where a smartphone is used instead of traditional methods like an LCD display or an analog method for monitoring and displaying the results. It consists of two major parts which are the control and monitoring parts. The control part has four branches which are: a voltage sensor unit, a current sensor unit, the Arduino Nano V3.0 unit, and wireless communication unit (Bluetooth device), while the second part contains the monitoring part that monitors the voltage and current for three phases using the Android smartphone application which is written using the MIT App Inventor 2, an open source software platform available from Google for Android project applications.
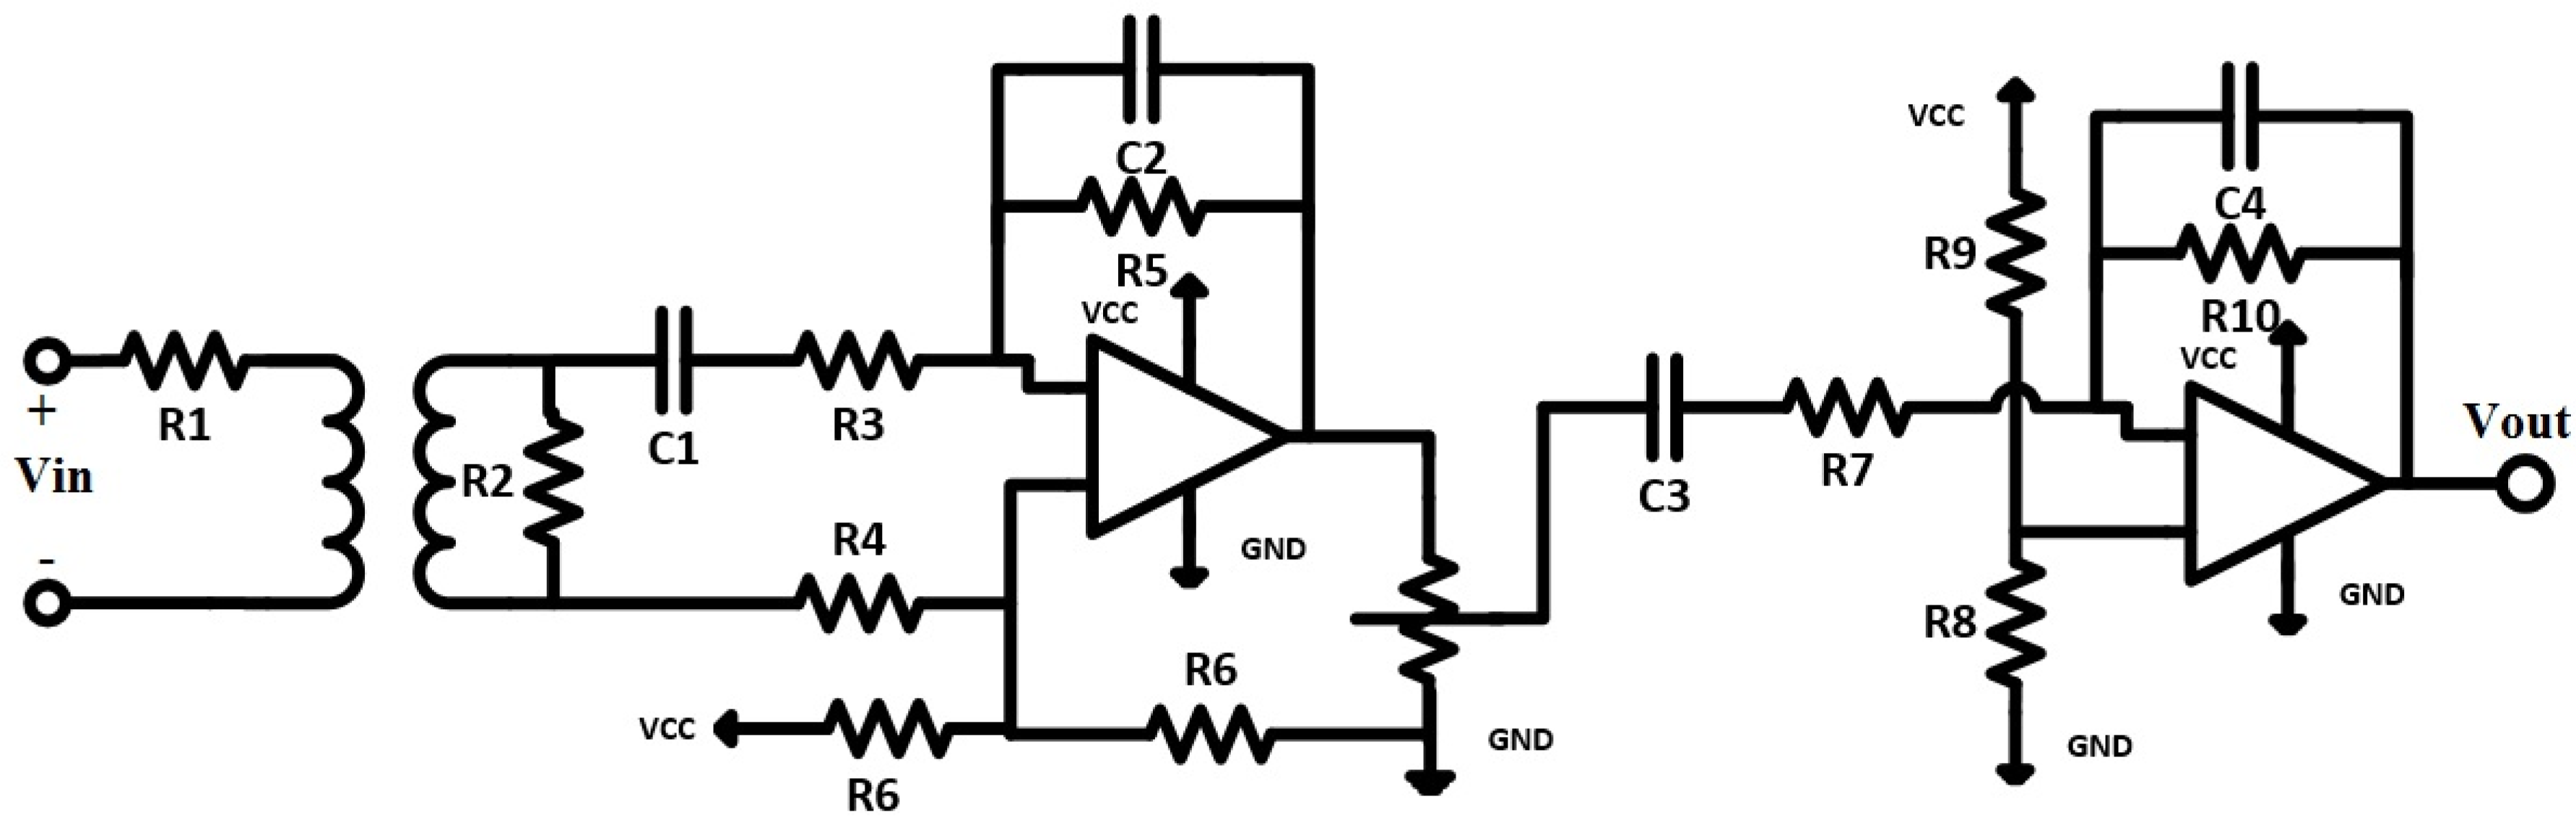
Now, the control part will be discussed. It mainly consists of two sensors for measuring the voltage and current. The voltage sensor contains the transformer and two op-amps (LM358). According to
Section 3.1.1 and the voltage sensor circuit in
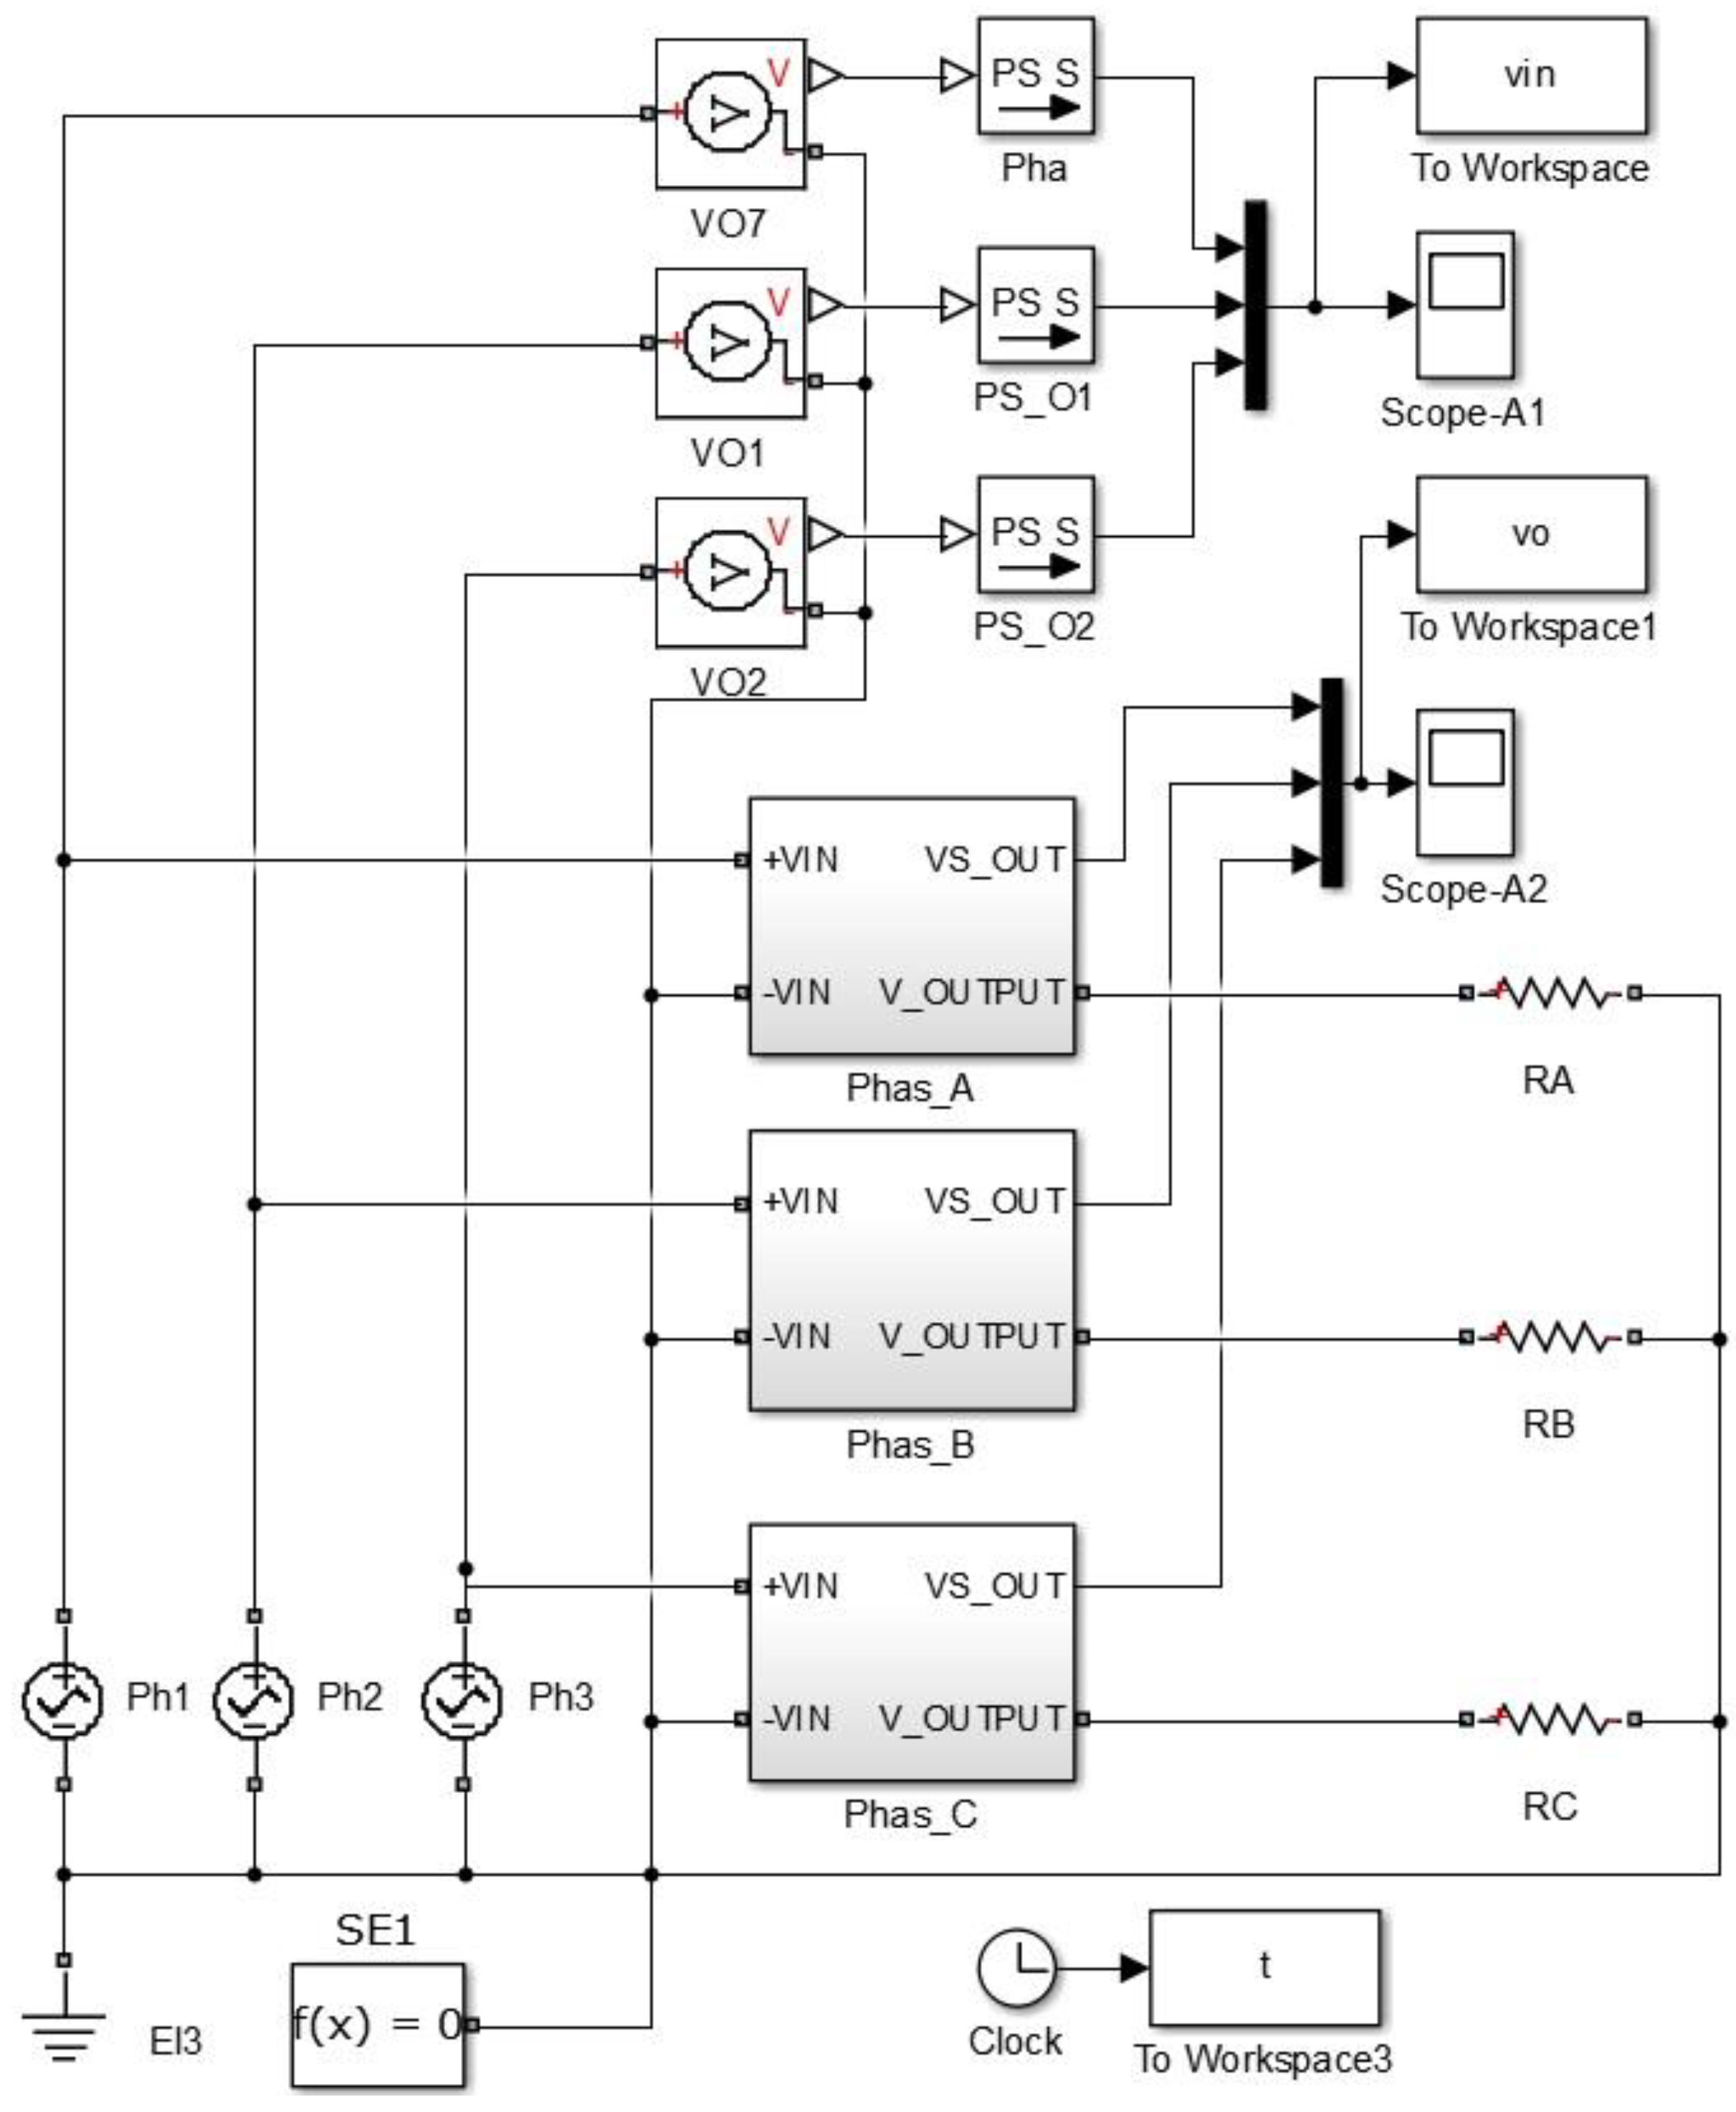
Figure 3, the Matlab Simulink simulation of the three phase voltage system is shown in
Figure 11.
Figure 12 shows the three phase voltage source and three voltage sensors.
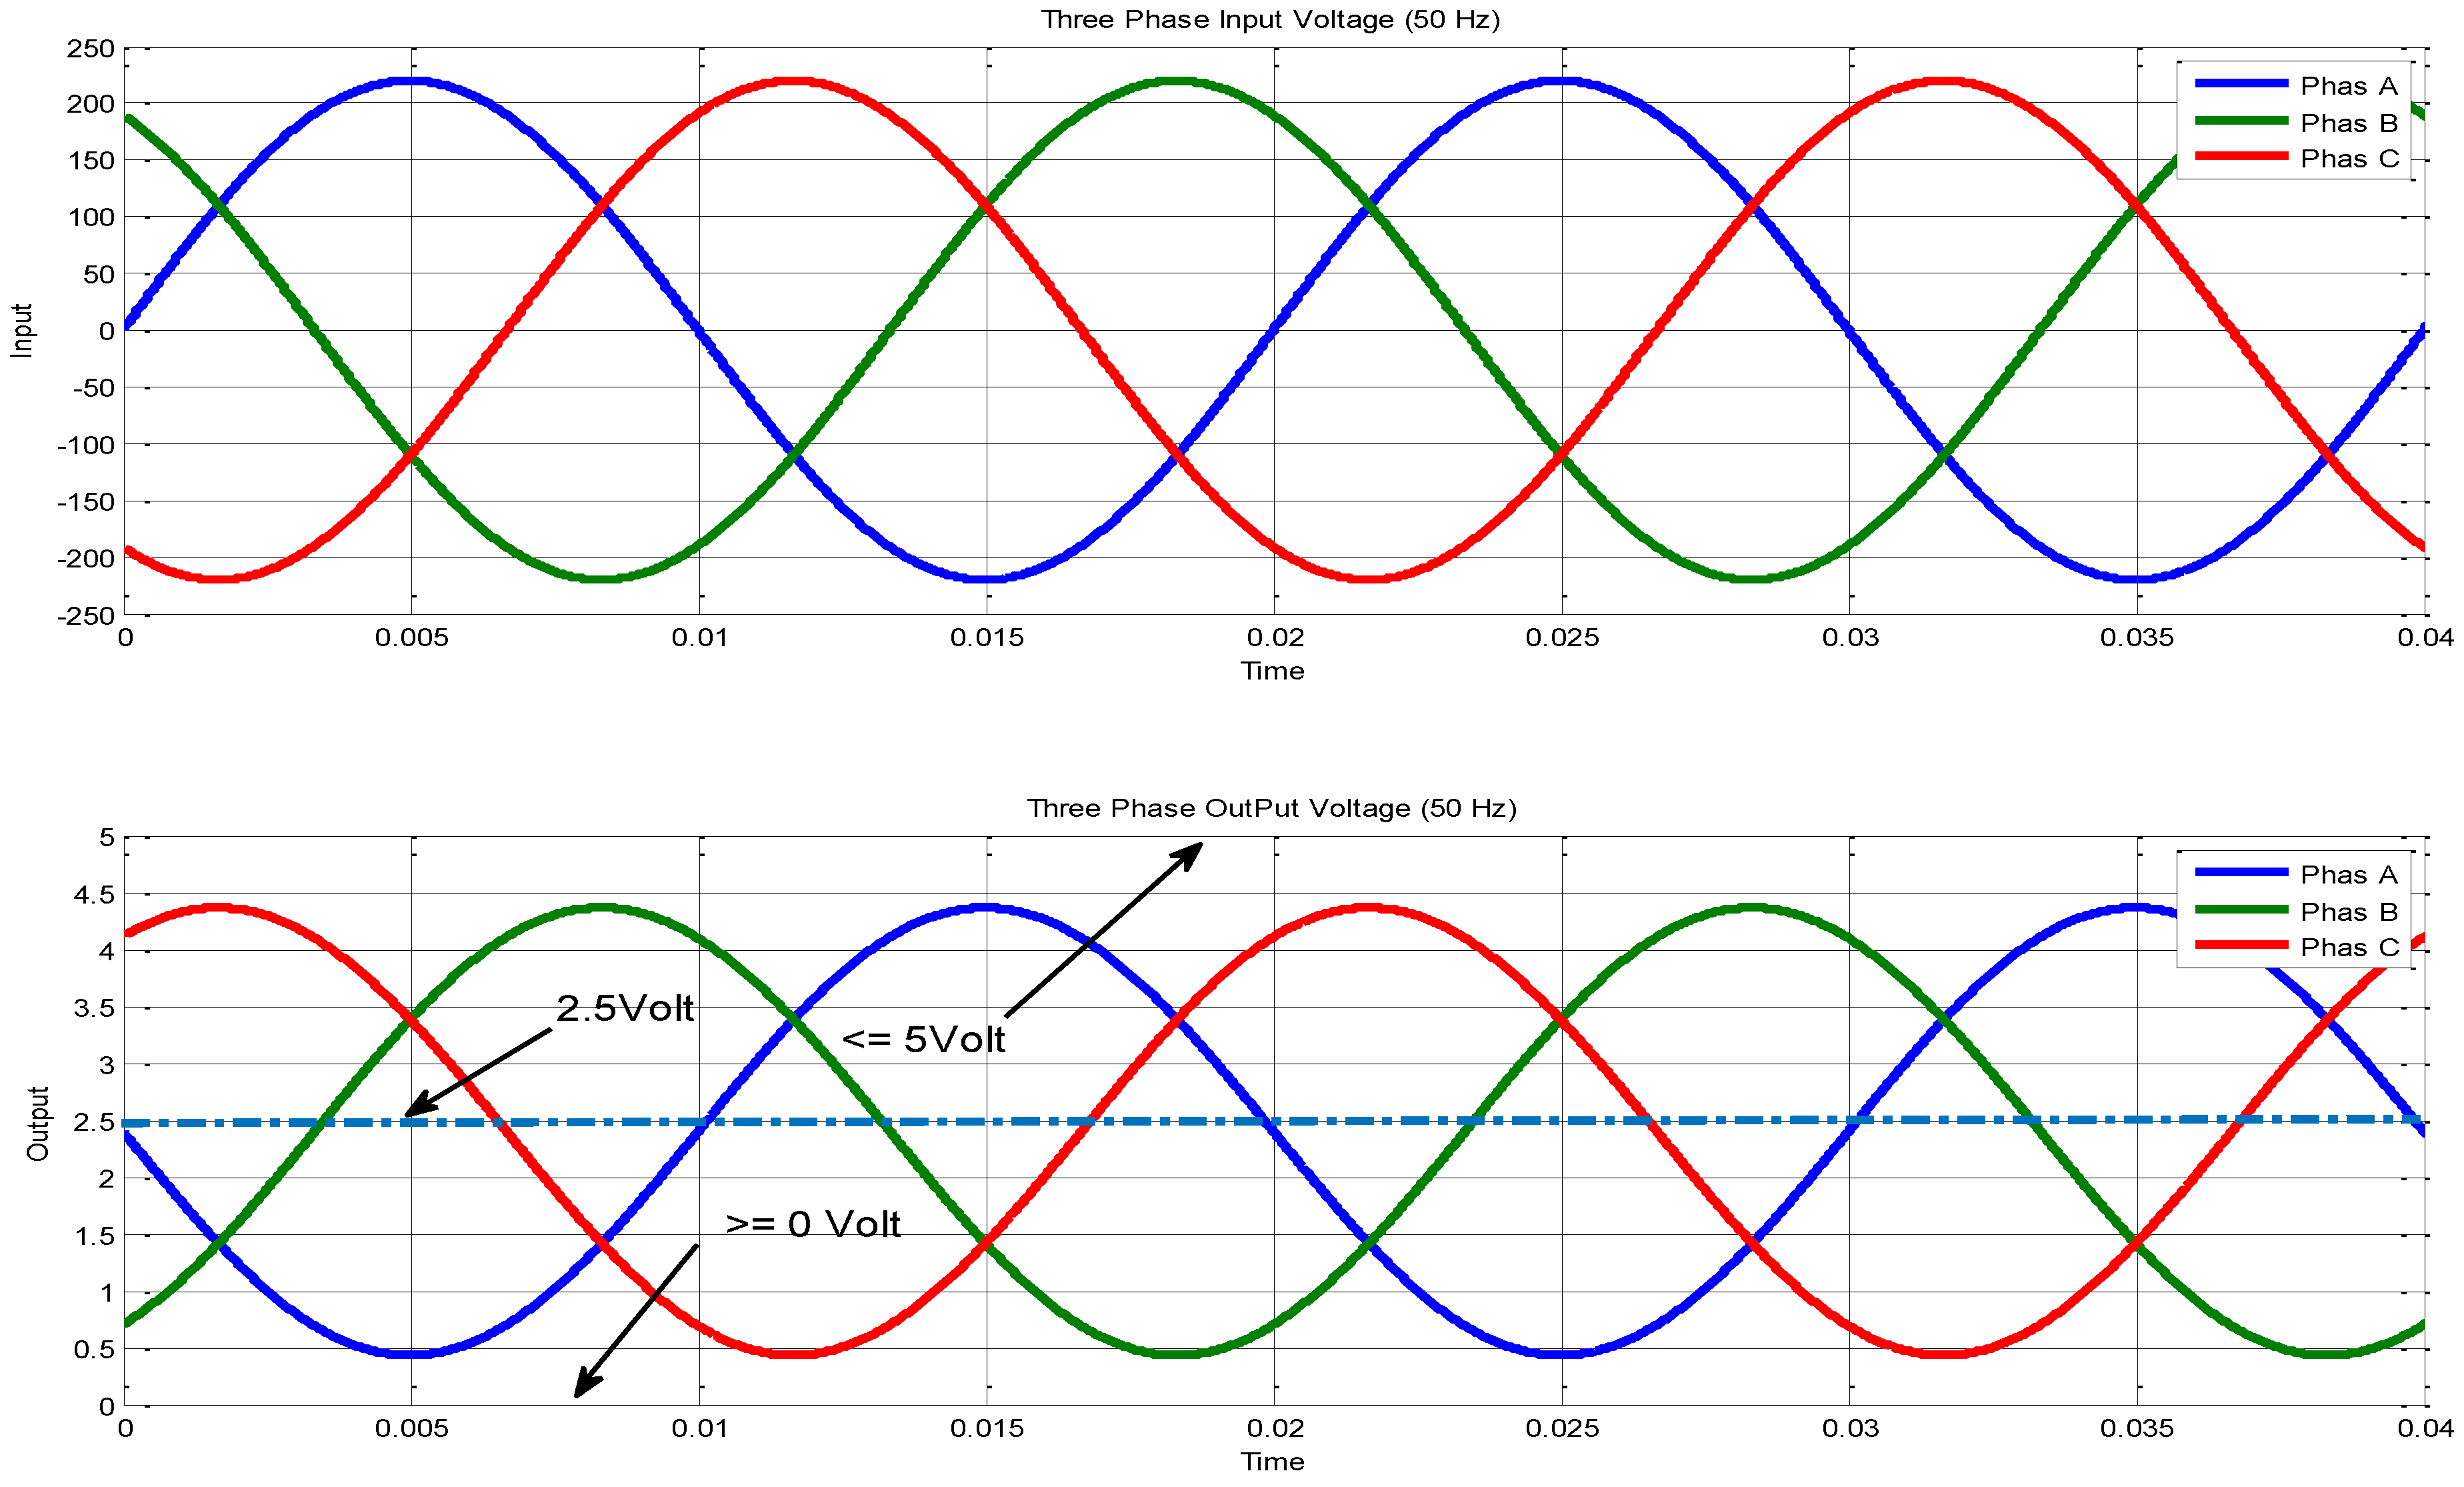
Figure 11 explains how the voltage can be simulated using the Matlab/Simulink in which the input voltage is shown in scope-A1 (which is about 230 V) while the output voltage can be measured in pin VS-OUT and these three phase voltages (phase-A, phase-B, and phase-C) can be shown through the scope-A2 (this voltage is about 5 V). The waveform of input and output voltage of
Figure 11 is shown in
Figure 12. The input voltage sine wave is offset equal to zero and upper with lower voltage of 230 V. The output voltage in
Figure 12 ranges between 0 and 5 V for the microcontroller which is offset around 2.5 V. This circuit is used to reduce the voltage in order to deal with the high voltage.
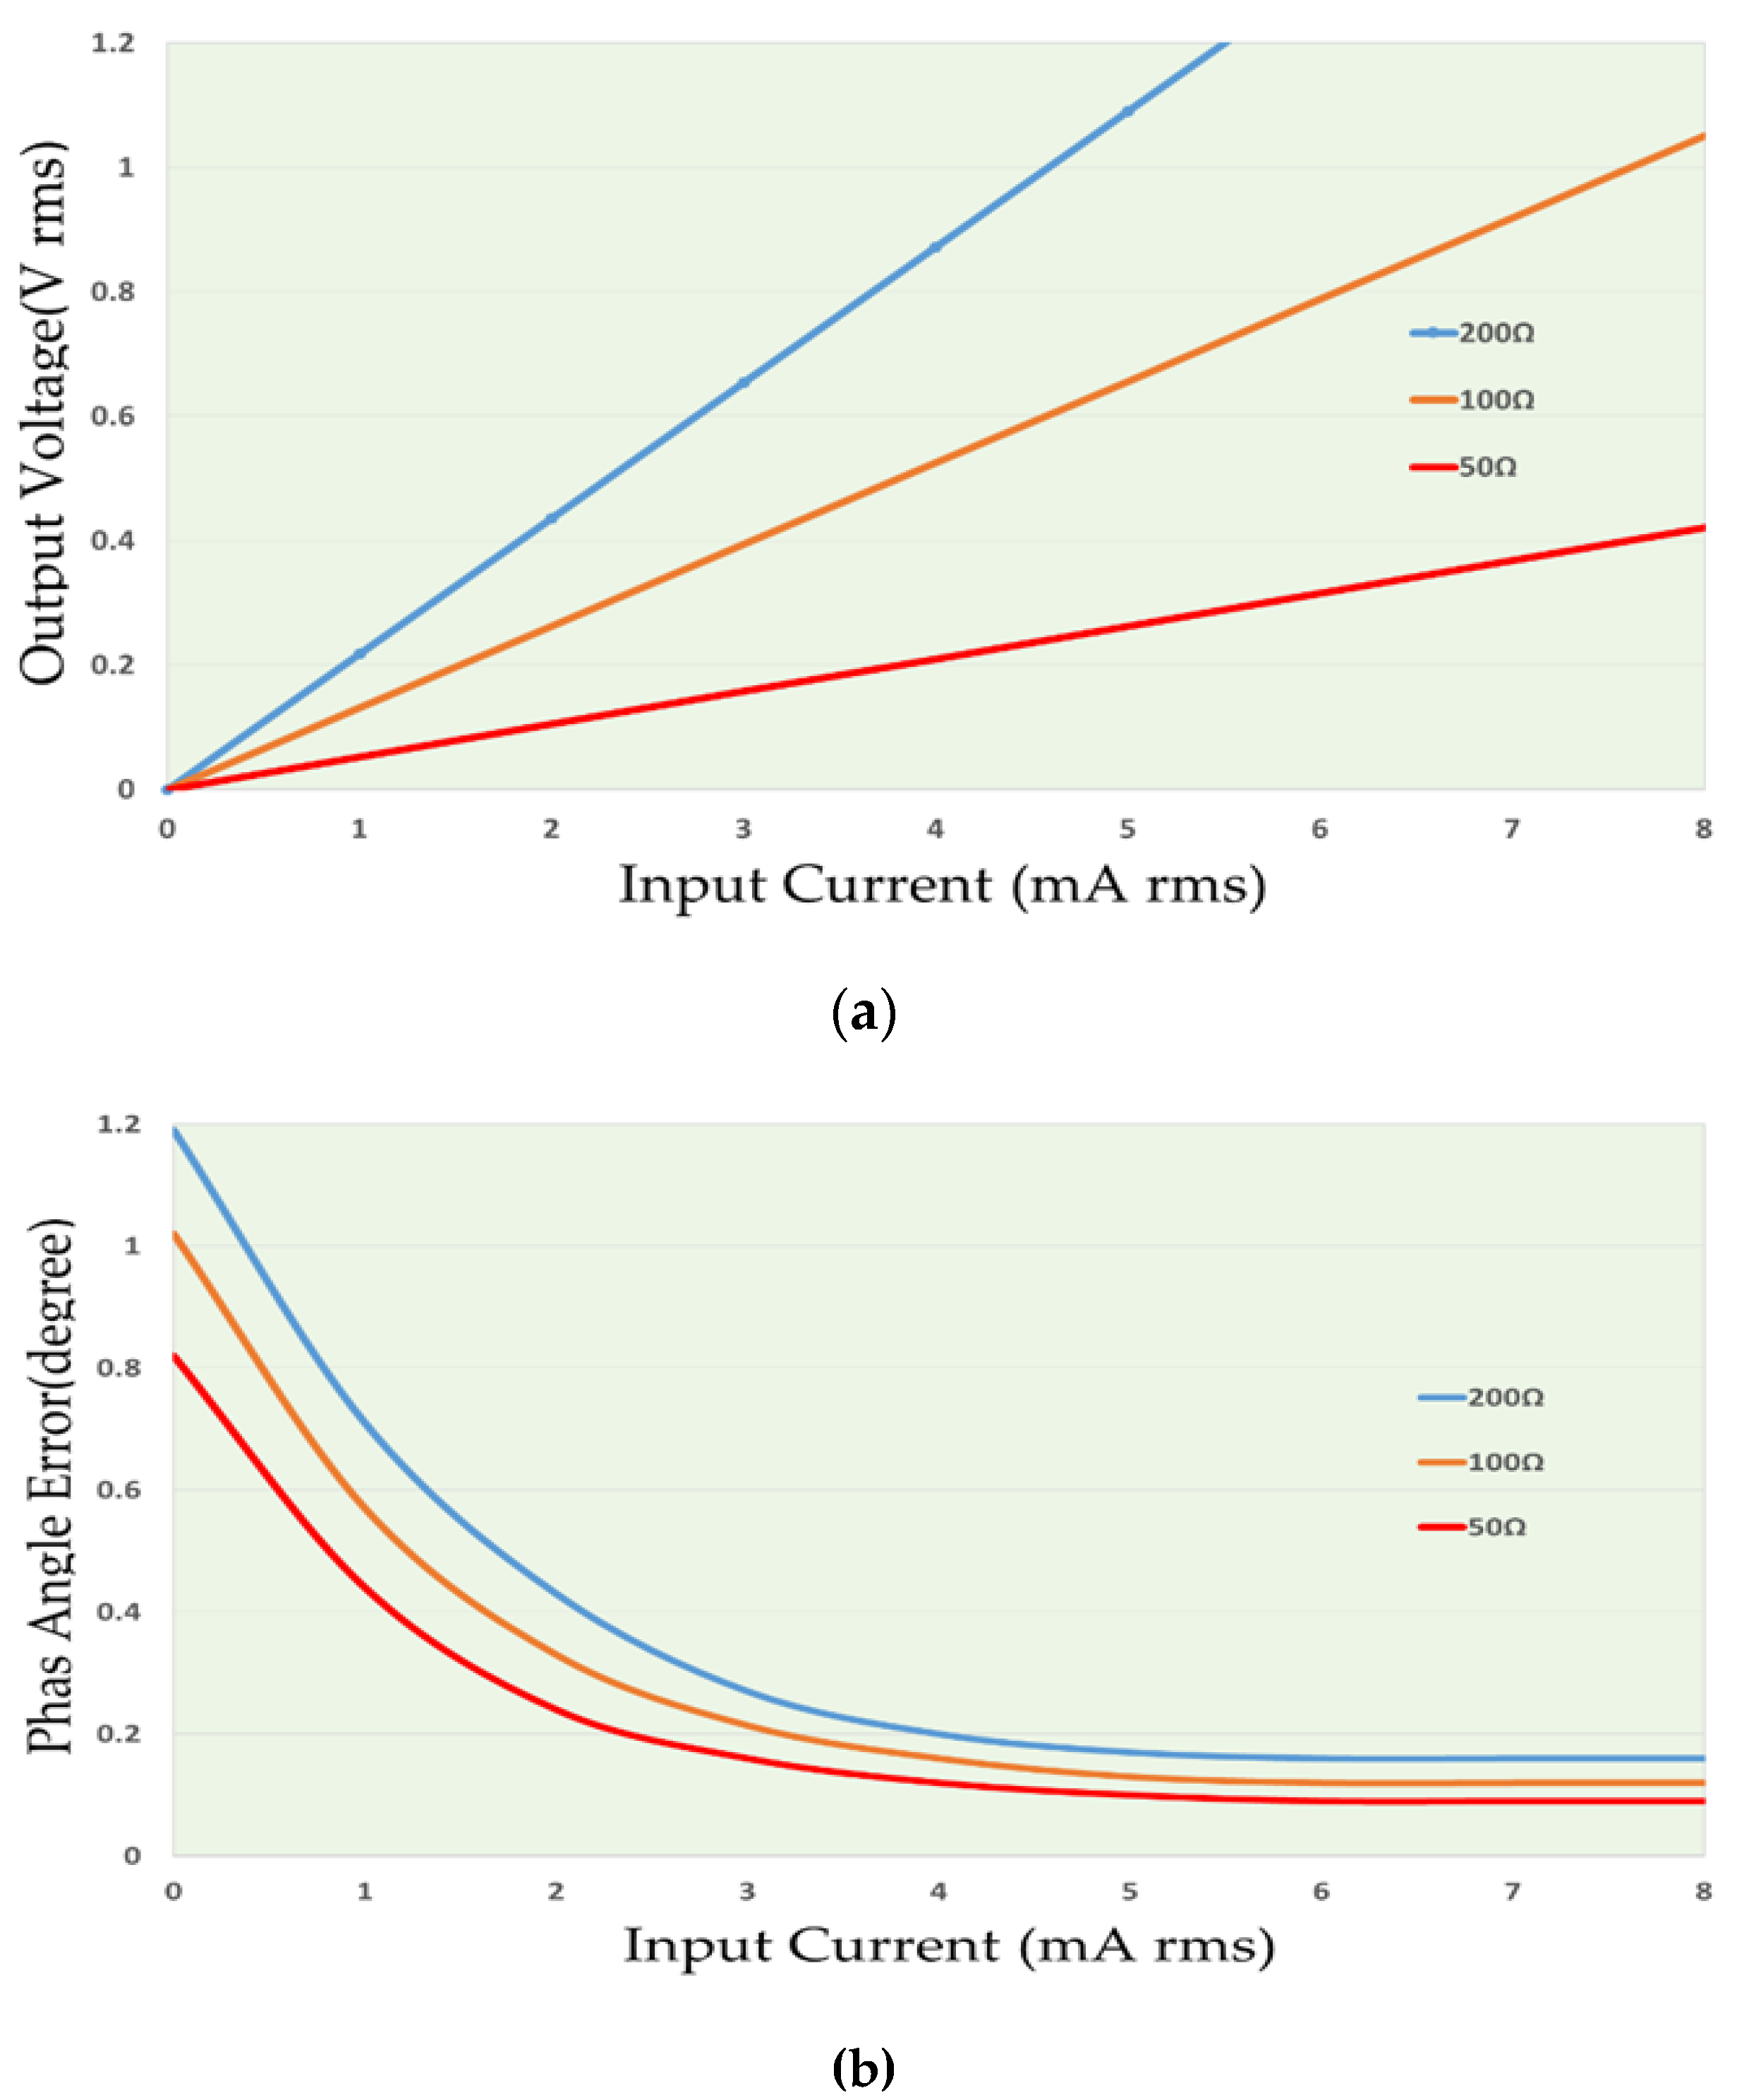
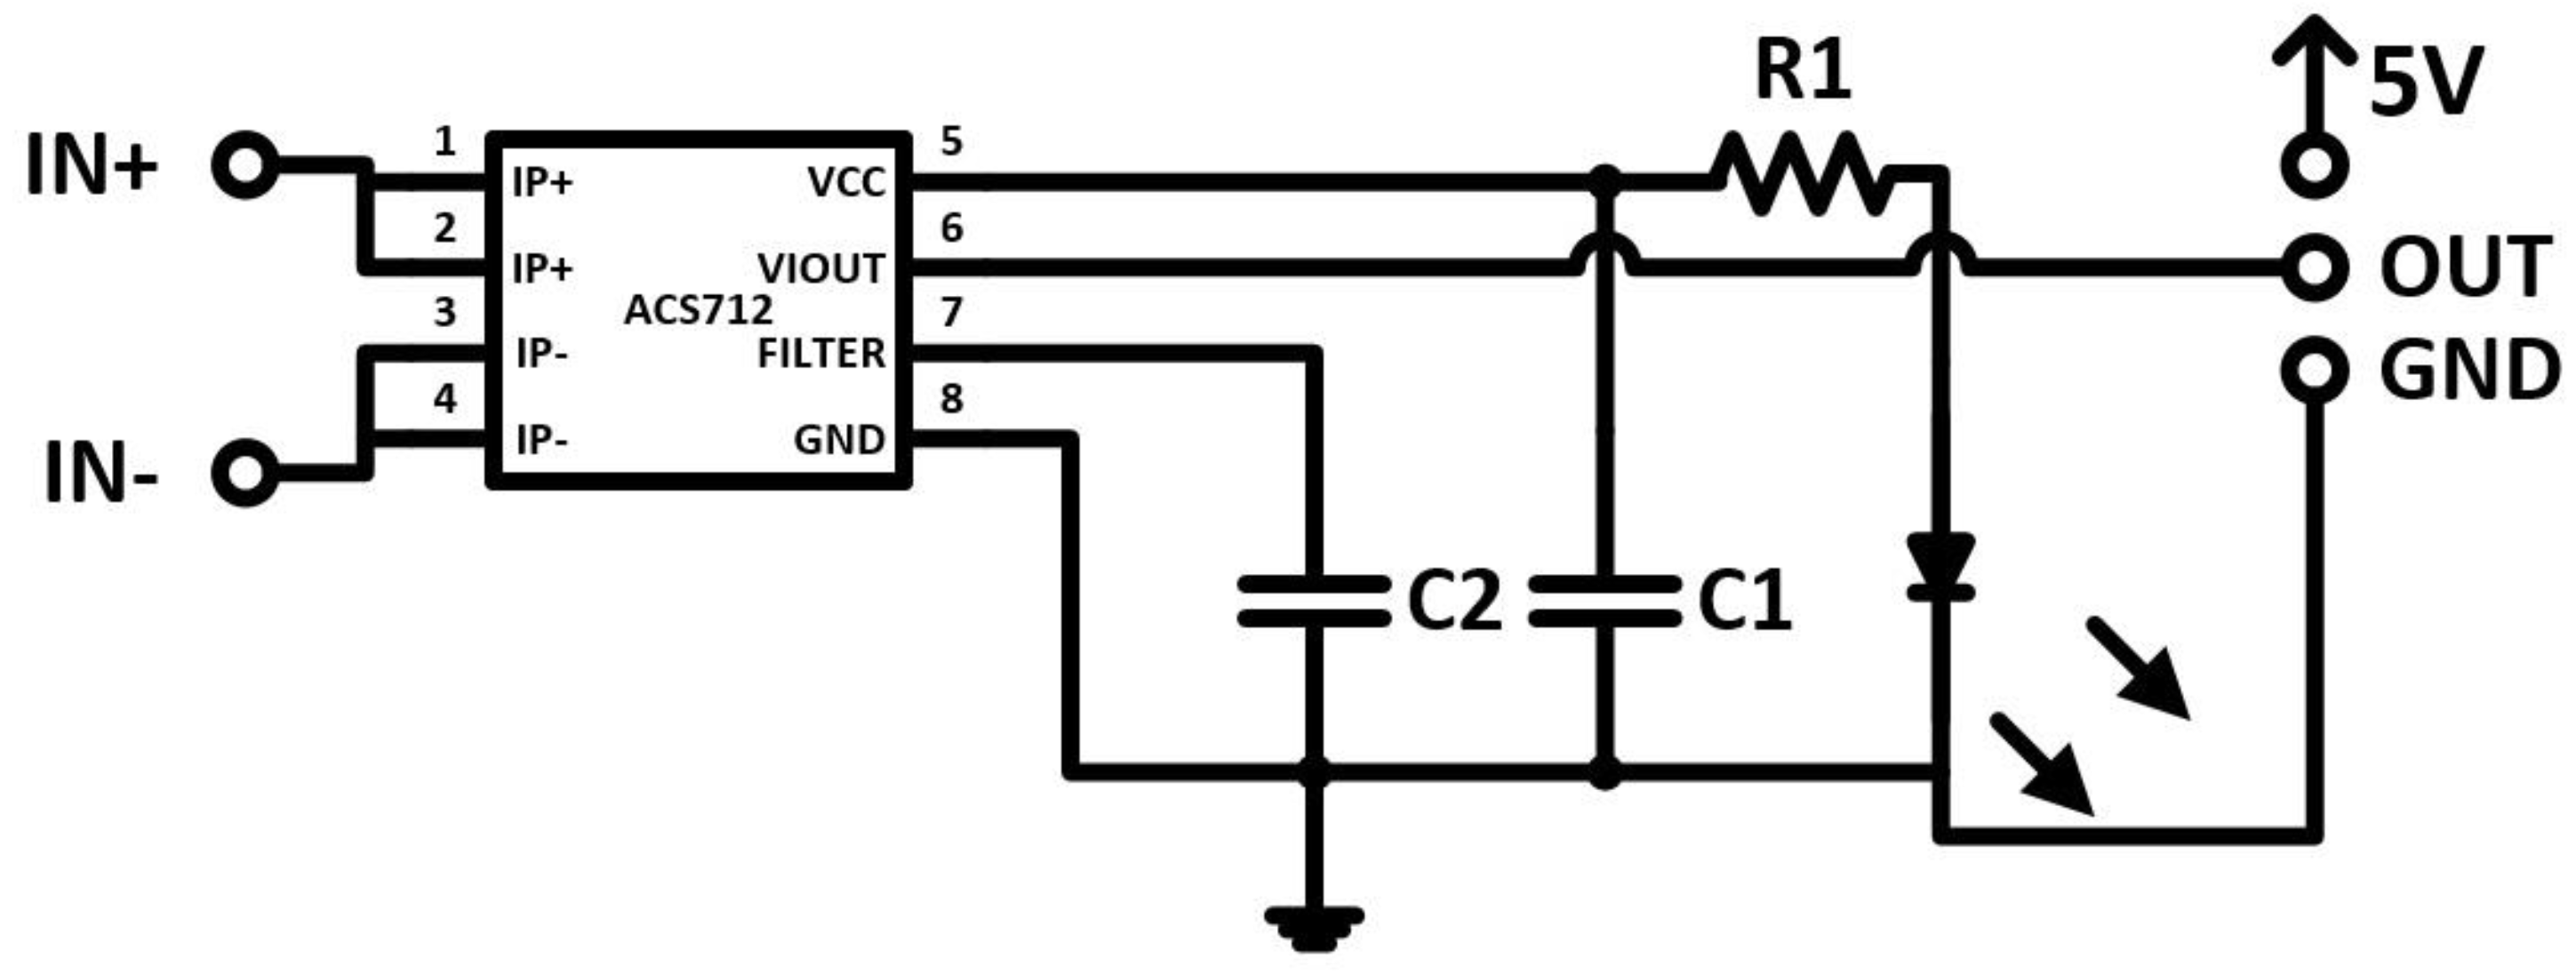
The second sensor is the current sensor, as shown in
Figure 5, which is based on the ACS712 IC sensor. This sensor can work under a limit of 30 A with 66 mV/A sensitivity with +5 V DC power supply.
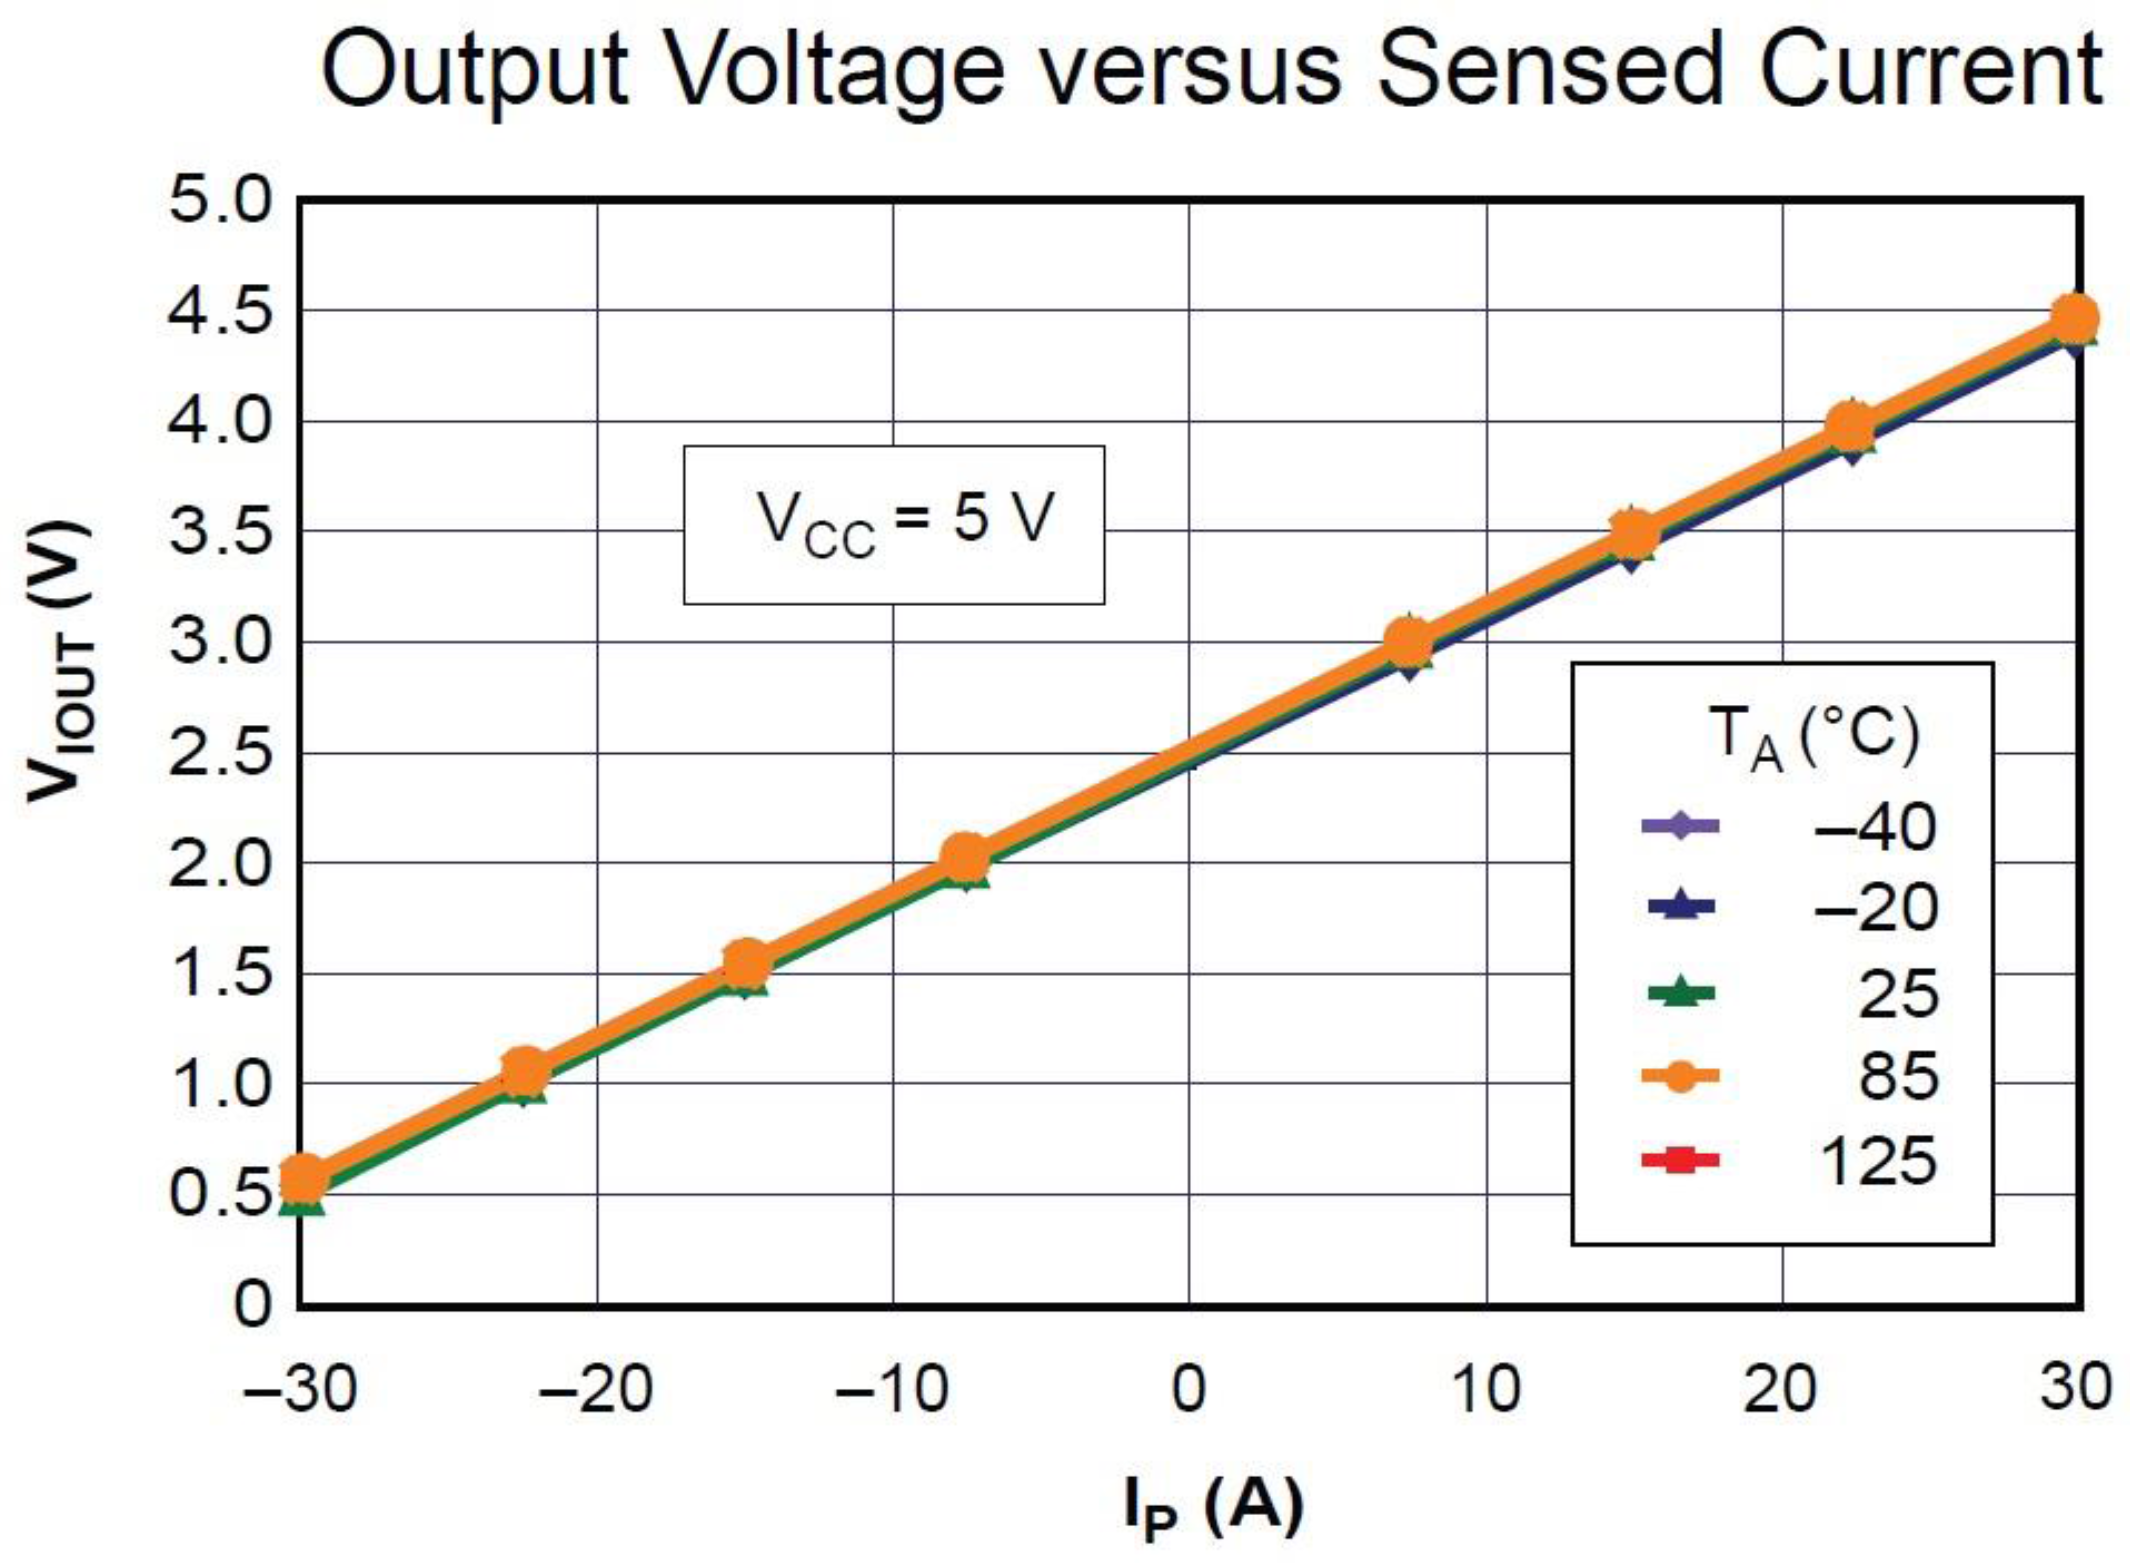
Figure 6 explains the relation between the output voltage and phase current and it can be noticed that the relation is linear under different temperature conditions from −40 °C to 125 °C; this relation increase is exactly linear and that means the increase in current taken will lead to an increase in the voltage output. Also one can notice that the change in temperature will not affect the activity of this circuit.
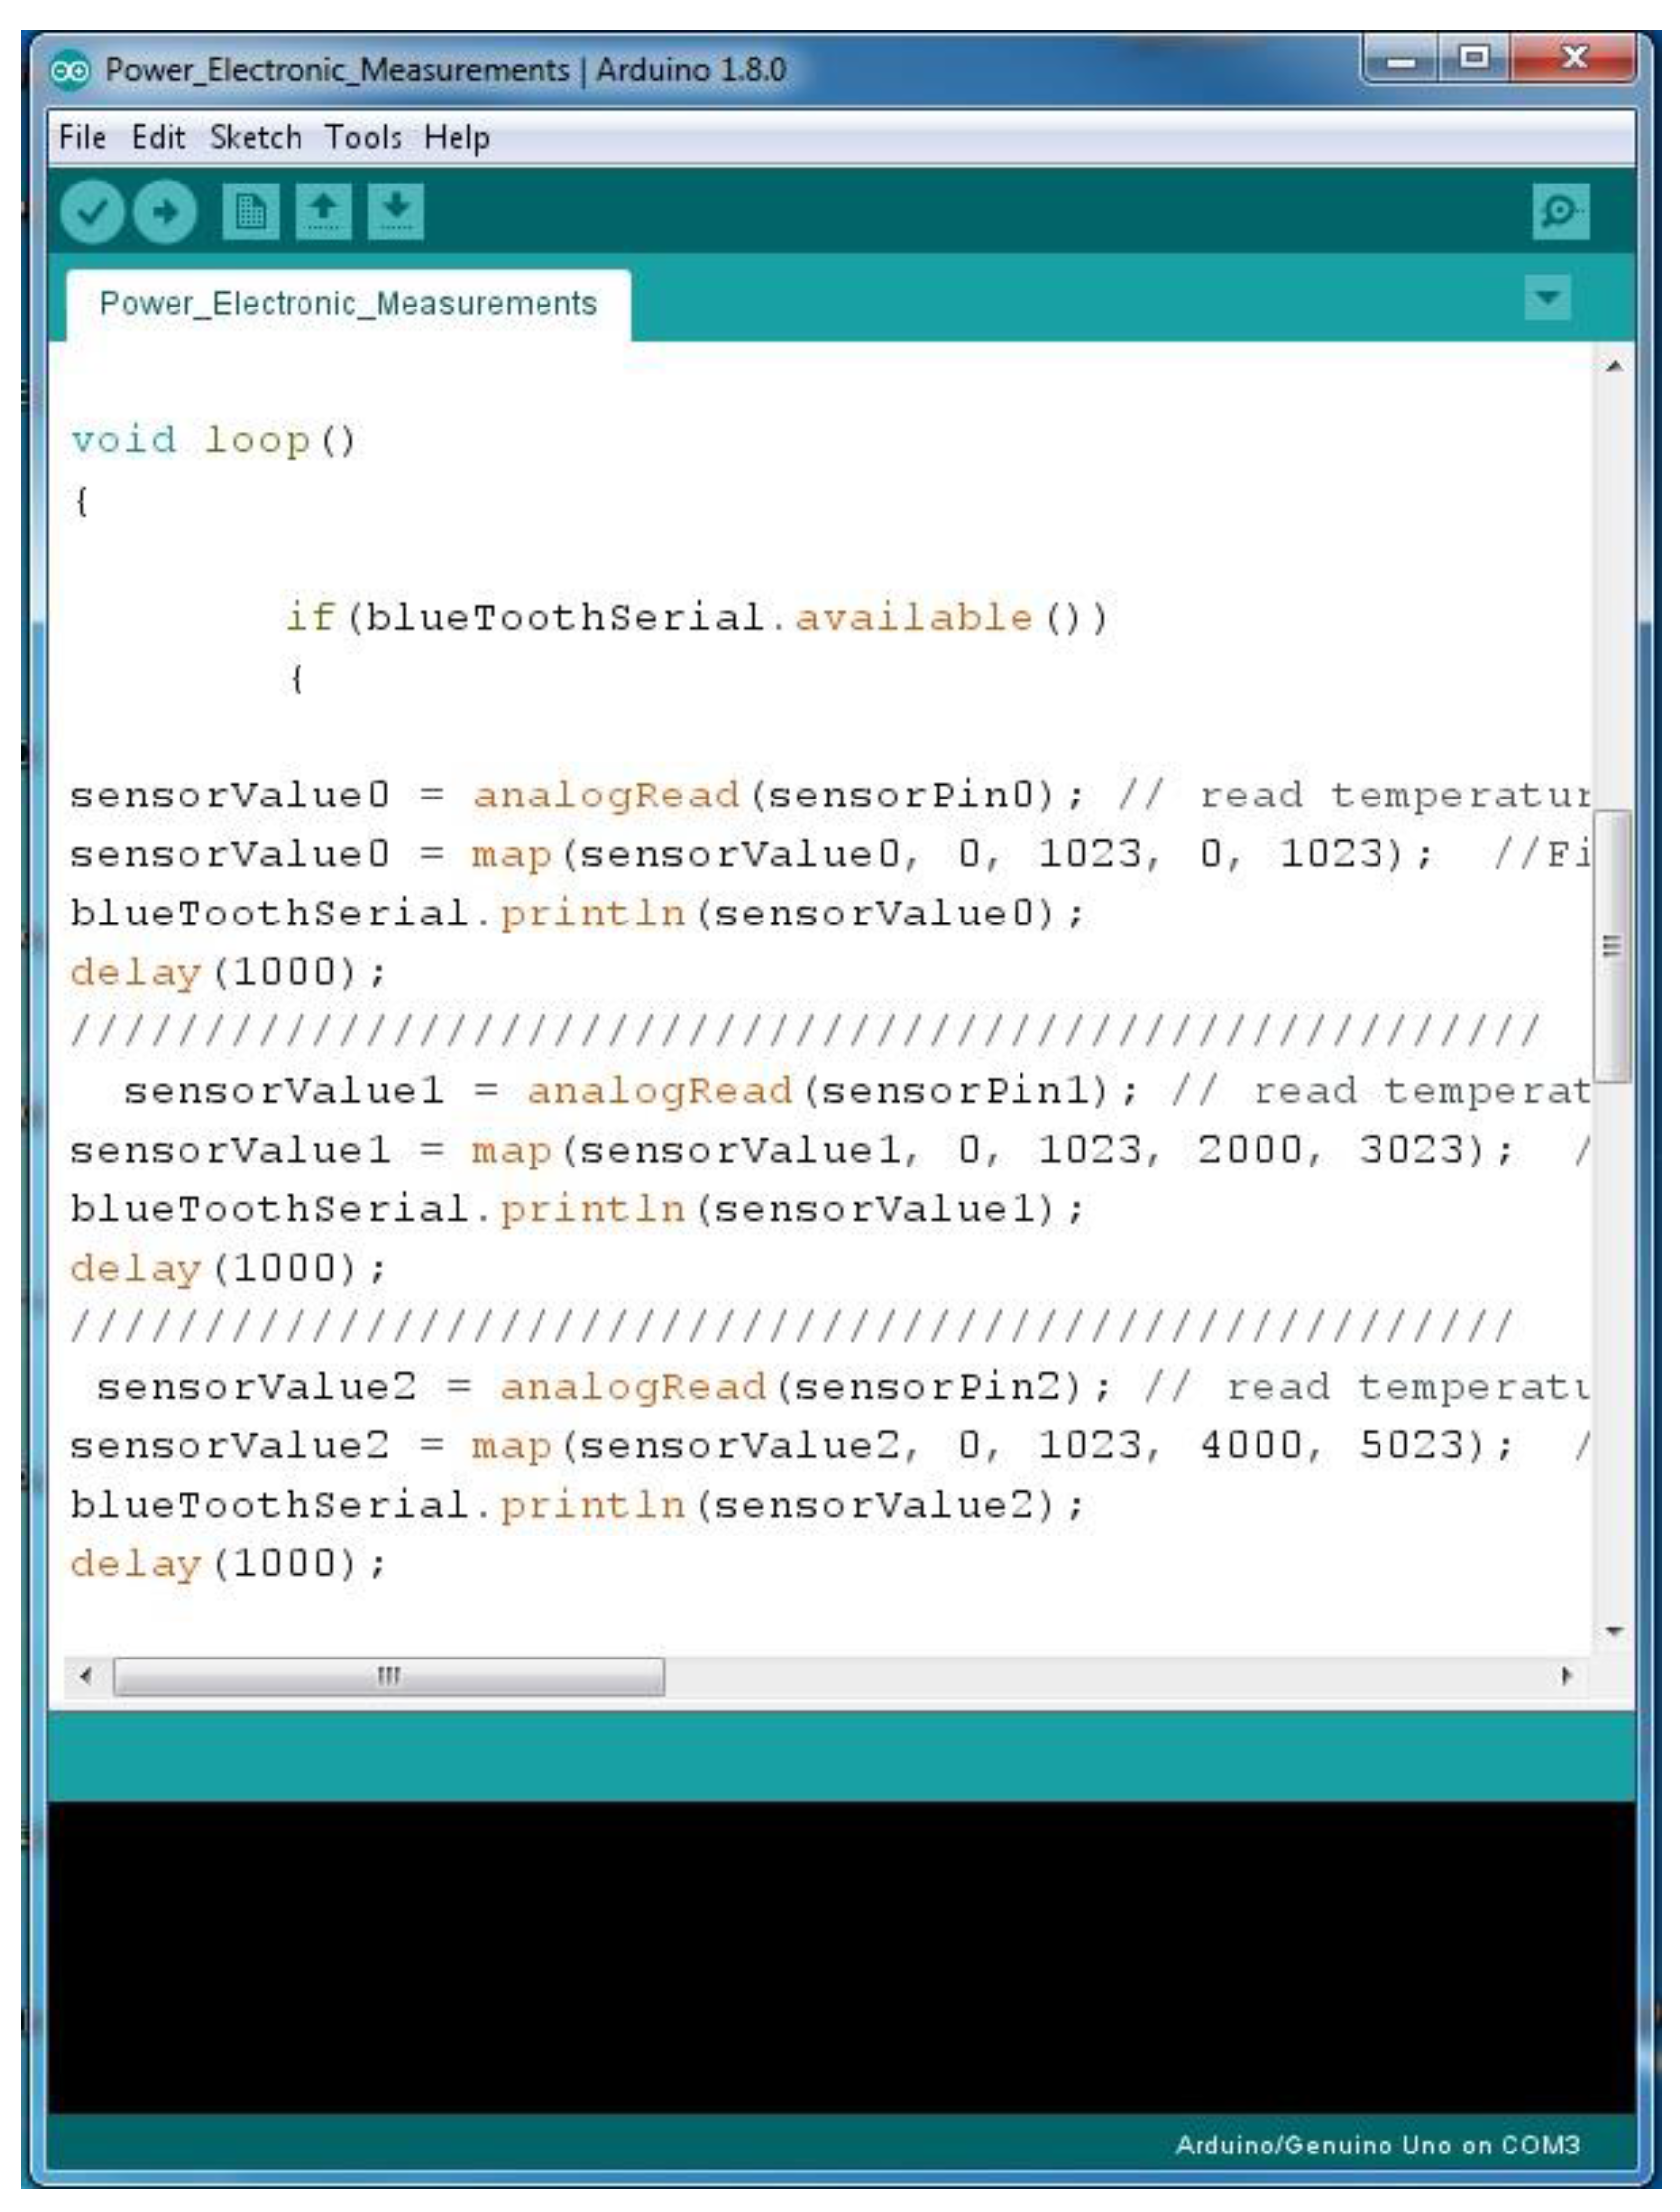
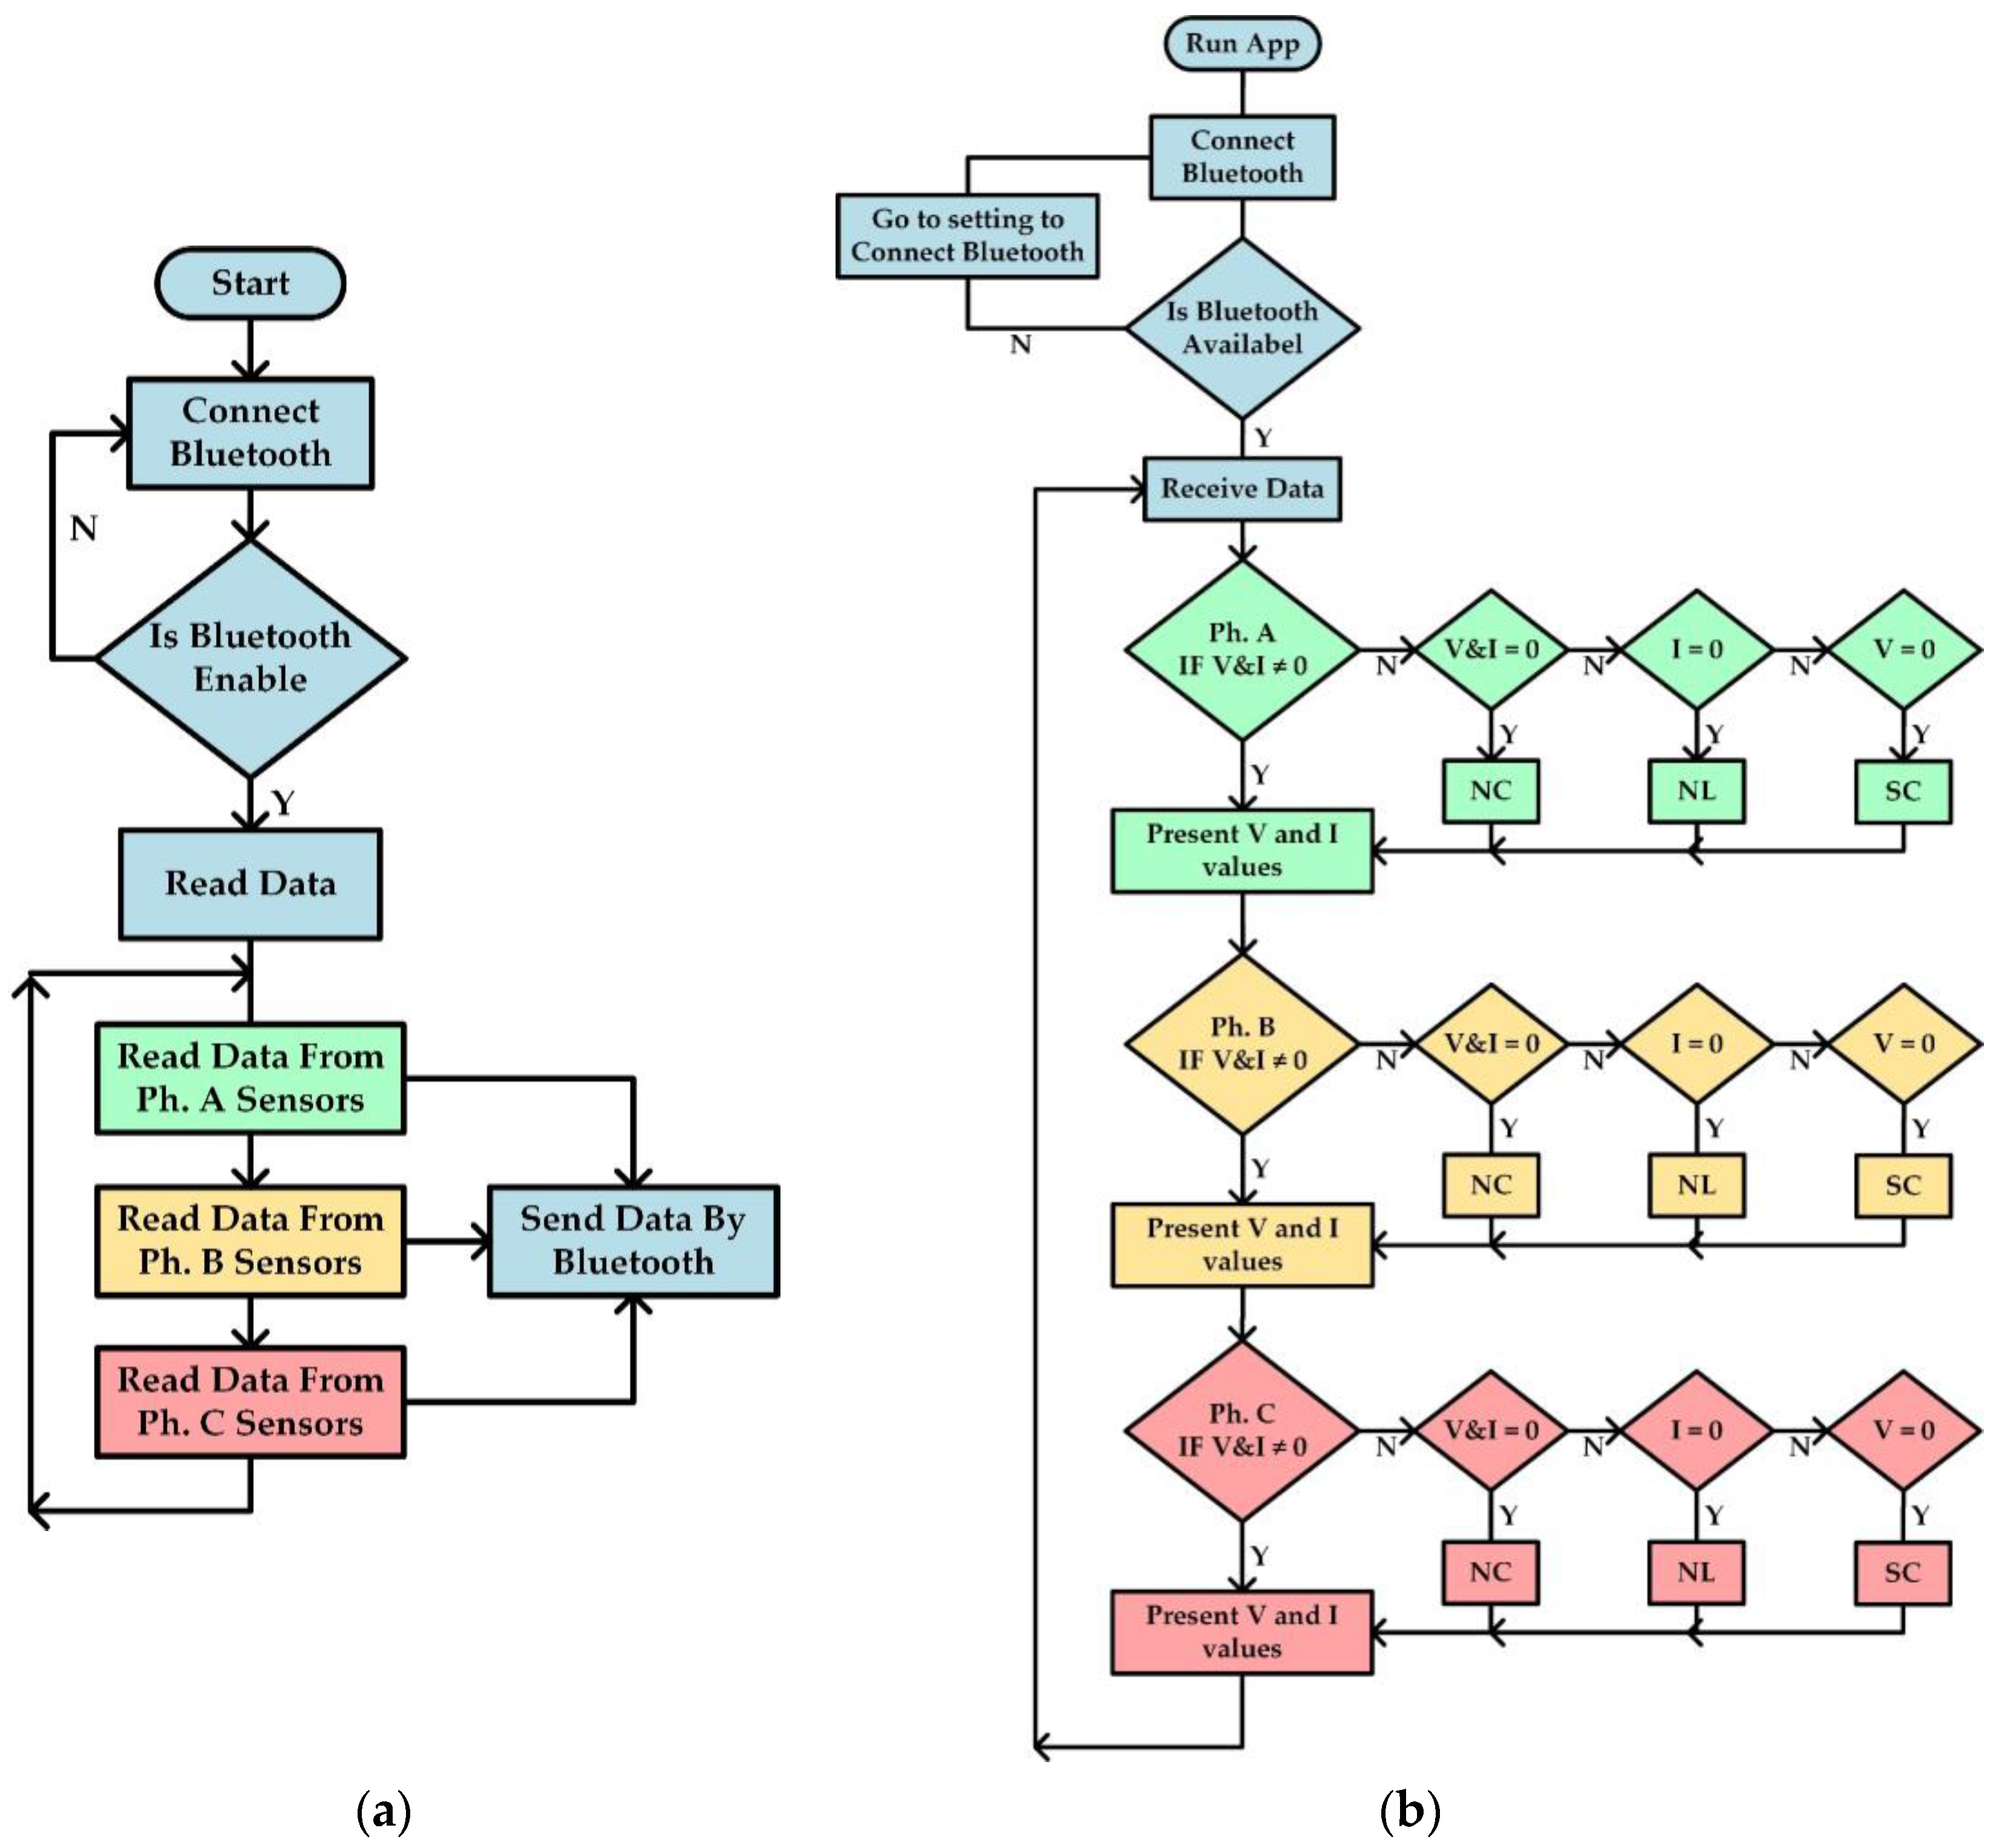
The control and software flowchart of the SVCMS is shown in
Figure 13. According to
Section 3.2, the flowchart in
Figure 13a shows how the control system works (reading data from sensors and sending this data after calculating the RMS values by Arduino Nano through the Bluetooth HC-05 to the end user).
Figure 13b shows the flowchart of the smartphone application program and how to receive data by smartphone Bluetooth from the microcontroller (control system) and then monitor the results. It can be noted that the smartphone checks the Bluetooth device to see if it is active or not in order to receive the data from the Bluetooth device HC-05 that is connected with Arduino Nano. After reading the data it will check every phase and will begin with phase A. If the voltage and current have values and is never equal to zero then it will display these values, while if the voltage is zero then it will display the (SC) and with current equal to zero display (NL) and with together equal to zero then display (NC). After that the program will check the second phase (phase B) and repeat the same steps for phase A, then go to phase C and repeat same procedure for the other two phases. Finally, it will return to “receive data” and repeat the same procedure in order to update the reading and display the new data received.
According to the Matlab/Simulink waveform in
Figure 12, the Arduino Nano V3.0 calculates the RMS Value for voltage and current by Equations (2) and (3). The three phase voltage is presented in Equations (4)–(6):
where
T = 1/frequency
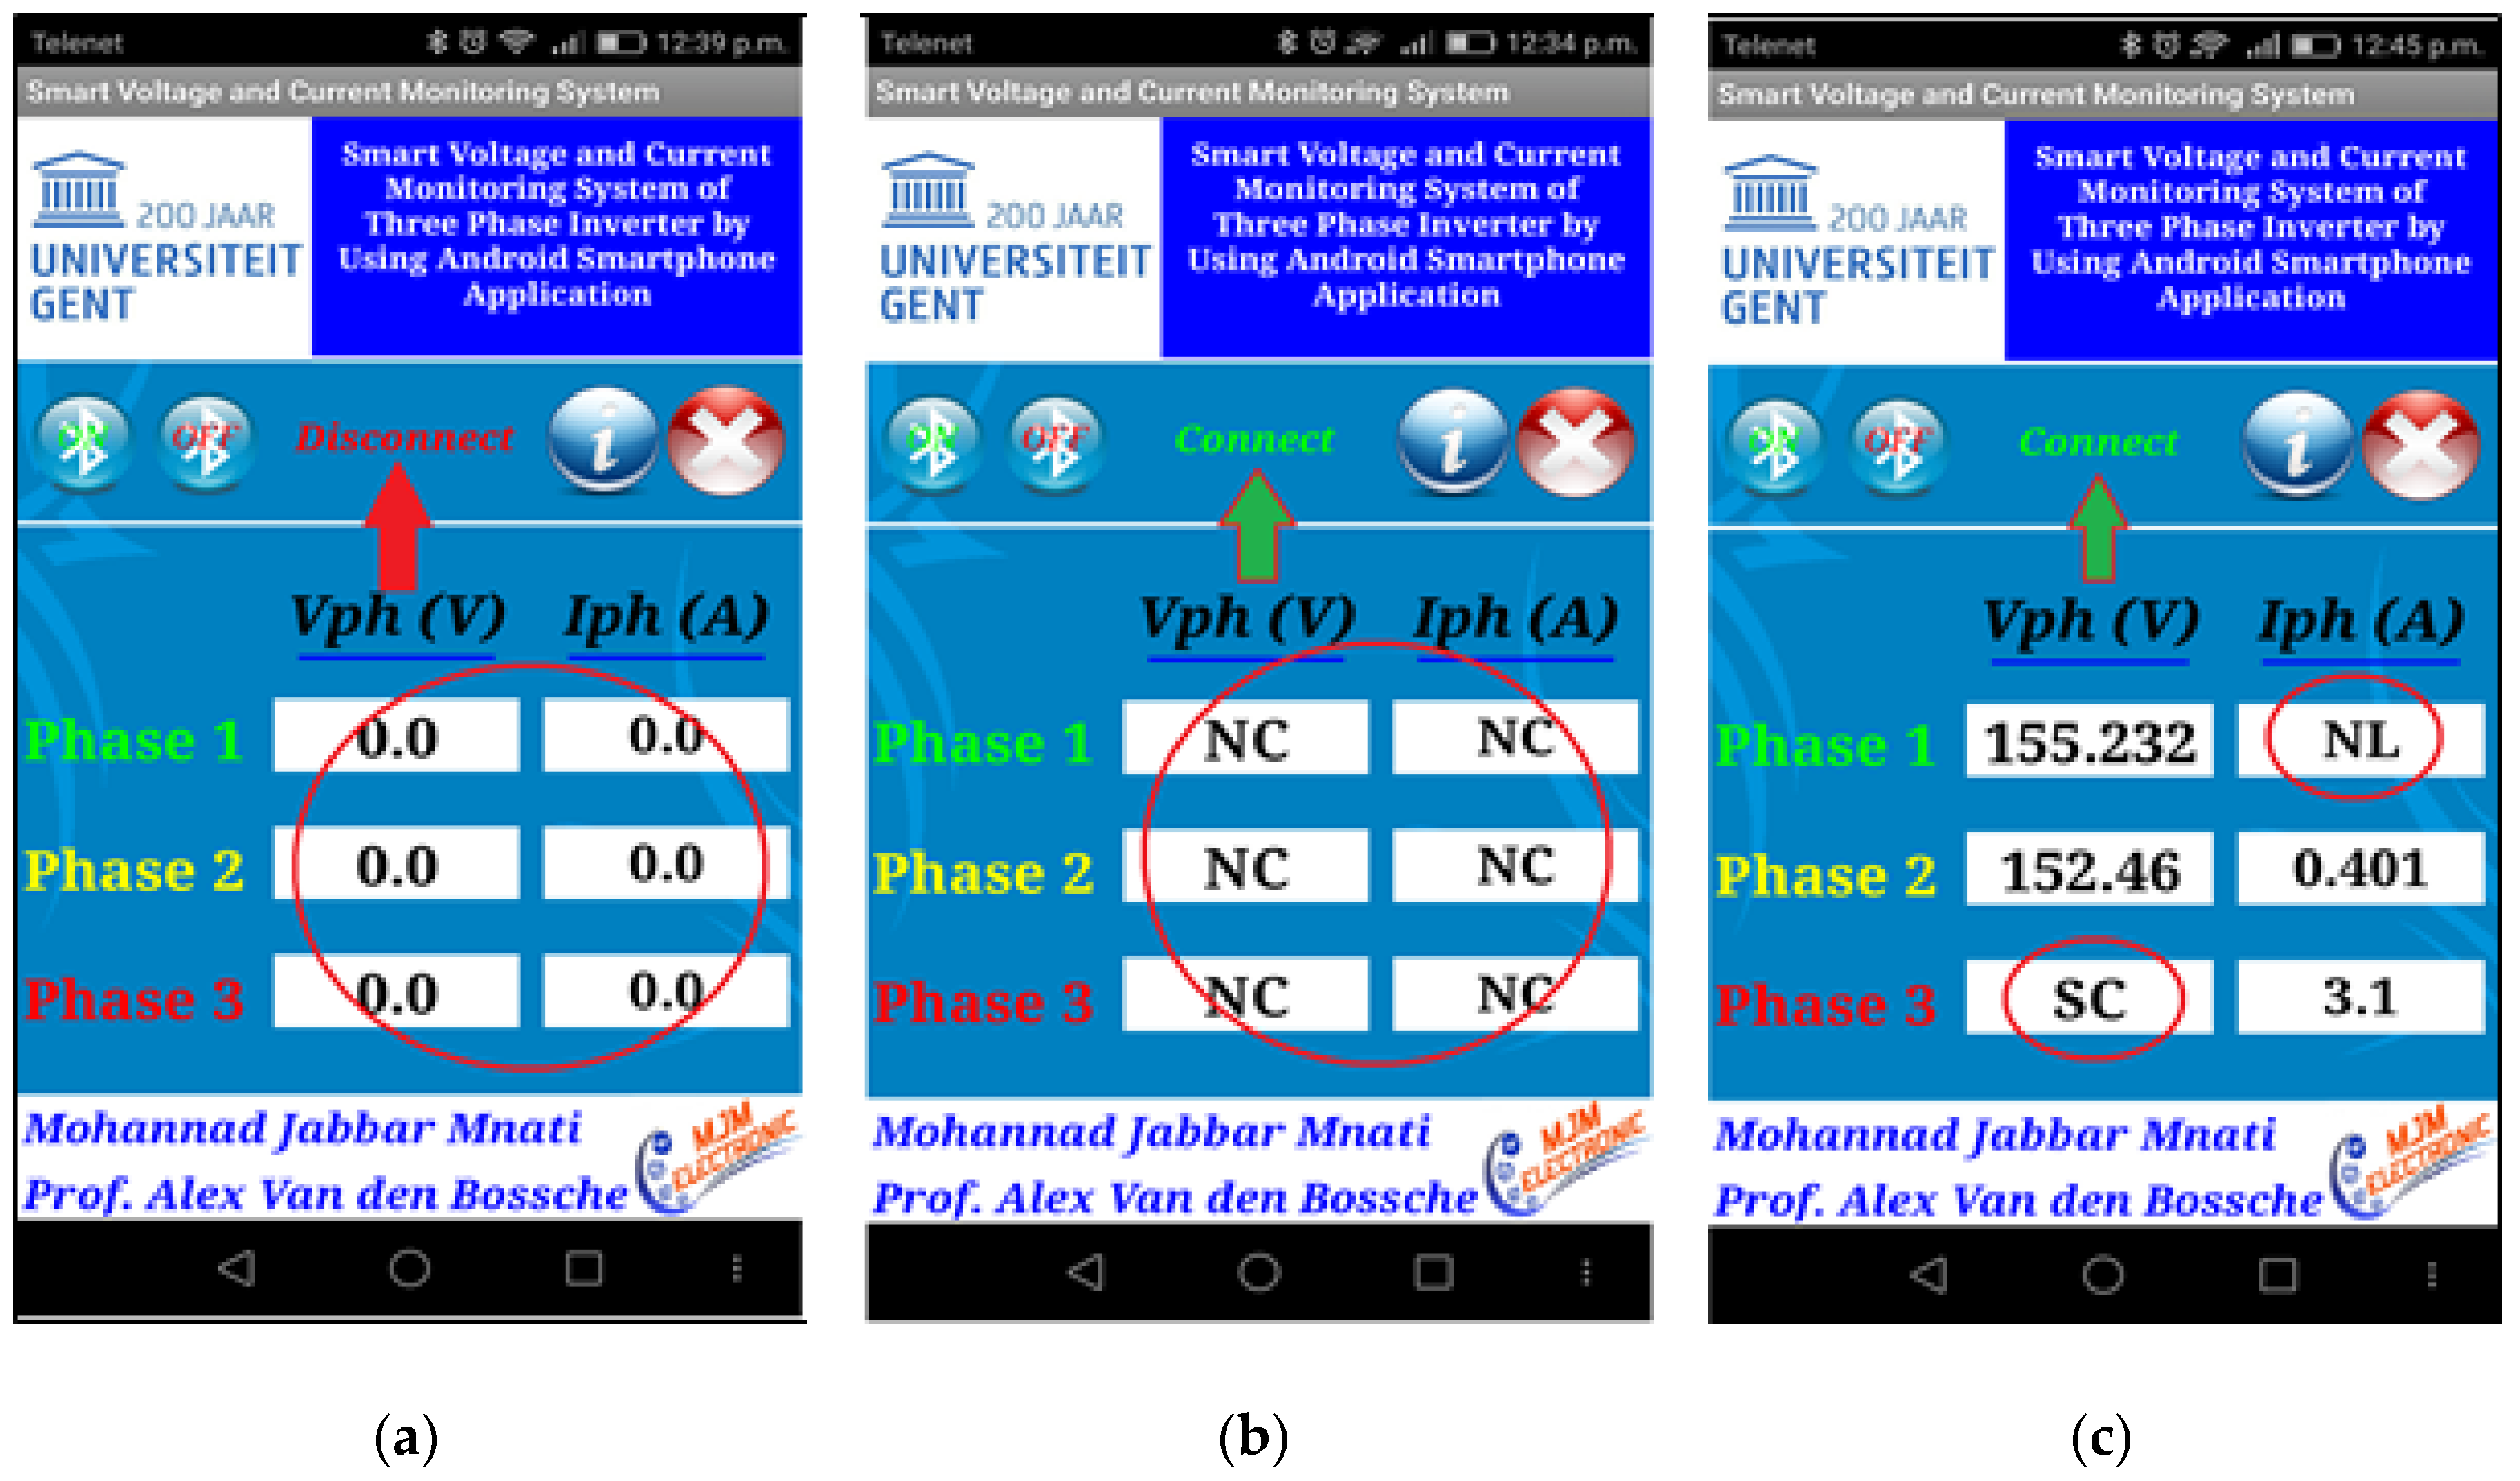
The Android smartphone application is the fifth unit connected to the control system by Bluetooth. The android application of SVCMS is shown in
Figure 14.
Figure 14a shows the SVCMS Android application before it connects the Bluetooth to the control system (the status is “disconnect”) while
Figure 14b explains the condition of the Bluetooth device after connecting (the status is “connect”) but no result appears in the main screen as the control system is not working (which means that there is no signal for all six sensors).
Figure 14c presents all states of monitoring according to the flowchart application in
Figure 12b.
Figure 14 explains the different cases of the connection and cases of phases. In
Figure 15a the six sensor reading is zero, that means the sensor is not working because the Bluetooth device was in the off state. In
Figure 15b the Bluetooth is working but the device and sensors are not connected and without receiving signals, while in
Figure 15c the program is working and reading different data received from the sensors with special cases of voltage and current like “SC” and “NL”.
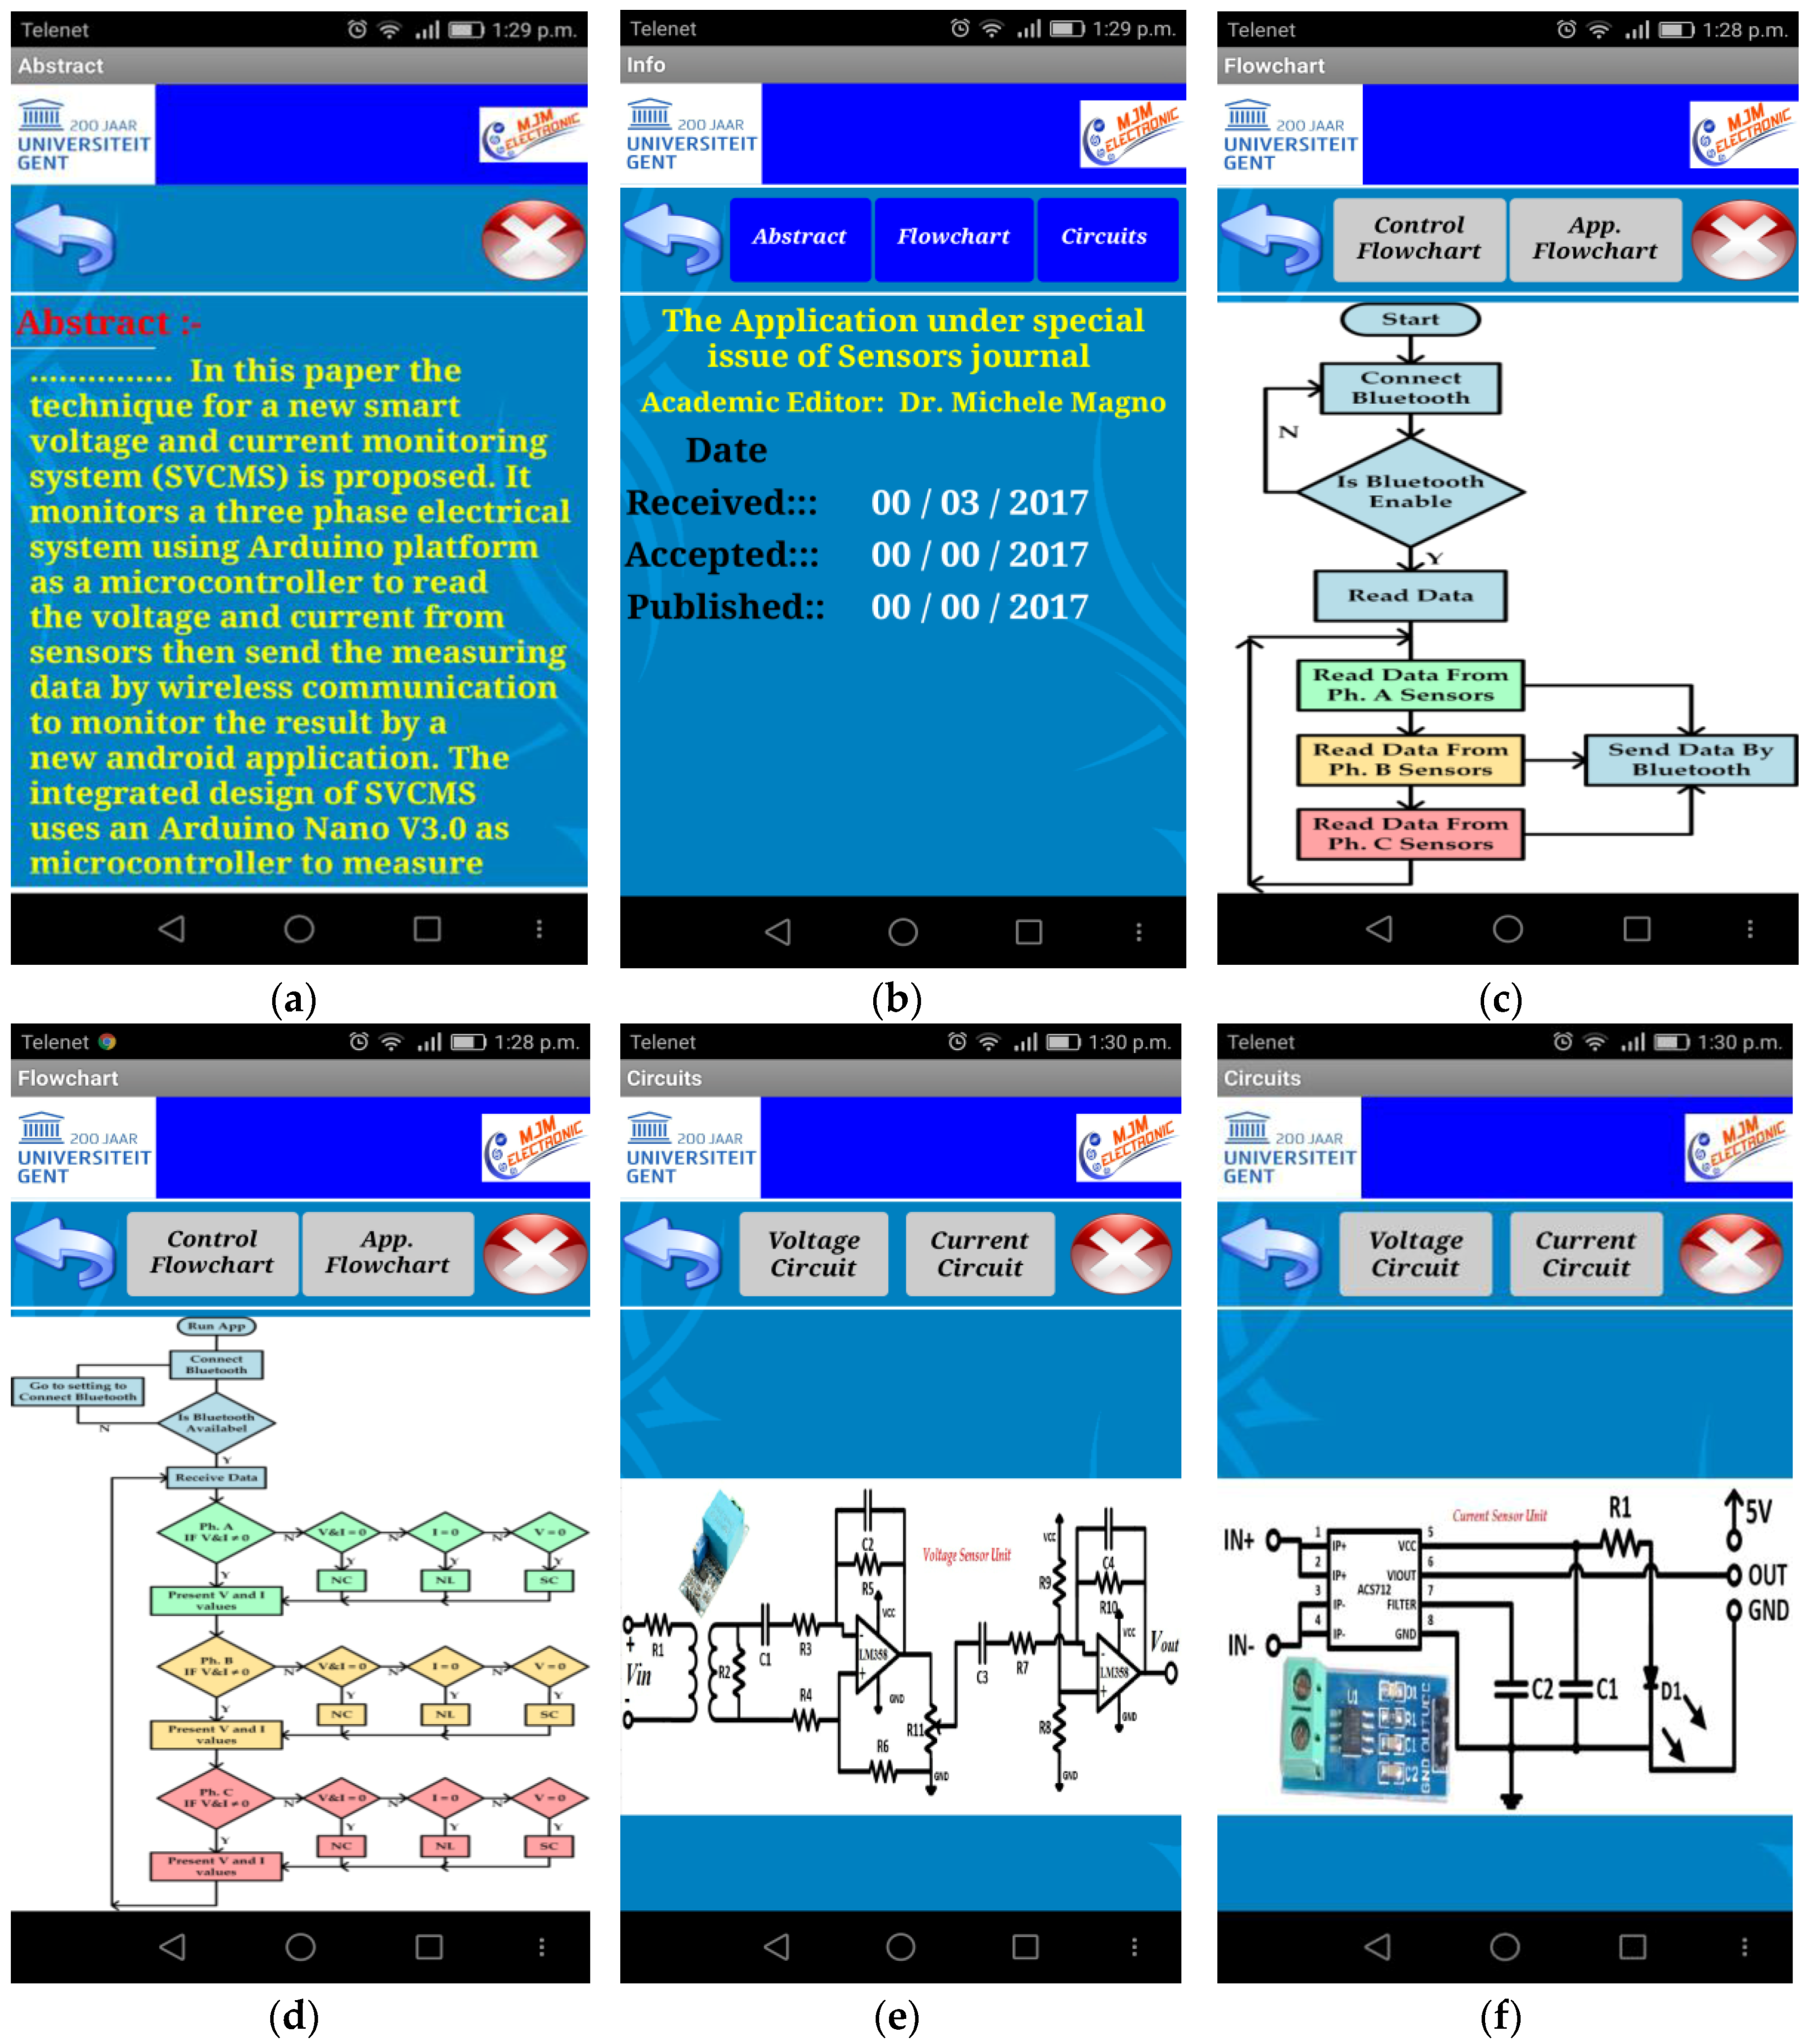
Figure 15 shows more screens that are programmed to explain how this system (hardware and software) works.
Figure 15a shows the abstract that is written in this paper and gives a brief idea about this system for controlling and monitoring the three phases and how to it can display the results while
Figure 15b shows the name of the journal where it was submitted and extra information such as the specific dates like received, accepted, and published dates.
Figure 15c explains the control flow chart for the SVCMS control system and how it works while
Figure 15d shows the second type of flow chart, which is the application flow chart, which works on smartphones and how it can display the results. Then
Figure 15e explains the first types of sensors, which are the voltage sensors, and shows the circuit diagram of this sensor. Finally,
Figure 15f shows the circuit diagram of the second sensor, the current sensor, and explains the components of this sensor.


